

Summary
Nicotinamide adenine dinucleotide (NAD), a cofactor for hundreds of metabolic reactions in all cell types, plays an essential role in metabolism, DNA repair, and aging. However, how NAD metabolism is impacted by the environment remains unclear. Here, we report an unexpected trans-kingdom cooperation between bacteria and mammalian cells wherein bacteria contribute to host NAD biosynthesis. Bacteria confer resistance to inhibitors of NAMPT, the rate limiting enzyme in the amidated NAD salvage pathway, in cancer cells and xenograft tumors. Mechanistically, a microbial nicotinamidase (PncA) that converts nicotinamide to nicotinic acid, a precursor in the alternative deamidated NAD salvage pathway, is necessary and sufficient for this protective effect. Using stable isotope tracing and microbiota-depleted mice, we demonstrate that this bacteria-mediated deamidation contributes substantially to the NAD-boosting effect of oral nicotinamide and nicotinamide riboside supplementation in several tissues. Collectively, our findings reveal an important role of bacteria-enabled deamidated pathway in host NAD metabolism.
Keywords: host-microbe interaction, deamidated NAD synthesis, NAMPT inhibitors, microbial nicotinamidase, oral nicotinamide riboside supplementation
eToc Blurb
Shats et al describe an unexpected trans-kingdom interaction between bacteria and mammals, wherein bacteria contribute to mammalian host NAD biosynthesis through a microbial nicotinamidase (PncA). This bacteria/gut microbiota-mediated facilitation of the deamidated NAD biosynthesis is important for the efficacy of commercial oral NAD-boosting supplements in mice.
Graphical Abstract
Introduction
Nicotinamide adenine dinucleotide (NAD) is an essential cofactor in hundreds of redox reactions (Xiao et al., 2018). It is also consumed by DNA repair enzymes mono and poly-(adenosine diphosphate–ribose) polymerases, protein deacylases sirtuins, and cellular surface cyclic ADP ribose hydrolase CD38 to regulate many fundamental cellular processes, including energy metabolism, genome stability, immune responses, and circadian rhythms (Cantó et al., 2015). Mammalian cells are capable of synthesizing NAD from tryptophan (de novo pathway), from nicotinic acid (NA, Preiss-Handler deamidated salvage pathway), or from the ribosylated intermediates nicotinamide riboside (NR), nicotinic acid riboside (NAR), the reduced form of NR (NRH), and nicotinamide mononucleotide (NMN) (Bogan and Brenner, 2008; Grozio et al., 2019; Yang et al., 2019). However, the amidated salvage, whereby nicotinamide (NAM) released by NAD-consuming enzymes and/or transported from culture medium is efficaciously converted to NAD by a short pathway with nicotinamide phosphoribosyl transferase (NAMPT) as the rate limiting enzyme, is recognized as the main source of NAD in most mammalian cells and tissues (Revollo et al., 2004) (Figure 1A). Cellular levels of NAD are therefore tightly balanced by consumption and biosynthesis, and disruption of this homeostasis is associated with decreased cellular NAD levels in aging (Fang et al., 2017; Imai and Guarente, 2014). Consequently, various therapeutic strategies aimed to boost NAD levels are being actively investigated, including supplementation with NAD precursors such as NAM, NR and NMN, activation of NAMPT, or inhibition of CD38 (Das et al., 2018; Gardell et al., 2019; Grozio et al., 2019; Martens et al., 2018; Pajk et al., 2017; Tarrago et al., 2018; Trammell et al., 2016; Uddin et al., 2017; Yoshino et al., 2018). Conversely, elevated flux through the NAD synthesis-breakdown cycle is required to sustain the increased metabolic and DNA repair rates of cancer cells, and inhibitors for the amidated or the deamidated NAD biosynthesis pathways are under development as antineoplastic therapeutics (Chowdhry et al., 2019; Espindola-Netto et al., 2017; Hong et al., 2018; Roulston and Shore, 2016).
Figure 1. Mycoplasma infection confers human cells with resistance to NAMPT inhibitors.

(A) NAD biosynthesis pathway. NAR: nicotinic acid riboside; NAMN: nicotinic acid mononucleotide; NAAD: nicotinic acid adenine dinucleotide; NMN: nicotinamide mononucleotide; NR: nicotinamide riboside; NADS: NAD Synthetase; NAPRT: Nicotinic Acid Phosphorybosyltransferase; NMNAT: Nicotinamide Mononucleotide Adenylyltransferase.
(B) Drug screen in H1299 cells. WT and E2F1 KO H1299 cells were treated with 1 μM compounds from the bioactive compound library and viability was measured 48 hours later by CellTiter-Glo assay. E2F1 KO cells were subsequently found to be infected with mycoplasma.
(C) Mycoplasma infection confers resistance to NAMPT and proteasome inhibitors but sensitizes to fludarabine. CRC119 cells incubated with a supernatant from a mycoplasma-infected culture or a control medium, and treated with 100 nM STF118804, 1 μM STF31, 50 nM MLN2238 or 1μM fludarabine or control for 68 hours. Cell viability was measured by CellTiter-Glo assay (n=3, values are normalized to the corresponding DMSO controls and expressed as mean ±SD, *p<0.05).
(D) Mycoplasma hyorhinis confers mammalian cells with resistance to STF118804. CRC119 cells or CRC119-Hyor cells chronically infected with Mycoplasma hyorhinis were seeded in 12-well plates. Next day, cells were treated with 100 nM STF-118804. Seventy-two hours later cells were washed and adherent cells were stained with crystal violet.
(E) Elimination of mycoplasma sensitizes cells to NAMPTi-induced toxicity. Clean and mycoplasma-infected CRC119 cells were treated with 1 μg/ml doxycycline 25 μg/ml plasmocin, 400 μg/ml gentamicin or with medium control for 24 hours, then co-treated with antibiotics and 100 nM STF118804 or DMSO control for an additional 48 hours. Cell viability was measured by CellTiter-Glo assay (n=3, values are normalized to the corresponding DMSO controls and expressed as mean ±SD, *p<0.05).
(F) Mycoplasma infection of tumors attenuates the transcriptional response to STF118804 treatment. Clean (no bacteria) or M. hyorhinis-infected (Mycoplasma) HCT116 cells were xenografted into nude mice, then mice were treated with 15 mg/Kg STF118804 or vehicle control as described in STAR Methods. Tumor transcriptomes were profiled by RNA-seq. Heatmap represents the relative expression levels of 4183 genes differentially expressed between vehicle-and STF188804-treated clean tumors following hierarchical clustering of the genes (n=4, cut-offs: mean expression>20, two-fold change and p<0.05).
(G-I) Mycoplasma infected tumors are resistant to STF118804-induced inhibition of proliferation. Clean (no bacteria) or M. hyorhinis-infected (Myco) HCT116 cells were xenografted into nude mice. Eighteen days later, mice were treated with 30 mg/Kg STF118804 or vehicle control twice daily for nine days. Xenograft tumors were stained for a cell proliferation marker, Ki67 (G) and percentage of Ki67-positive area in each tumor section was calculated (H) (n=6–7, values are expressed as mean ±SEM). (I) Tumor weights (n=13–16, values are expressed as mean ±SEM,n. s., not significant). Bars in (G), 1 mm. See also Figures S1 and S2.
Cellular NAD homeostasis buffers the constant environmental perturbations that affect NAD levels. Whereas various cell-autonomous regulatory mechanisms have been described (Cantó et al., 2015), the impact of microorganisms on mammalian NAD homeostasis remains largely unknown. In the present study, we report a serendipitously discovered mechanism by which mammalian host NAD metabolism is maintained through a host-microbe metabolic interaction. This symbiotic metabolic interaction enhances NAD biosynthesis in host mammalian cells by engaging the deamidated route of NAD synthesis, directly contributing to the host resistance to NAMPT inhibitors and enhancing the NAD-boosting effect of NAM and NR in vitro and in vivo.
Results
Mycoplasma confer host resistance to NAMPT inhibitors
We conducted a chemical screen to identify pharmacologic compounds that induce cell death through E2F1, a transcription factor that dose-dependently determines cell fate (Shats et al., 2017). As shown in Figure 1B, in a screen of 2300 bioactive compounds, the top hits that killed wild-type (WT) cells more efficiently than E2F1 knockout (KO) H1299 lung cancer cells were two NAMPT inhibitors, STF31 and STF118804. E2F1 KO cells were also protected from toxicity induced by proteasome inhibitors, MLN-2238 and its pro-drug MLN-9708, but were more sensitive to fludarabine and fludarabine phosphate (Figure 1B and Table S1).
Subsequently, we found that E2F1 KO cells, but not the WT cells, were contaminated with Mycoplasma hyorhinis, and the differential responses of WT and E2F1 KO cells to all top hits from our screen were due to mycoplasma contamination rather than E2F1 deficiency (Figures 1C, S1A, and S1B). Particularly, in mycoplasma-free CRC119 colon cancer cells, mycoplasma-containing supernatant from an infected culture was sufficient to completely prevent toxicity induced by the two NAMPT inhibitors, STF118804 and STF31, and by the proteasome inhibitor MLN-2238 (Figure 1C). Further titration experiments demonstrated that the significant resistance to STF118804 could be conferred by a mycoplasma titer that is 80-fold lower than that causing mild cell growth inhibition (Figure S1C). Mycoplasma also sensitized the CRC119 cells to fludarabine (Figure 1C), likely due to the ability of mycoplasma-encoded purine nucleoside phosphorylases to convert fludarabine (a pro-drug) to a highly toxic purine base (Vande Voorde et al., 2013). Chronic infection with M. hyorhinis purchased from ATCC also protected CRC119 cells from STF118804-induced cell death (Figure 1D) and conferred resistance to three different NAMPT inhibitors (NAMPTi) in two additional cell lines (Figure S1D). Conversely, treatment with structurally diverse antibiotics that eliminate M. hyorhinis completely reversed this resistance (Figure 1E), further confirming that mycoplasma protects host mammalian cells from NAMPTi-induced cell death. Our drug screen was highly specific and revealed very few strong hits with NAMPT inhibitors being the top hits, strongly suggesting that NAD metabolism is one of the main cellular pathways affected by mycoplasma infection.
Mycoplasma are common cell culture contaminants and clinically important components of the human commensal and pathogenic microbiome in various tissues (Baumann et al., 2018; Chu et al., 2019; Lanao and Pearson-Shaver, 2019; Razin et al., 1998; Sanchez-Garcia et al., 2019). Mycoplasma presence has also been reported in various cancer types, however, its functional importance remains unclear (Barykova et al., 2011; Rogers, 2011). Our observation that mycoplasma confer resistance to NAMPTi in cultured mammalian cells suggests that mycoplasma presence may affect the sensitivity of tumors to NAMPT inhibitors, a promising novel class of antineoplastic agents in clinical development (Espindola-Netto et al., 2017; Roulston and Shore, 2016; Yaku et al., 2018a). To test this possibility in vivo, we injected clean (no bacteria) or M. hyorhinis-infected (Mycoplasma or Myco) HCT116 cells subcutaneously into nude mice. When the largest tumor reached 200 mm3, we treated the mice by twice daily subcutaneous injections of 15 mg/Kg STF118804 for two weeks or 30 mg/Kg for nine days. At the transcriptional level, STF118804 treatment significantly (two-fold change, p<0.05) altered the expression levels of 4183 genes in clean xenograft tumors, but M. hyorhinis infection almost completely abolished this transcriptional response (Figure 1F). GSEA analysis of genes upregulated by STF118804 in the clean xenograft tumors identified enrichment of diverse functional categories including extracellular matrix proteins, cell adhesion, GPCR signaling, neuronal biology and hemostasis (Table S2). The top enriched functional categories among the downregulated genes, on the other hand, included cell cycle, DNA, RNA and protein metabolism (Table S2), suggesting that STF118804 treatment induces a cell cycle arrest response in the clean tumors. RT-PCR analysis confirmed that M. hyorhinis-infected tumors were protected against STF118804-induced repression of several proliferation genes, including Cyclin A2 (CCNA2) and E2F1 (Figure S2A). Immunohistochemical analysis further indicated that STF118804 treatments at both 15 mg/Kg and 30 mg/Kg doses reduced the levels of a proliferation marker Ki67 in clean tumors, but this reduction was significantly attenuated by M. hyorhinis infection (Figures S2B, 1G, and 1H). Accordingly, while STF118804 treatment significantly reduced the weights of clean tumors, M. hyorhinis-infected tumors were resistant to this treatment (Figure 1I). Taken together, our observations demonstrate that mycoplasma infection confers host resistance to NAMPT inhibitors in vitro and in vivo.
Mycoplasma prevent NAMPTi-induced NAD and energy depletion by providing deamidated NAD precursors to host cells
We next sought to elucidate the mechanism underlying mycoplasma-mediated protection from NAMPTi-induced toxicity. We assessed the effects of STF118804 treatment over time and found that mycoplasma attenuated NAD depletion and completely restored ATP levels in CRC119 cells (Figure 2A). Bioenergetic profiling demonstrated that this mycoplasma-provided protective effect was accompanied by a rescue of cellular glycolysis (extracellular acidification rate, ECAR) and oxygen consumption (oxygen consumption rate, OCR) in STF118804-treated cells (Figure 2B), suggesting that mycoplasma restore the cellular NAD pool and oxidative phosphorylation. In particular, mycoplasma rescued the STF1188804-induced reduction of NAD in isolated mitochondria (Figure 2C) and rescued STF118804-induced loss of mitochondrial membrane potential (Figure 2D). Treatment with STF118804 also significantly reduced tumor NAD content in xenografted HCT116 tumors, but again mycoplasma-infected tumors were partially protected against this STF118804-induced NAD depletion (Figure S2C). Therefore, mycoplasma infection prevents NAMPTi-induced energy depletion and subsequent cell toxicity by partially rescuing cellular NAD levels both in vitro and in vivo.
Figure 2. Mycoplasma infection confers host cells resistance to NAMPT inhibitors by preventing NAD depletion.

(A) Mycoplasma prevent NAMPTi-induced NAD and ATP depletion. Total cellular NAD (NADH + NAD+) and ATP levels were measured in uninfected (no bacteria) or mycoplasma-infected CRC119 cells treated with 100 nM STF118804 (STF) (n=3, values are normalized to the corresponding time zero controls and expressed as mean ±SD, *p<0.05).
(B) Mycoplasma prevent NAMPTi-induced inhibition of glycolysis (ECAR) and oxidative phosphorylation (OCR). Uninfected clean or mycoplasma-infected CRC119 cells were treated with 100 nM STF118804 (STF) for 48 hours. The basal extracellular acidification rate (ECAR) and oxygen consumption rate (OCR) were measured using Seahorse instrument (n=7–8, values are expressed as mean ±SD, *p<0.05).
(C) Mycoplasma prevent NAMPTi-induced mitochondrial NAD depletion. Relative levels of mitochondrial total NAD were measured after 24 hours treatment with 100 nM STF118804 (STF) or DMSO control (n=3, values are normalized to the uninfected DMSO control and expressed as mean ±SD, *p<0.05).
(D) Mycoplasma prevent NAMPTi-induced loss of mitochondrial membrane potential. Mitochondrial membrane potential loss (% TMRE-negative cells) was measured by flow cytometry after 24 hours treatment with 100 nM STF118804 (STF) or DMSO control. (n=3, values are expressed as mean ±SD, *p<0.05).
See also Figure S2C.
M. hyorhinis infection did not significantly affect the mRNA levels of all tested key NAD producing and consuming enzymes in CRC119 cells (Figure S3A). To further uncover the molecular basis of the observed protective effect of mycoplasma on cellular NAD metabolism, we performed metabolomic analyses of uninfected or M. hyorhinis-infected CRC119 cells treated with STF118804 or DMSO vehicle control (Table S3). Principal component analysis (PCA) revealed that STF118804 induced extensive metabolic alterations in clean human cells but mycoplasma infection prevented these global changes (Figure S3B). Remarkably, the top metabolites whose levels were increased by mycoplasma were two key intermediate metabolites in the deamidated NAD biosynthesis pathway, nicotinic acid riboside (NAR) and nicotinic acid adenine dinucleotide (NAAD) (Figures 3A and 3B). Furthermore, culture medium from mycoplasma-infected cells contained more than 5-fold higher levels of NA and more than 8-fold higher levels of NAR compared to medium from uninfected clean cells (Figures 3B and S3C), supporting the idea that the increased intracellular levels of NAR and NAAD were originated from the increased extracellular NA or NAR. Notably, intracellular STF118804 levels were not affected by mycoplasma (Figure S3D), indicating that mycoplasma neither degrade STF118804, unlike the reported mechanism of direct drug degradation by bacteria in the case of gemcitabine (Geller et al., 2017), nor inhibit the cellular uptake of this compound.
Figure 3. Mycoplasma induce deamidated NAD precursors and prevent NAMPTi-induced NAD and energy depletion.

(A) Mycoplasma increase cellular levels of deamidated NAD precursors. Clean (no bacteria) or M. hyorhinis-infected (myco) CRC119 cells were treated with either 100 nM STF118804 or with DMSO control for 24 hours and relative levels of 330 metabolites were determined by LC-MS. Volcano plot of metabolites from mycoplasma-infected cells (Myco_DMSO) vs. uninfected cells (no bacteria_DMSO).
(B) Mycoplasma increase deamidated NAD precursors inside the cells and in the medium upon STF118804 treatment. The log ratios of the relative abundance of metabolites in clean and infected cells are represented by color scale. Metabolites in parenthesis were not detected in our LC-MS analysis.
(C) Relative levels of NAD+ and the top differential metabolites (NAAD and NAR) (n=3, values are normalized to the uninfected DMSO control and expressed as mean ±SD, *p<0.05).
(D) Mycoplasma prevent NAMPTi-induced inhibition of energy metabolism. Relative changes in the levels of glycolysis and TCA cycle metabolites following STF18804 treatment are shown for uninfected (left panel) and mycoplasma-infected cells (right panel). The log ratios of the relative abundance of metabolites in indicated pathways in clean and infected cells are represented by color scale. Metabolites in parenthesis were not detected in our LC-MS analysis (n=3, values are expressed as mean ±SD). See also Table S3 for the complete metabolomics data. See also Figure S3.
Further analyses unveiled that the mycoplasma-induced increase in the Preiss-Handler deamidated NAD biosynthesis pathway was associated with significant rescue of cellular NAD levels after STF118804 treatment (Figures 3B and 3C). In particular, STF118804 treatment resulted in a 99.6% drop of cellular NAD levels in clean cells within 24 hours, compared with an 88% drop in mycoplasma-infected cells (Figure 3C, NAD). We hypothesized that this mycoplasma-mediated partial rescue of cellular levels of NAD (from 0.4% to 12%) is sufficient to sustain the cellular energy metabolism upon treatment with NAMPTi. Consistent with this notion, pathway analysis of differential metabolites in mycoplasma-infected vs. clean STF118804-treated cells identified the TCA cycle as the most significant metabolic pathway rescued by mycoplasma (Figure S3E). In addition, in agreement with previous studies (Chini et al., 2014; Tan et al., 2013), STF118804 treatment resulted in a complete block of glycolysis at the NAD-dependent GAPDH step in uninfected cells (Figure 3D, left). Importantly, STF118804-induced block of glycolysis was rescued and the changes in the TCA cycle were attenuated in mycoplasma-infected cells (Figure 3D, right). Together, our results indicate that mycoplasma primarily affect NAD-dependent energy metabolism in host cells by engaging the Preiss-Handler deamidated NAD biosynthesis pathway.
Bacteria rescue NAMPTi-induced toxicity through nicotinamidase PncA
The deamidated NAD salvage pathway (via NA) is an evolutionarily ancient pathway that exists in all kingdoms of life (Gazzaniga et al., 2009). In the majority of lower organisms, this is the only pathway to recycle NAM produced by NAD consuming enzymes. Vertebrates evolved a shorter amidated NAD salvage pathway (via NAMPT), but lost the ability to recycle NAM through the deamidated salvage pathway due to lack of a nicotinamidase activity that converts NAM to NA (Figure 1A). In contrast, multiple bacteria species were reported to encode nicotinamidase PncA (Gazzaniga et al., 2009) and our own analysis identified 2088 homologs of PncA protein encoded by variable proportions of bacterial species from different phyla (Figures S4A, S4B and Table S4). Given the highly increased levels of the deamidated NAD precursors (NA, NAR, and NAAD) in mycoplasma-infected medium and cells (Figures S3C, 3B and 3C), we hypothesized that protection from NAMPTi by mycoplasma (and possibly other bacteria) may be mediated by bacterial nicotinamidase PncA, which can bypass the NAMPT block by diverting NAM to the deamidated route of NAD biosynthesis. In support of this hypothesis, we found that E. coli, like mycoplasma, protected CRC119 cells from toxicity of two different NAMPT inhibitors, STF118804 and FK866 (Figure 4A). This protection was also accompanied by partial rescue of STF118804-induced NAD depletion in both the cytosol and mitochondria (Figure S4C) and restoration of both glycolysis and oxidative phosphorylation (Figure S4D). Importantly, deletion of the E. coli pncA gene completely abolished this rescue effect (Figure 4B). Rescue of viability of NAMPTi-treated cells could also be achieved by addition of conditioned medium (CM) from WT E. coli incubated with NAM but not by CM from WT E. coli incubated without NAM (Figure 4C). We detected robust conversion of NAM to NA by E. coli in the medium by LC-MS (Figure S4E). Direct supplementation of NA, the product of the PncA enzyme, into culture medium also rescued clean cells from STF118804 toxicity (Figure 4D). Furthermore, overexpression of E. coli PncA in CRC119 cells was sufficient to completely rescue them from STF118804-induced death (Figures S4F and 4E). In contrast, blocking the deamidated NAD biosynthesis, either by a NAPRT inhibitor 2-hydroxynicotinic acid (HNA) (Figure 4F) or by two different siRNAs against NAPRT (Figures S4G, S4H, 4G, and 4H), abolished the protection from NAMPTi mediated by both E. coli and M. hyorhinis. Finally, supplementation of bacteria-containing culture medium with isotopically labeled NAM (Nicotinamide-2,4,5,6-d4, D4 NAM) resulted in a robust incorporation of the label into intracellular NA, NAR, NAMN, NAAD and NAD, even when NAMPT was inhibited by STF118804 (Figures 4I and 4J, m+4/m+3; the m+3 labeling is the result of rapid turnover of the redox-active hydrogen (Liu et al., 2018)), demonstrating that E. coli are capable of converting NAM to NA and promoting the deamidated route of NAD biosynthesis in host cells.
Figure 4. Bacteria rescue NAMPTi-induced toxicity through nicotinamidase PncA.

(A) E. coli protect cells from NAMPTi-induced toxicity. CRC119 cells were cultured with or without E. coli in the presence of 1 μg/ml gentamycin to prevent bacterial overgrowth. Cells were treated with 100 nM STF118804, 50 nM FK866, or with DMSO control for 42 hours (n=3, values are normalized to the corresponding DMSO controls and expressed as mean ±SD, *p<0.05).
(B) E. coli protect cells from NAMPTi-induced toxicity through PncA. CRC119 cells were treated with 100 nM STF118804 or DMSO control for 24 hours, then treated with control medium, live WT E. coli, or pncA KO E. coli for additional 21 hours in the presence of 1 μg/ml gentamycin to prevent bacterial outgrowth (n=3, values are normalized to the uninfected DMSO control and expressed as mean ±SD, *p<0.05).
(C) E. coli-provided protection from NAMPTi require NAM. E. coli were incubated in EBSS medium with or without nicotinamide (NAM) for 3 hours, then removed by filtering through 0.2 μm filter. The conditioned media (CM) were added for an additional 21 hours to CRC119 cells that were pre-treated for 24 hours with 100 nM STF118804 (n=3, values are normalized to the DMSO control and expressed as mean ±SD, *p<0.05).
(D) NA protects cells from NAMPTi-induced toxicity. CRC119 cells were treated with 100 nM STF118804 with or without 100 μM nicotinic acid (NA) for 48 hours (n=3, values are normalized to the DMSO control and expressed as mean ±SD, *p<0.05).
(E) Overexpression of PncA protects cells from NAMPTi-induced toxicity. CRC119 transfected with a control vector or a construct expressing E. coli pncA were treated with 100 nM STF118804 (STF) or DMSO control for 72 hours (n=3, values are normalized to the Vector DMSO control and expressed as mean ±SD, *p<0.05).
(F-H) Blocking the deamidated NAD biosynthesis abolishes bacteria-provided protection from NAMPTi.
(F) CRC119 cells (no bacteria, E.coli) or CRC119-Hyor cells chronically infected with Mycoplasma hyorhinis were treated with 100 nM STF118804, 1 mM of HNA or their combination for 66 hours. Control or E. coli-containing media were added to CRC119 cells during the last 24 hours of drug exposure. (n=3, values are normalized to the corresponding DMSO controls and expressed as mean ±SD, *p<0.05).
(G) CRC119 cells or CRC119-Hyor cells chronically infected with Mycoplasma hyorhinis were transfected with control siRNA (siControl) or two independent siRNAs against NAPRT (siNAPRT #1 and siNAPRT #2) and treated with 100 nM STF118804 or DMSO control for 48 hours. (n=3, values are normalized to the corresponding DMSO controls and expressed as mean ±SD, *p<0.05).
(H) CRC119 cells were transfected with control siRNA (siControl) or two independent siRNAs against NAPRT (siNAPRT #1 and siNAPRT #2) and treated with 100 nM STF118804 or DMSO control for 48 hours. Control or E. coli-containing media were added during the last 24 hours of drug exposure. (n=3, values are normalized to the uninfected siControl DMSO control and expressed as mean ±SD, *p<0.05). Relative cell numbers in panels (A)-(H) were measured by CellTiter-Glo assay.
(I) Bacteria augment incorporation of NAM into metabolites in the deamidated NAD salvage pathway and NAD. CRC119 cells were infected with E. coli and treated with 100 nM STF118804 or DMSO control for 24 hours in the presence of 5 mg/l NAM labeled with four deuterium atoms (D4 NAM) on the pyridine ring. The absolute concentration of the indicated unlabeled (m+0) and labeled metabolites (m+3/m+4) was measured by LC-MS as described in STAR Methods (n=3, values are expressed as mean ±SD, *p<0.05).
(J) The flux of labeled metabolites through the NAD pathways in the different conditions is shown in blue based on the data in (I). The font size of each metabolite is roughly proportional to its concentration.
See also Figure S4.
Notably, the absolute concentration of cellular NAAD in E. coli-infected cultures reached 100 μM, comparable with the 230 μM concentration of NAD. Interestingly, the isotopic label on NAM was also incorporated into NMN in the presence of E. coli even when NAMPT was inhibited by STF118804, a likely result of NAD degradation by the reverse NMNAT reaction (Berger et al., 2005) or by the activity of bacterial Nudix hydrolases. Collectively, our results demonstrate that by engaging the deamidated NAD biosynthesis pathway, bacteria-encoded nicotinamidase activity is necessary and sufficient to protect mammalian host cells from NAMPTi-induced toxicity.
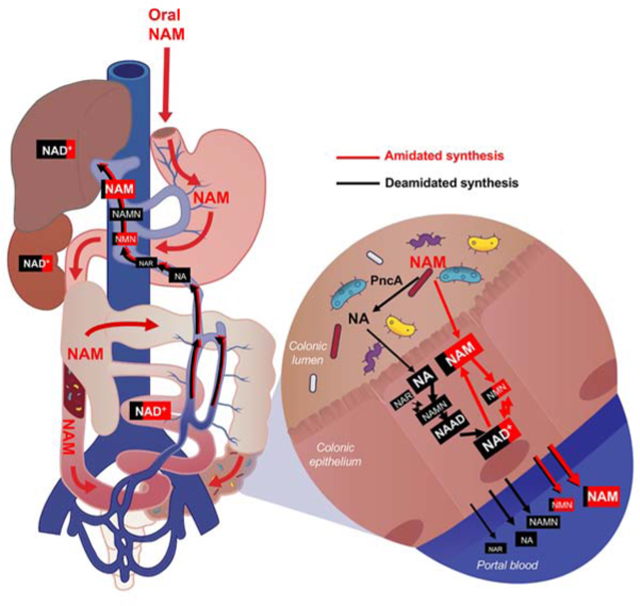
Microbial PncA is required to incorporate oral NAM supplement into NAD through deamidated NAD biosynthesis pathway in vivo
Given the essential role of NAD in energy metabolism, genome stability, immune responses, and aging (Cantó et al., 2015), NAD-boosting supplements have recently been actively investigating by the nutraceutical industry and have been shown to improve age-associated health decline in animal models. The most actively studied NAD precursors include NAM, NR, and NMN (Rajman et al., 2018). Since both NR and NMN do not require NAMPT, they are able to bypass the rate-limiting step of the amidated salvage pathway and enhance NAD biosynthesis even when the activity of NAMPT is reduced (i.e. due to decline of its expression levels in aging). Notably, our observation that NAM is incorporated into deamidated NAD precursors and eventually into NAD in cultured cells even when NAMPT was blocked (Figures 4I and 4J) suggested to us that orally taken NAM could also potentially bypass the NAMPT-mediated rate-limiting step by engaging gut microbiota-mediated conversion into NA and subsequent deamidated NAD biosynthesis in vivo.
To test this hypothesis, we gavaged D4 NAM into either microbiota-proficient regular mice (Reg) or antibiotic-treated microbiota-depleted mice (Abx) (Figures 5A and S5A) and analyzed the flux of labelled metabolites in the NAD biosynthesis pathways in different tissues/organs after three hours. As shown in Figure 5B, when gavaged into regular mice (Reg-NAM), isotopically labeled NAM was rapidly converted to NA in the colonic lumen, the major niche of gut microbiota. This conversion was completely abolished in antibiotic-treated mice (Abx-NAM), indicating that gut microbiota is required to convert NAM into NA. Oral NAM gavage also resulted in a massive elevation of NA and subsequent deamidated NAD precursors NAR and NAAD in the colonic epithelium, the first layer of host cells in direct contact with the gut microbiota (Figure 5C, Reg-NAM, Colon). Again, this elevation was completely blocked in antibiotic-treated mice (Figure 5C, Abx-NAM, Colon), supporting the notion that gut microbiota is mediating the activation of the deamidated route of NAD biosynthesis in host cells. Gut microbiota depletion also exerted a similar impact on NAD metabolism in the small intestinal epithelium after oral NAM gavage, but to a lesser degree compared to the colon (Figure 5C, Reg-NAM, Small Intestine). This observation is consistent with the fact that the small intestine contains much lower bacterial density than the colon (Donaldson et al., 2015). In the liver, the central metabolic organ that sorts/metabolizes/packs nutrients coming from the gut (both small intestine and colon) before passing them to the rest of the body, NAM supplementation led to a drastic increase in NAR and NAAD and a 2.5-fold increase in NAD (Figure 5C, Reg-NAM, Liver). This accumulation of NAR and NAAD was strongly attenuated and the NAD boosting effect was significantly reduced in the livers of antibiotic-treated mice (Figure 5C, Abx-NAM, Liver), indicating that the increase of hepatic deamidated precursors is dependent on gut microbiota, and that the direct flux from the deamidated pathway accounts for at least half of the total hepatic NAD pool upon NAM gavage. Since the liver produces 95% of the circulating NAM from hepatic NAD to impact NAD metabolism in other tissues (Liu et al., 2018), our results further indicate that microbiota may influence systemic NAD metabolism through boosting hepatic NAD biosynthesis.
Figure 5. Gut microbiota is critical to incorporate dietary NAM into metabolites in the deamidated NAD salvage pathway and NAD in vivo.

(A) Schematic of the experiment. C57BL/6J mice were treated with either regular water (Reg) or antibiotics-containing water (Abx) for 12 days to deplete gut microbiota. They were then gavaged with 80 mg/kg of D4 NAM or with PBS control, and dissected three hours later.
(B) Gut microbiota is required to convert NAM into NA in colonic lumen. Relative abundance of unlabeled (m+0) and labeled (m+3/m+4) NAM and NA in colonic luminal content of indicated mice were measured by LC-MS (n=5–6 mice/group, values are expressed as mean ±SEM, *p<0.05).
(C) Gut microbiota is important to incorporate dietary NAM into metabolites in the deamidated NAD salvage pathway and hepatic NAD in mice. Relative abundance of unlabeled (m+0) and labeled (m+3/m+4) NAD pathway metabolites in colons, small intestines, and livers were measured by LC-MS (n=5–6 mice/group, values are expressed as mean ±SEM, *p<0.05).
(D) Bacterial pncA is required to incorporate oral NAM into metabolites in the deamidated NAD salvage pathway in mice. Germ-free (GF) C57BL/6NTac mice repopulated with WT or pncA KO E. coli were orally gavaged with 80 mg/kg of D4 NAM and dissected three hours later. The relative abundance of unlabeled (m+0) and labeled (m+3 and m+4) NAD pathway metabolites in colon and liver were measured by LC-MS (n=3 mice/group, values are expressed as mean ±SEM, *p<0.05).
(E) Gut microbiota systemically boosts the flux of dietary NAM into NAD through the deamidated pathway in vivo. The log ratios of the relative abundance of indicated labeled metabolites are represented by a color scale based on data in (B) and (C). Metabolites in parenthesis were not analyzed in this LC-MS analysis (n=5–6 mice/group, values are expressed as mean ±SEM).
See also Figure S5A–S5C.
To directly assess the importance of microbial PncA in this gut microbiota-enabled deamidated NAD salvage, we repopulated germ-free (GF) mice with either WT or pncA KO E. coli before gavage of D4-labeled NAM (Figure S5B). As shown in Figures 5D and S5C, while repopulation with WT E. coli resulted in a markedly increased levels of deamidated NAD precursors (NA, NAR, NAAD) three hours after D4 NAM gavage, these metabolites were not detected in mice repopulated with pncA KO E. coli in the small intestine (Figure S5C), colon, and liver (Figure 5D), indicating that they are synthesized from NA produced by the E. coli PncA. Most importantly, levels of total and labeled tissue NAD three hours after NAM gavage were significantly higher in mice repopulated with WT E. coli than in mice repopulated with pncA KO E. coli in all tested tissues (Figures 5D and S5C). These observations underscore the importance of microbial PncA-catalyzed NAM to NA conversion in mediating the NAD boosting effect of amidated NAD precursor NAM in vivo. Together, these findings suggest a model in which gut bacteria deamidate dietary NAM to NA, which is then absorbed and converted to NAMN, NAR and NAAD in gut cells (Figure 5E). NAR is likely produced via dephosphorylation of NAMN by mammalian cytosolic 5’-nucleotidases (Kulikova et al., 2015). One or more of these deamidated precursors are further transported to the liver, where they significantly contribute to hepatic NAD biosynthesis (Figure 5E).
Oral NAM supplement is primarily incorporated into NAD through the deamidated NAD biosynthesis pathway in several tissues
To estimate the contribution of the deamidated NAD biosynthesis pathway in mediating the NAD boosting impact of dietary NAM, we compared the fractions of labelled NAD three hours after oral gavage of amide-15N NAM or D4 NAM in regular mice (Figure 6A). We reasoned that since amide-15N on amide-15N NAM only traces NAD synthesized through the amidated salvage pathway while D4-labeled pyridine ring in D4 NAM traces NAD synthesized from both amidated and deamidated pathways, the difference between these two labels in final tissue NAD should be the fraction synthesized from the deamidated pathway. Consistent with results in Figure 5C, gavage of D4 NAM led to more than 50% D3/D4 labeling of total NAD in both colon and liver (Figure 6A, m+3/m+4). However, only 14.9% of colonic NAD and 6.1% of hepatic NAD were labelled with amide-15N after gavage of amide-15N NAM (Figure 6A, m+1), demonstrating that dietary NAM is primarily incorporated into colonic and hepatic NAD through the deamidated NAD salvage pathway.
Figure 6. Oral NAM is incorporated into NAD primarily through gut microbiota-enabled deamidated NAD biosynthesis pathway in several mouse tissues.

(A) Dietary NAM is incorporated into colon and hepatic NAD primarily through the deamidated pathway in regular mice. Microbiota-proficient regular mice (Reg) were gavaged with control saline, 80 mg/Kg amide-15N labeled NAM (15N NAM), or 80 mg/Kg D4 NAM, then dissected three hours later. Relative abundance of unlabeled (m+0), and 15N labeled (m+1), or D4/D3 labeled (m+3/m+4) in colons and livers of indicated mice were measured by LC-MS (n=4 mice/group, values are expressed as mean ±SEM).
(B) Schematic of the [18O,15N,13C-amide]nicotinamide (18O,15N,13C-NAM) gavage experiment. The right panel shows the PncA-mediated reactions that lead to the indicated molecular weight changes.
(C) Oral NAM is incorporated into NAD primarily through the deamidated NAD salvage pathway in colon, liver, and kidney. Regular mice were gavaged with either saline or 80 mg/Kg 18O,15N,13C-NAM. The concentrations of unlabeled (m+0) and labeled NAD pathway metabolites synthesized via the deamidated (m+3 and m+1), and amidated (m+4) pathways in indicated tissues were measured by LC-MS 3 hours after gavage (n=3–4 mice/group, values are expressed as mean ±SEM).
(D) NAMN is the major deamidated NAM precursor in the portal blood. Concentrations of the indicated NAD pathway metabolites in blood collected from the portal vein in the experiment described in (B), (C) (n=3 mice/group, values are expressed as mean ±SEM).
(E) Oral NAM supplement is incorporated into NAD primarily through gut microbiota-enabled deamidated NAD salvage in several mouse tissues. Data from the experiment in (B) is presented as a percentage of labeled NAD synthesized via the deamidated (m+3 and m+1) and amidated (m+4) pathways for both 4 mg/Kg and 80 mg/Kg doses of 18O,15N,13C-NAM (n=3–4 mice/group).
(F) The relative fractions of the labeled NAD metabolites synthesized via the amidated pathway (Red, m+4) or via the deamidated pathway (Black, m+1 and m+3) after oral gavage of 80 mg/Kg of 18O,15N,13C-NAM are graphed proportionally based on the data in (C, D). The font size of each metabolite is roughly proportional to its tissue concentration. Gut lumen content was not analyzed in this experiment and is presented here schematically based on data from a similar experiment presented on Figure 5B.
See also Figures S5D–S5G.
To directly quantify the fraction of NAD synthesized from the deamidated pathway vs the fraction of NAD synthesized from the amidated pathway after oral gavage of NAM, we synthesized a triple labeled NAM, [18O,15N,13C-amide]nicotinamide (18O,15N,13C-NAM), where all three 13C, 15N, and 18O heavy isotopes are located in the amide moiety thereby resulting in m+4 NAM (Figures S5D–S5F). The carbonyl 13C is retained in NAD synthesized via both amidated and deamidated routes, whereas 15N and also 18O are lost during the PncA-mediated deamidation reaction, resulting in m+1 or m+3 forms of NA (French et al., 2010) and of all downstream metabolites in the deamidated NAD biosynthesis pathway (Figure 6B). Therefore, NAD metabolites synthesized from the amidated pathway will be labeled by m+4 (Red), while NAD metabolites originated from NA will be labelled by m+3/m+1 (Gray and Black). We gavaged regular mice with two different doses of this triple labeled NAM (Figure 6B). The 80 mg/kg dose mimics the dose equivalent to that used in commercial human supplements such as NAM and NR (Trammell et al., 2016), whereas the lower 4 mg/kg dose mimics the NAM equivalents (as NAM and NAD) of a 200g steak meal for a human (based on the reported concentrations of NAD and NAM in muscle (Liu et al., 2018) and a commonly used factor of 12 to convert human to mouse dose (Nair and Jacob, 2016)). We quantified the absolute concentrations of key NAD metabolites in six different tissues/organs three hours after dosing (Figures 6C, 6D, and S6D). Consistent with the notion that gut microbiota is responsible for the conversion of NAM to NA as well as with our observations in Figure 5, NA was highly elevated in the colon, small intestine, liver, and kidney three hours after gavage of 80 mg/Kg 18O,15N,13C-NAM (Figure 6C, NA). As expected, all analyzed downstream deamidated NAD metabolites, including NAMN, NAR, and NAAD, were labelled by m+3/m+1 in all tested tissues (Figures 6C, 6D, and S5G, NAMN, NAR, and NAAD). In contrast, all analyzed amidated NAD precursors as well as NAD contained fractions from both pathways (Figures 6C, 6D, and S5G, NAM, NMN, and NAD). Remarkably, despite the high tissue and circulating NAM levels, the fraction of NAD synthesized from the deamidated pathway (m+1 and m+3) was 30%, 70%, 85%, and 59% in the small intestine, colon, liver, and kidney, respectively, three hours after gavage of 80 mg/Kg 18O,15N,13C-NAM (Figures 6E and 6F, 80 mg/Kg). Similar results were obtained with a more physiologically relevant low NAM dose (Figure 6E, 4 mg/Kg). The significantly lower contribution of the deamidated NAD biosynthesis in the small intestine is again consistent with the fact that the small intestine has a much lower bacteria load than the colon (Donaldson et al., 2015). Interestingly, our analyses of NAD metabolites in blood samples collected from the portal vein, a part of the circulatory system that carries blood from the gastrointestinal tract to the liver, and from the inferior vena cava (systemic blood) further revealed that major circulating deamidated NAD precursors are NAMN and NA, although the absolute levels of these deamidated precursors were about 100 to 400-fold lower than that of NAM in portal and systemic blood (Figures 6D and S5G). Furthermore, the effects of microbiota-enabled deamidated NAD biosynthesis were not limited to the entero-hepatic system, as deamidated NAD precursors were also found in the kidney (Figure 6C). The fact that 59% of the labeled kidney NAD was synthesized via the deamidated pathway (Figure 6E) despite much lower concentrations of the circulating deamidated precursors suggests that, similar to the liver, the deamidated pathway is more efficient in the kidney than the amidated one. These results are likely explained by the highest relative expression levels of NAPRT protein in liver and kidney compared to other tissues (Hara et al., 2007). Collectively, our findings demonstrate that gut microbiota-mediated deamidation of NAM starts in the small intestine, continues in the colon, and is responsible for the bulk of NAD synthesis in the colon, liver, and kidney (Figures 6F and 6C).
Gut microbiota plays an important role in incorporation of dietary NR into deamidated precursors and NAD in vivo
In addition to NAM, we further found that gut microbiota is essential for the NAD boosting effect of orally supplemented NR. As shown in Figures 7A and 7B, orally gavaged pyridyl-15N NR was readily detectable in the colonic lumen of both regular and germ-free mice four hours after gavage (Figure 7B, NR). In the regular mice, a portion of labelled NR was converted into NAM, NA, and NAR in the lumen of colon (Figure 7B, Reg). However, the conversion of NR to NAM was reduced 3-fold in the germ-free mice, suggesting that conversion of NR to NAM is largely carried out by the gut microbiota. The residual incorporation of pyridyl-15N into NAM in the colonic lumen of germ-free mice (Figure 7B, NAM, GF) suggested a gut microbiota-independent conversion of NR into NAM in vivo. In contrast, the conversion of NR to NA and NAR was completely blocked in the colonic lumen of germ-free mice (Figure 7B, NA, NAR, GF), indicating that gut microbiota is required to convert NR into the deamidated NAD precursors. In line with our observations in Figures 5 and 6, this gut microbiota-enabled conversion of NR into deamidated NAD precursors significantly contributed to host NAD metabolism. As shown in Figure 7C, the elevation of deamidated NAD metabolites (NA, NAR, NAMN, and NAAD) detected at four hours after oral NR gavage in the colon tissues of regular mice was completely abolished in germ-free mice. Notably, the contribution of NR to the rise of amidated intermediates NAM and NMN was also significantly reduced in the colons of germ-free mice, likely due to a decreased supply of NAM via bacteria-mediated conversion of NR to NAM that is not entirely offset by the lack of PncA-mediated conversion of NAM to NA.
Figure 7. Gut microbiota plays an important role in incorporation of dietary NR into deamidated precursors and NAD in vivo.

(A) Schematic of the experiment. Regular (Reg) and germ-free (GF) C57BL/6NTac mice were gavaged with 185 mg/kg of pyridyl-15N-labeled NR chloride or with saline control, and dissected one or four hours later.
(B) Gut microbiota converts NR into NAM, NA, and NAR in the colonic lumen. Relative abundance of unlabeled (m+0) and labeled (m+1) NR, NAM, and NA in the colonic lumen content of indicated mice were measured by LC-MS four hours after NR gavage (n=3–4 mice/group, values are expressed as mean ±SEM, *p<0.05).
(C) Gut microbiota is important to incorporate dietary NR into metabolites in both amidated and deamidated NAD biosynthesis pathways and into NAD in colons. Relative abundance of unlabeled (m+0) and labeled (m+1) NAD pathway metabolites in colons were measured by LC-MS 4 hours after NR gavage (n=3–4 mice/group, values are expressed as mean ±SEM, *p<0.05).
(D) Gut microbiota-produced amidated and deamidated NAD precursors from dietary NR are detectable in the portal blood. Relative abundance of unlabeled (m+0) and labeled (m+1) NAD pathway metabolites in the portal blood were measured by LC-MS four hours after NR gavage (n=3–4 mice/group, values are expressed as mean ±SEM, *p<0.05).
(E) Gut microbiota is important to incorporate dietary NR into hepatic NAD through both amidated and deamidated pathways. Relative abundance of unlabeled (m+0) and labeled (m+1) hepatic metabolites in NAD metabolic pathways were measured by LC-MS 4 hours after NR gavage (n=3–4 mice/group, values are expressed as mean ±SEM, *p<0.05).
(F) Gut microbiota boosts the flux of dietary NR into NAD through both amidated and deamidated pathway in vivo. The log ratios of the relative abundance of indicated labeled metabolites are represented by a color scale (n=3–4 mice/group).
See also Figures S6 and S7.
Consistent with these observations in the colonic luminal content and colon tissue, oral gavage of pyridyl-15N NR significantly increased the levels of NA and NAR in the portal blood in the regular but not germ-free mice (Figure 7D). The increase in NAM was also significantly blunted in germ-free mice, indicating that both amidated and deamidated NAD precursors generated by gut microbiota from NR reach the circulatory system. Consequently, oral NR gavage resulted in a massive rise of hepatic deamidated NAD metabolites (NA, NAR, NAMN, and NAAD) as well as a significant elevation of hepatic NAM and NMN, which eventually led to a 2.5-fold increase of hepatic NAD in regular mice (Figure 7E, Reg NR vs Reg Saline). These effects were, again, almost completely abolished in the germ-free mice (Figure 7E, GF NR vs GF saline). The key results in portal blood and liver were confirmed in an independent mass spectrometry laboratory (Figures S7B and S7C). Comparison of saline-gavaged regular and germ-free mice demonstrated similar mRNA levels of ten main NAD producing and consuming enzymes in colons and livers of regular and germ-free mice (Figure S6A). Thus, the observed differences in the ability to utilize dietary NR for NAD biosynthesis are unlikely to result from the permanent changes in enzymatic processing capacity but rather are caused by the lack of the deamidated substrates in GF mice. Our analysis further revealed that germ-free mice under a regular feeding condition have a reduced deamidated activity in the colon, as evidenced by significantly reduced levels of NA (Figure S6B). The hepatic NAD metabolism, on the other hand, is not impacted by gut microbiota under the regular feeding condition (Figure S6B), indicating that the observed host-microbiota interaction on NAD metabolism is local under this condition. Taken together, these observations indicate that while oral supplementation of NAM in regular mice boosts hepatic NAD biosynthesis largely through the deamidated pathway (Figures 5 and 6), microbiota-enabled processing of NR supplementation simultaneously activates both the amidated and the deamidated NAD biosynthesis pathways (Figure 7F).
Further analysis of colonic and hepatic metabolomic data revealed that while NR gavage induced marked metabolic alterations in both colon and liver of the regular mice, this response was blunted in the germ-free mice (Figures S7D, S7E, Table S5A, and Table S5B). Specifically, NR gavage induced NA and NAM metabolic pathway while reducing purine metabolism in the livers of regular mice but not of germ-free mice (Figure S7F), indicating that gut microbiota-enabled boost of NAD biosynthesis has a functional impact on general host metabolism. Collectively, our observations demonstrate that bacteria-mediated activation of the deamidated pathway in mammalian host plays a central role for the NAD-raising impact of oral supplements (NAM or NR) that were thought to only boost the amidated NAD biosynthesis. Therefore, microbiome connects the amidated and deamidated NAD biosynthesis pathways in mammals, and is physiologically important in regulating host NAD metabolism and related biological processes in response to environmental and nutritional cues.
Discussion
As a metabolite essential to life, cellular concentration of NAD is tightly balanced by its consumption and biosynthesis. The significance of the de novo NAD synthesis from tryptophan and NAMPT-mediated NAD salvage from NAM is well recognized. In contrast, the importance of the Preiss-Handler deamidated salvage pathway from NA in mammalian cells is much less appreciated despite the widespread expression of key enzymes in this metabolic pathway in mammals (Cantó et al., 2015; Hara et al., 2007; Katsyuba and Auwerx, 2017). Through a serendipitous discovery, we show in the present study that this evolutionarily conserved NAD salvage pathway plays a key role in mediating the impact of bacteria on mammalian NAD homeostasis and energy metabolism. We provide evidence that the host-microbe metabolic crosstalk mediated by the deamidated NAD biosynthesis pathway not only confers host cells resistance to NAMPT inhibitor-induced toxicity in vitro and in vivo, but is also critical in mediating the in vivo efficiency of NAD-increasing nutraceuticals, such as NAM and NR.
The elevation of the deamidated NAD precursors following oral supplementation with NAM or NR observed in our present study (Figures 5, 6, and 7) is in agreement with that reported in a recent study (Trammell et al., 2016a). Here we show that this increase of hepatic NA, NAR, and NAAD following ingestion of NAM or NR is completely dependent on the gut microbiota, and that this bacteria-enabled deamidated flux is responsible for 66–77% of the increase in hepatic NAD pool (Figures 5A–5D, 6, and 7). The loss of 68–89% of amide-15N NAM label in hepatic NAD (Figure 6) further provides an independent and direct evidence that microbiota-mediated deamidation of NAM is the driver of the hepatic NAD boost. Thus, despite the lower steady state levels of the deamidated precursors compared with NAM (Figures 6C–6E and (Trammell et al., 2016), microbiota-enabled deamidated route of NAD biosynthesis is the main route leading to the liver NAD boost following oral intake of the amidated precursors. This surprising finding is likely explained by the fact that, unlike NAMPT, NAPRT is not subject to the feedback inhibition by NAD (Hara et al., 2007). The lower steady state levels of the deamidated NAD precursors likely reflect their rapid turnover into NAD. In addition, while NAM is constantly produced by SIRTs, PARPs, CD38 and other NAD consumers, the deamidated route is practically irreversible. Interestingly, in case of NR supplementation, gut microbiota not only boost NAD levels through PncA-mediated deamidation but also promote the amidated flux (Figures 7E–7F).
Mammals have co-evolved with their microbiota, and numerous recent studies have shown that microbiota impact diverse aspects of the mammalian host physiology, including metabolism, immune response, and disease progression (Rook et al., 2017). Therefore, the host-microbe metabolic interaction discovered in the present study has a number of important implications. Firstly, our findings pave the way for future studies investigating the impact of bacteria on NAD-mediated biological processes in different mammalian systems, including energy metabolism, genome stability, and aging. Secondly, in the context of cancer therapy, several studies have described specific mechanisms of bacteria-mediated modulation of the efficacy of anti-neoplastic drugs, including positive and negative effects on the anti-tumor immunity and bacteria-mediated drug degradation (reviewed in (Cogdill et al., 2018)). The host-microbe metabolic interaction discovered in our study describes a new mechanism of bacteria-mediated drug resistance, namely, bypass of a metabolic block via bacterial production of an alternative precursor.
Finally, the gut microbiota-mediated hepatic NAD boosting effect of NAM and NR revealed in our study is physiologically important for systemic impacts of these supplements. Circulating NAM is the most important NAD precursor for most tissues in vivo (Liu et al., 2018). It has been recently reported that the liver is the main producer of circulating NAM from NAD (>95% of total circulating NAM) (Liu et al., 2018), thus boosting hepatic NAD biosynthesis can directly impact systemic NAD homeostasis and energy metabolism. In addition, the liver itself has been repeatedly shown as an important target of NAD-raising supplements. For instance, NR supplementation in mice can significantly increase NAD content in the liver (Cantó et al., 2012; Ratajczak et al., 2016), protect liver from a high-fat diet induced hepatic steatosis (Gariani et al., 2016; Trammell et al., 2016b) and alcohol-induced liver injuries (Wang et al., 2018), and promote liver regeneration (Mukherjee et al., 2017). A recent study has also shown that boosting the de novo NAD synthesis in the liver can protect animals from diet-induced liver damage (Katsyuba et al., 2018). Notably, in addition to the abovementioned beneficial effects, NA and NAM supplementation have been reported to induce insulin resistance (Fraterrigo et al., 2012) and high doses of NR has also been shown to cause glucose intolerance and other side effects (Shi et al., 2019). Since gut microbiota-derived deamidated NAD metabolites contribute the bulk of newly synthesized hepatic NAD upon NAM or NR supplementation (Figures 5, 6, and 7), our finding in the present study suggests that microbiota is likely to impact other tissues through hepatic NAD metabolism.
In summary, through chemical screen, global and targeted metabolic analyses, and functional genetic and biochemical assays, we discovered that bacteria contribute to the deamidated NAD biosynthesis in host cells through a microbial nicotinamidase (PncA). The discovery of this host-microbe metabolic crosstalk that links two NAD salvage pathways in mammals will open the door for new therapeutic approaches targeting NAD metabolism via manipulation of the microbiome.
Limitations of Study
Our study has several limitations. First, the direct contribution of the circulating deamidated precursors to NAD biosynthesis is limited by the expression levels and activity of their potential transporters as well as of NAPRT and NADS enzymes in a given tissue. Thus, isotope tracing analyses in additional peripheral tissues at different time points is needed to thoroughly characterize the spatial and temporal contribution of the microbiota-dependent deamidated pathway to tissue NAD biosynthesis. Secondly, although the significant attenuation of pyridyl-15N NR incorporation into liver NAD in germ-free mice (Fig 7E and S7C) strongly suggest that microbiota-dependent deamidated pathway is responsible for the bulk of hepatic NAD synthesis after NR supplementation, isotopic labeling of NR on the amide and on the ribose are needed to fully reconstruct the metabolic routes by which NR contributes to the NAD metabolism.
STAR Methods
LEAD CONTACT AND MATERIALS AVAILABILITY
A new construct was generated in this study: pcDNA3-HA-pncA. Isotopically labeled [18O,15N,13C-amide]nicotinamide (NAM, m+4) was generated in this study.
Further information and request for resources and reagents should be directed to and will be fulfilled by the lead contact, Xiaoling Li (lix3@niehs.nih.gov).
EXPERIMENTAL MODEL AND SUBJECT DETAILS
Mammalian cell lines and bacteria
H1299 male lung cancer and 293T female embryonic kidney cells were obtained from Duke University cell culture facility. HCT116 male colon cancer cells were from ATCC. CRC119 female colon cancer and CRC240 female colon cancer cells were a gift from Dr. David Hsu (Duke University). All cells were grown in RPMI medium with 10% fetal bovine serum supplemented with penicillin and streptomycin and were incubated at 37°C with 5% CO 2. For Chronic mycoplasma infection, cells were infected once with Mycoplasma hyorhinis (ATCC® 17981™) and then passaged as usual. For E. coli experiments, penicillin and streptomycin in growth medium were substituted by 1 μg/ml gentamycin as we found this concentration to be bacteriostatic. Cells were infected with 1:1000 dilution of overnight stationary phase K12 E. coli culture (E. coli Keio Knockout Parent Strain BW25113, #OEC5042 or pncA KO #OEC4987–200827138, Dharmacon). Separate tissue culture reagents bottles and incubator shelves (in addition to secondary containment in larger dishes) were used for the infected cultures. Following the initial discovery of mycoplasma in H1299 E2F1 KO cells, mycoplasma contamination status of all cultures was monitored by real-time PCR monthly (Harasawa et al., 2005).
Mouse models
All animal work was approved by the Institutional Animal Care and Use Committee of the National Institute of Environmental Health Sciences.
For tumor xenograft experiments six-week-old female Nu/J mice (#002019, Jackson labs) were used. For isotopic tracing experiment, conventional or germ-free eight weeks old male C57BL/6NTac mice (Taconic) were used.
All mice at the NIEHS animal facility are maintained under strict SPF conditions. Regular C57BL/6NTac mice were housed with four-five mice per cage in micro-isolator static cages (Techniplast, Exton, PA) in a room with a constant temperature (19–23°C) and humidity (55% ± 10%) and a 12-hour light/dark cycle. They were provided ad libitum with an autoclaved plant-based chow diet (NIH-31, Harlan Laboratories, Madison, WI) supplemented with 83 mg/Kg of NA and deionized water treated by reverse osmosis. Nu/J mice were housed in the same condition as C57BL/6NTac mice but were fed with autoclaved acid water. All mice were negative for mouse hepatitis virus, Sendai virus, pneumonia virus of mice, mouse parvovirus 1 and 2, epizootic diarrhea of infant mice, mouse norovirus, Mycoplasma pulmonis, Helicobacter spp., and endo- and ectoparasites upon receipt, and no pathogens were detected in sentinel mice during our whole study. The germ-free C57BL/6NTac mice were housed in a gnotobiotic isolator under strict aseptic conditions with autoclaved NIH-31 diet and water to maintain the germ-free status for one week prior to experiments. The clinical health status of all experimental mice was checked at least twice a week during our experiments per the approved animal study protocols.
Mice were randomly assigned to experimental groups after they were allowed to acclimatize for one week prior to experiments.
METHOD DETAILS
Chemical Screen
Chemical screen was performed at Duke University Genetic and Chemical Screening Services. Wildtype or E2F1 knockout H1299 cells were plated using a Matrix WellMate onto 384-well plates that had been stamped using a Labcyte Echo Acoustic Dispenser with the Bioactive compound library (Selleckchem), for a final concentration of 1.25 μM in duplicate plates. Cells were incubated for 48 hours and assayed for cell viability with Cell Titer-Glo (Promega). All well values were normalized to the average of DMSO control wells found on each plate. Figure 1A shows average normalized values of duplicate plates. Full screen results can be found in Table S1.
Animal xenograft studies
For xenograft experiments, 2×10⁶ M. hyorhinis-positive or negative HCT116 human colon carcinoma cells were subcutaneously injected into each flank of six-week-old female Nu/J mice (#002019, Jackson labs). We had eight mice per treatment group and all mice developed at least one tumor. Tumor length and width were measured by caliper and tumor volume was calculated using the formula V=length*width2/2. Treatment with twice daily subcutaneous injections of the indicated dose of STF118804 or vehicle control was initiated when the largest tumor reached 200 mm3 and continued for 9–15 days (15 mg/Kg STF118804) or nine days (30 mg/Kg STF118804). Mice were sacrificed earlier when their tumors reached 1000 mm3 according to the study protocol.
STF118804 formulation
Due to solubility problem of the published STF118804 formulation (Matheny et al., 2013) we developed a new formulation using block co-polymer micelles. The amphiphilic triblock copolymer [P(MeOx35-b-BuOx20-b-MeOx34), Mn=8.4 kg/mole, PDI =1.18)] was synthesized by living cationic ring-opening polymerization (He et al., 2016; Lorson et al., 2018). Briefly, pre-determined amounts of polymer and STF118804 were dissolved in acetone and mixed well at 1:10 drug:polymer ratio, followed by complete evaporation of acetone to form a thin film. The formed thin film was rehydrated with appropriate amount of distilled water and sonicated for 10 min. To remove residual solid STF118804 (if any), the samples were centrifuged at 10,000 g for 3 min and the supernatant was obtained and lyophilized. The lyophilized samples were rehydrated with normal saline immediately before use. The concentration of STF118804 in polymeric micelles was determined by reverse-phase high-performance liquid chromatography using an Agilent Technologies 1200 series HPLC system equipped with UV detector and a Nucleosil C18 5 μm column (250 mm × 4.6 mm). STF118804 was eluted with ACN/water; 70/30 as mobile phase, at a flow rate of 1mL/min and detected at 310nm. The concentration of STF118804 was calculated using a linear calibration curve against standard STF118804 solution.
Isotopic tracing experiments in vivo
For D4-NAM isotopic tracing experiment, eight weeks old C57BL/6 male mice were either given regular water or autoclaved water containing antibiotic cocktail (1 g/l ampicillin, 1 g/l neomycin, 1 g/l metronidazole, 500 mg/l vancomycin) for twelve days. Fecal DNA was isolated using QIAamp DNA Stool Mini Kit (Qiagen) and microbiota depletion was verified by qPCR using 16S V3 sequencing primers (5’-tcgtcggcagcgtcagatgtgtataagagacagccagactcctacgggaggcag-3’; 5’-gtctcgtgggctcggagatgtgtataagagacagcgtattaccgcggctgctg-3’). Control and microbiota-depleted mice were treated with oral gavage of 80 mg/kg nicotinamide labeled with 4 deuterium atoms on the pyridine ring (D4-NAM). Additional control group of mice also received a PBS gavage. Gavages were staggered and were given alternating between control and microbiota-depleted mice to avoid any experimental bias. Mice were sacrificed three hours after gavage. Colons were flushed and flash frozen in liquid nitrogen along with livers. Samples were stored at −80 degrees before processing. Each treatment group had 5–6 mice.
For 15N-NR isotopic tracing experiment, conventional or germ-free eight weeks old C57BL/6NTac mice (Taconic) were gavaged with 185 mg/kg of NR chloride labeled with 15N on the pyridine ring (Chromadex) or with saline control, and dissected at one or four hours later.
For NAM isotopic tracing experiments, eight weeks old C57BL/6 conventional male Mice were gavaged with 80 mg/Kg of either D4-NAM, 15N-amide NAM (Sigma) or [18O,15N,13C-amide] NAM or with saline control, and dissected three hours later.
For E. coli repopulation experiment, germ-free eight-weeks-old C57BL/6NTac mice (Taconic) were gavaged with 2×10⁸ WT or pncA KO E. coli for three consecutive days. Successful repopulation was confirmed by fecal 16S qPCR five days after the first E. coli gavage. Mice were gavaged with D4-NAM seven days after the first E. coli gavage and dissected three hours later.
Immunohistochemistry
An immunohistochemical staining of formalin-fixed, paraffin-embedded mouse tissues was performed using rabbit monoclonal Ki-67 antibody (Abcam, Cambridge, MA, Cat# ab16667, Lot# GR3185488–3, 1 mg/ml)) at a 1:150 dilution. Further, the sections were incubated with
Rabbit-on-Rodent HRP-Polymer (BioCare Medical, Concord, CA) for 30 minutes at room temperature. The antigen-antibody complex was visualized using 3-diaminobenzidine (DAB) chromogen (Dako North America, Inc., Carpenteria, CA) for 6 minutes at room temperature. Finally, the sections were counterstained with hematoxylin, dehydrated through graded ethanol, cleared in xylene, and coverslipped.
Plasmids
For CRISPR-Cas9-mediated E2F1 knockout, gRNA sequence 5′-ggagatgatgacgatctgcg-3′ targeting exon 1 of E2F1 was cloned into LentiCRISPR v.2 (Sanjana et al., 2014).
For inducible knockdown of E2F1, shRNAmir insert from E2F1-targeting pGIPZ (Dharmacon, #V3LHS_393591) was cloned into pTRIPZ vector (Dharmacon) with MluI and XhoI to produce pTRIPZ-shE2F1.
For overexpression of HA-PncA, pncA gene was amplified from E. coli genomic DNA and cloned into a modified pcDNA3-HA plasmid using XhoI and NotI sites. The cloned pncA sequence was verified by Sanger sequencing.
Knockdowns and PncA overexpression
For E2F1 knockdown, lentiviral particles were produced using 293T cells co-transfected with pMD2.G (Addgene #12259), and psPAX2 (Addgene #12260) and LentiCRISPR v.2 targeting construct for E2F1 knockout or pTRIPZ-shE2F1 for inducible E2F1 knockdown using Mirus TransIT-LT1 Transfection Reagent. Target cells were infected with lentivirus-containingsupernatant and selected with 2.5 μg/ml puromycin. Expression of the inducible shRNA from pTRIPZ-shE2F1 was induced by addition of 1 μg/ml doxycycline.
For NAPRT knockdown, CRC119 cells were transfected with 20 nM of NAPRT-targeting siRNA (Dharmacon or ThermoFisher Scientific) or control siRNA using Lipofectamine RNAiMAX transfection reagent (ThermoFisher Scientific).
For PncA overexpression, CRC119 cells were transiently transfected with pcDNA-HA-pncA using GenJet Ver.II transfection reagent (Signagen).
Western blot
Cell pellets were lysed with RIPA buffer containing Complete Mini protease inhibitor cocktail (Roche Diagnostics). Proteins were resolved on 4–20% gradient SDS-PAGE, transferred to PVDF membranes and probed with antibodies for E2F1 (Santa Cruz Biotechnologies, sc-251), GAPDH (Cell Signaling Technology, 2118S), alpha-tubulin (Abcam, Ab7291), HA (Santa Cruz Biotechnologies, sc-7392).
NAD, ATP and viability enzymatic assays
For all assays, cells were plated at 10,000 cells per well in clear bottom white plates (Corning, #3610). For enzymatic measurement of total NAD, NAD/NADH-Glo™ kit (Promega) were used. CellTiter-Glo® (Promega), which measures cellular ATP, was used for ATP kinetics (Figure 2A) and as a proxy for cell number (viability).
Synthesis of [18O,15N,13C-amide]nicotinamide (NAM, m+4)
[15N,13C-nitrile]Nicotinonitrile.
An argon-purged pressure tube was charged with [15N,13C]KCN (from Toronto Research Chemicals) (0.50 g; 0.075 mol; 1 equiv.), anhydrous acetonitrile (4.00 mL) and 3-bromopyridine (0.98 g; 600 μL; 0.0.062 mol; 1.2 equiv.). The tube was placed under vacuum and purged with argon. Solution of tributyltin chloride in heptane (0.052 M; 660 μL; 0.034 mmol), XANTPHOS (35 mg, 0.06 mmol) and Pd2(dba)3 (58 mg, 0.06 mmol) were subsequently added into the pressure tube under a blanket or argon. The tube was placed under vacuum, filled with argon and closed with a threaded PTFE cap. The reaction mixture was first stirred at room temperature for 30–35 min, then it was heated in an oil bath at 95–98°C (oil bath temperature) for ca. 19 hours. After completion of the reaction (confirmed by 1H NMR spectroscopy), the reaction mixture was cooled to room temperature and diluted with anhydrous DCM (50 mL). The suspension was filtered and the filtrate was concentrated under reduced pressure. The residue was purified by a silica gel column chromatography using Teledyne system (40 g RediSep column, catalog # 69–2203-340; gradient elution with hexanes/EtOAc mixtures containing from 0 to 60 vol.% of EtOAc). Fractions containing the desired product were combined and solvent were evaporated to give a yellowish crystalline product (0.46 g, 70%). 1H NMR (CDCl3), δ, ppm: 7.43 (dd, 1H, 3JHH= 7.9 Hz, 3JHH= 5.0 Hz, H5), 7.96 (ddt, 1H, 3JHC= 7.8 Hz, 3JHH= 5.5 Hz, 4JHH= 1.9 Hz, H4), 8.81 (dt, 1H, 3JHH= 4.9 Hz, 4JHH= 1.2 Hz, H6), 8.88 (apparent t, 1H, 4JHH= 2.3 Hz, H2). 13C NMR (CDCl3), δ, ppm: 110.12 (dd, 1JCC=83.1 Hz, 2JNC=2.6 Hz, C3), 116.45 (d, 1JNC=17.6 Hz, 13C≡ 15N), 123.60 (d, 3JCC=4.5 Hz, C5), 139.22 (d, 2JCC=1.7 Hz, C4), 152.48 (d, 2JCC=3.6 Hz, C2), 152.99 (C6). HRMS found: 107.04496. Calculated for 13C12C5H515N14N (M+1): 107.04511.
[18O,15N,13C-amide]Nicotinamide (NAM, m+4).
In a pressure tube, placed under vacuum and then filled with argon, [15N,13C]nicotinonitrile (0.306 g, 0.0029 mol) was added, followed by manganese oxide (0.05 g; 0.6 mmol) and [18O]water (from Cambridge Isotope Laboratories, 97 atom % 18O) (0.350 mL, 0.019 mol, 6.5 equiv.) added from a syringe under an argon atmosphere. The tube was closed with a threaded PTFE cap, immersed in an oil bath and heated therein at 70–85°C overnight. The tube was allowed to cool down to room temperature and the content of the tube was dissolved in a 1:1 DCM/acetonitrile mixture. The solution was filtered twice through a filter paper and the filtrate was concentrated under reduced pressure to give a white solid (0.280 g, 78%). 1H NMR (D2O), δ, ppm: 7.48 (dd, 1H, 3JHH= 8.0 Hz, 3JHH= 5.1 Hz, H5), 8.14 (dddd, 1H, 3JHC= 8.0 Hz, 3JHH= 3.9 Hz, 4JHH= 2.2 Hz, 4JHH= 1.9 Hz, H4), 8.61 (apparent d, 1H, 3JHH= 4.5 Hz, H6), 8.83 (br s, 1H, H2). 13C NMR (D2O), δ, ppm: 124.16 (d, 3JCC=3.5 Hz, C5), 129.28 (dd, 1JCC=64.5 Hz, 2JNC=7.1 Hz, C3), 136.43 (2JCC=2.0 Hz, C4), 147.61 (d, 2JCC=3.6 Hz, C2), 151.79 (C6), 170.75 (d, 1JNC=17.6 Hz, 13C(O)−15N). HRMS found: 127.05930. Calculated for 13C12C5H715N14N18O (M+1): 127.05992.
Sample preparation for LC-MS
Cells were grown in 6-well plates in triplicates and treated with 100 nM STF118804 or DMSO control for 24 hours. After collection of medium samples, cells were briefly washed with saline and metabolites were extracted by scraping cells on dry ice into cold 80% methanol/20% water. Plates were incubated at −80 degree for 15 minutes and extracts transferred into microcentrifuge tubes. Following centrifugation at 14000 rpm for 10 minutes, supernatants were transferred to new tubes and dried in a vacuum concentrator at room temperature. The dry pellets were reconstituted into 30 μl sample solvent (water:methanol:acetonitrile, 2:1:1, v/v) and 3 μl was further analyzed by liquid chromatography-mass spectrometry (LC-MS).
For tissue analysis, frozen tissues were pulverized in a mortar in liquid nitrogen and stored on dry ice. 20–30 mg of tissue powder was weighed, extracted in cold 80% methanol/20% water and processed as described for cells.
LC-MS method for metabolomics including NAD pathway metabolites (Duke LC-MS)
Ultimate 3000 UHPLC (Dionex) is coupled to Q Exactive Plus-Mass spectrometer (QE-MS, Thermo Scientific) for metabolite profiling. A hydrophilic interaction chromatography method (HILIC) employing an Xbridge amide column (100 × 2.1 mm i.d., 3.5 μm; Waters) is used for polar metabolite separation. Detailed LC method was described previously (Liu et al., 2014) except that mobile phase A was replaced with water containing 5 mM ammonium acetate (pH 6.8). The QE-MS is equipped with a HESI probe with related parameters set as below: heater temperature, 120 °C; sheath gas, 30; auxiliary gas, 10; sweep gas, 3; spray voltage, 3.0 kV for the positive mode and 2.5 kV for the negative mode; capillary temperature, 320 °C; S-lens, 55; A scan range (m/z) of 70 to 900 was used in positive mode from 1.31 to 12.5 minutes. For negative mode, a scan range of 70 to 900 was used from 1.31 to 6.6 minutes and then 100 to 1,000 from 6.61 to 12.5 minutes; resolution: 70000; automated gain control (AGC), 3 × 10⁶ ions. Customized mass calibration was performed before data acquisition. Metabolomics data analysis-LC-MS peak extraction and integration were performed using Sieve 2.2 (Thermo Scientific). The peak area was used to represent the relative abundance of each metabolite in different samples. Missing values were handled as described in (Liu et al., 2014). MetaboAnalyst package was used for the PCA analysis, the differential metabolite presentation by volcano plot and for metabolic pathways enrichment analysis (Chong et al., 2018).
Targeted analyses of compounds from the NAD pathway (NIEHS LC-MS)
For targeted analyses and relative quantification of compounds from the NAD pathway including isotope flux analyses, a method based upon the report from Yaku, et al. was developed (Yaku et al., 2018b). Data were acquired on a Q Exactive Plus mass spectrometer (QE-MS, Thermo Scientific) interfaced with a Vanquish (Thermo Fisher) UHPLC system. Reverse-phase chromatography was performed using a CORTECS C18 column (100 × 2.1 mm i.d., 1.6 μm; Waters) with a flow rate of 0.15 mL/minute and solvent A being 5 mM ammonium formate in water (pH 6.5) and solvent B being methanol. The LC gradient included a 0.5 minute hold at 0%B followed by a ramp from 0% to 42% B over the next 6 minutes followed by a ramp to 95% over the next minute. A 3 minute hold at 95% was followed by a return to 0% B over the next 0.5 minutes. The run was completed with a 4 minute recondition at 0% B. For the mass spectrometry, a PRM method was employed with a segmented include list for the masses of the metabolites of interest (including any evaluated isotopes) and their optimized normalized collision energies (Table S6). The QE-MS was equipped with a HESI source used in the positive ion mode with the following instrument parameters: sheath gas, 40; auxiliary gas, 10; sweep gas, 1; spray voltage, 3.5 kV; capillary temperature, 325 °C; S-lens, 50; scan range (m/z) of 70 to 1000; 2 m/z isolation window; resolution: 17,500; automated gain control (AGC), 2 × 10e5 ions; and a maximum IT of 200 ms. Mass calibration was performed before data acquisition using the LTQ Velos Positive Ion Calibration mixture (Pierce).
For absolute quantification of compounds from the NAD pathway including isotope flux analyses, a strategy similar to those of Trammell et al. and Demarest et al. was adopted where 13C yeast extract was used as an internal standard (Demarest et al., 2019; Trammell and Brenner, 2013). The 13C yeast extract was reconstituted in 2 mL water, aliquoted, and frozen at −80 until use. Aliquots were diluted 10-fold with water to reach the working concentration. Levels of NAD metabolites in the yeast extract were determined by performing serial dilutions of natural abundance standards (NA, NAM, NAMN, NMN, NAAD, and NAD all from Sigma; NAR and NR from Chromadex) from 50 picomoles/μl to 0.05 picomoles/μl into a constant concentration of the yeast extract. Data were acquired on a Q Exactive Plus mass spectrometer (QE-MS, Thermo Scientific) interfaced with a Vanquish (Thermo Fisher) UHPLC system. Mulitple chromatographic approaches were employed to avoid suppression effects and analyte crosstalk due to source fragmentation (e.g. NAR > NA; NAMN > NA). For NAM, NAAD, and NAD, reverse-phase chromatography was performed using a CORTECS C18 column (100 × 2.1 mm i.d., 1.6 μm; Waters) with a flow rate of 0.15 mL/minute and solvent A being 5 mM ammonium formate in water (pH 6.5) and solvent B being methanol. The LC gradient included a 0.5 minute hold at 0%B followed by a ramp from 0% to 42% B over the next 6 minutes followed by a ramp to 95% over the next minute. A 3 minute hold at 95% was followed by a return to 0% B over the next 0.5 minutes. The run was completed with a 4 minute recondition at 0% B. For NAR, NR, NAMN, and NMN, chromatography was performed using a Comsmocore Phenyl Bromine (PBr) column (100 × 2.1 mm i.d., 2.6 μm; Cosmosil) with a flow rate of 0.3 mL/minute and solvent A being 0.15% formic acid in water and solvent B being 0.15% formic acid in acetonitrile. The LC gradient included a 0.5 minute hold at 0%B followed by a ramp from 0% to 14% B over the next 6.5 minutes followed by a ramp to 95% over the next 0.1 minute. A 3 minute hold at 95% was followed by a return to 0% B over the next 0.1 minute. The run was completed with a 4.8 minute recondition at 0% B. For NA, chromatography was performed using a CSH Fluoro-Phenyl column (100 × 2.1 mm i.d., 1.7 μm; Waters) with a flow rate of 0.3 mL/minute and solvent A being 0.15% formic acid in water and solvent B being 0.15% formic acid in acetonitrile. The LC gradient included a 0.5 minute hold at 0%B followed by a ramp from 0% to 35% B over the next 6.5 minutes followed by a ramp to 95% over the next 0.1 minute. A 3 minute hold at 95% was followed by a return to 0% B over the next 0.1 minute. The run was completed with a 4.8 minute recondition at 0% B. For the mass spectrometry, a method was employed with mutliptle embedded MS1 acquisitions across relatively narrow mass windows including the masses of the metabolites of interest and evaluated isotopes. The QE-MS was equipped with a HESI source used in the positive ion mode with the following instrument parameters: sheath gas, 40; auxiliary gas, 10; sweep gas, 1; spray voltage, 3.5 kV; capillary temperature, 325 °C; S-lens, 50; full MS scan range (m/z) of 100 to 750 (m/z 122–132 for NA and NAM; m/z 254–270 for NAR and NR; m/z 334–350 for NAMN and NMN; 663–690 for NAAD and NAD); resolution: 70,000; automated gain control (AGC), 3 × 10e6 ions; and a maximum IT of 200 ms. Mass calibration was performed before data acquisition using the LTQ Velos Positive Ion Calibration mixture (Pierce).
PRM and MS1 data were processed using the Qual Browser function in the Xcalibur software suite (Thermo Scientific). For relative quantification, extracted ion chromatograms (EICs) for fragment ions were drawn for each of the NAD metabolites in their respective PRM channels (Table S7) and areas under the peak calculated and used to represent the relative abundance of each metabolite in the samples. Based upon integration values for noise, 5000 counts were used as a minimum value. For absolute quantification, EICs were drawn for the exact mass for each NAD metabolite and their isotopes in their respective MS1 channel and areas under the peak calculated. Isotope correction was performed when necessary using isotope models generated using the Isotope Model function of MassLynx (Waters). Picomoles of material on column were derived based upon the calculated amount of each metabolite in the 13C yeast extract that was spiked into each sample.
Cellular concentrations were calculated based on cell counts and using 3pl cell volume based on the reported volume of a similar colon cancer cell line (Hara et al., 2019).
RNA isolation, RNA-seq and RT-PCR
Xenograft tumors were frozen and pulverized in liquid nitrogen using mortar and pestle. Total RNA was isolated using RNeasy Kit (Qiagen).
For RNA-seq analysis, RNA-seq libraries were generated using the TruSeq Stranded Total RNA with Ribo-Zero Kit (Illumina, San Diego, CA). Indexed samples were sequenced using the 75-bp single-end protocol on the Nova-seq 6000 (Illumina) according to the manufacturer’s protocol. Reads (82–145 million reads per sample) were filtered based on a mean base quality score of > 20, and adapters were trimmed by “trim_galore” (version 0.4). Trimmed reads were mapped to mm10 and hg19 using STAR aligner (version 2.6) separately; then, ambiguous reads mapped to both mm10 and hg19 reference genomes were assigned to mm10, hg19 or discarded using a tool “Disambiguate” (Ahdesmaki et al., 2016). Subread featureCounts (version 1.4.6) was applied for gene quantification based on GENCODE annotation release (GRCh37, p13). PCA analysis was carried out to detect any potential sample outliers. The Bioconductor package DESeq2, which fits a negative binomial distribution to estimate technical and biological variability, was used to identify the differentially expressed genes. A gene was considered significantly differentially expressed when the p value for differential expression was less than 0.05 with more than two-fold change. The gene expression heatmap was generated using the Partek Genomics Suite (version 6.6, Partek, MO). The RNA-seq data were deposited in NCBI Gene Expression Omnibus (GEO: GSE127750)
For RT-PCR, RNA was reverse-transcribed using High-Capacity cDNA Reverse Transcription Kit (ThermoFisher Scientific). Real-time PCR was performed on CFX96 real time PCR instrument (Bio-Rad) using iQ SYBR Green SuperMix (Bio-Rad).
Mitochondrial membrane potential loss
Cells were trypsinized, stained with 100 nM tetramethylrhodamine ethyl ester (TMRE) and analyzed by flow cytometry on LCR II instrument (BD Biosciences).
NAD measurement in isolated cytosolic and mitochondrial fractions
Mitochondrial and cytosolic fraction were isolated according to (Frezza et al., 2007) with modifications. In brief, cells were collected by scraping in PBS and homogenized in a glass potter using a Teflon pestle. After centrifugation at 600g for 10 minutes at 4°C, the supernatant was centrifuged at 4000g for 10 minutes at 4°C. The supernatant was collected as a cytoplasmic fraction. Pellet was washed and centrifuged at at 7000g for 10 minutes at 4°C. Pellet was resuspended as a mitochondrial fraction. Relative NAD/NADH content was determined with NAD/NADH Quantitation Kit (Sigma, MAK037). NAD values were normalized to protein content determined by BCA kit (ThermoFisher Scientific).
Bioenergetic profiling
Extracellular acidification rate (ECAR) and oxygen consumption rate (OCR) were analyzed on Seahorse XFe96 Analyzer (Agilent) using Seahorse XF Cell Mito Stress Test Kit and Glycolysis Stress Test Kit (Agilent). Following completion of the analysis, protein content in each well was determined by BCA kit (ThermoFisher Scientific) and used for normalization of the raw ECAR and OCR values.
Identification of PncA homologs in different bacteria
All 105,735,620 RefSeq bacterial protein sequences were downloaded from NCBI on 2/14/2019 (ftp://ftp.ncbi.nih.gov/refseq/release/bacteria/). The pncA protein is composed of a single isochorismatase domain (PF00857.19; www.pfam.xfam.org). A hidden Markov model (HMM) was used to identify pncA homologous proteins using the hmmsearch function from the HMMer 3.1b1 package (El-Gebali et al., 2019). A total of 93,793 matches with an E value of <= 1e-05 were found from which those with an annotation including “nicotinamidase” or “isochorismatase” were extracted, resulting in a collection of 15,176 candidates. After removing all duplicate species, a total of 2,098 candidate species-specific pncA proteins remained. As pncA contains only the isochorismatase domain, those with multiple protein domains were further eliminated, resulting in a final set of 2,088 candidate species-specific pncA proteins. The phyla of these species were annotated according to the KEGG collection of 2,674 bacterial species (Kanehisa and Goto, 2000) (Kanehisa and Goto, 2000). Manual phylum annotation was used for genera with 5 or more representatives, which were not classified in the KEGG database. The phylum of all genera with less than 5 representatives was listed as “unclassified”. This process resulted in 14 named phyla comprising 647 different genera of bacteria containing putative pncA protein sequences.
QUANTIFICATION AND STATISTICAL ANALYSIS
Values are expressed as mean ± standard deviation (SD) or mean ± standard error of mean (SEM) from at least three independent experiments or biological replicates, unless otherwise indicated in the figure legend. Significant differences between the means were analyzed by the two-tailed, unpaired, non-parametric Mann-Whitney test for the in vivo data or by Student’s t-test for the in vitro data, and differences were considered significant at p<0.05. Data were analyzed using Prism Software 7.0 (GraphPad) or Microsoft Office Excel (Version 16.10). The non-parametric Mann-Whitney test does not assume a normal distribution of the data. For the Student’s t-test analysis of in vitro data, no specific methods were used to determine the normality of the data due to small sample sizes.
Supplementary Material
Highlights.
Bacteria confer host cells with resistance to NAMPT inhibitors (NAMPTi)
Bacteria produce deamidated NAD precursors and prevent NAD depletion
Bacteria rescue NAMPTi-induced toxicity through nicotinamidase PncA
Oral NAM and NR boost in vivo NAD largely via microbiota-dependent deamidated pathway
Context and Significance.
NAD is a cofactor essential for life and its biosynthesis has been studied separately in bacteria, yeast, and mammalian cells for decades. Here, scientists led by the NIH identified an unexpected role of bacteria in mammalian NAD biosynthesis. Bacteria inside tumors protected the tumors from NAD-targeting anti-cancer drugs, whereas gut microbes augmented the NAD boosting effects of commercial oral supplements. The mechanism of this metabolic interaction involves bacteria-mediated production of nicotinic acid, which is then used by the host cells to make NAD via the less appreciated “deamidated” pathway. These findings underscore the importance of the deamidated pathway in mammalian NAD metabolism and will serve as a basis for new therapeutic approaches targeting NAD metabolism via manipulation of the microbiome.
Acknowledgments
We thank Drs. Traci Hall, Michael Fessler, and Paul Wade, and members of the Li laboratory for critical reading of the manuscript. We also thank Dr. So Young Kim from Duke University Genetic and Chemical Screening Services for construction of E2F1 targeting CRISPR construct and help with the drug screen; Mr. Michael Johnston, Dr. David Kurtz, and the Quality Assurance Laboratory of National Institute of Environmental Health Sciences for detecting mycoplasma contamination in our cultured cells; the Comparative Medicine Branch of National Institute of Environmental Health Sciences for support with animal experiments; NIEHS Epigenomics Core Facility for performance of RNA-seq experiments; Dr. Min Shi from the Biostatistics & Computational Biology Branch for consulting on the statistical analysis of our experimental data; and Anna Krause from the National Institute of Environmental Health Sciences Photography & Graphics Service Center for the graphical abstract. This research was supported by the Intramural Research Program of National Institute of Environmental Health Sciences of the NIH to XL (Z01 ES102205). XW was supported by a joint training project between Nanjing Medical University and National Institute of Environmental Health Sciences via the Summer Internship Program, and EL was supported by the National Institute of Environmental Health Sciences Summer Internship Program.
Footnotes
DATA AVAILABILITY
The RNA-seq data of clean (no bacteria) or M. hyorhinis-infected (Mycoplasma) HCT116 xenograft tumors treated with vehicle or STF118804 have been deposited to Gene Expression Omnibus under the accession number GEO: GSE127750. Metabolomics data are provided in Supplemental Tables.
The source file for unprocessed and uncompressed immuno-blots used in the Figures is available from the following link: http://dx.doi.org/10.17632/3dmmdfy355.1
Declaration of Interests
Authors declare no competing interests.
Publisher's Disclaimer: This is a PDF file of an unedited manuscript that has been accepted for publication. As a service to our customers we are providing this early version of the manuscript. The manuscript will undergo copyediting, typesetting, and review of the resulting proof before it is published in its final form. Please note that during the production process errors may be discovered which could affect the content, and all legal disclaimers that apply to the journal pertain.
References
- Ahdesmaki MJ, Gray SR, Johnson JH, and Lai Z (2016). Disambiguate: An open-source application for disambiguating two species in next generation sequencing data from grafted samples. F1000Res 5, 2741. [DOI] [PMC free article] [PubMed] [Google Scholar]
- Barykova YA, Logunov DY, Shmarov MM, Vinarov AZ, Fiev DN, Vinarova NA, Rakovskaya IV, Baker PS, Shyshynova I, Stephenson AJ, et al. (2011). Association of Mycoplasma hominis infection with prostate cancer. Oncotarget 2, 289–297. [DOI] [PMC free article] [PubMed] [Google Scholar]
- Baumann L, Cina M, Egli-Gany D, Goutaki M, Halbeisen FS, Lohrer GR, Ali H, Scott P, and Low N. (2018). Prevalence of Mycoplasma genitalium in different population groups: systematic review andmeta-analysis. Sex Transm Infect 94, 255–262. [DOI] [PMC free article] [PubMed] [Google Scholar]
- Berger F, Lau C, Dahlmann M, and Ziegler M. (2005). Subcellular compartmentation and differential catalytic properties of the three human nicotinamide mononucleotide adenylyltransferase isoforms. J Biol Chem 280, 36334–36341. [DOI] [PubMed] [Google Scholar]
- Bogan KL, and Brenner C. (2008). Nicotinic Acid, Nicotinamide, and Nicotinamide Riboside: A Molecular Evaluation of NAD+ Precursor Vitamins in Human Nutrition. Annual Review of Nutrition 28, 115–130. [DOI] [PubMed] [Google Scholar]
- Cantó C, Menzies KJ, and Auwerx J. (2015). NAD+ Metabolism and the Control of Energy Homeostasis: A Balancing Act between Mitochondria and the Nucleus. Cell Metabolism 22, 31–53. [DOI] [PMC free article] [PubMed] [Google Scholar]
- Chini CCS, Guerrico AMG, Nin V, Camacho-Pereira J, Escande C, Barbosa MT, and Chini EN. (2014). Targeting of NAD Metabolism in Pancreatic Cancer Cells: Potential Novel Therapy for Pancreatic Tumors. Clinical Cancer Research 20, 120–130. [DOI] [PMC free article] [PubMed] [Google Scholar]
- Chowdhry S, Zanca C, rajkumar U, Koga t., Diao Y, raviram r., Liu F, turner K, Yang H, Brunk e., et al. (2019). NAD metabolic dependency in cancer is shaped by gene amplification and enhancer remodelling. Nature 569, 570–575. [DOI] [PMC free article] [PubMed] [Google Scholar]
- Chu KA, Chen W, Hung YM, and Wei JC. (2019). Increased risk of ankylosing spondylitis after Mycoplasma pneumonia: A Nationwide population-based study. Medicine (Baltimore) 98, e15596. [DOI] [PMC free article] [PubMed] [Google Scholar]
- Das A, Huang GX, Bonkowski MS, Longchamp A, Li C, Schultz MB, Kim L-J, Osborne B, Joshi S, Lu Y, et al. (2018). Impairment of an Endothelial NAD+-H2S Signaling Network Is a Reversible Cause of Vascular Aging. Cell 173, 74–89.e20. [DOI] [PMC free article] [PubMed] [Google Scholar]
- Demarest TG, Truong GTD, Lovett J, Mohanty JG, Mattison JA, Mattson MP, Ferrucci L, Bohr VA, and Moaddel R. (2019). Assessment of NAD(+)metabolism in human cell cultures, erythrocytes, cerebrospinal fluid and primate skeletal muscle. Anal Biochem 572, 1–8. [DOI] [PMC free article] [PubMed] [Google Scholar]
- Donaldson GP, Lee SM, and Mazmanian SK. (2015). Gut biogeography of the bacterial microbiota. Nature Reviews Microbiology 2015 14:1 14, 20. [DOI] [PMC free article] [PubMed] [Google Scholar]
- El-Gebali S, Mistry J, Bateman A, Eddy SR, Luciani A, Potter SC, Qureshi M, Richardson LJ, Salazar GA, Smart A, et al. (2019). The Pfam protein families database in 2019. Nucleic Acids Res 47, D427–D432. [DOI] [PMC free article] [PubMed] [Google Scholar]
- Espindola-Netto JM, Chini CCS, Tarragó M, Wang E, Dutta S, Pal K, Mukhopadhyay D, Sola-Penna M, Chini EN, Machado Espindola-Netto J, et al. (2017). Preclinical efficacy of the novel competitive NAMPT inhibitor STF-118804 in pancreatic cancer. Oncotarget 8, 85054–85067. [DOI] [PMC free article] [PubMed] [Google Scholar]
- Fang EF, Lautrup S, Hou Y, Demarest TG, Croteau DL, Mattson MP, and Bohr VA. (2017). NAD(+) in Aging: Molecular Mechanisms and Translational Implications. Trends Mol Med 23, 899–916. [DOI] [PMC free article] [PubMed] [Google Scholar]
- Fraterrigo G, Fabbrini E, Mittendorfer B, O’Rahilly S, Scherer PE, Patterson BW, and Klein S. (2012). Relationship between Changes in Plasma Adiponectin Concentration and Insulin Sensitivity after Niacin Therapy. Cardiorenal Med 2, 211–217. [DOI] [PMC free article] [PubMed] [Google Scholar]
- French JB, Cen Y, Vrablik TL, Xu P, Allen E, Hanna-Rose W, and Sauve AA. (2010). Characterization of Nicotinamidases: Steady State Kinetic Parameters, Classwide Inhibition by Nicotinaldehydes, and Catalytic Mechanism. Biochemistry 49, 10421–10439. [DOI] [PMC free article] [PubMed] [Google Scholar]
- Gardell SJ, Hopf M, Khan A, Dispagna M, Hampton Sessions E, Falter R, Kapoor N, Brooks J, Culver J, Petucci C, et al. (2019). Boosting NAD(+) with a small molecule that activates NAMPT. Nat Commun 10, 3241. [DOI] [PMC free article] [PubMed] [Google Scholar]
- Gazzaniga F, Stebbins R, Chang SZ, McPeek MA, and Brenner C. (2009). Microbial NAD Metabolism: Lessons from Comparative Genomics. Microbiology and Molecular Biology Reviews 73, 529–541. [DOI] [PMC free article] [PubMed] [Google Scholar]
- Grozio A, Mills KF, Yoshino J, Bruzzone S, Sociali G, Tokizane K, Lei HC, Cunningham R, Sasaki Y, Migaud ME, et al. (2019). Slc12a8 is a nicotinamide mononucleotide transporter. Nat Metab 1, 47–57. [DOI] [PMC free article] [PubMed] [Google Scholar]
- Hara N, Osago H, Hiyoshi M, Kobayashi-Miura M, and Tsuchiya M. (2019). Quantitative analysis of the effects of nicotinamide phosphoribosyltransferase induction on the rates of NAD+ synthesis and breakdown in mammalian cells using stable isotope-labeling combined with mass spectrometry. PLoS One 14, e0214000. [DOI] [PMC free article] [PubMed] [Google Scholar]
- Hara N, Yamada K, Shibata T, Osago H, Hashimoto T, and Tsuchiya M. (2007). Elevation of cellular NAD levels by nicotinic acid and involvement of nicotinic acid phosphoribosyltransferase in human cells. J Biol Chem 282, 24574–24582. [DOI] [PubMed] [Google Scholar]
- Hong SM, Hwang SW, Wang T, Park CW, Ryu Y-M, Jung J-H, Shin JH, Kim S-Y, Lee JL, Kim CW, et al. (2018). Increased NAD(H) pool promotes colon cancer progression by suppressing ROS level. Cancer Science. [DOI] [PMC free article] [PubMed] [Google Scholar]
- Imai S. i., and Guarente L. (2014). NAD+ and sirtuins in aging and disease. Trends in Cell Biology 24, 464–471. [DOI] [PMC free article] [PubMed] [Google Scholar]
- Kanehisa M, and Goto S. (2000). KEGG: kyoto encyclopedia of genes and genomes. Nucleic Acids Res 28, 27–30. [DOI] [PMC free article] [PubMed] [Google Scholar]
- Kulikova V, Shabalin K, Nerinovski K, Dölle C, Niere M, Yakimov A, Redpath P, Khodorkovskiy M, Migaud ME, Ziegler M, et al. (2015). Generation, Release, and Uptake of the NAD Precursor Nicotinic Acid Riboside by Human Cells. J Biol Chem 290, 27124–27137. [DOI] [PMC free article] [PubMed] [Google Scholar]
- Lanao AE, and Pearson-Shaver AL. (2019). Mycoplasma Infections. In StatPearls (Treasure Island (FL)). [PubMed] [Google Scholar]
- Liu L, Su X, Quinn WJ, Hui S, Krukenberg K, Frederick DW, Redpath P, Zhan L, Chellappa K, White E, et al. (2018). Quantitative Analysis of NAD Synthesis-Breakdown Fluxes. Cell Metabolism 27, 1067–1080.e1065. [DOI] [PMC free article] [PubMed] [Google Scholar]
- Martens CR, Denman BA, Mazzo MR, Armstrong ML, Reisdorph N, McQueen MB, Chonchol M, and Seals DR. (2018). Chronic nicotinamide riboside supplementation is well-tolerated and elevates NAD+ in healthy middle-aged and older adults. Nature Communications 9, 1286. [DOI] [PMC free article] [PubMed] [Google Scholar]
- Nair AB, and Jacob S. (2016). A simple practice guide for dose conversion between animals and human. Journal of basic and clinical pharmacy 7, 27–31. [DOI] [PMC free article] [PubMed] [Google Scholar]
- Pajk M, Cselko A, Varga C, Posa A, Tokodi M, Boldogh I, Goto S, and Radak Z. (2017). Exogenous nicotinamide supplementation and moderate physical exercise can attenuate the aging process in skeletal muscle of rats. Biogerontology 18, 593–600. [DOI] [PubMed] [Google Scholar]
- Rajman L, Chwalek K, and Sinclair DA. (2018). Therapeutic Potential of NAD-Boosting Molecules: The In Vivo Evidence. Cell Metabolism 27, 529–547. [DOI] [PMC free article] [PubMed] [Google Scholar]
- Razin S, Yogev D, and Naot Y. (1998). Molecular biology and pathogenicity of mycoplasmas. Microbiol Mol Biol Rev 62, 1094–1156. [DOI] [PMC free article] [PubMed] [Google Scholar]
- Revollo JR, Grimm AA, and Imai S. i. (2004). The NAD Biosynthesis Pathway Mediated by Nicotinamide Phosphoribosyltransferase Regulates Sir2 Activity in Mammalian Cells. J Biol Chem 279, 50754–50763. [DOI] [PubMed] [Google Scholar]
- Rogers MB. (2011). Mycoplasma and cancer: in search of the link. Oncotarget 2, 271–273. [DOI] [PMC free article] [PubMed] [Google Scholar]
- Roulston A, and Shore GC. (2016). New strategies to maximize therapeutic opportunities for NAMPT inhibitors in oncology. Molecular & cellular oncology 3, e1052180. [DOI] [PMC free article] [PubMed] [Google Scholar]
- Sanchez-Garcia EK, Contreras-Paredes A, Martinez-Abundis E, Garcia-Chan D, Lizano M, and de la Cruz-Hernandez E. (2019). Molecular epidemiology of bacterial vaginosis and its association with genital micro-organisms in asymptomatic women. J Med Microbiol 68, 1373–1382. [DOI] [PubMed] [Google Scholar]
- Sanjana NE, Shalem O, and Zhang F. (2014). Improved vectors and genome-wide libraries for CRISPR screening. Nat Methods 11, 783–784. [DOI] [PMC free article] [PubMed] [Google Scholar]
- Shi W, Hegeman MA, Doncheva A, Bekkenkamp-Grovenstein M, de Boer VCJ, and Keijer J. (2019). High Dose of Dietary Nicotinamide Riboside Induces Glucose Intolerance and White Adipose Tissue Dysfunction in Mice Fed a Mildly Obesogenic Diet. Nutrients 11. [DOI] [PMC free article] [PubMed] [Google Scholar]
- Tan B, Young DA, Lu Z-H, Wang T, Meier TI, Shepard RL, Roth K, Zhai Y, Huss K, Kuo M-S, et al. (2013). Pharmacological inhibition of nicotinamide phosphoribosyltransferase (NAMPT), an enzyme essential for NAD+ biosynthesis, in human cancer cells: metabolic basis and potential clinical implications. J Biol Chem 288, 3500–3511. [DOI] [PMC free article] [PubMed] [Google Scholar]
- Tarrago MG, Chini CCS, Kanamori KS, Warner GM, Caride A, de Oliveira GC, Rud M, Samani A, Hein KZ, Huang R, et al. (2018). A Potent and Specific CD38 Inhibitor Ameliorates Age-Related Metabolic Dysfunction by Reversing Tissue NAD(+) Decline. Cell Metab 27, 1081–1095 e1010. [DOI] [PMC free article] [PubMed] [Google Scholar]
- Trammell SA, and Brenner C. (2013). Targeted, LCMS-based Metabolomics for Quantitative Measurement of NAD(+) Metabolites. Computational and structural biotechnology journal 4, e201301012. [DOI] [PMC free article] [PubMed] [Google Scholar]
- Trammell SAJ, Schmidt MS, Weidemann BJ, Redpath P, Jaksch F, Dellinger RW, Li Z, Abel ED, Migaud ME, and Brenner C. (2016). Nicotinamide riboside is uniquely and orally bioavailable in mice and humans. Nature Communications 7, 12948. [DOI] [PMC free article] [PubMed] [Google Scholar]
- Uddin GM, Youngson NA, Doyle BM, Sinclair DA, and Morris MJ. (2017). Nicotinamide mononucleotide (NMN) supplementation ameliorates the impact of maternal obesity in mice: comparison with exercise. Sci Rep 7, 15063. [DOI] [PMC free article] [PubMed] [Google Scholar]
- Vande Voorde J, Liekens S, and Balzarini J. (2013). Mycoplasma hyorhinis-encoded purine nucleoside phosphorylase: kinetic properties and its effect on the cytostatic potential of purine-based anticancer drugs. Molecular pharmacology 84, 865–875. [DOI] [PubMed] [Google Scholar]
- Xiao W, Wang R-S, Handy DE, and Loscalzo J. (2018). NAD(H) and NADP(H) Redox Couples and Cellular Energy Metabolism. Antioxid Redox Signal. 28(3):251–272. [DOI] [PMC free article] [PubMed] [Google Scholar]
- Yaku K, Okabe K, Hikosaka K, and Nakagawa T. (2018a). NAD Metabolism in Cancer Therapeutics. Frontiers in Oncology 8, 622. [DOI] [PMC free article] [PubMed] [Google Scholar]
- Yaku K, Okabe K, and Nakagawa T. (2018b). Simultaneous measurement of NAD metabolome in aged mice tissue using liquid chromatography tandem-mass spectrometry. Biomedical Chromatography 32, e4205. [DOI] [PubMed] [Google Scholar]
- Yang Y, Mohammed FS, Zhang N, and Sauve AA. (2019). Dihydronicotinamide riboside is a potent NAD+ concentration enhancer in vitro and in vivo. J Biol Chem 294, 9295–9307. [DOI] [PMC free article] [PubMed] [Google Scholar]
- Yoshino J, Baur JA, and Imai SI. (2018). NAD(+) Intermediates: The Biology and Therapeutic Potential of NMN and NR. Cell Metab 27, 513–528. [DOI] [PMC free article] [PubMed] [Google Scholar]
Associated Data
This section collects any data citations, data availability statements, or supplementary materials included in this article.