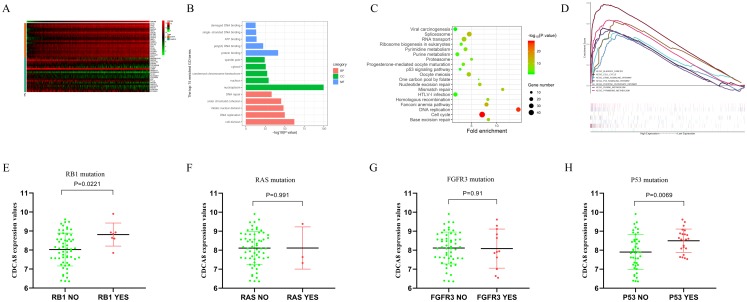
Figure 9. Analysis of the mechanism of CDCA8 in bladder cancer.
(A) Heat map of CDCA8 co-expressed genes; (B) GO function annotation of CDCA8 co-expressed genes; (C) KEGG pathway enrichment analysis of CDCA8 co-expression genes; (D) GSEA pathway analysis; (E) Analysis of the correlation between CDCA8 expression and RB1 mutation; (F) Analysis of the correlation between CDCA8 expression and RAS mutation; (G) Analysis of the correlation between CDCA8 expression and FGFR3 mutation; (H) Analysis of the correlation between CDCA8 expression and P53 mutation.

