Abstract
SLC7A11-mediated cystine uptake is critical for maintaining redox balance and cell survival. Here, we show that this comes at a significant cost for cancer cells with high SLC7A11 expression. Actively importing cystine is potentially toxic due to its low solubility, forcing SLC7A11-high cancer cells to constitutively reduce cystine to the more soluble cysteine. This presents a substantial drain on the cellular NADPH pool and renders such cells dependent on the pentose phosphate pathway (PPP). Limiting glucose supply to SLC7A11-high cancer cells results in marked accumulation of intracellular cystine, redox system collapse, and rapid cell death, which can be rescued by treatments that prevent disulfide accumulation. We further show that glucose transporter (GLUT) inhibitors selectively kill SLC7A11-high cancer cells and suppress SLC7A11-high tumor growth. Our results identify a coupling between SLC7A11-associated cystine metabolism and the PPP, and uncover an accompanying metabolic vulnerability for therapeutic targeting in SLC7A11-high cancers.
Keywords: SLC7A11, pentose phosphate pathway, NADPH, cystine, cysteine
Introduction
Metabolic reprogramming often renders cancer cells highly dependent on specific nutrients for survival 1–3. Limiting the supply of such nutrients or blocking their uptake or metabolism through pharmacological means may selectively kill “addicted” cancer cells without affecting other cancer cells or normal cells 4, 5. Our understanding of nutrient dependency in cancer cells can provide great insights for targeting metabolic vulnerabilities in cancer therapies. One notable example is the use of asparaginase to treat acute lymphoblastic leukemia. Unlike normal cells, these leukemic cells lack asparagine synthetase and are therefore highly dependent on exogenous asparagine for survival 6.
Cysteine is an important amino acid that contributes to cellular redox homeostasis and serves as the rate-limiting precursor for glutathione biosynthesis 7. Most cancer cells obtain cysteine mainly through uptake of extracellular cystine—an oxidized cysteine dimer—via solute carrier family 7 member 11 (SLC7A11, also called xCT) 8–10. Once inside cells, each cystine is reduced to two molecules of cysteine in an NADPH-dependent reaction, and cysteine is subsequently utilized for glutathione biosynthesis and other metabolic processes such as protein synthesis 11. SLC7A11 has a well-established role in maintaining intracellular glutathione levels and protecting cells from oxidative-stress-induced cell death, such as ferroptosis 12–14, and SLC7A11 is frequently overexpressed in cancers 15–17. In this study, we reveal a metabolic vulnerability associated with high SLC7A11 expression in cancer cells and propose corresponding therapeutic strategies to target SLC7A11-high cancers.
Results
SLC7A11 overexpression promotes the PPP flux in cancer cells.
Untargeted metabolomic analysis in cancer cells with stable expression of empty vector (EV) or SLC7A11 revealed that SLC7A11 overexpression, as expected, increased intracellular cysteine levels but decreased levels of intracellular glutamate as well as glutamate-derived metabolites, such as α-ketoglutarate (Fig. 1a and Extended Data Fig. 1a, b). Surprisingly, one of the most significantly increased metabolites was 6-phospho-gluconate (6PG), a PPP metabolite (Fig. 1a, b). Further analysis revealed that other PPP metabolites, as well as gluconate, a metabolite associated with 6PG, were also increased upon SLC7A11 overexpression (Fig. 1b). Acute overexpression of SLC7A11 did not apparently affect the expression levels of PPP enzymes or GLUTs or the levels of most metabolites in glycolysis (Extended Data Fig. 1c, d). We made similar observations in additional cancer cell lines with SLC7A11 overexpression (Extended Data Fig. 1e, f).
Fig. 1. SLC7A11 promotes the PPP flux.
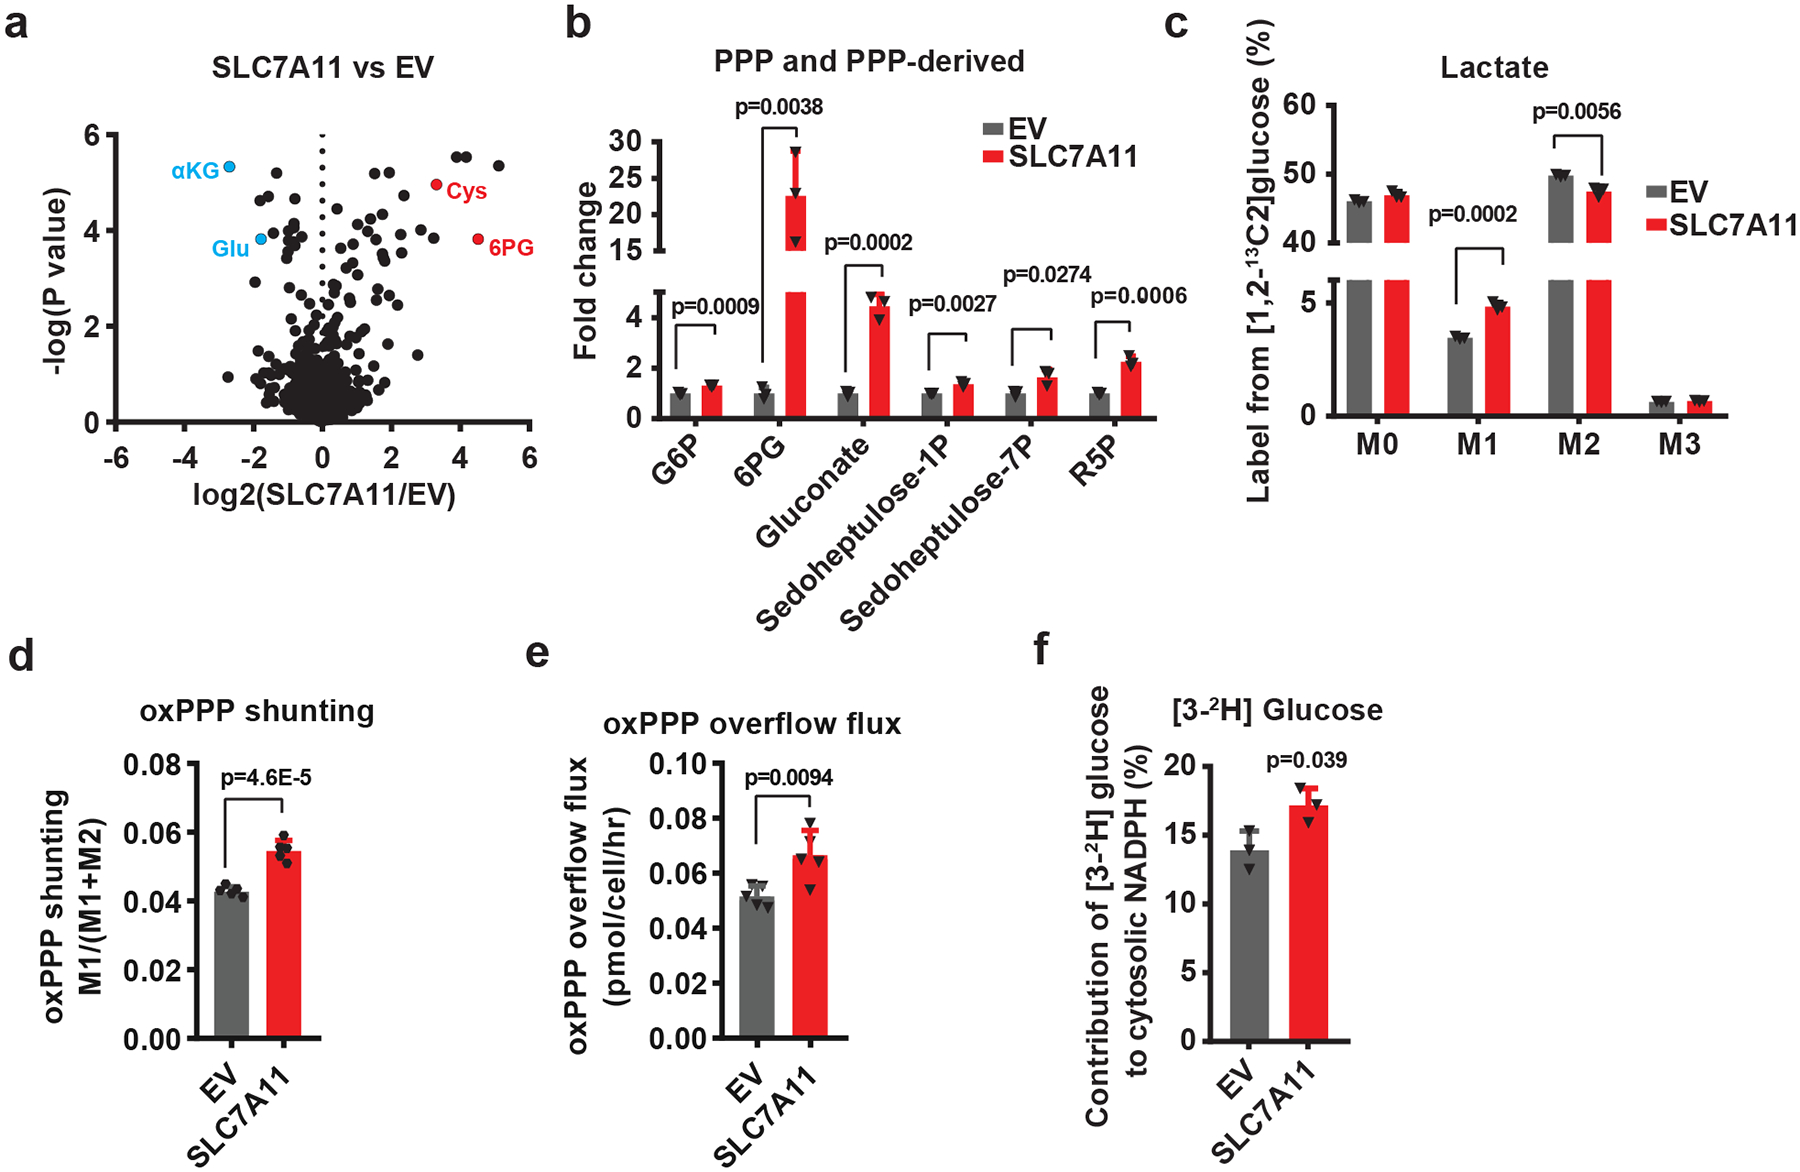
a, Volcano plot showing metabolomic profiling for SLC7A11-overexpressing 786-O cells compared with empty vector (EV) cells. n=3 independent experiments. b, Bar graph showing the fold changes of PPP and PPP-derived intermediates induced by SLC7A11 overexpression in 786-O cells. n=3 independent experiments. c, Mass isotopomer distribution of lactate produced from [1,2-13C2]-glucose in EV and SLC7A11-overexpressing 786-O cells. n=3 independent experiments. d, Relative flux of glucose carbon into the oxidative pentose phosphate pathway (oxPPP) in EV and SLC7A11-overexpressing 786-O cells. n=5 independent experiments. e The overflow flux through oxidative PPP in EV and SLC7A11-overexpressing 786-O cells. n=5 independent experiments. f, Contribution of glucose-derived deuterium labelled NADPH (via oxPPP) to cytosolic NADPH in EV and SLC7A11-overexpressing 786-O cells. n=3 independent experiments. In (f), data are plotted as mean ±95% confidence interval (CI). Other error bars are mean ± s.d.; all p values were calculated using two-tailed unpaired Student’s t-test. Numeral data are provided in Statistics Source Data Fig. 1. Abbreviations: αKG, α-ketoglutarate; Glu, glutamate; Cys, cysteine; 6PG, 6-phospho-gluconate; PPP, pentose phosphate pathway; G6P, glucose-6-phosphate; G6PD, glucose-6-phosphate dehydrogenase; PGD, 6-phosphogluconate dehydrogenase; R5P, ribose-5-phosphate; F6P, fructose-6-phosphate; GA3P, glyceraldehyde-3-phosphate; PYR, pyruvate; Lac, lactate; M0–3, 0–3 13C atoms labeled metabolites.
Next, we performed 1,2-13C-glucose tracing experiments to trace glucose shunting through the PPP in the same cell lines. Lactate with two or one carbon-13 labels (lactate M2 or M1) is produced when 1,2-13C-glucose is converted to lactate through glycolysis or the PPP, respectively 18 (Extended Data Fig. 1g). Thus, the ratio of lactate M1 to (lactate M1 + M2) indicates the relative ratio of the PPP overflow flux to the glycolytic flux 18. Our flux analysis revealed that SLC7A11 overexpression led to an increase of lactate M1 labeling with a concomitant decrease of lactate M2 labeling (Fig. 1c), resulting in a significant increase in the relative flux of glucose carbon into the PPP (Fig. 1d). We further showed that SLC7A11 overexpression did not affect glucose consumption rate (Extended Data Fig. 1h) and therefore resulted in an absolute increase in overflow flux through the oxidative PPP (Fig. 1e). The oxidative PPP plays a major role in generating cytosolic NADPH, which can be utilized for reductive biosynthetic pathways such as palmitate biosynthesis (Extended Data Fig. 1i). Consistently, 3-2H-glucose tracing experiments 19, 20 revealed that SLC7A11 overexpression increased the contribution of PPP enzymes to cytosolic NADPH generation (Fig. 1f and Extended Data Fig. 1j). Collectively, our data show that SLC7A11 promotes oxidative PPP flux.
Glucose-6-phosphate dehydrogenase (G6PD) antagonizes SLC7A11 in regulating glucose-limitation-induced cell death.
An analysis of the expression levels of SLC7A11 and PPP enzymes in a panel of cancer cell lines revealed that SLC7A11-high cell lines generally exhibited higher expression of PPP enzymes than SLC7A11-low cell lines (Fig. 2a). Knockdown of G6PD, the rate-limiting enzyme in the PPP, promoted cell death under glucose-limiting conditions in G6PD-high/SLC7A11-high cells (UMRC6 and A498 cells) (Extended Data Fig. 2a–d). Consistent with previous reports by us and others 21–23, SLC7A11 overexpression promoted cell death under glucose-limiting conditions (Fig. 2b, c). We found that G6PD knockdown promoted, whereas its overexpression attenuated, glucose-limitation-induced cell death in SLC7A11-overexpressing cells (Fig. 2b–e). Together, our data suggest that the PPP counteracts SLC7A11 in regulating glucose-limitation-induced cell death.
Fig. 2. The cross-talk between SLC7A11 and the PPP in regulating glucose-limitation-induced cell death and their co-expression in human cancers.
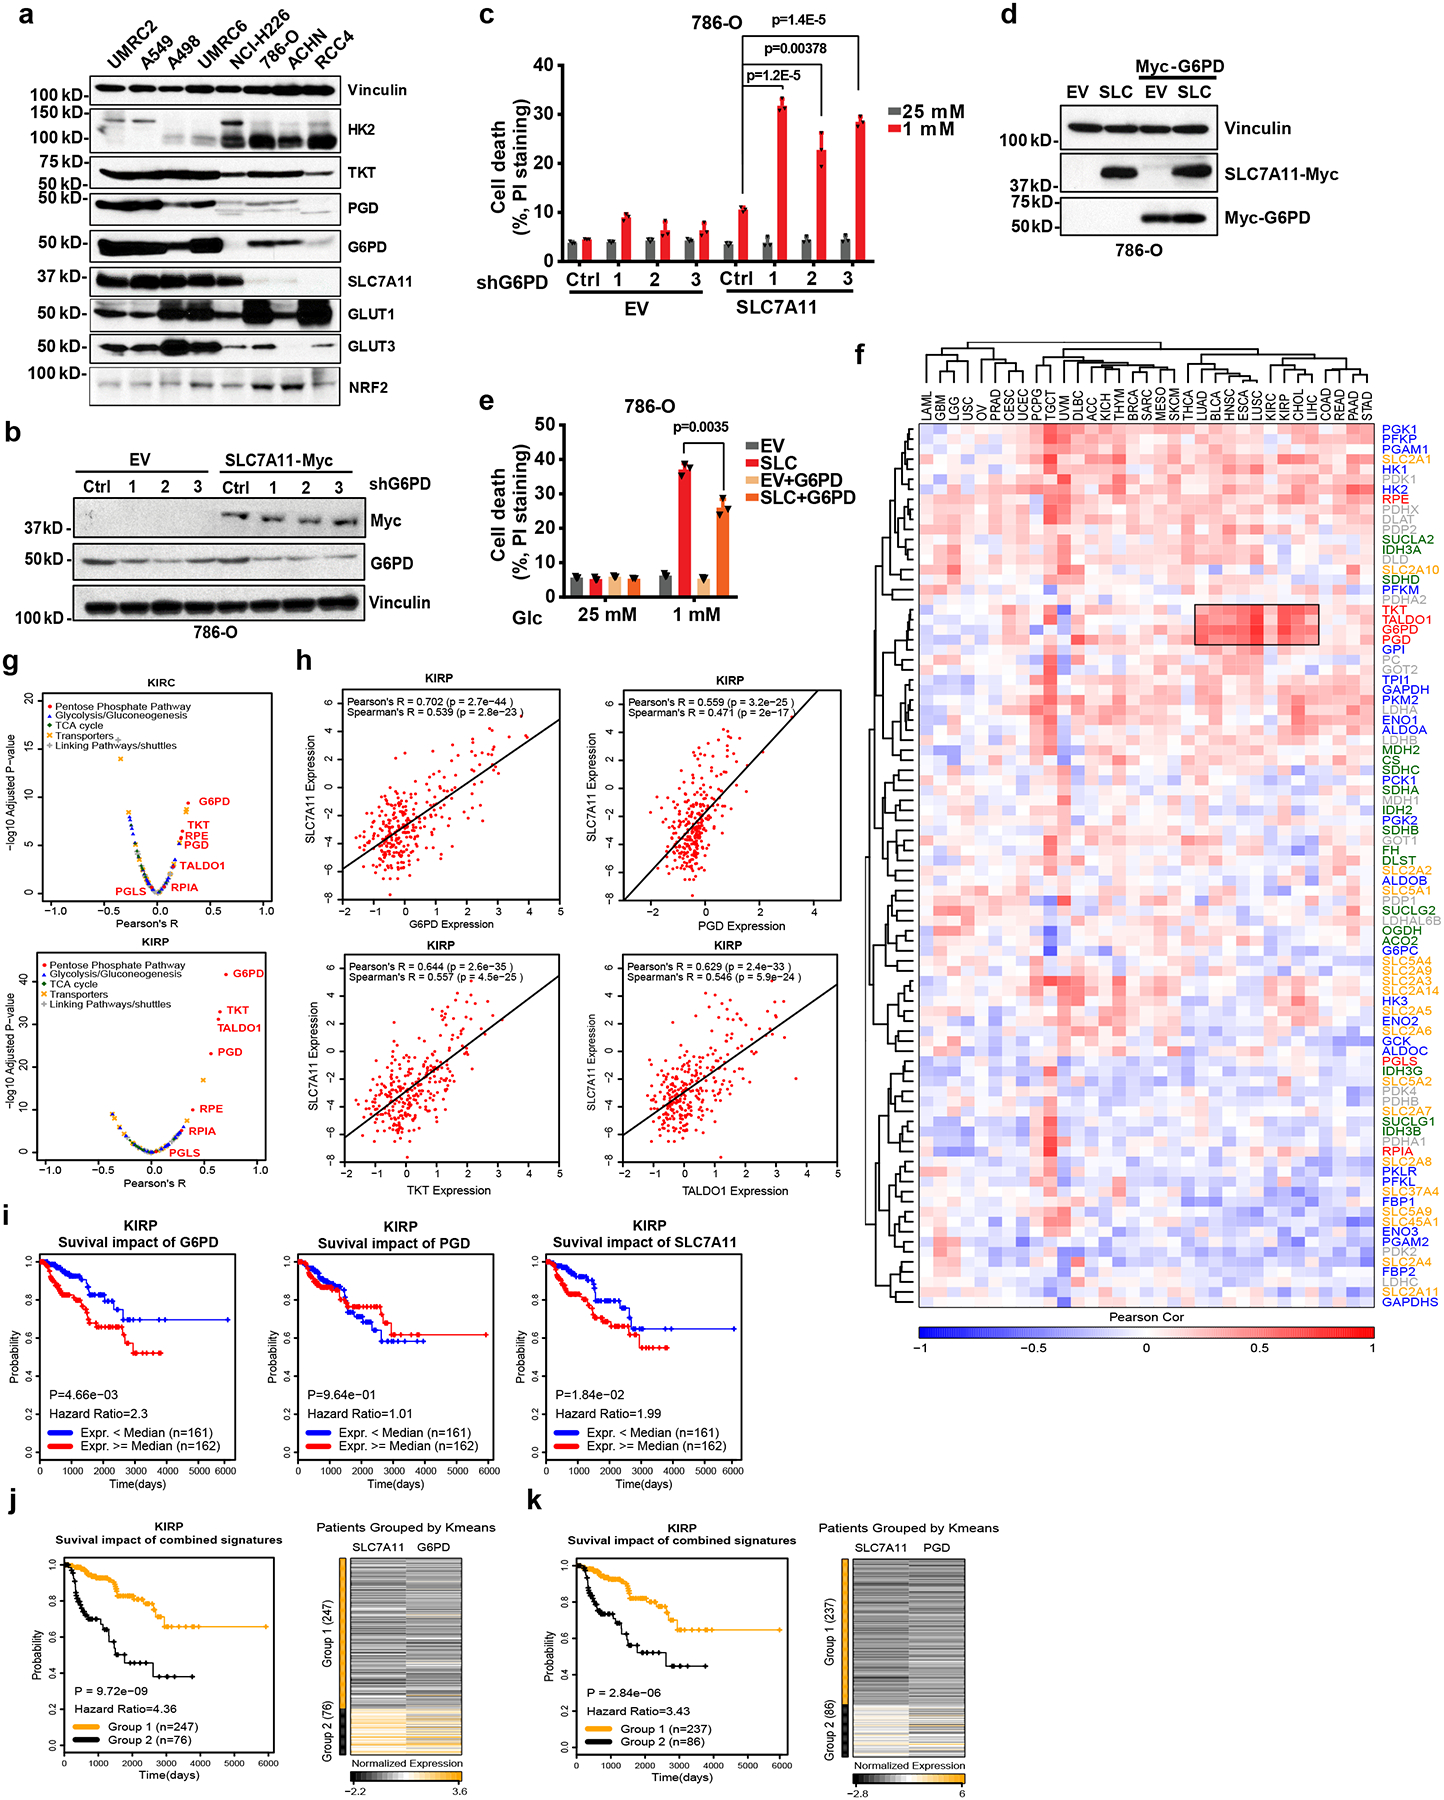
a, The protein levels of SLC7A11 and other indicated genes involved in glucose metabolism in different cancer cell lines were determined by Western blotting. Vinculin is used as a loading control. b, c, Protein levels and cell death in response to glucose limitation in EV and SLC7A11-overexpressing 786-O cells with or without G6PD knockdown were measured by Western blotting (b) and PI staining (c). d, e, protein levels and cell death in response to glucose limitation in EV and SLC7A11-overexpressing 786-O cells with or without G6PD overexpression were measured by Western blotting (d) and PI staining (e). In c and e, error bars are mean ± s.d., n=3 independent experiments, p values were calculated using two-tailed unpaired Student’s t-test. f, The Pearson’s correlation between expression of SLC7A11 and glucose metabolism genes in 33 cancer types from TCGA. The cancer types (columns) and genes (rows) are ordered by hierarchical clustering. PPP genes are highlighted in red at right side. The independent samples’ numbers of cancer types are described in the Methods. g, Compared to other glucose metabolism genes, PPP genes show significant positive correlations with SLC7A11 in KIRP (n=290) and KIRC (n=533). h, Scatter plots showing the correlation between SLC7A11 and 4 PPP genes (G6PD, PGD, TKT, TALDO1) in KIRP (n=290). i, Kaplan–Meier plots of KIRP patients stratified by SLC7A11, G6PD, and PGD expression levels, respectively. j, Kaplan–Meier plots of KIRP patients stratified by unsupervised clustering on SLC7A11 and G6PD expression. Group 1 has lower SLC7A11 and G6PD expression, while Group 2 has higher SLC7A11 and G6PD expression. k, Kaplan–Meier plots of KIRP patients stratified by unsupervised clustering on SLC7A11 and PGD expression. Group 1 has lower SLC7A11 and PGD expression, while Group 2 has higher SLC7A11 and PGD expression. The experiments (a, b, d) were repeated three times, independently, with similar results. Detailed statistical tests of f-k are described in the Methods. Numeral data are provided in Statistics Source Data Fig. 2. Scanned images of unprocessed blots are shown in Source Data Fig.2.
SLC7A11 expression correlates with PPP gene expression in human cancers.
The aforementioned data prompted us to further examine the clinical relevance of the SLC7A11-PPP crosstalk in human cancers. We examined the expression correlations between SLC7A11 and genes involved in glucose metabolism (Supplementary Table 1) in The Cancer Genome Atlas (TCGA) data sets. Unsupervised clustering analyses identified striking positive correlations between SLC7A11 expression and that of several PPP genes, such as G6PD and 6-phosphogluconate dehydrogenase (PGD), in multiple cancers (Fig. 2f). Further analyses revealed that PPP genes are among the top genes in the glucose metabolism network that exhibit the most significantly positive correlation with SLC7A11 in these cancers (Fig. 2g, h and Extended Data Fig. 2e, f). It is possible that the positive correlation between SLC7A11 and PPP genes in cancers may reflect that they are NRF2 transcriptional targets. However, we found that in the cell lines we have analyzed, SLC7A11 levels in general correlated with the levels of PPP enzymes but not with NRF2 levels (Fig. 2a), suggesting that SLC7A11-PPP co-expression is likely driven by NRF2-independent mechanisms in these cell lines. The expression levels of SLC7A11 and the glucose transporter GLUT1/SLC2A1 also exhibited a striking positive correlation in some cancers (Fig. 2f and Extended Data Fig. 2g).
Finally, we showed that, in certain cancers such as kidney papillary cell carcinoma (KIRP), combining high SLC7A11 with high G6PD, PGD, or GLUT1 expression predicted a far worse clinical outcome than either parameter alone (Fig. 2i–k and Extended Data Fig. 2h), indicating a functional synergy between SLC7A11 and the glucose-PPP branch in human cancers. Together, our analyses identify a positive correlation between SLC7A11 and PPP genes (as well as GLUT1) in human cancers. Because our data showed that SLC7A11 does not directly regulate PPP enzyme or GLUT1 expression (Extended Data Fig. 1c), we hypothesize that PPP or GLUT1 upregulation likely results from metabolic adaptation wherein SLC7A11-high tumor cells adapt by upregulating their PPP genes or GLUT1 in order to survive in glucose-poor environments in vivo.
SLC7A11-mediated cystine uptake and subsequent cystine reduction to cysteine promote disulfide stress and deplete NADPH under glucose deprivation.
Our data raised the question of the nature of the metabolic link between SLC7A11 and the PPP. One major function of the PPP is to produce cytosolic NADPH, which provides the reducing power to support reductive biosynthetic reactions and to maintain cellular redox homeostasis 24 (Extended Data Fig. 3a). We therefore studied the potential role of SLC7A11 in regulating NADPH levels in the context of glucose limitation. As shown in Fig. 3a, combining SLC7A11 overexpression and glucose starvation dramatically increased NADP+/NADPH ratio (which indicates NADPH depletion), suggesting that SLC7A11 depletes NADPH under glucose-limiting conditions.
Fig. 3. SLC7A11-mediated cystine uptake and subsequent cystine reduction to cysteine promote disulfide stress, deplete NADPH and cause redox system collapse under glucose deprivation.
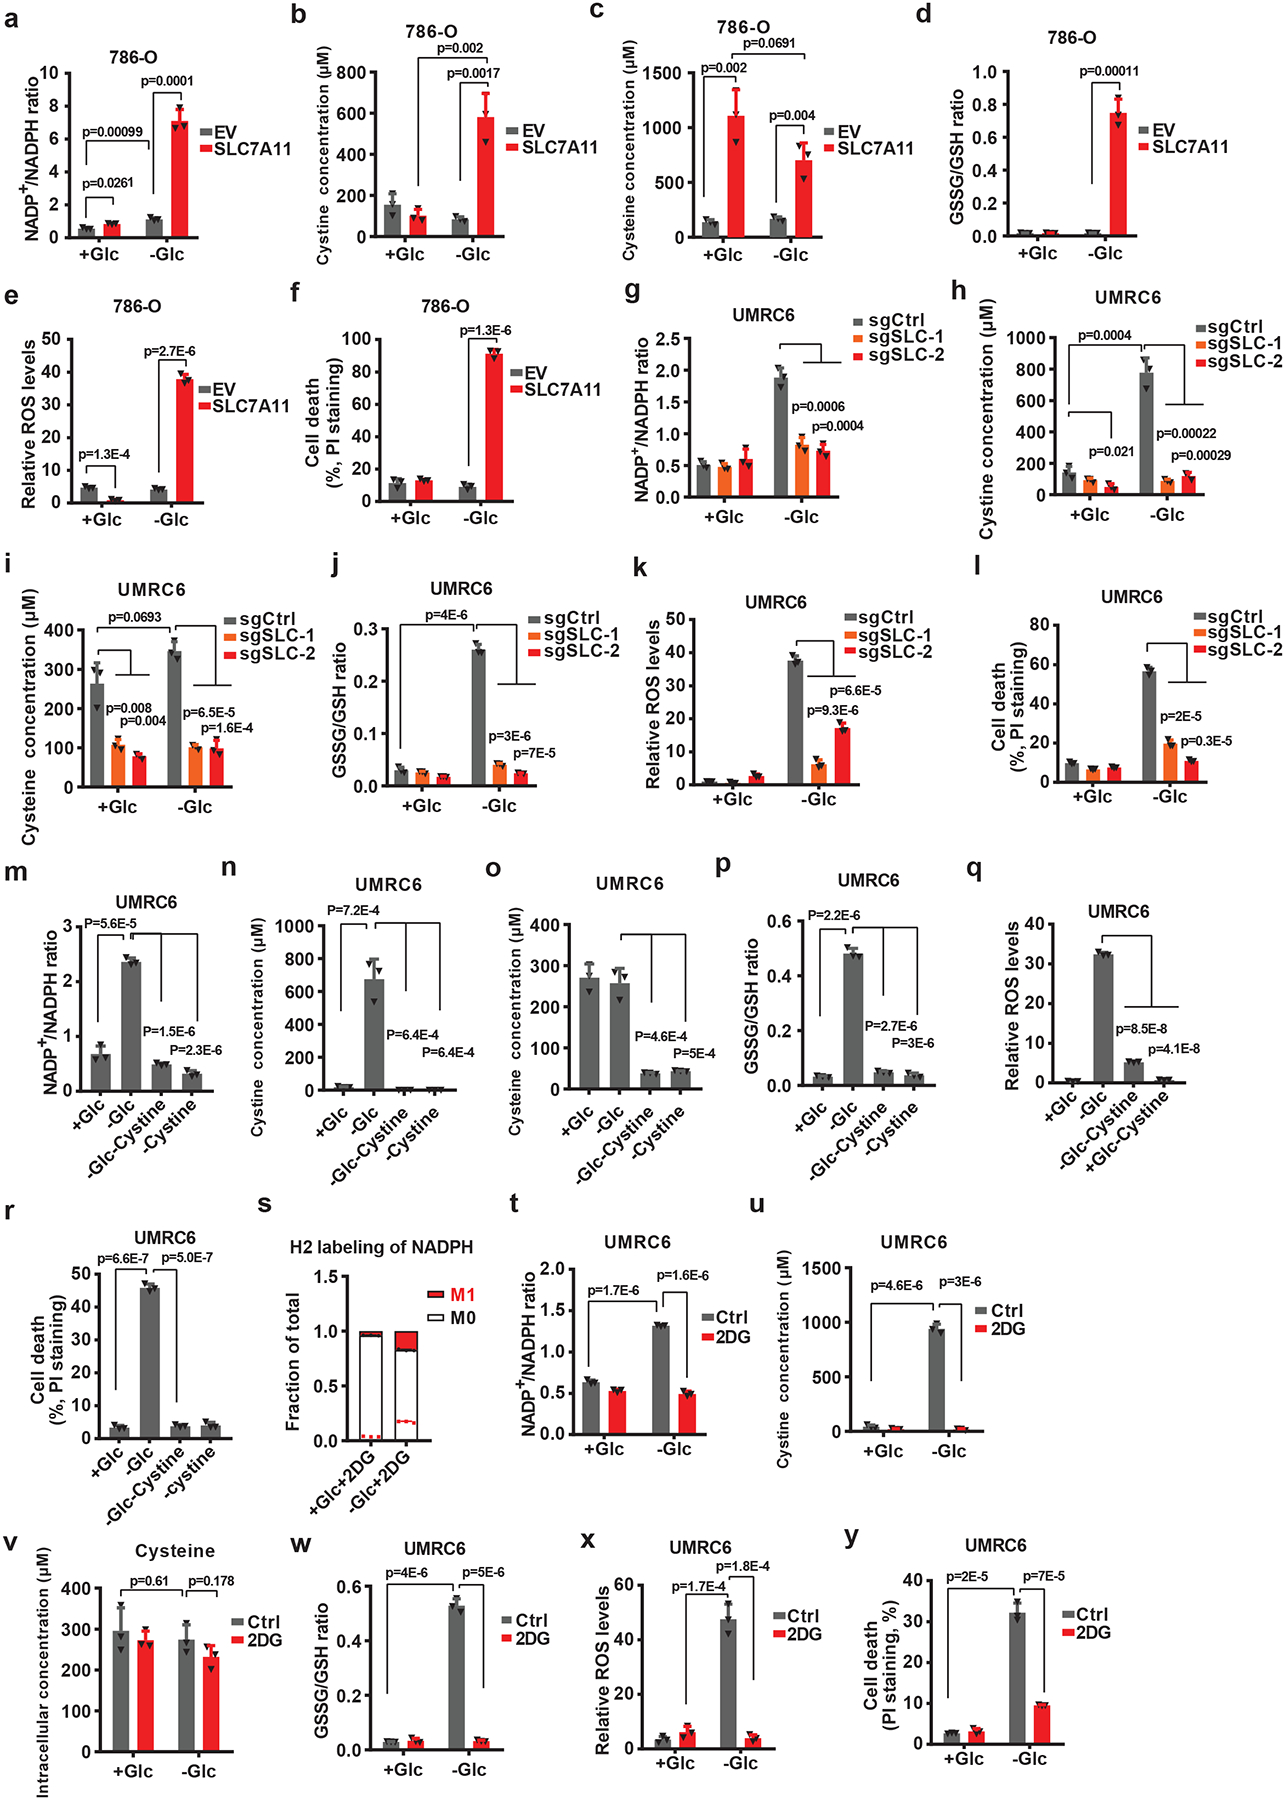
a-f, Measurement of NADP+/NADPH ratios (a), intracellular levels and cystine (b) and cysteine (c), GSSG/GSH ratios (d), ROS levels (e), and cell death (f) of EV and SLC7A11-overexpressing 786-O cells cultured with (+Glc) or without glucose (-Glc). g-l, Measurement of NADP+/NADPH ratios (g), intracellular levels of cystine (h) and cysteine (i), GSSG/GSH ratios (j), ROS levels (k), and cell death (l) of control (sgCtrl) and SLC7A11 knockout (sgSLC-1/2) UMRC cells cultured with (+Glc) or without glucose (-Glc). m-r, Measurement of NADP+/NADPH ratios (m), intracellular levels of cystine (n) and cysteine (o), GSSG/GSH ratios (p), ROS levels (q) and cell deaths (r) of UMRC6 cells cultured with normal (+Glc), glucose free (-Glc), glucose/cystine double free (-Glc-Cystine), or cystine free (-Cystine) medium. s, Deuterium labelled NADPH fraction of total NADPH pool in UMRC cells cultured in glucose-containing or glucose free medium with 2 mM deuterium labelled 2DG (2-deoxy-D-[1–2H]glucose). t-y, Measurement of NADP+/NADPH ratios (t), intracellular levels of cystine (u) and cysteine (v), GSSG/GSH ratios (w), ROS levels (x), and cell death (y) of UMRC6 cells cultured in glucose-containing or glucose-free medium with or without treatment of 2 mM 2DG. All p values were calculated using two-tailed unpaired Student’s t-test. Detailed statistical tests are described in the Methods. All error bars are mean± s.d., n=3 independent experiments. Numeral data are provided in Statistics Source Data Fig. 3.
Once cystine is transported into cells through SLC7A11, it is reduced to cysteine, a reaction which consumes NADPH (Extended Data Fig. 3a). We found that SLC7A11 overexpression under glucose-replete condition did not obviously affect intracellular cystine levels but markedly increased cysteine levels, suggesting that once imported into cells through SLC7A11, cystine is rapidly reduced to cysteine (Fig. 3b, c); notably, glucose starvation drastically increased cystine levels in SLC7A11-overexpressing cells (Fig. 3b). SLC7A11 overexpression under glucose-replete condition increased reduced glutathione (GSH) levels and decreased reactive oxygen species (ROS) levels, as expected; however, under glucose starvation, we observed a decrease in GSH levels accompanied by a marked increase in oxidized glutathione (GSSG), the GSSG/GSH ratio, and ROS levels (Fig. 3d, e and Extended Data Fig. 3b, c). Further analyses revealed a drastic accumulation of other disulfides such as γ-glutamyl-cystine and glutathionyl-cysteine (the cysteinyl disulfides of γ-glutamylcysteine and GSH, respectively) in SLC7A11-overexpressing cells under glucose starvation (Extended Data Fig. 3d–f). This apparent collapse of the thiol redox system was accompanied with a significantly increased cell death in SLC7A11-overexpressing cells under glucose starvation (Fig. 3f and Extended Data Fig. 3g).
We further confirmed our findings in SLC7A11-high UMRC6 cells with SLC7A11 deletion (Fig. 3g–l and Extended Data Fig. 3h–m). In addition, treatment with sulfasalazine (SAS), an inhibitor of SLC7A11 transporter activity, blocked cystine uptake and exerted similar rescuing effects to SLC7A11 deletion in these cells under glucose starvation (Extended Data Fig. 3n–u). Of note, glucose starvation did not cause a dramatic decrease of intracellular cysteine levels in these cells (Fig. 3c, i). This is likely because glucose starvation also suppresses cysteine-consuming processes, particularly protein synthesis 25. Collectively, our data suggest that, following SLC7A11-mediated cystine import, cystine reduction to cysteine consumes large amounts of NADPH, leading to the accumulation of cystine and other disulfides, NADPH depletion, ROS induction, and cell death under glucose starvation.
Restoring intracellular NADPH levels rescues redox defects and cell death in SLC7A11-overexpressing cells under glucose starvation.
Further supporting our hypothesis, we found that removal of cystine from the culture medium substantially reversed the redox defects and largely prevented cell death in UMRC6 (Fig. 3m–r and Extended Data Fig. 4a–d) or SLC7A11-overexpressing 786-O cells (Extended Data Fig. 4e–g) under glucose starvation. This observation may seem odd, because cystine in culture medium is required for cell survival and it is well established that cystine deprivation induces ferroptosis 13. However, SLC7A11-overexpressing cancer cells have significantly more intracellular cysteine reserves (Fig. 3c) and are more resistant to cystine-deprivation-induced ferroptosis than SLC7A11-low cells 14. Continual culturing of UMRC6 cells in cystine-deprived or glucose/cystine-double-deprived medium eventually induced extensive cell death (likely ferroptosis), but over a much longer time frame than the death induced by glucose starvation (Extended Data Fig. 4h). Stated differently, glucose starvation causes much more acute toxicity than does cystine starvation in SLC7A11-overexpressing cancer cells. Conversely, we found that cell lines with low SLC7A11 expression, such as 786-O cells, were generally sensitive to cystine starvation but resistant to glucose starvation (Extended Data Fig. 4i).
We also tested whether increasing NADPH supply by 2-deoxy-glucos (2DG) treatment would exert the similar rescuing effects. 2DG, a glucose analog (Extended Data Fig. 4j), is commonly used as a glycolysis inhibitor 26. While 2DG blocks glycolysis and cannot be shunted into the glycolysis pathway downstream of phosphoglucose isomerase 27, it can still be shunted into the PPP to produce NADPH (Extended Data Fig. 4k). Consistent with this, 2DG treatment led to a drastic accumulation of 2DG-6-phosphate, 2DG-6-phosphogluconolactone, and 2DG-6-phosphogluconate under glucose starvation (Extended Data Fig. 4l–n). 2-deoxy-D-[1-2H] glucose (2H-2DG) tracing experiments confirmed that 2DG indeed contributed to NADPH generation under glucose starvation (Fig. 3s). Correspondingly, 2DG treatment resulted in essentially the same rescuing effect as cystine starvation in UMRC6 cells (Fig. 3t–y and Extended Data Fig. 4o–s) or SLC7A11-overexpressing 786-O cells (Extended Data Fig. 4t–w). Together, our data reveal that either limiting NADPH consumption (by cystine starvation) or increasing NADPH supply (by 2DG treatment) can exert substantial rescuing effects in SLC7A11-high cancer cells under glucose starvation.
Preventing disulfide but not ROS accumulation rescues redox defects and cell death in SLC7A11-overexpressing cells under glucose starvation.
Our data, together with other publications 13, indicate that SLC7A11-mediated cystine uptake inhibits ferroptotic cell death but promotes glucose-starvation-induced cell death. We showed that this latter cell death is not ferroptosis, because treatment with ferroptosis inhibitor ferrostatin-1 or iron chelator DFO, while completely abolished cystine-starvation-induced cell death, did not exert any protective effect on glucose-starvation-induced cell death in UMRC6 cells (Extended Data Fig. 5a, b). To study the relevance of ROS induction to SLC7A11-mediated cell death under glucose starvation, we tested the potential rescuing effects of antioxidants, including N-acetyl-cysteine (NAC), Trolox, or Tempol. To our surprise, despite effectively suppressing ROS levels, Trolox or Tempol did not exert any rescuing effect on cystine accumulation, NADPH depletion, or cell death in UMRC6 cells under glucose starvation (Fig. 4a–d). In contrast, NAC rescued all redox defects and cell death in UMRC6 cells under glucose starvation (Fig. 4e–g and Extended Data Fig. 5c–h).
Fig. 4. Preventing disulfide but not ROS accumulation rescues redox defects and cell death in SLC7A11-overexpressing cells under glucose starvation.
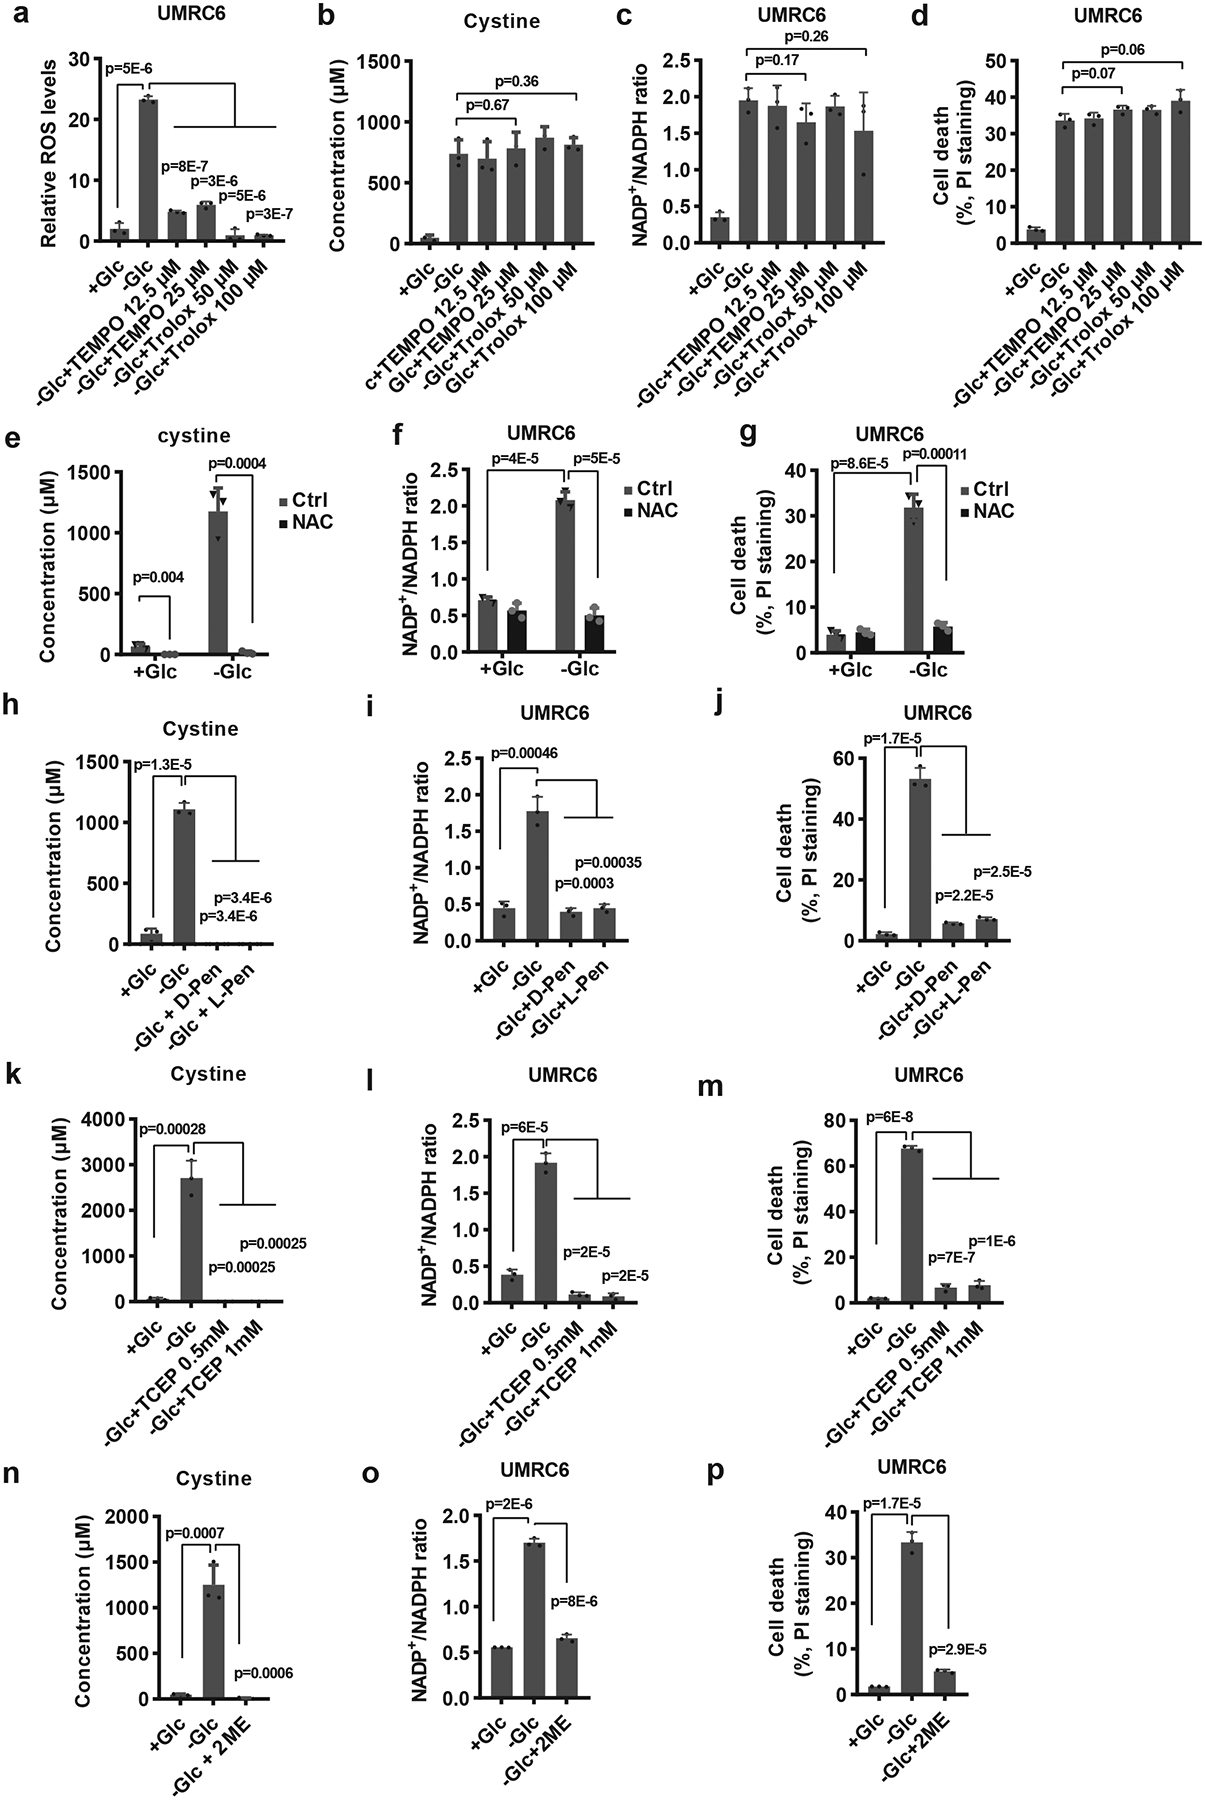
a-d, Measurement of ROS levels (a), intracellular levels of cystine (b), NADP+/NADPH ratios (c), and cell death (d) of UMRC6 cells cultured in glucose-containing or glucose-free medium with or without treatment of TEMPO or Trolox. e-g, Measurement intracellular levels of cystine (e), NADP+/NADPH ratios (f), and cell death (g) of UMRC6 cells cultured in glucose-containing or glucose-free medium with or without treatment of 2 mM NAC. h-j, Measurement intracellular levels of cystine (h), NADP+/NADPH ratios (i), and cell death (j) of UMRC6 cells cultured in glucose-containing or glucose-free medium with or without treatment of 1 mM 2ME, 2 mM D-Penicillamine or L-Penicillamine. k-m, Measurement intracellular levels of cystine (k), NADP+/NADPH ratios (l), and cell death (m) of UMRC6 cells cultured in glucose-containing or glucose-free medium with or without treatment of TCEP. n-p, Measurement intracellular levels of cystine (n), NADP+/NADPH ratios (o), and cell death (p) of UMRC6 cells cultured in glucose-containing or glucose-free medium with or without treatment of 1 mM 2ME. All p values were calculated using two-tailed unpaired Student’s t-test. Detailed statistical tests are described in the Methods. All error bars are mean± s.d., n=3 independent experiments. Numeral data are provided in Statistics Source Data Fig. 4.
It should be noted that the underlying ROS quenching mechanisms of these antioxidants are somewhat different: while Trolox and Tempol suppress ROS by directly scavenging free radical species, NAC suppresses ROS mainly by supplying intracellular cysteine and promoting GSH synthesis. In addition, NAC (but not Trolox or Tempol) presumably can prevent cystine or other disulfide accumulation under glucose starvation through disulfide exchange (e.g., Cys-Cys + NAC → Cys + NAC-Cys). Because the levels of cystine (but not cysteine) and other disulfide molecules were dramatically affected under glucose starvation, we reasoned that the rescuing effect of NAC might relate to its effect on preventing cystine and other disulfide accumulation in SLC7A11-high cancer cells under glucose starvation. Notably, cystine is the least soluble of all common amino acids (Extended Data Fig. 5i); therefore, accumulation of intracellular cystine (as well as other disulfides) may induce disulfide stress and be highly toxic to cells. Consistent with this, toxic buildup of cystine in the bladder or intracellular lysosomes can cause cystinuria or cystinosis 28, 29. Importantly, reducing cystine to cysteine can improve its solubility by more than 2,000-fold (Extended Data Fig. 5i). This led us to further test the potential rescuing effect of penicillamine, a cysteine analog which is commonly used in treating cystinuria. Similar to NAC, penicillamine can prevent the accumulation of cystine or other intracellular disulfide through disulfide exchange (e.g., Cys-Cys + penicillamine → Cys + penicillamine-Cys). However, unlike NAC, as far as we know, penicillamine cannot be metabolized to cysteine or directly contribute to GSH biosynthesis. Our analyses revealed that penicillamine (including both D- and L- penicillamine) exerted similar rescuing effects in UMRC6 cells under glucose starvation (Fig. 4h–j and Extended Data Fig. 5j–o).
Finally, we showed that adding reducing agent tris(2-carboxyethyl)phosphine (TCEP) or 2-mercaptoethanol (2-ME) in medium (to bypass SLC7A11-mediated cystine transport) also rescued redox defects and cell death in UMRC6 cells under glucose starvation (Fig. 4k–p and Extended Data Fig. 5p–y). Together, our data suggest that the cell death in SLC7A11-high cancer cells under glucose starvation is likely caused by intracellular disulfide accumulation and NADPH depletion, but not ROS per se. We currently cannot strictly determine whether it is disulfide stress or NADPH depletion (or likely both) that causes cell death in SLC7A11-overexpressing cells under glucose starvation, because these two effects co-occur throughout our analyses.
Aberrant expression of SLC7A11 sensitizes cancer cells to GLUT inhibition.
Our aforementioned data suggest that SLC7A11-high cancer cells should be more susceptible to pharmacologic means that limit glucose or NADPH supply, such as GLUT or PPP inhibition 26. We found that SLC7A11 overexpression indeed rendered cancer cells more sensitive to PPP inhibitors such as epiandrosterone (EA, a G6PD inhibitor) or 6-aminonicotinamide (6-AN, a PGD inhibitor) (Extended Data Fig. 6a, b), but the effects of these inhibitors on NADPH depletion was modest at most compared with that of glucose starvation, at least in the cell lines we have studied (Extended Data Fig. 6c, d).
Considerable interest has also been directed toward targeting GLUTs in various cancers 26. A highly selective GLUT1 inhibitor, BAY-876, has been recently developed by Bayer 30, and Kadmon is also currently developing a series of potent pan-GLUT1/3 inhibitors, including KL-11743. We confirmed that KL-11743 or BAY-876 potently inhibited glucose uptake (Fig. 5a), and similar to glucose starvation, significantly increased NADP+/NADPH in SLC7A11-overexpressing cells (Fig. 5b). We further showed that KL-11743 or BAY-876 treatment induced substantially more cell death in SLC7A11-high cancer cell lines than in SLC7A11-low cancer cell lines (Fig. 5c), and that SLC7A11 deletion (or its overexpression) in SLC7A11-high (or -low) cancer cells switched their sensitivity to GLUT inhibition (Fig. 5d–g and Extended Data Fig. 6e, f). BAY-876 or KL-11743 treatment exerted similar effects on cystine levels and GSSG/GSH ratio to glucose starvation in SLC7A11-overexpressing cells (Fig. 5h and Extended Data Fig. 6f). Finally, we showed that G6PD overexpression in SLC7A11-overexpressing cells partially reversed the increased sensitivity to GLUT inhibition upon SLC7A11 overexpression (Fig. 5i, j and Extended Data Fig. 6g). Together, our data strongly suggest that SLC7A11 overexpression sensitizes cancer cells to GLUT inhibition.
Fig. 5. Aberrant expression of SLC7A11 sensitizes cancer cells to GLUT inhibition.
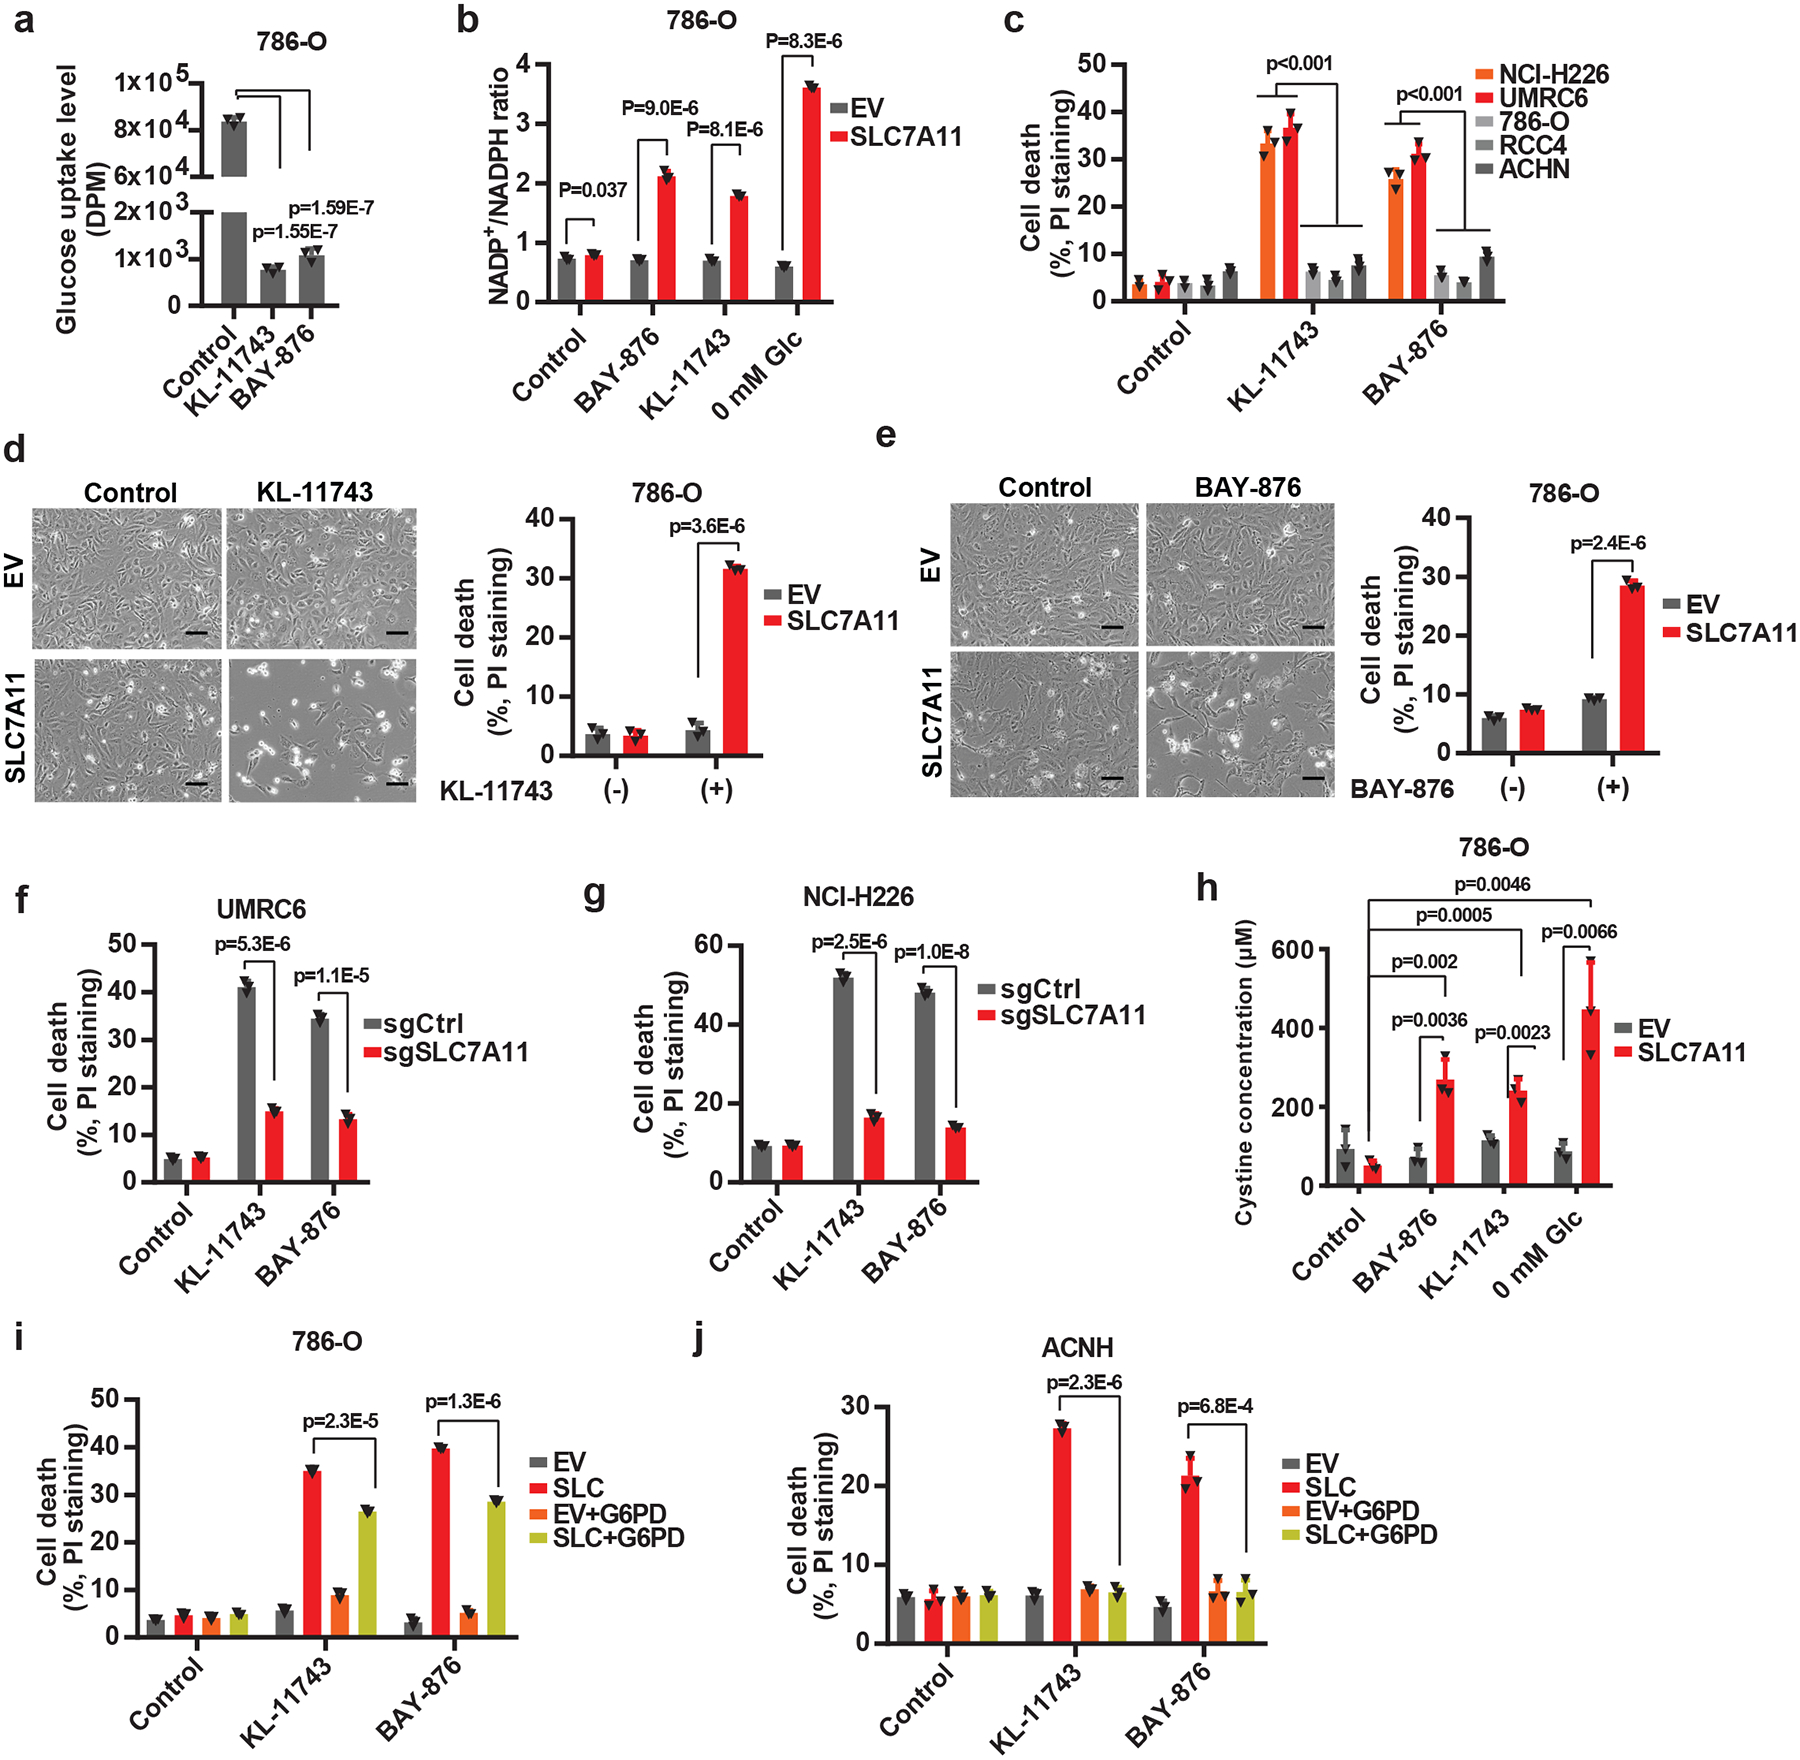
a, Glucose uptake levels were measured in 786-O cells treated with 2 μM KL-11743 or BAY-876. b, Measurement of NADP+/NADPH ratios in EV and SLC7A11-overexpressing-786-O cells treated with KL-11743, BAY-876, or cultured in glucose free medium. c, Cell death was measured by PI staining in different cancer cell lines treated with 2 μM KL-11743 or BAY-876. d, e, Representative phase-contrast images and cell death of EV and SLC7A11-overexpressing 786-O cells treated with 2 μM KL-11743 (d) or BAY-876 (e). The experiment was repeated four times, independently, with similar results. f, g, GLUT inhibition-induced cell death in control (sgCtrl) and SLC7A11 knockout (sgSLC7A11) UMRC6 (f) or NCI-H226 (g) cells were measured by PI staining. h, Measurement intracellular levels of cystine in EV and SLC7A11-overexpressing-786-O cells treated with KL-11743, BAY-876, or cultured in glucose free medium. i, j, Cell death was measured by PI staining in 786-O (i) or ACHN (j) cells with SLC7A11 and/or G6PD overexpression treated with 2 μM KL-11743 or BAY-876. All p values were calculated using two-tailed unpaired Student’s t-test. Detailed statistical tests are described in the Methods. All error bars are mean± s.d., n=3 independent experiments. All scale bars=100 μm. Numeral data are provided in Statistics Source Data Fig. 5.
SLC7A11-high tumors are sensitive to GLUT inhibition.
We then investigated the therapeutic potential of inhibiting GLUTs in treating SLC7A11-high tumors. Due to the large number of animal studies we have conducted and considering that tumors often exhibit high expression of both GLUT1 and GLUT3 31–33, we focused on KL-11743 in our following in vivo experiments. Pharmacokinetic (PK) analysis revealed that, upon intraperitoneal injection (IP) of 100 mg/kg KL-11743, its plasma levels were maintained at inhibitory levels for most of the 24-hour dosing period (Extended Data Fig. 7a). Treatment with KL-11743 dramatically decreased the growth of SLC7A11-high NCI-H226 xenograft tumors; importantly, SLC7A11 deletion abolished the increased sensitivity of these tumors to GLUT inhibition (Fig. 6a, b and Extended Data Fig. 7b). Histopathologic analysis revealed that while all vehicle-treated tumors or KL-11743-treated SLC7A11-KO tumors only showed focal necrosis, KL-11743-treated control tumors exhibited extensive necrotic cell death (Fig. 6c). Metabolite measurement in tumors confirmed that KL-11743 treatment decreased PPP intermediate 6-phosphogluconate levels and specifically increased NADP+/NADPH ratio in SLC7A11-high tumors (Fig. 6d, e). Of note, GLUT inhibition decreased the levels of the metabolites in the upper glycolysis pathway (glucose-6-phosphate and fructose-1, 6- bisphosphate) but did not affect the levels of the glycolytic end-product lactate (Fig. 6f–h), which is in line with recent publications 34, 35 and suggests that the uptake of circulating lactate into tumors might compensate with GLUT inhibition to support the TCA cycle in vivo; therefore, it is less likely that the tumor shrinkage effects by GLUT inhibition observed in our study is caused by energetic stress. Conversely, SLC7A11 overexpression significantly sensitized xenograft tumors established from ACHN cells (a SLC7A11-low cell line) to GLUT inhibition (Fig. 6i, j and Extended Data Fig. 7c).
Fig. 6. SLC7A11-high tumors are sensitive to GLUT inhibitor.
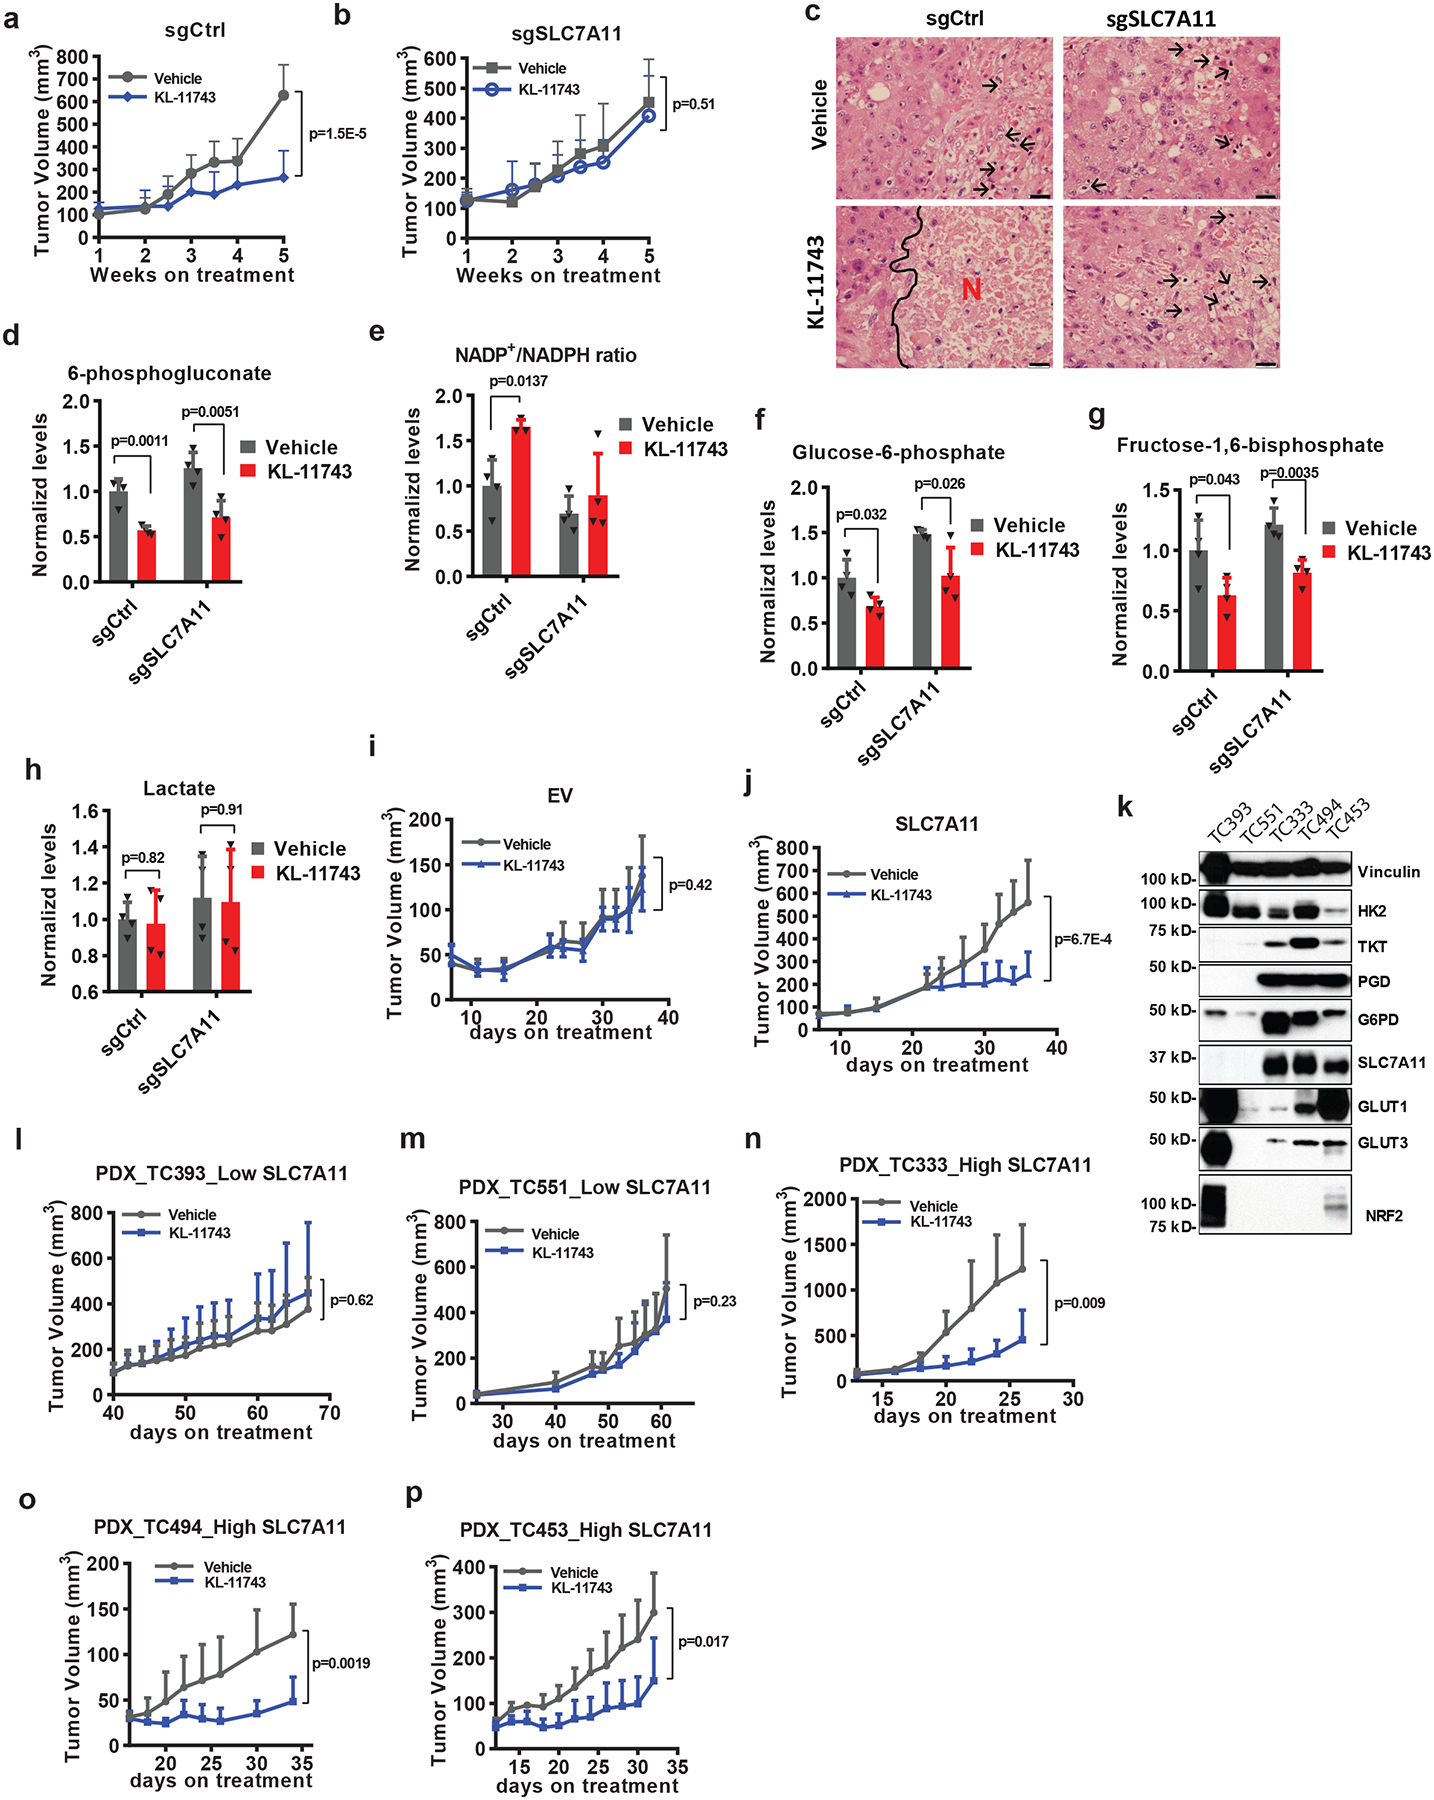
a, b, Tumor volumes at different weeks after tumor cell injection of NCI-H226 xenograft tumors with indicated genotypes treated with KL-11743 or vehicle. Error bars are mean ± s.d., n=9 independent repeats. c, Hematoxylin and eosin staining of NCI-H226 tumor xenografts with indicated genotypes treated with KL-11743 or vehicle. Black arrows and letters “N” denote necrotic cells and regions, respectively. The experiment was repeated twice, independently, with similar results. Scale bars=20 μm. d-h, Normalized levels of metabolites or NADP+/NADPH ratios of NCI-H226 xenograft tumors with indicated genotypes treated with KL-11743 or vehicle. Error bars are mean± s.d., n=4 independent repeats. i, j, Tumor volumes at different days after tumor cell injection of ACHN xenograft tumors with indicated genotypes treated with KL-11743 or vehicle. Error bars are mean ± s.d., n=8independent repeats. k, Protein levels of indicated genes from different PDX models. The experiment was repeated twice, independently, with similar results. l-p, Tumor volumes at different days after PDXs implantation treated with KL-11743, or vehicle. Error bars are mean ± s.d., n=6 (l: KL-11743, n-p) or7 (l: vehicle, m) independent repeats. All p values were calculated using two-tailed unpaired Student’s t-test. Detailed statistical tests are described in the Methods. Scanned images of unprocessed blots are shown in Source Data Fig. 6. Numeral data are provided in Statistics Source Data Fig. 6.
We further tested KL-11743 in several lung cancer patient-derived xenografts (PDXs) which exhibit drastically different SLC7A11 expression (of note, SLC7A11-high PDX lines also exhibited higher expression levels of PPP genes; Fig. 6k). We showed that KL-11743 exerted no effect on the growth of SLC7A11-low PDXs (Fig. 6l, m and Extended Data Fig. 7d, e) but significantly suppressed the growth of all SLC7A11-high PDXs (Fig. 6n–p and Extended Data Fig. 7f–h). We did not notice any significant pathological changes in major organs or weight loss upon KL-11743 treatment in our animal studies (Extended Data Fig. 7i–p), indicating that KL-11743 was well-tolerated in vivo. Together, our animal studies identify GLUT inhibitors as promising therapeutic agents in treating SLC7A11-high cancers.
Discussion
Cells need to keep appropriate levels of NADPH to maintain redox homeostasis and cell survival 36. It is well established that the PPP is the major NADPH supplier, and reductive biosynthesis processes, such as fatty acid biosynthesis, are the major NADPH consumer. Our data suggest that, in cancer cells with high SLC7A11 expression and cystine uptake, cystine reduction to cysteine is also an important NADPH consumer, a concept which is underappreciated in the current literature. We propose that, in cancer cells with high SLC7A11 expression, the increased cystine uptake, while beneficial for cancer cells in antioxidant responses, also come at a significant cost. Because cystine is the least soluble of all common amino acids, the buildup of intracellular cystine or other disulfide molecules is likely to be toxic to cells; therefore, actively transporting cystine into cells represents a “risky business” for cancer cells. In order to maintain cystine at non-toxic levels, SLC7A11-high cancer cells are forced to rapidly reduce cystine to much more soluble cysteine. Because this reduction step consumes NADPH, this induces a strict PPP dependency in SLC7A11-overexpressing cancer cells. As long as sufficient glucose is provided and the PPP operates efficiently, an appropriate level of NADPH and redox homeostasis can still be maintained in the SLC7A11-overexpressing cancer cells (Extended Data Fig. 8a).
Limiting NADPH production from the PPP by glucose starvation (or GLUT inhibition) in the context of high SLC7A11 expression leads to a massive accumulation of small molecule disulfides (including cystine), a series of redox defects, and rapid cell death (Extended Data Fig. 8b). We showed that agents that suppress disulfide accumulation rescued both the redox defects and cell death in SLC7A11-high cancer cells under glucose starvation, including (i) 2DG supplementation to supply NADPH for cystine reduction; (ii) treatment with disulfide reducing agent such as TCEP and 2-ME; and (iii) treatment with thiol compounds such as NAC and penicillamine to regenerate free thiols via disulfide exchange (Supplementary Table 2). Cystine deprivation or blocking SLC7A11-mediated cystine uptake (genetically or pharmacologically) limits intracellular cystine accumulation, and also rescues all the redox defects and significantly prolongs cell survival of SLC7A11-overexpressing cancer cells under glucose starvation (Extended Data Fig. 8c). Collectively, our data strongly suggest that it is the disulfide stress caused by intracellular disulfide accumulation downstream of NADPH depletion that underlies the remarkable vulnerability of SLC7A11-high cancer cells to glucose limitation or GLUT inhibition.
Of further importance, while ROS are significantly induced in glucose-deprived, SLC7A11-overexpressing cancer cells, treatment with ROS scavengers Trolox or Tempol, despite effectively suppressing ROS levels, cannot rescue cell death (Supplementary Table 2). This demonstrates that ROS per se are not driving cell death in this context but are instead a consequence of NADPH depletion. This is surprising to us given the intimate link between ROS and glucose-starvation-induced cell death 26. Furthermore, although NADPH has been identified as a biomarker for ferroptosis sensitivity 37, we conclude that this cell death phenotype is distinct from ferroptosis because it cannot be prevented with the ferroptosis inhibitors. Our study therefore provides a conceptual uncoupling of SLC7A1-associated or disulfide stress-induced cell death pathways from ferroptosis or other ROS-induced cell death.
Because cancer cells generally exhibit increased glucose uptake 24, there has been a significant interest in targeting GLUTs in cancer therapies. However, despite potent blockade of glucose uptake, GLUT inhibition by KL-11743 does not have obvious single-agent cytotoxic or tumor-suppressive effects across a broad range of cancer cell lines or preclinical models, but appears to exert significant therapeutic effects only in certain cellular contexts, underscoring the need to identify the specific genetic or tumor backgrounds for therapeutic targeting of GLUTs. Our current study identifies SLC7A11-overexpressing tumors as at least one such context that is particularly vulnerable to GLUT inhibition. High expression of SLC7A11 in cancer cells is often caused by specific mutations such as loss of tumor suppressor BAP1 or KEAP1 14, 38–41. Our study therefore calls for further testing these GLUT inhibitors in treating SLC7A11-overexpressing tumors in future preclinical and clinical studies, and proposes that BAP1 or KEAP1 mutations may serve as potential biomarkers in selecting cancer patients with high SLC7A11 expression for GLUT inhibition.
Methods
Cell culture studies.
UMRC2, UMRC6 and RCC4 cell lines were provided by Dr. William G. Kaelin at Dana-Farber Cancer Institute. All other cancer cell lines were obtained from ATCC. All cell lines were free of mycoplasma contamination (tested by the vendor). No cell line used in this study has been found in the ICLAC database of commonly misidentified cell lines, based on short tandem repeat profiling performed by the vendor. Cells were cultured in DMEM medium with 10% fetal bovine serum in a 5% CO2 air atmosphere. For glucose or cystine deprivation experiments, cells were cultured in glucose and/or cystine free DMEM with dialyzed FBS as previously described 14, 42. Glucose free DMEM was obtained from Life Technologies (#11966–025). Glucose + cystine free DMEM was customized from Athena Environmental Sciences. Cystine free DMEM was subsequently prepared by adding back glucose.
Constructs and reagents.
SLC7A11 cDNA-containing expression vectors were described in previous publications 14, 22, 43. G6PD shRNA constructs in GIPZ vector and G6PD cDNA were obtained from the Functional Genomics Core Facility of The University of Texas MD Anderson Cancer Center. G6PD cDNA was subsequently cloned into the lentivirus vector pCDH-hygromycin with C-terminal Myc tag. All constructs were confirmed by DNA sequencing. D-[1, 2-13C2] glucose (#GLC-026), 2-deoxy-D-[1-2H] glucose, and D-[3-2H] glucose (#GLC-034) were obtained from Omicro Biochemical. L-[1, 2, 1’, 2’−14C]-Cystine (#NEC854010UC) was from Perkine Elmer. Epiandrosterone (#CS-5183) was obtained from Chemscene. Following reagents were obtained from Sigma: BAY-876 (#SML1774–25MG), L-Glutamine-13C5 (#605166–100MG), N-Acetyl-L-Cysteine (NAC) (#A9165), 2-Deoxy-D-glucose (#D8375–1G), Sulfasalazine (#S0883–10G), D-Penicillamine (#P4875), L-Penicillamine (#196312), Trolox (#238813), 4-Hydroxy-TEMPO (#176141), Tris(2-carboxyethyl)phosphine hydrochloride(TCEP) (#C4706), 2-Mercaptoethanol (2ME) (#M6250), Deferoxamine mesylate salt (DFO) (#D9533), Ferrostatin-1 (#SML0583), 6-Aminonicotinamide (#A68203–1G), Methyl cellulose (#M0512–100G), TWEEN 80 (# P1754–500ML). All reagents were dissolved according to manufacturers’ instructions.
Stable cell lines generation.
Cell lines with stable overexpression of target genes were generated as previously described 44. Briefly, HEK293T cells were transfected with either pLVX-empty vector or -SLC7A11-Myc constructs, together with psPAX.2 and pMD2.G third-generation lentiviral packaging system using Lipofectamine 2000 reagent (Life Technologies) according to the manufacturer’s instructions. 72 hours later, lentivirus particles in the medium were collected and filtered, then the target cell lines were infected. At 24 hours post-infection, puromycin was added to obtain stable cell lines with successful transduction. To generate CRISPR knockout cells, the sgRNAs were cloned into the CRISPR-V2 vector (Addgene, #52961) as previously described 45 and lentiviral infection was conducted as described above. The sequences of gRNAs and shRNAs used in this study are listed in Supplementary Table 3.
Cell death assays.
To measure cell death, cells were seeded in 12-well plates one day before the treatment. After treatment with appropriate drugs or special media, cells were trypsinized and collected in a 1.7 mL tube, washed once with PBS, and stained with 1 μg/mL propidium iodide (PI) in cold PBS. Dead cells (PI-positive cells) were analyzed using a BD Accuri C6 flow cytometer (BD Biosciences) and FlowJo 10 software 46, 47. A representative gating strategy for flow cytometry analysis is shown in Extended Data Figure 9.
ROS, NADP+, and NADPH measurement.
ROS measurement using CM-H2DCFDA (Life Technologies, #C6827) was performed as described previously 22. The intracellular levels of NADPH and total NADP (NADPH + NADP+) were measured according to previous publications 48 with modifications. In brief, cells were cultured in 6-well plates overnight. On the next day, the cells were lysed in 300 μL extraction buffer (20 mM nicotinamide, 20 mM NaHCO3, 100 mM Na2CO3), centrifuged, and supernatant was split into two 150 μL aliquots. For total NADP measurement, 20 μL cell supernatant was added from one 150 μL aliquot into a 96-well plate and mixed with 80 μL of NADP-cycling buffer (100 mM Tris-HCl pH8.0, 0.5 mM thiazolyl blue (MTT), 2mM phenazine ethosulfate, 5 mM EDTA) containing 0.75 U of G6PD enzyme (Sigma, #G4134). After 1 minute incubation in the dark at 30 °C, 20 μL of 10 mM glucose 6-phosphate was added to the mixture, and the change in absorbance at 570 nm was measured every 1 minute for 6 minutes at 30 °C with a microplate reader. For NADPH measurement, the other 150 μL supernatant was incubated at 60 °C for 30 min (to destroy NADP+ without affecting NADPH), followed by the same procedures in parallel as for total NADP measurement. Eventually, the concentration of NADP+ was calculated by subtracting [NADPH] from [total NADP].
Cystine and glucose uptake assays.
Cystine uptake using [14C] cystine (PerkinElmer) was conducted as described previously 22. Glucose uptake was conducted similar to cystine uptake. Briefly, cells were washed with PBS once and replaced with glucose free medium containing 0.1 μCi 2-[1-14C]-Deoxy-D-Glucose (PerkinElmer) with or without indicated drugs. After incubated for 2 hours at 37°C, cells were washed twice with cold PBS, and lysed in 0.1 mM NaOH. Radioactivity (DPM) was measured using Tri-Carb Liquid Scintillation Analyzer (PerKinElmer, Model 4810TR) in the presence of quench curve. All experiments were carried out in triplicate.
Western blotting.
Western blotting was conducted as previously described 49, 50. Tumor tissues were powdered in a liquid nitrogen-cooled mortar and pestle and then lysed in 10 volumes of NP40 buffer as previously described 51–53. The primary antibodies and concentrations used for Western blotting were following: G6PD (1:1,000, Cell Signaling Technology, #12263S), Vinculin (1:5,000, Sigma, #V4505), Myc tag antibody(1:2,000, Cell Signaling Technology, #2276S), TKT (1:1,000, Cell Signaling Technology, #8616S), PGD (1:1,000, Cell Signaling Technology, #13389S), SLC7A11 (1:2,000, Cell Signaling Technology, #12691S), GLUT1 (1:1,000, Thermo fisher, #PA5–16793), GLUT3 (1:1,000, santa cruz, #sc-74497), NRF2 (1:1,000, Cell Signaling Technology, # 12721S).
Non-labelling/13C-glucose labelling metabolite extraction, sample preparation, and HPLC-MS analysis.
Cells were seeded on 35 mm culture plates at a density sufficient to ensure approximately 70–80% confluence at the time of extraction. Metabolites were extracted by rapidly aspirating the culture medium and then adding 0.6 mL of an 80% methanol: 20% water mixture at dry ice temperature. The plates were incubated on dry ice for 15 minutes before the cell material was scraped into Eppendorf tubes pre-chilled on ice. Cell debris was pelleted by centrifugation at 500 RCF for 5 minutes at 4°C and the supernatant was transferred to a fresh tube. The pellet was re-extracted with an additional 0.15 mL of methanol : water, then both extracts were pooled and stored on dry ice until analysis. For culture media samples, the media was harvested into an eppendorf tube and stored on dry ice until analysis. Samples were analyzed within 48 hours of harvesting.
For analysis by C18 reversed phase LC-MS, 650 μL of extract was dried under nitrogen gas flow and then resuspended in 100 μL water. For a separate amino acid analysis, 90 μL of the extract was mixed with 10 μL of uniformly carbon-13 and nitrogen-15 algal amino acid internal standard mixtures (1 mg/mL in water, Cambridge Isotope Laboratories) prior to derivatization of with 10 μL of triethylamine and 1 μL of benzyl chloroformate for 15 minutes at room temperature. Culture media samples were thawed and deproteinized by dilution into 9 volumes of methanol prior to centrifugation at 13,000 RCF for 5 minutes at 4°C, and then analyzed either directly or after benzyl chloroformate derivatization.
LC-MS analysis was performed essentially according to the method described in 54. The complete platform consists of an Accela 1250 HPLC system, Accela Open Autosampler, MayLab Mistraswitch column oven and Exactive orbitrap mass spectrometer, controlled by the Xcalibur 3.0.63 software package. Chromatography was performed with a Phenomenex Synergi Hydro-RP column (100 × 2 mm, 2.5 μm particle size). Solvent A is 10 mM tributylamine and 15 mm acetic acid in water; Solvent B is methanol. The gradient is: 0 min, 0% B; 2.5 min, 0% B; 5 min, 20% B; 7.5 min, 20% B; 13 min, 55% B; 15.5 min, 95% B; 18.5 min, 95% B; 19 min, 0% B; 25 min, 0% B. The injection volume was 10 μL. The column temperature was set to 40° C, and the flow rate was 200 μL/min.
The Exactive was operated in negative ionization mode with an electrospray ionization interface. The instrument parameters are as follows: sheath gas flow rate 30 (arbitrary units), aux gas flow rate 10 (arbitrary units), sweep gas flow rate 3 (arbitrary units), spray voltage 3 kV, capillary temperature 325°C, capillary voltage −25 V, tube lens voltage −50 V. The scan range was set to 80–1000 m/z, with a maximum inject time of 250 ms, resolution of 100,000 at 1 Hz, and AGC (automatic gain control) target 1E6. The data were analyzed using the MAVEN software suite 55.
Quantification of intracellular glutathione, glutathione disulfide, cysteine and cystine levels by HPLC-MS.
In order to accurately quantify the intracellular levels of labile thiol species we applied a modified extraction and sample derivatization procedure optimized to prevent oxidation prior to analysis. Cells cultured as above were quickly washed in 1 mL ice-cold PBS and then extracted once in 500 μL of an ice-cold extraction buffer consisting of 40% methanol, 40% acetonitrile and 20% water containing 100 mM formic acid and 1 mM EDTA; the addition of acid prevents the formation of the highly reactive thiolate anion, while the EDTA prevents oxidation due to metal ions. The levels of glutathione and cysteine were maintained for at least 48 hours under these conditions.
These extracts were derivatized with benzyl chloroformate (which reacts with thiols as well as amines) as above but with a different standard mixture [U-13C-15N-cysteine, 1 μg/mL; U-13C-15N-cystine, 10 μg/mL; 2×13C-1×15N-glutathione (labeled on the glycine carbons and nitrogen), 50 μg/mL; 4×13C-2×15N-glutathione disulfide. Analyte concentrations were quantified by comparison to standard curves prepared by the same method. To determine intracellular concentrations, the total cell volume on replicate plates was determined using packed cell volume tubes.
[3-2H] glucose-labelling, metabolite extraction, gas chromatography-mass spectrometry (GC-MS) analysis, and isotopomer spectral analysis (ISA).
The contribution of oxidative PPP flux to lipogenic NADPH was determined as previously described 56. Briefly, cells were cultured in 25mM [3-2H] glucose (Omicron Biochemicals, Inc.) for 48 hours prior to extraction. On the day of extraction, cells were rinsed with saline solution and quenched with 500μL −20°C methanol. This was followed by addition of 200 μL 4°C water (containing the internal standard norvaline) and 500 μL −20°C chloroform. The extracts were vortexed for 10 minutes and centrifuged at 21,000xg for 10 minutes at 4°C.The lower organic phase was isolated and dried for storage at −20°C. The organic phase was derivatized to form fatty acid methyl esters (FAMEs) via addition of 500 μL 2% H2SO4 in methanol and incubation at 50°C for 2 hours. FAMEs were extracted by addition of 100 μL saturated salt solution and 500 μL hexane. FAMEs were then analyzed using a Select FAME column (100 m × 0.25mm i.d.) installed in an Agilent 7890A GC interfaced with an Agilent 5975C MS. GC oven was held at 80°C for 1 minute after injection, increased to 170°C at 20°C/min, increased to 188°C at 1°C/min, and finally increased to 250°C at 20°C/min and held for 10 minutes. Isotopomer spectral analysis (ISA) was performed to estimate the fractional contribution of 2H from the tracer to the cytosolic NADPH pool and the fraction of newly synthesized fatty acid (palmitate). These parameters and their 95% confidence intervals were calculated using a best-fit model from INCA MFA software 57.
Glucose consumption and oxidative PPP flux calculations.
Cells were seeded in 6-well plates and allowed to attach overnight, then given 2 mL of fresh medium containing 25 mM 1,2-13C2-glucose. Aliquots of this medium were frozen and stored for analysis to determine initial glucose concentrations, and cells in replica plates were trypsinized and counted to determine initial cell numbers. After 24 hours, the spent medium was extracted as above and frozen until analysis, and the cells were trypsinized and counted to determine the final cell numbers.
For lactate isotopomer analysis the samples were analyzed directly. The relative quantities of M0, M1, M2 and M3 lactate were corrected for natural carbon-13 abundance using the IsoCorrectoR software package 58 and the oxidative PPP shunting ratio was calculated by taking the ratio M1/(M1+M2) 59; since there is no difference in growth rates between the 786-O-EV and 786-O-SLC7A11 cell lines we assume that the biosynthetic demand for ribose-5-phosphate or any other PPP intermediate is the same in each case, so any increase in this ratio should only reflect an increase in NADPH production by the oxidative PPP.
For glucose quantitation the samples were mixed with an equal volume a U-13C6-glucose internal standard in water (2.5 mM) prior to analysis. Glucose levels were determined by taking the ratio of the areas between the 1, 2-13C2-glucose and U-13C6-glucose peaks and comparing to a standard curve of glucose prepared in the same fashion. Glucose consumption rates were determined essentially according to the method as previously described 59, and assume that the rate of spontaneous glucose decomposition under these conditions is trivial. Oxidative PPP overflow fluxes were determined by multiplying each samples glucose consumption rate by the oxidative PPP shunting ratio.
Deuterium-labeled 2-deoxyglucose labeling of NADPH.
Cells were seeded in 35 mm dishes and allowed to attach overnight, then given 2 mL of fresh medium containing 2 mM 2-deoxy-D-[1-2H] glucose with or without glucose. After 2 hours, the cells were extracted using the optimized NADPH extraction method as previously described 60. For analysis, the mass spectrometry settings were altered in order to optimize the relative quantitation of the M1 NADPH species according to Su et al. 61: the resolution was set to the “Medium” setting (10,000 at 10 Hz) and the scan range restricted to 730–760 m/z. NADPH peaks were extracted and corrected for natural carbon-13 abundance using the IsoCorrectoR software package 58, and any remaining M1 signal after this correction was considered to represent deuterium labeling of the redox-active hydrogen.
Gene expression correlation and survival analysis in TCGA cancers.
The expression data of SLC7A11 and glucose metabolism genes, and patient survival data in 33 cancer types were obtained from TCGA. All these data were generated using the UCSC Xena Browser (http://xena.ucsc.edu/). Pearson’s or Spearman’s correlation (two-sided) analysis was used to determine the expression correlation between SLC7A11 and glucose metabolism genes. P values were calculated by correlation test and adjusted by Benjamini-Hochberg method. The survival analysis was conducted on the basis of singular or combined expression of SLC7A11 and glucose metabolism genes. For the survival analysis with combined expression of SLC7A11 and certain glucose metabolism genes, survival was compared between two groups of patients separated by the expression of both glucose metabolism gene (G6PD, PGD, or SLC2A1) and SLC7A11 using unsupervised clustering; Group 1 had higher expression of SLC7A11 and glucose metabolism gene, while Group 2 had lower expression of SLC7A11 and glucose metabolism gene. The survival impact of different signatures was analyzed in R using the Kaplan-Meier method with a Cox proportional hazards model. The independent samples’ numbers of cancer types are following : ACC=79; BLCA=407; BRCA=1097; CESC=303; CHOL=36; COAD=286; DLBC=48; ESCA=184; GBM=154; HNSC=520; KICH=66; KIRC=533; KIRP= 290; LAML=173; LGG=516; LIHC=371; LUAD=514; LUSC=502; MESO=87; OV=303; PAAD=178; PCPG=179; PRAD=497; READ=94; SARC=259; SKCM=103; STAD=415; TGCT=150; THCA=505; THYM=120; UCEC=176; USC=57; UVM=80. The abbreviations of cancer types: BLCA, Bladder Urothelial Carcinoma; CHOL, Cholangiocarcinoma; ESCA, Esophageal carcinoma; HNSC, Head and Neck squamous cell carcinoma; KIRC, Kidney renal clear cell carcinoma; KIRP, Kidney renal papillary cell carcinoma; LIHC, Liver hepatocellular carcinoma; LUAD, Lung adenocarcinoma; LUSC, Lung squamous cell carcinoma.
Pharmacokinetic assay.
To measure the pharmacokinetic data of GLUT inhibitor KL-11743, CD1 mice were intraperitoneally injected with dosage of 100 mg/kg KL-11743 in vehicle (0.5% methylcellulose/ 0.25% Tween-80 in water). Then serial sampling of blood were collected at 0.25, 1, 2, 4, 8, 12, and 24 hour time points. Plasma concentrations of GLUT inhibitor were then measured by HPLC/MS/MS.
Xenograft experiments.
All the xenograft experiments were performed in accordance with a protocol approved by the Institutional Animal Care and Use Committee and Institutional Review Board at The University of Texas MD Anderson Cancer Center. The study is compliant with all relevant ethical regulations regarding animal research. Patient-derived xenografts (PDXs) were generated in accordance with protocols approved by the institutional review board at The University of Texas MD Anderson Cancer Center. Informed consent was obtained from the patients, and the study is compliant with all relevant ethical regulations regarding research involving human participants. Information on human research participants (age, gender, genotypic information, diagnosis, and treatment categories) used in PDXs is listed in Supplementary Table 4. 4 to 6-week-old athymic nude mice (Foxn1nu/Foxn1nu) were used for cell line xenograft experiments. Cancer cell lines were resuspended in FBS free DMEM and the same amount of cells were injected into mice subcutaneously. NOD scid gamma (NSG) mice were used for PDX experiments as previously described 62. Briefly, PDX tumors in cold DMEM media were minced into fragments 1–2 mm3 in volume. Then each PDX tumor fragment was subcutaneously inoculated into the dorsal flank of NSG mice. For both cell line xenograft and PDX experiments, the mice were monitored for tumor growth by bi-dimensional tumor measurements. The tumor volume was calculated according to the equation v = length*width2*1/2. When the tumors had grown to around 50–100 mm3 in volume, the mice were assigned randomly into two groups (n > 5/group) and treated with 100mg/kg KL-11743 or vehicle (0.5% methylcellulose/ 0.25% Tween-80 in water) by intraperitoneal administration every two days.
To measure metabolites in xenograft tumors, after mice were treated with GLUT inhibitor for 5 hours, tumor samples were harvested by excising the full tumor and rapidly transferring it into a pre-weighed tube, which was snap-frozen in liquid nitrogen and stored on dry ice until extraction. Metabolite extraction was carried out using a modified version of the tissue extraction method as previously described 60. Briefly, tumors were thawed on ice and extracted twice by homogenization in 10 μL/mg of extraction solvent (40: 40: 20 for methanol: acetonitrile: water containing 100 mM formic acid) with five 30-second rounds of homogenization on a refrigerated BeadMill 24 (Fisher Scientific) with a 30-second cooling period in between each round. After each extraction, extracts were neutralized with 8.7 μL of 15% ammonium bicarbonate per 100 μL solvent, centrifuged 3 minutes at 13,000 RCF and 4°C, pooled in a fresh tube and clarified by a final 10 minute centrifugation. For determining NADPH levels, an aliquot of the extract was analyzed directly by LC-MS; for all other metabolites, the samples were first dried under nitrogen flow and then resuspended in 100 μL water per 500 μL extract prior to analysis.
Histopathological analysis.
Mouse tissue or xenograft tumor samples were collected, fixed, and subjected for embedding and hematoxylin and eosin staining as previously described 63, 64. All the histopathological analyses were conducted by Dr. James You, a board certified pathologist.
Statistics and reproducibility.
Pearson’s or Spearman’s correlation (two-sided) was performed using R software to determine the expression correlation between SLC7A11 and glucose metabolism genes in Fig. 2f–h and Extended Data Fig. 2e–g. P values in these figures were calculated by correlation test and adjusted by Benjamini-Hochberg method. For survival analysis of the TCGA data set in Fig. 2i–k and Extended Data Fig. 2h, the log-rank Mantel–Cox test (two-sided) was carried out using R software. For patient clustering in Fig. 2i–k and Extended Data Fig. 2h, k-means clustering was conducted with option k=2 in R software. Statistical analysis (two-tailed Student’s t-test) of bar graphs and scatter plots in this manuscript were performed using GraphPad Prism software.
Reporting summary
Further information on experimental design is available in the Nature Research Reporting Summary linked to this article.
Data availability
Source Data for Figs. 1–6 and Extended Data Figs. 1–7 are provided with the paper. The 33 cancer-type data were derived from the TCGA Research Network: http://cancergenome.nih.gov/. The RNAseq data from PDXs have been deposited in dbGAP under accession number phs001980.v1.p1. All data supporting the findings of this study are available from the corresponding author on reasonable request.
Extended Data
Extended Data Fig. 1. The effect of SLC7A11 overexpression on glutamate, TCA cycle and glycolysis metabolites, and the expression levels of PPP enzymes.
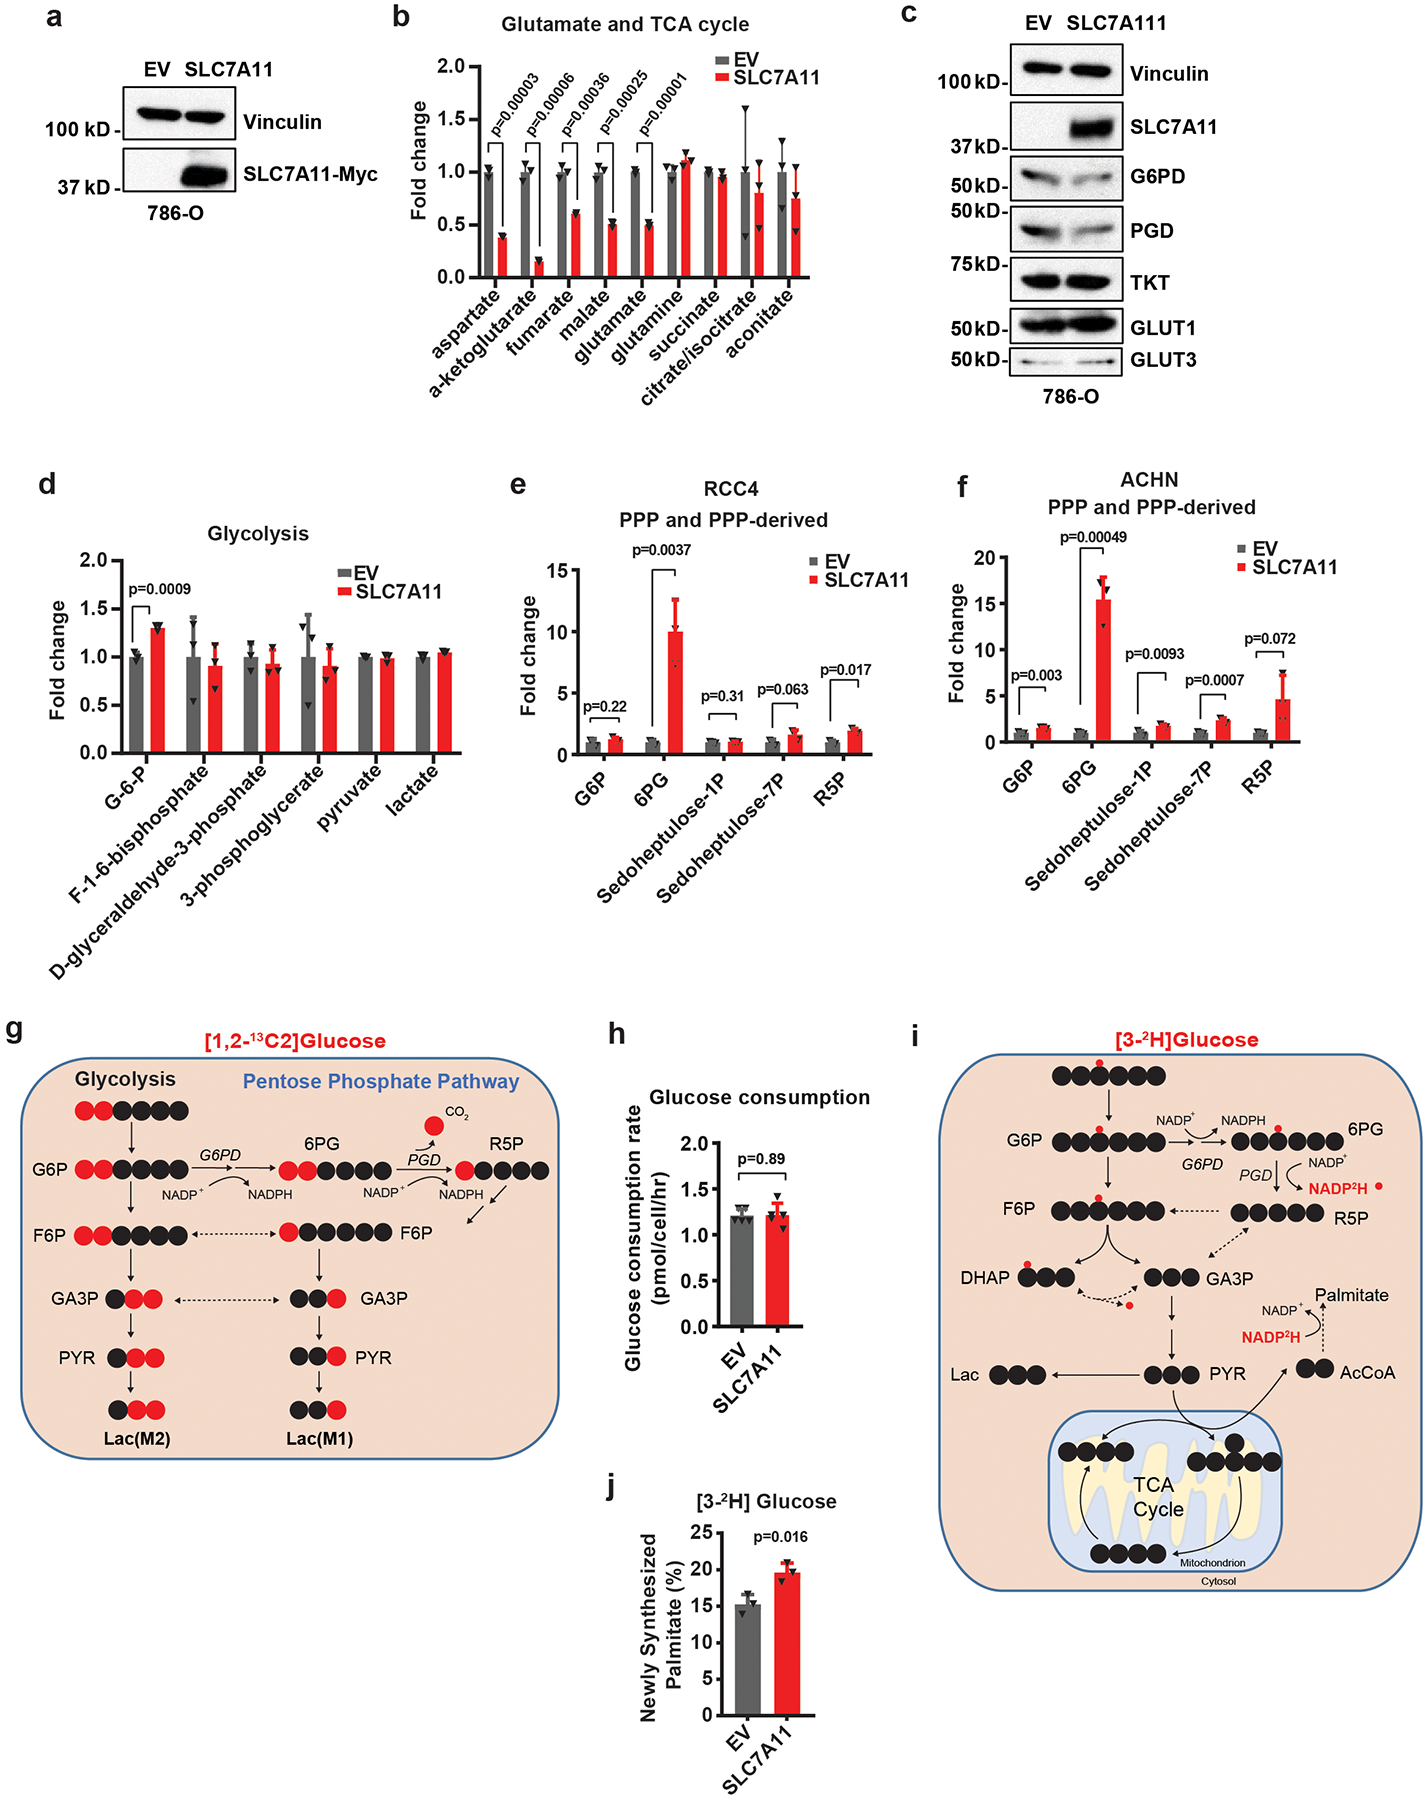
a, Western blotting showing Myc-tagged SLC7A11 expression in 786-O cells. The experiment was repeated five times, independently, with similar results. b, Bar graph showing relative fold changes of glutamate and TCA cycle metabolites in EV and SLC7A11-overexpressing 786-O cells. n=3 independent experiments. c, Western blotting showing indicated protein levels in EV and SLC7A11-overexpressing 786-O cells. The experiment was repeated twice, independently, with similar results. d, Bar graph showing relative fold changes of glycolysis metabolites in EV and SLC7A11-overexpressing 786-O cells. n=3 independent experiments. e,f, Bar graph showing the fold changes of PPP and PPP-derived intermediates induced by SLC7A11 overexpression in RCC4 or ACHN cells. n=3 independent experiments. g, Simplified schematic of glycolysis and the PPP, showing 13C labeling patterns resulting from 1,2-13C2 glucose. Red fills indicate 13C atoms. h, Glucose consumption rates in EV and SLC7A11-overexpressing 786-O cells. n=5 independent experiments. i, Simplified schematic showing the sequential transfer of deuterium labels at position 3 of glucose to NADPH and then newly synthesized palmitic acid. Red circles indicate positional deuterium labels. j, Newly synthesized deuterium labelled palmitate in EV and SLC7A11-overexpressing 786-O cells. n=3 independent experiments. In (j), data are plotted as mean ±95% confidence interval (CI). Other error bars are mean ± s.d.. All p values were calculated using two-tailed unpaired Student’s t-test. Detailed statistical tests are described in the Methods. Scanned images of unprocessed blots are shown in Source Data Extended Data Fig. 1. Numeral data are provided in Statistics Source Data Extended Data Fig. 1.
Extended Data Fig. 2. G6PD knockdown sensitizes cancer cells to glucose limitation and SLC7A11 expression correlates with PPP gene expression in human cancers.
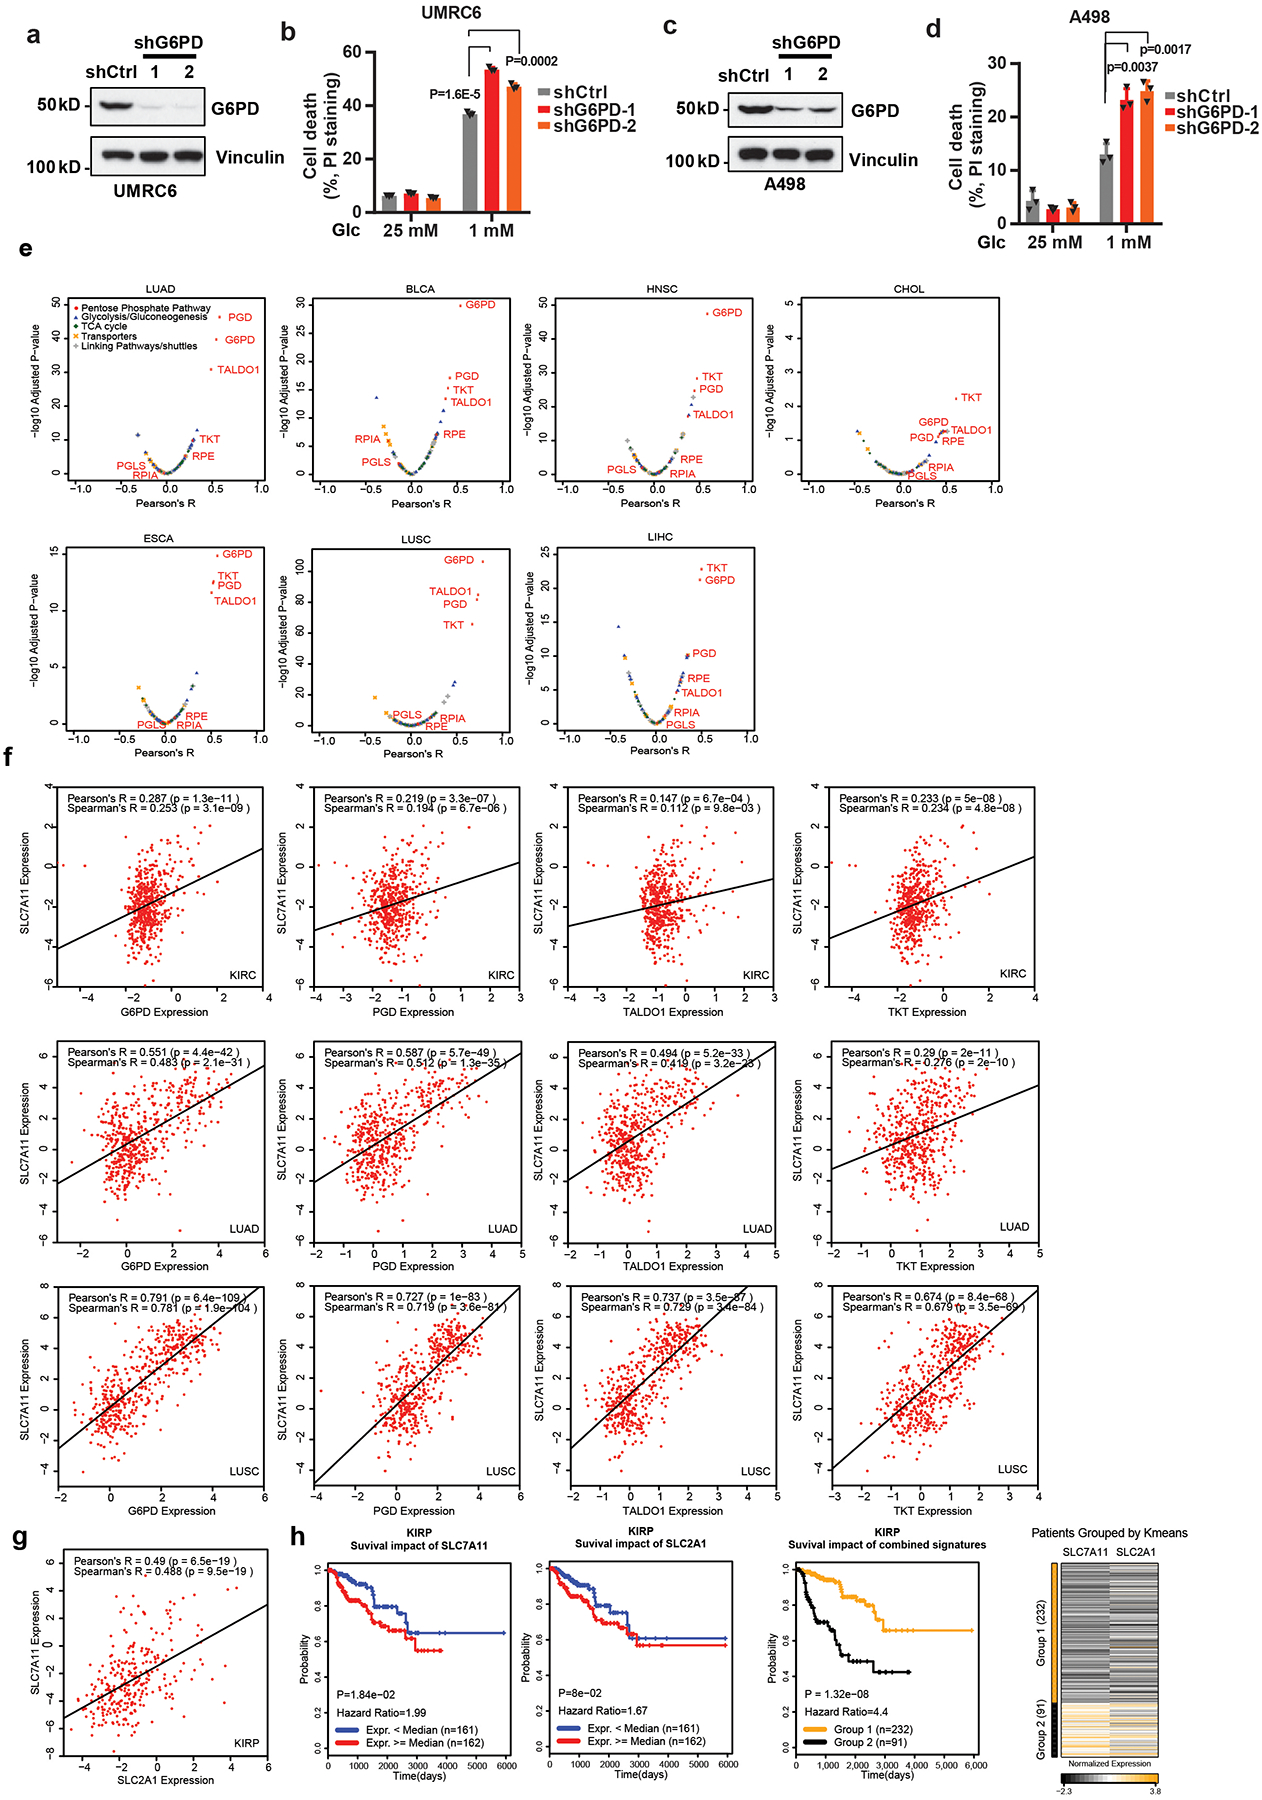
a, c, G6PD protein levels in control shRNA (shCtrl) and G6PD knockdown (shG6PD) UMRC6 (a) and A498 cells (c). The experiments were repeated twice, independently, with similar results. Scanned images of unprocessed blots are shown in Source Data Extended Data Fig. 2. b, d, Cell death analyzed by PI staining in indicated cells cultured in 25 or 1 mM glucose for 24 hours. Error bars are mean± s.d., n=3 independent experiments, p values were calculated using two-tailed unpaired Student’s t-test. e, Compared to other glucose metabolism genes, PPP genes show significant positive correlations with SLC7A11 in LUAD(n=514), BLCA(n=407), HNSC(n=520), CHOL(n=36), ESCA(n=184), LUSC(n=502), and LIHC(n=371). f, Scatter plots showing the correlations between SLC7A11 and 4 PPP genes (G6PD, PGD, TALDO1, and TKT) in KIRC(n=533), LUAD(n=514), and LUSC(n=502), respectively. g, Scatter plots showing the correlations between SLC7A11 and SLC2A1 in KIRP(n=290). h, Kaplan–Meier plots of KIRP patients stratified by SLC7A11 and SLC2A1 expression levels, respectively (left 2 panels); Kaplan–Meier plots of KIRP patients stratified by unsupervised clustering on SLC7A11 and SLC2A1 expression (right 2 panels). Group 1 has lower SLC7A11 and SLC2A1 expression, while Group 2 has higher SLC7A11 and SLC2A1 expression. Detailed statistical tests of b, d and f-h are described in the Methods.. Error bars are mean ± s.d, all bar graphs have 3 independent repeats. Numeral data are provided in Statistics Source Data Extended Data Fig. 2.
Extended Data Fig. 3. High expression of SLC7A11 promote disulfide stress, deplete NADPH and causes redox system collapse under glucose deprivation.
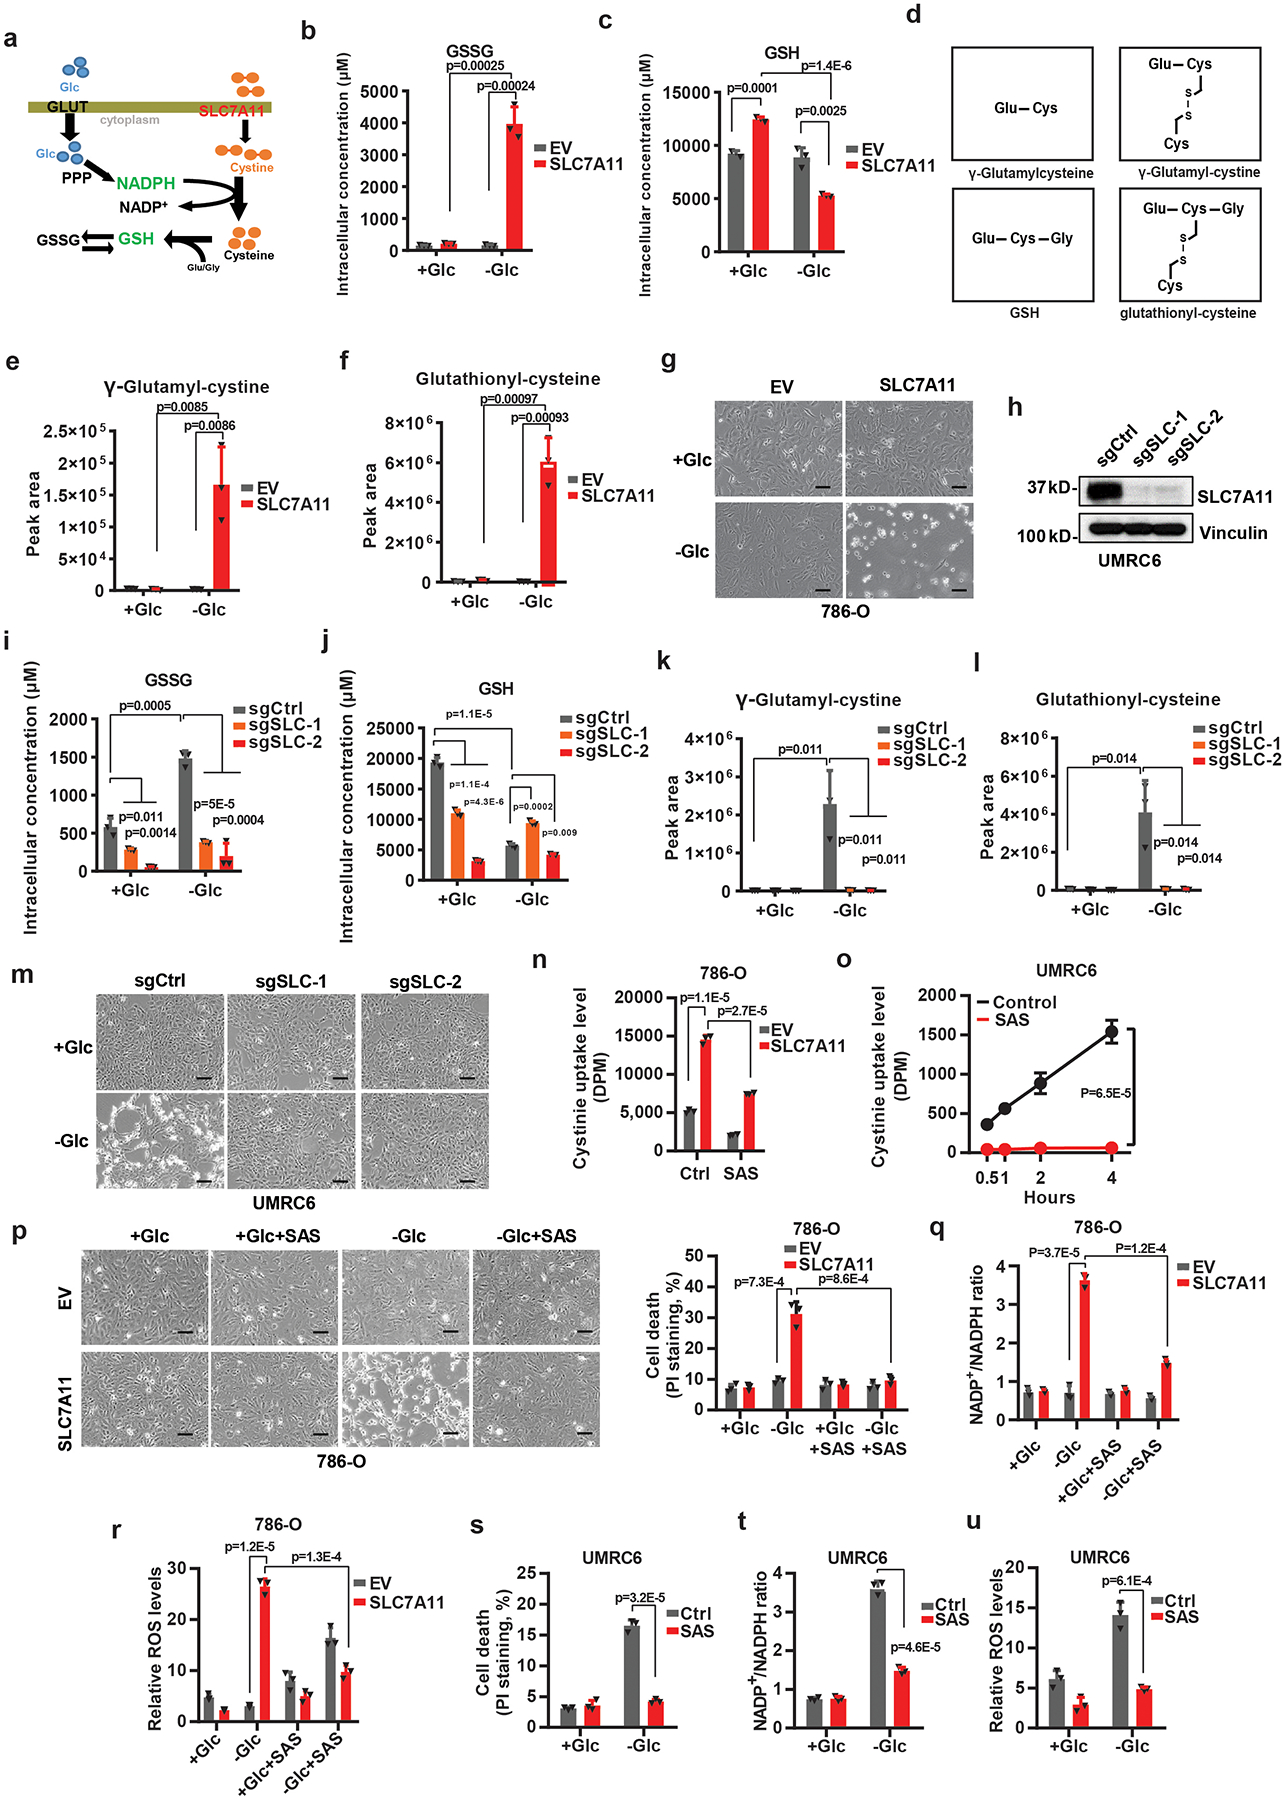
a, Simplified schematic of how SLC7A11 can be linked to NADPH and the PPP. b, c, Measurement of intracellular GSSG (b) and GSH (c) concentrations in EV and SLC7A11-overexpressing 786-O cells cultured with (+Glc) or without glucose (-Glc). d, Diagrams illustrating the structures of γ-glutamylcysteine, γ-glutamyl-cystine, GSH, and glutathionyl-cysteine. Glu: glutamate; Gly: glycine; Cys: cysteine. e, f, The relative levels of intracellular γ-glutamyl-cystine (e) and glutathionyl-cysteine (f) in EV and SLC7A11-overexpressing 786-O cells cultured with (+Glc) or without glucose (-Glc). g, Representative phase-contrast images of indicated cells cultured with or without glucose. h, Western blotting analysis of SLC7A11 protein levels in the control (sgCtrl) and SLC7A11 knockout (sgSLC-1/2) UMRC6 cells. i-l, Measurement of intracellular GSSG (i) and GSH (j) concentrations and the relative levels of intracellular γ-glutamyl-cystine (k) and glutathionyl-cysteine (l) in control (sgCtrl) and SLC7A11 knockout (sgSLC-1/2) UMRC6 cells cultured with (+Glc) or without glucose (-Glc). m, Representative phase-contrast images of indicated cells cultured with (+Glc) or without glucose (-Glc). n, o, Cystine uptake levels in EV and SLC7A11- overexpressing 786-O cells (n) or UMRC6 cells (o) upon treatment with 1 mM sulfasalazine (SAS). p-u, Cell death with or without representative phase-contrast images (p, s), NADP+/NADPH ratios (q, t), and ROS levels (r, u) of EV and SLC7A11- overexpressing 786-O or UMRC6 cells cultured in glucose-containing or glucose free medium with or without treatment of 1 mM SAS. Error bars are mean ± s.d, all bar graphs have 3 independent repeats. All scale bars=100 μm. The experiment (g, h, m, p) was repeated twice, independently, with similar results. All p values were calculated using two-tailed unpaired Student’s t-test. Scanned images of unprocessed blots are shown in Source Data Extended Data Fig. 3. Numeral data are provided in Statistics Source Data Extended Data Fig. 3.
Extended Data Fig. 4. Cystine deprivation or 2DG reverses redox defects and prevents cell death upon glucose starvation.
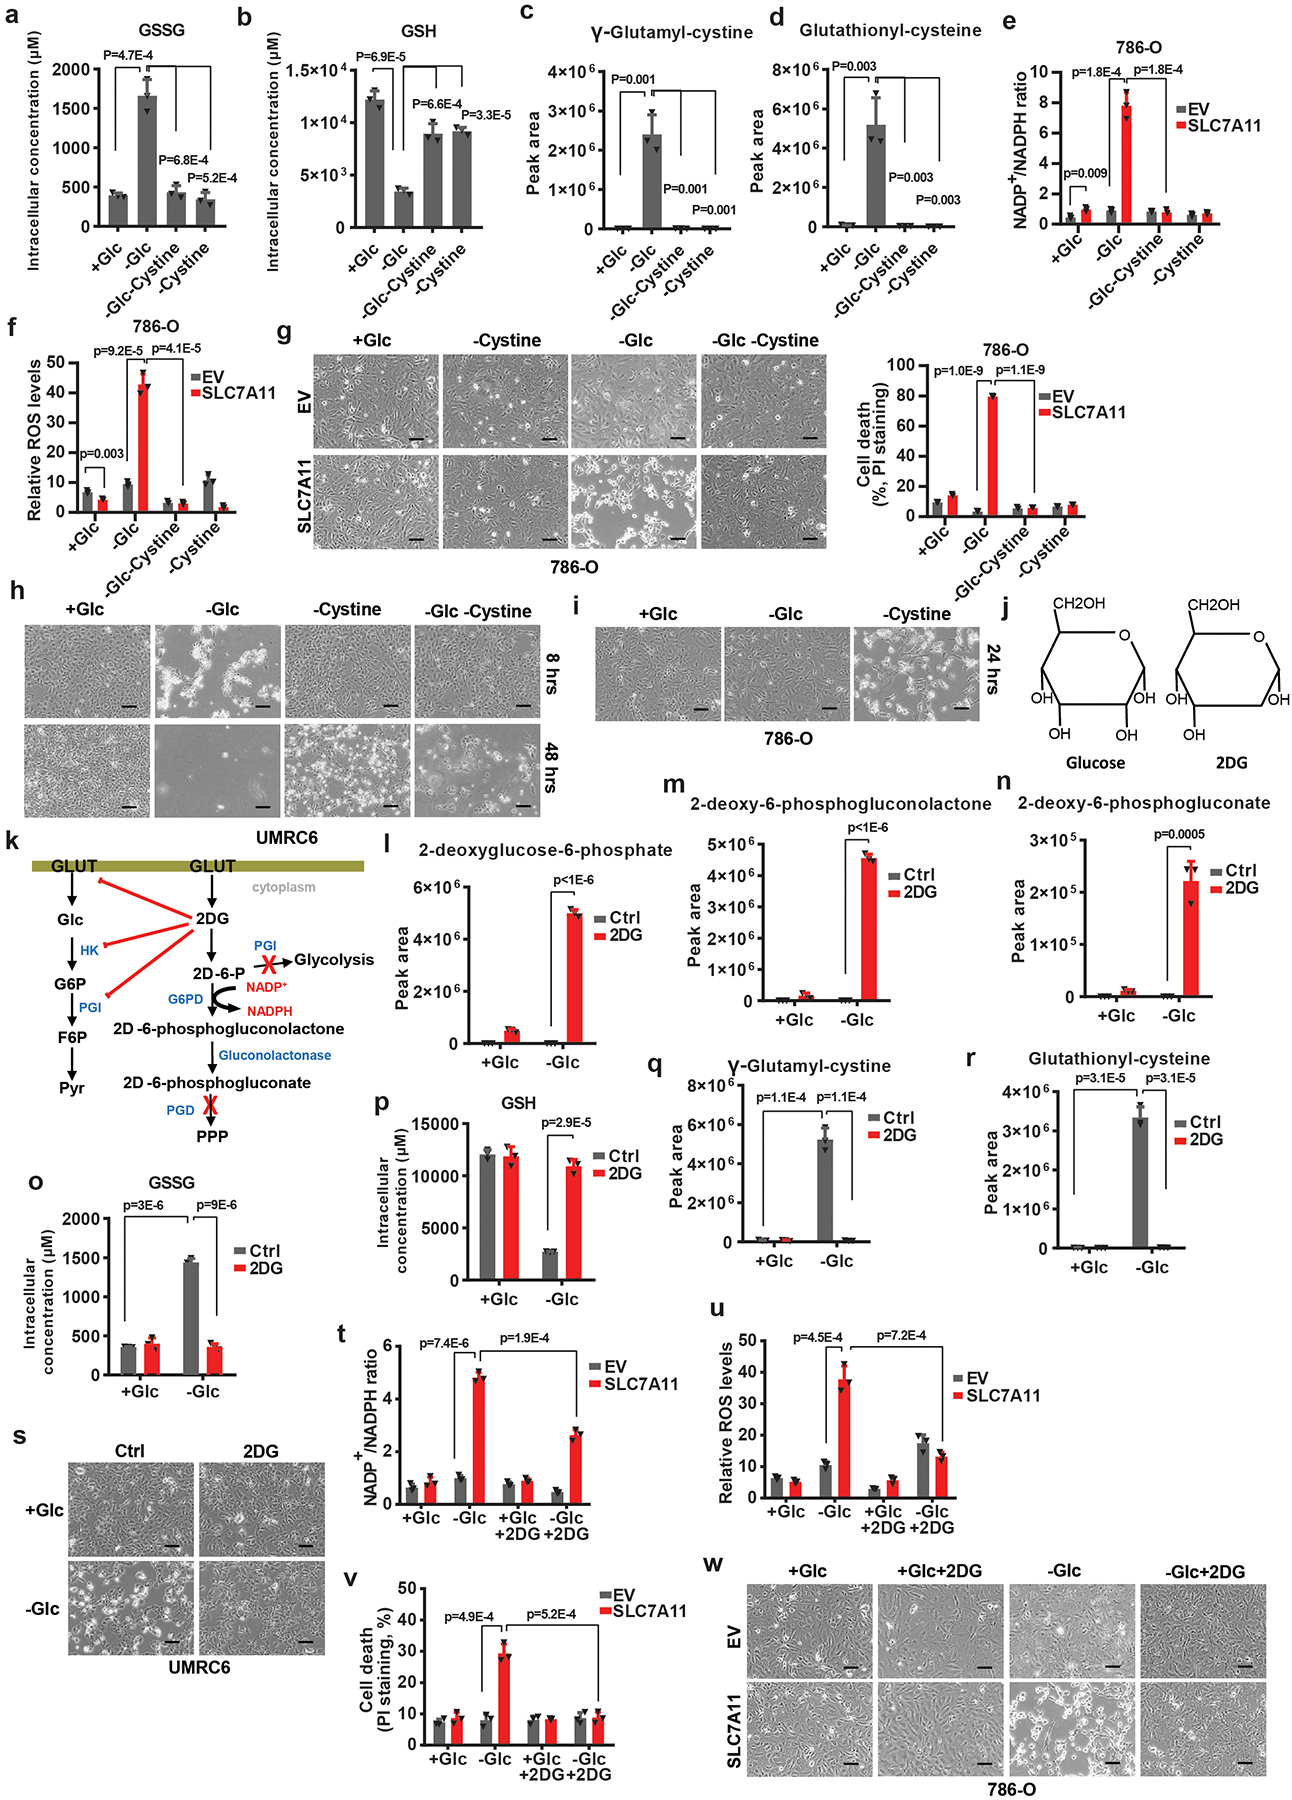
a-d, Measurement of intracellular GSSG (a) and GSH (b) concentrations, and the relative levels of intracellular γ-glutamyl-cystine (c) and glutathionyl-cysteine (d) in UMRC6 cells cultured with normal (+Glc), glucose free (-Glc), glucose/cystine double free (-Glc-Cystine), or cystine free (-Cystine) medium. e, f, Measurement of NADP+/NADPH ratios (e), and ROS levels (f) in EV and SLC7A11-overexpressing 786-O cells cultured with indicated medium. g-i, Representative phase-contrast images and cell death of indicated cells cultured with indicated medium. j, k, Diagrams illustrating the structure (j) and metabolism (k) of glucose and 2DG. l-n, The relative levels of intracellular 2-deoxyglucose-6-phosphate (l), 2-deoxy-6-phosphogluconolactone (m) and 2-deoxy-6-phosphogluconate (n) in UMRC6 cells cultured in glucose-containing or glucose free medium with or without treatment of 2 mM 2DG. o-r, Measurement of intracellular GSSG (o) and GSH (p) concentrations, and the relative levels of intracellular γ-glutamyl-cystine (q) and glutathionyl-cysteine (r) in UMRC6 cells cultured in glucose-containing or glucose free medium with or without treatment of 2 mM 2DG. s, Representative phase-contrast images of UMRC6 cells cultured in glucose-containing or glucose free medium with or without treatment of 2 mM 2DG. t-w, Measurement of NADP+/NADPH ratios (t), ROS levels (u), cell death (v) and the representative phase-contrast images (w) of EV and SLC7A11-overexpressing 786-O cells cultured in glucose-containing or glucose-free medium with or without treatment of 2 mM 2DG. The experiments (g, h, i, s, w) were repeated twice, independently, with similar results. All error bars are mean± s.d., n=3 independent experiments. All scale bars=100 μm. All p values were calculated using two-tailed unpaired Student’s t-test. Numeral data are provided in Statistics Source Data Extended Data Fig. 4.
Extended Data Fig. 5. Preventing disulfide but not ROS accumulation rescues redox defects and cell death in SLC7A11-overexpressing cells under glucose starvation.
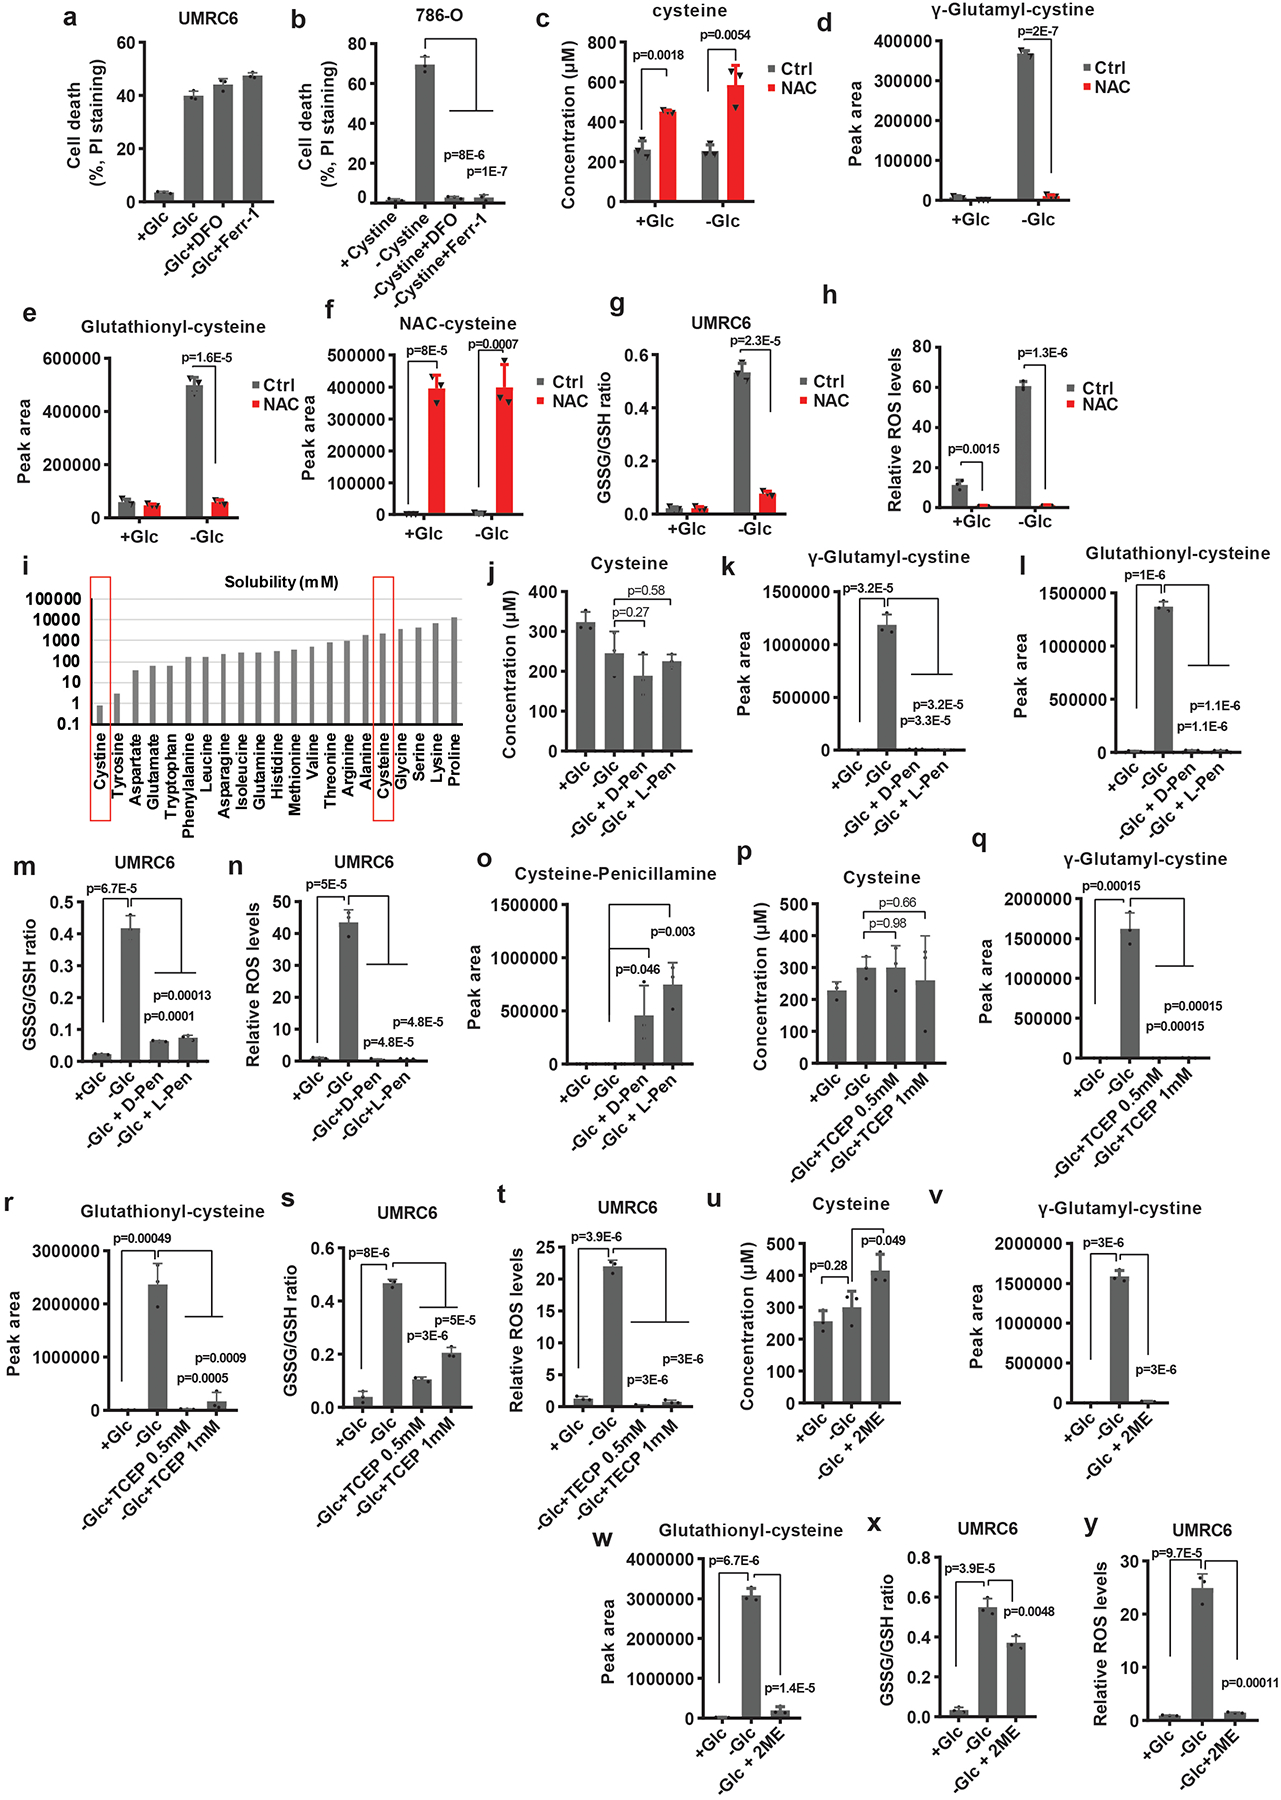
a, b, Measurement of cell death of UMRC6 or 786-O cells cultured in glucose-containing, glucose-free medium or cystine-free medium with or without treatment of 100 μM DFO or 10 μM Ferrostatin-1. c-h, Measurement intracellular levels of cysteine (c), the relative levels of intracellular γ-glutamyl-cystine (d), glutathionyl-cysteine (e), NAC-cysteine (f), GSSG/GSH ratio (g) and ROS levels (h) of UMRC6 cells cultured in glucose-containing or glucose-free medium with or without treatment of 2 mM NAC. i, The solubility of different amino acids. j-n, Measurement intracellular levels of cysteine (j), the relative levels of intracellular γ-glutamyl-cystine (k), glutathionyl-cysteine (l), GSSG/GSH ratio (m) and ROS levels (n) of UMRC6 cells cultured in glucose-containing or glucose-free medium with or without treatment of TCEP. o-t, Measurement intracellular levels of cysteine (o), the relative levels of intracellular γ-glutamyl-cystine (p), glutathionyl-cysteine (q), GSSG/GSH ratio (r), ROS levels (s) and Cysteine-penicillamine (t) of UMRC6 cells cultured in glucose-containing or glucose-free medium with or without treatment of 2 mM D-Penicillamine or L-Penicillamine. u-y, Measurement intracellular levels of cysteine (u), the relative levels of intracellular γ-glutamyl-cystine (v), glutathionyl-cysteine (w), GSSG/GSH ratio (x) and ROS levels (y) of UMRC6 cells cultured in glucose-containing or glucose-free medium with or without treatment of 1 mM 2ME. Except i, all other error bars are mean± s.d., n=3 independent experiments. All p values were calculated using two-tailed unpaired Student’s t-test. Detailed statistical tests are described in the Methods. Numeral data are provided in Statistics Source Data Extended Data Fig. 5.
Extended Data Fig. 6. Cancer cells with high SLC7A11 expression are sensitive to GLUT inhibition.
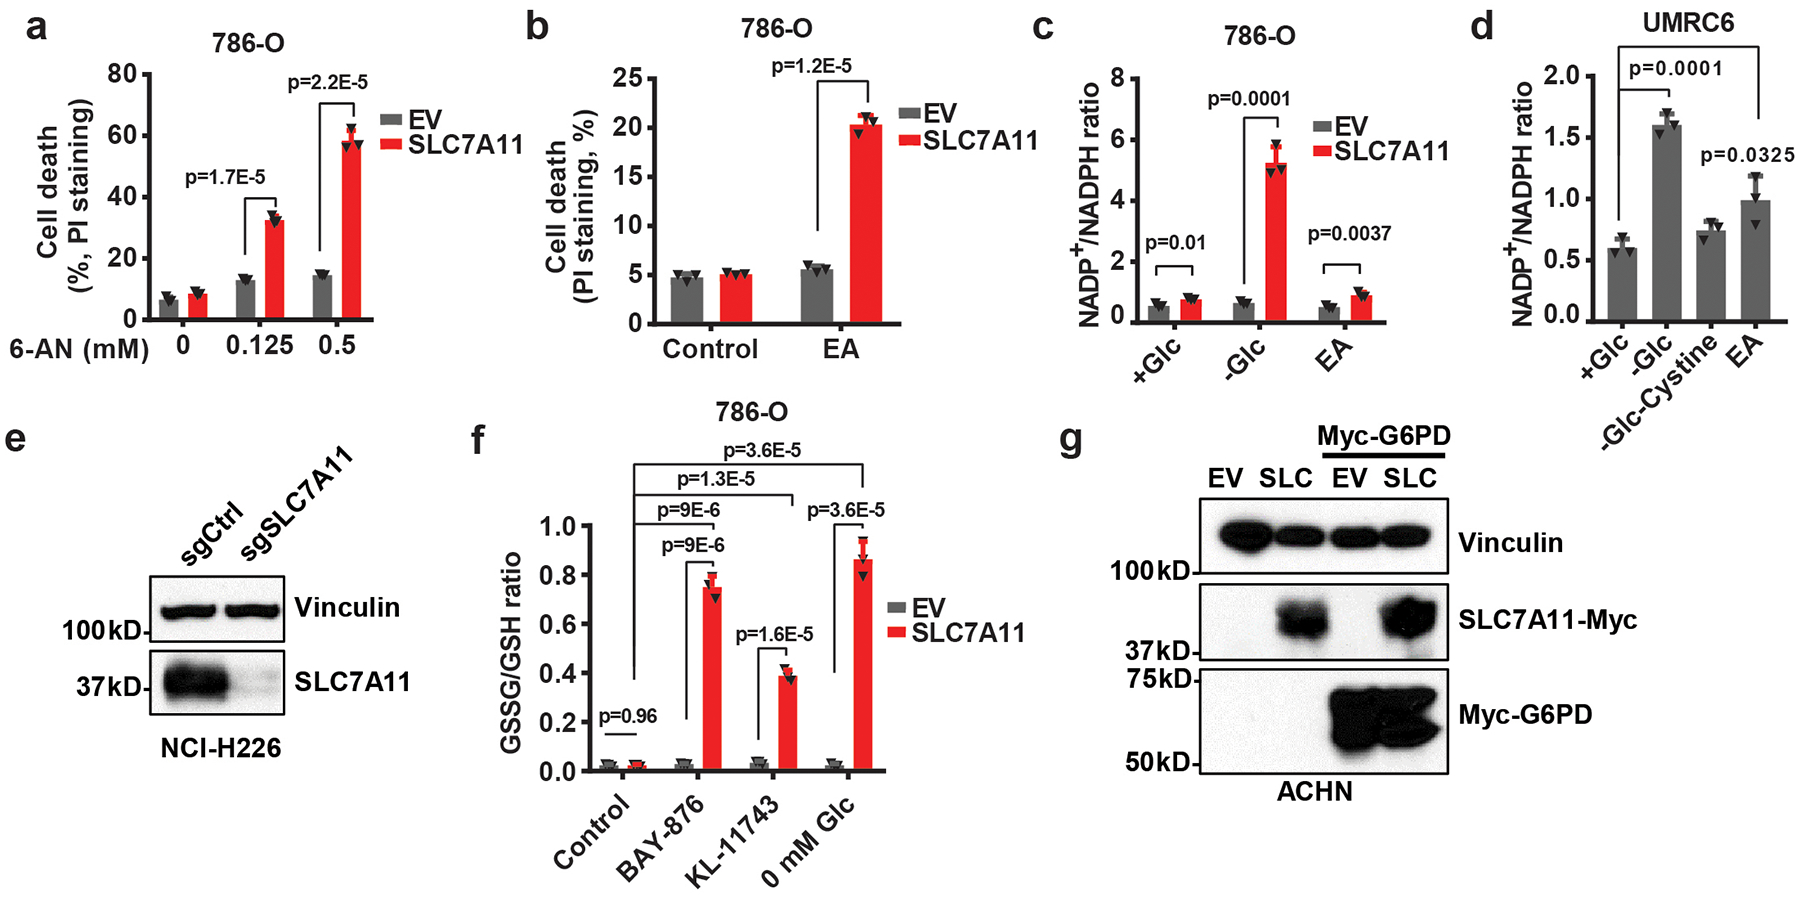
a, Cell death of EV and SLC7A11- overexpressing 786-O cells treated with 0.125–0.5 mM 6-AN. b, Cell death of EV and SLC7A11- overexpressing 786-O cells treated with 0.1 mM epiandrosterone (EA). c, Quantification of NADP+/NADPH ratios in EV and SLC7A11- overexpressing 786-O cells treated with normal (+Glc), glucose free (-Glc) medium, or normal medium containing 0.1 mM EA. d, Quantification of NADP+/NADPH ratios in UMRC6 cells treated with normal (+Glc), glucose free (-Glc), glucose/cystine double free medium (-Glc-Cystine), or normal medium containing 0.1 mM EA. e, SLC7A11 protein levels in control (sgCtrl) and SLC7A11 knockout (sgSLC7A11) NCI-H226 cells were measured by western blotting. The experiment was repeated twice, independently, with similar results. f, Measurement of GSSG/GSH ratios in EV and SLC7A11-overexpressing 786-O cells treated with KL-11743, BAY-876 or cultured in glucose free medium. g, Western blotting analysis of indicated proteins in ACHN cells with SLC7A11 and/or G6PD overexpression. The experiment was repeated twice, independently, with similar results. All error bars are mean± s.d., n=3 independent experiments. All p values were calculated using two-tailed unpaired Student’s t-test. Detailed statistical tests are described in the Methods. Scanned images of unprocessed blots are shown in Source Data Extended Data Fig. 6. Numeral data are provided in Statistics Source Data Extended Data Fig. 6.
Extended Data Fig. 7. SLC7A11-high tumors are sensitive to GLUT inhibitor.
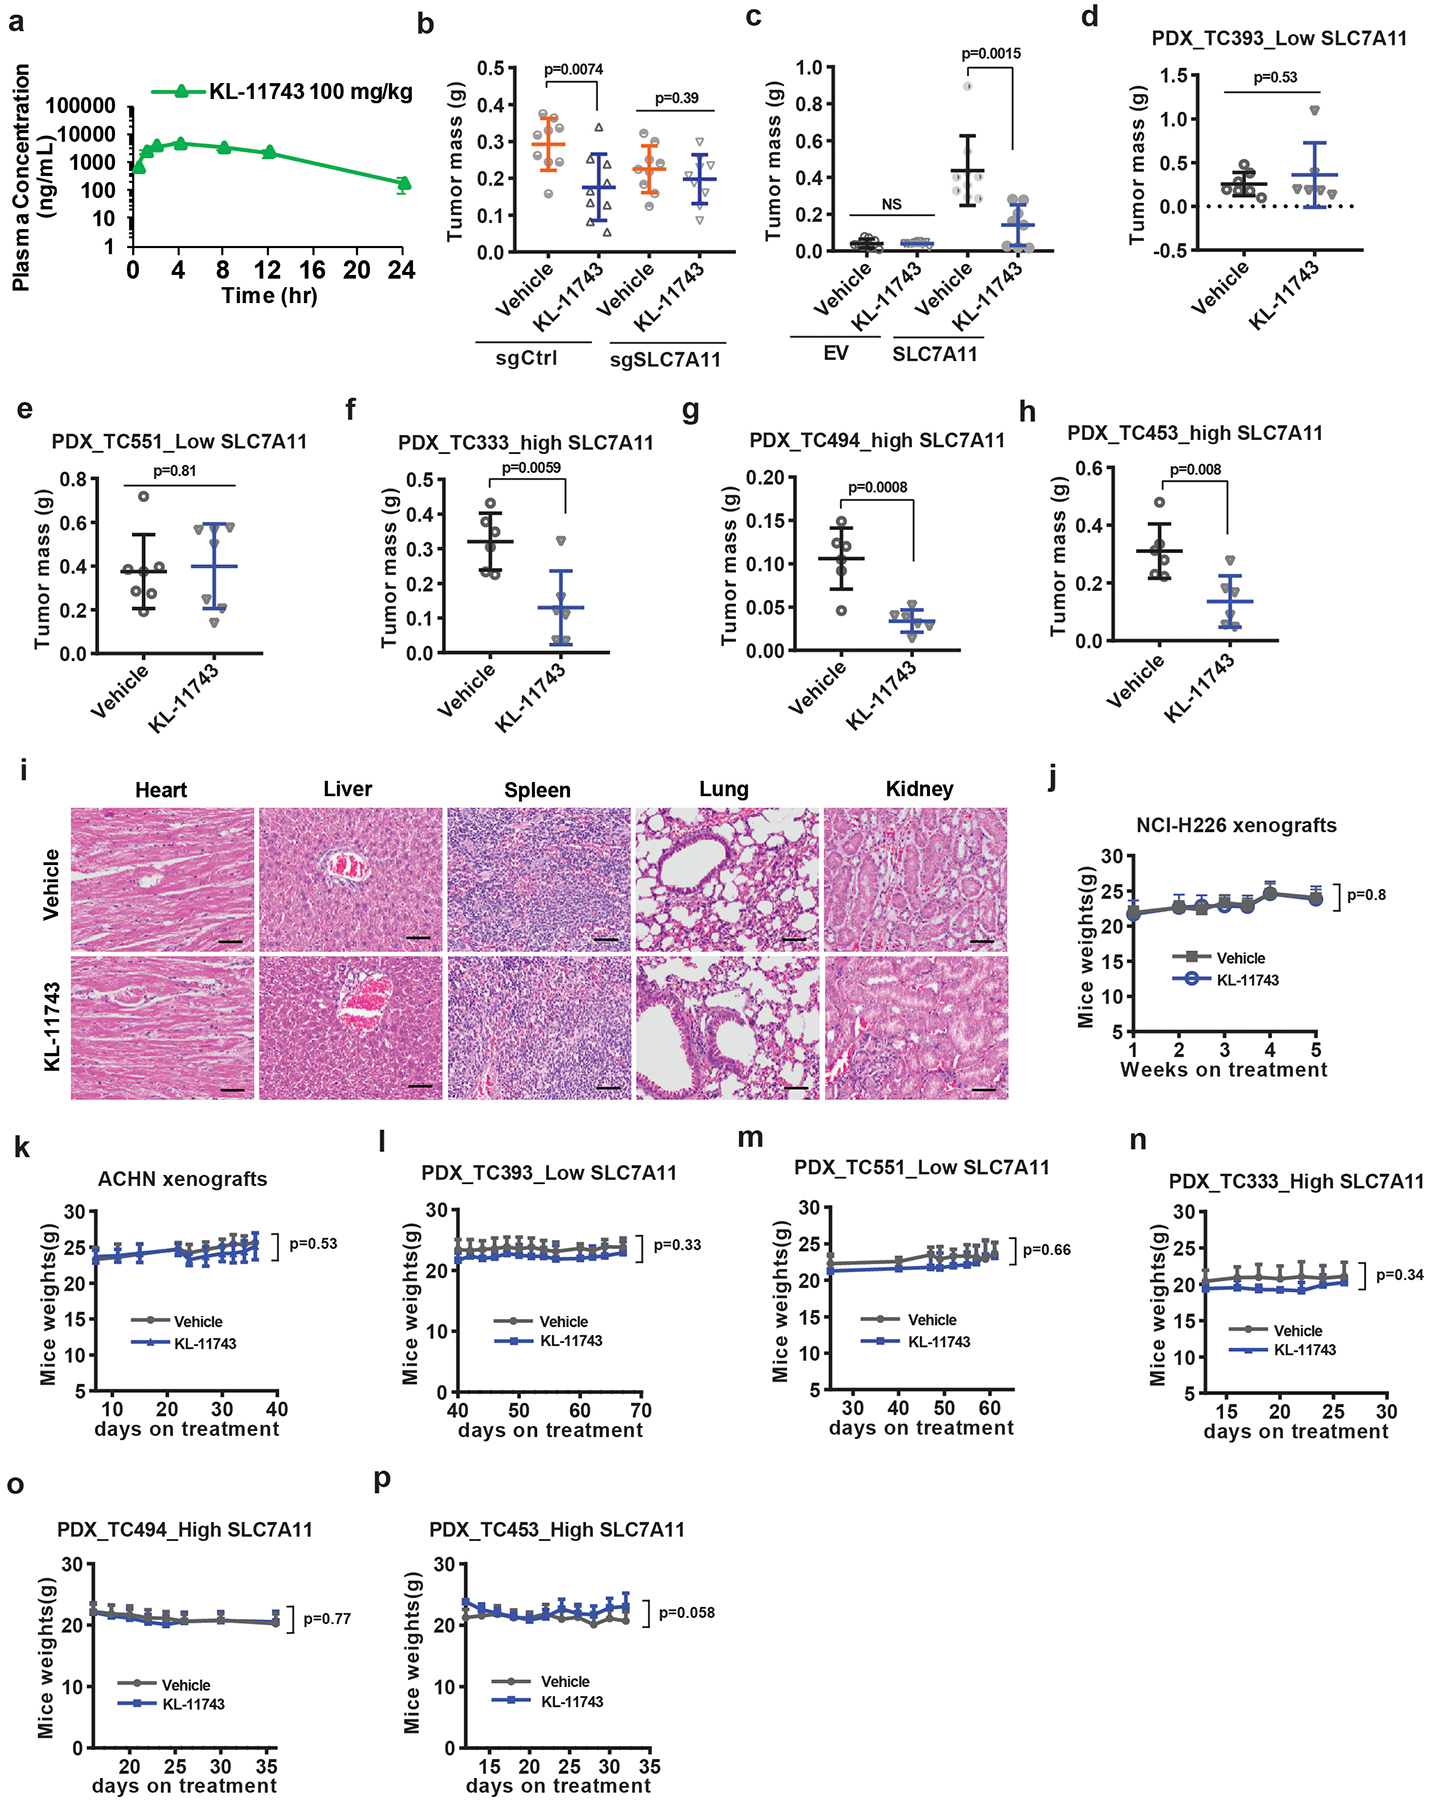
a, Plasma levels of GLUT inhibitor KL-11743 were measured in mice at different time points after intraperitoneal injection. Error bars are mean ± s.d, n=4 independent repeats. b, End-point weights of NCI-H226 xenograft tumors with indicated genotypes treated with KL-11743 or vehicle. Error bars are mean ± s.d., n=9 independent repeats. c, End-point weights of ACHN xenograft tumors with indicated genotypes treated with BAY-876, KL-11743, or vehicle. Error bars are mean ± s.d., n=8 independent repeats. d-h, End-point weights of PDX xenograft tumors with indicated genotypes treated with KL-11743 or vehicle. Error bars are mean ± s.d., n=6 (d: KL-11743, f-h) or7 (d: vehicle, e) independent repeats. i, Representative hematoxylin and eosin staining of major organs from mice treated with vehicle or GLUT inhibitors. The experiment was repeated twice, independently, with similar results. Scale bars=50 μm. j-p, Mice weights of indicated cell line-xenografts or PDXs at different time points treated with KL-11743 or vehicle. Error bars are mean ± s.d., n=6 (l: KL-11743, n-p), 7 (l: vehicle, m), 8 (k) or 9 (j) independent repeats. All p values were calculated using two-tailed unpaired Student’s t-test. Detailed statistical tests are described in the Methods. Numeral data are provided in Statistics Source Data Extended Data Fig. 7.
Extended Data Fig. 8. The working model depicting how SLC7A11 regulates pentose phosphate pathway dependency and glucose-deprivation-induced cell death.
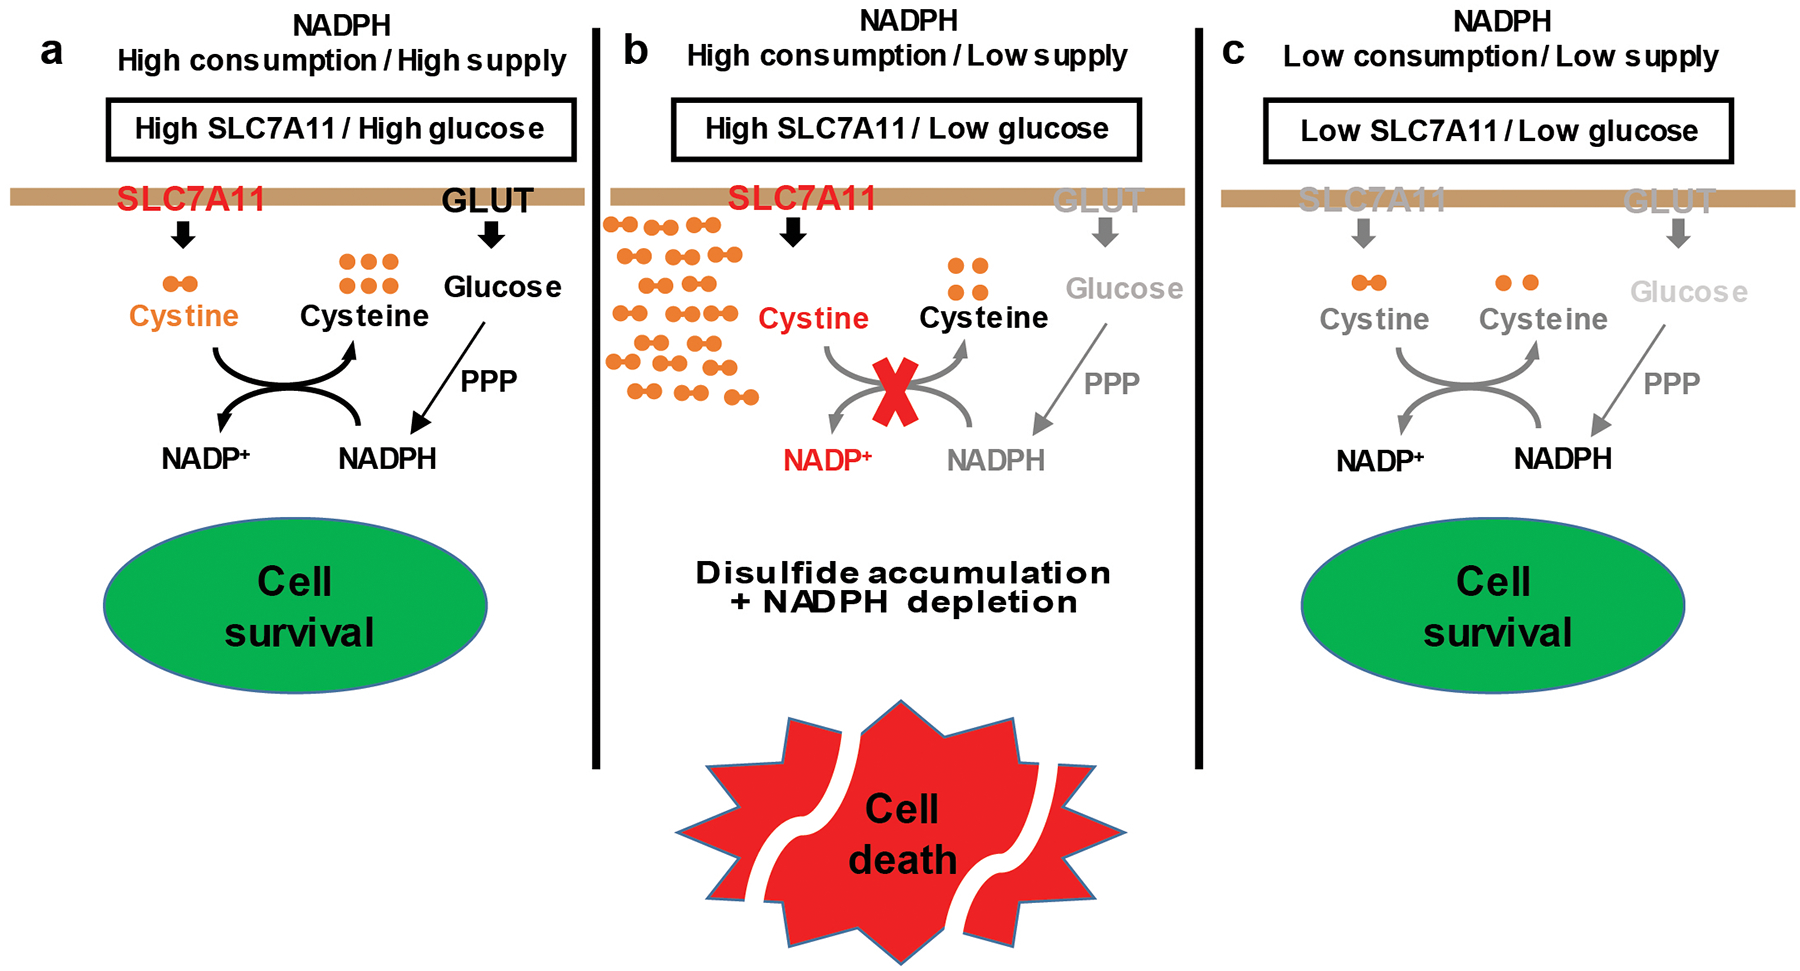
See discussion for detailed description. PPP: pentose phosphate pathway; GLUT: glucose transporter.
Extended Data Fig. 9. An example for the gating strategy of Flow Cytometry.
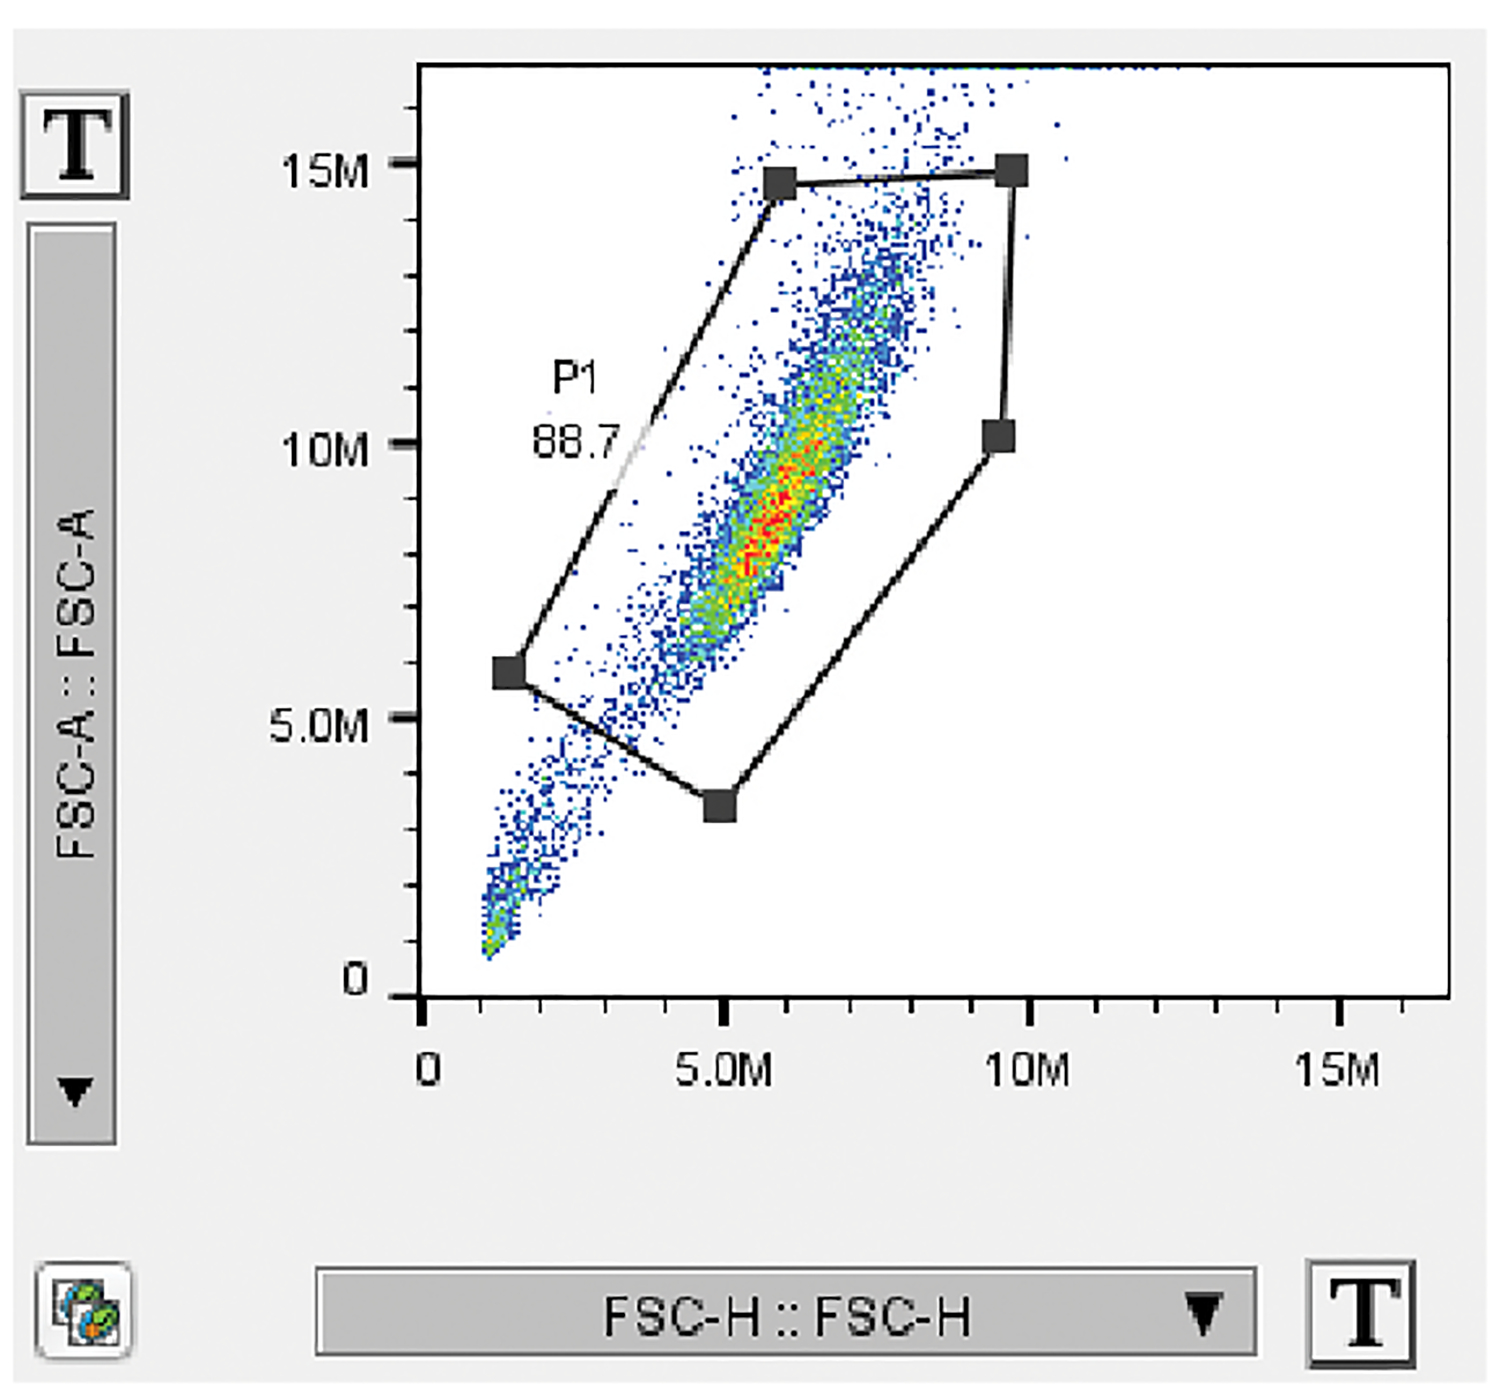
Initial cell population gating (FSC-Area VS FSC-Height) was adopted to make sure only single cells were used for analysis.
Supplementary Material
Supplementary Table 1: Glucose metabolism related genes.
Supplementary Table 2: Summary of various approaches on rescuing redox defects and cell death in SLC7A11-high cancer cells under glucose starvation.
Supplementary Table 3: Oligos and shRNA sequences.
Supplementary Table 4: Information on human research participants (age, gender, genotypic information, diagnosis and treatment categories) of PDXs in this study.
Acknowledgements
We thank R. DePinho for critical reading and insightful comments. This research has been supported by the Andrew Sabin Family Fellow Award and Bridge Fund from The University of Texas MD Anderson Cancer Center, Career Enhancement Award from UT SPORE in Lung Cancer NIH/NCI 5P50CA070907, KC180131 from Department of Defense Kidney Cancer Research Program (to B.G.), grants from the National Institutes of Health (R01CA181196 to B.G., and R01CA188652 to C.M.M.). B.G. is an Andrew Sabin Family Fellow. Y.Z. and P.K. were Scholars at the Center for Cancer Epigenetics at The University of Texas MD Anderson Cancer Center. P.K. is also supported by the CPRIT Research Training Grant (RP170067) and Dr. John J. Kopchick Research Award from The MD Anderson UTHealth Graduate School of Biomedical Sciences. E.W.L. is supported by NIH grant T32EB009380. PDX generation and annotation were supported by the University of Texas MD Anderson Cancer Center Moon Shots Program, Specialized Program of Research Excellence (SPORE) grant CA070907, and University of Texas PDX Development and Trial Center grant U54CA224065. This research has also been supported by the National Institutes of Health Cancer Center Support Grant P30CA016672 to The University of Texas MD Anderson Cancer Center.
Footnotes
Competing Financial Interests
K.O. and M.V.P. are full-time employees of Kadmon Corporation, LLC. Other authors declare no competing financial interests.
References
- 1.Pavlova NN & Thompson CB The Emerging Hallmarks of Cancer Metabolism. Cell Metab 23, 27–47 (2016). [DOI] [PMC free article] [PubMed] [Google Scholar]
- 2.Boroughs LK & DeBerardinis RJ Metabolic pathways promoting cancer cell survival and growth. Nat Cell Biol 17, 351–359 (2015). [DOI] [PMC free article] [PubMed] [Google Scholar]
- 3.DeBerardinis RJ & Chandel NS Fundamentals of cancer metabolism. Sci Adv 2, e1600200 (2016). [DOI] [PMC free article] [PubMed] [Google Scholar]
- 4.Wolpaw AJ & Dang CV Exploiting Metabolic Vulnerabilities of Cancer with Precision and Accuracy. Trends in cell biology 28, 201–212 (2018). [DOI] [PMC free article] [PubMed] [Google Scholar]
- 5.Bi J, Wu S, Zhang W & Mischel PS Targeting cancer’s metabolic co-dependencies: A landscape shaped by genotype and tissue context. Biochim Biophys Acta Rev Cancer 1870, 76–87 (2018). [DOI] [PMC free article] [PubMed] [Google Scholar]
- 6.Narta UK, Kanwar SS & Azmi W Pharmacological and clinical evaluation of L-asparaginase in the treatment of leukemia. Crit Rev Oncol Hematol 61, 208–221 (2007). [DOI] [PubMed] [Google Scholar]
- 7.Stipanuk MH Sulfur amino acid metabolism: pathways for production and removal of homocysteine and cysteine. Annu Rev Nutr 24, 539–577 (2004). [DOI] [PubMed] [Google Scholar]
- 8.Conrad M & Sato H The oxidative stress-inducible cystine/glutamate antiporter, system x (c) (−) : cystine supplier and beyond. Amino Acids 42, 231–246 (2012). [DOI] [PubMed] [Google Scholar]
- 9.Lewerenz J et al. The cystine/glutamate antiporter system x(c)(−) in health and disease: from molecular mechanisms to novel therapeutic opportunities. Antioxid Redox Signal 18, 522–555 (2013). [DOI] [PMC free article] [PubMed] [Google Scholar]
- 10.Sato H, Tamba M, Ishii T & Bannai S Cloning and expression of a plasma membrane cystine/glutamate exchange transporter composed of two distinct proteins. J Biol Chem 274, 11455–11458 (1999). [DOI] [PubMed] [Google Scholar]
- 11.Stipanuk MH, Dominy JE Jr., Lee JI & Coloso RM Mammalian cysteine metabolism: new insights into regulation of cysteine metabolism. J Nutr 136, 1652S–1659S (2006). [DOI] [PubMed] [Google Scholar]
- 12.Dixon SJ et al. Ferroptosis: an iron-dependent form of nonapoptotic cell death. Cell 149, 1060–1072 (2012). [DOI] [PMC free article] [PubMed] [Google Scholar]
- 13.Stockwell BR et al. Ferroptosis: A Regulated Cell Death Nexus Linking Metabolism, Redox Biology, and Disease. Cell 171, 273–285 (2017). [DOI] [PMC free article] [PubMed] [Google Scholar]
- 14.Zhang Y et al. BAP1 links metabolic regulation of ferroptosis to tumour suppression. Nat Cell Biol 20, 1181–1192 (2018). [DOI] [PMC free article] [PubMed] [Google Scholar]
- 15.Bhutia YD, Babu E, Ramachandran S & Ganapathy V Amino Acid transporters in cancer and their relevance to “glutamine addiction”: novel targets for the design of a new class of anticancer drugs. Cancer Res 75, 1782–1788 (2015). [DOI] [PubMed] [Google Scholar]
- 16.Lo M, Wang YZ & Gout PW The x(c)- cystine/glutamate antiporter: a potential target for therapy of cancer and other diseases. Journal of cellular physiology 215, 593–602 (2008). [DOI] [PubMed] [Google Scholar]
- 17.Koppula P, Zhang Y, Zhuang L & Gan B Amino acid transporter SLC7A11/xCT at the crossroads of regulating redox homeostasis and nutrient dependency of cancer. Cancer Commun (Lond) 38, 12 (2018). [DOI] [PMC free article] [PubMed] [Google Scholar]
- 18.Lee WN et al. Mass isotopomer study of the nonoxidative pathways of the pentose cycle with [1,2–13C2]glucose. Am J Physiol 274, E843–851 (1998). [DOI] [PubMed] [Google Scholar]
- 19.Fan J et al. Quantitative flux analysis reveals folate-dependent NADPH production. Nature 510, 298–302 (2014). [DOI] [PMC free article] [PubMed] [Google Scholar]
- 20.Lewis CA et al. Tracing compartmentalized NADPH metabolism in the cytosol and mitochondria of mammalian cells. Mol Cell 55, 253–263 (2014). [DOI] [PMC free article] [PubMed] [Google Scholar]
- 21.Shin CS et al. The glutamate/cystine xCT antiporter antagonizes glutamine metabolism and reduces nutrient flexibility. Nature communications 8, 15074 (2017). [DOI] [PMC free article] [PubMed] [Google Scholar]
- 22.Koppula P, Zhang Y, Shi J, Li W & Gan B The glutamate/cystine antiporter SLC7A11/xCT enhances cancer cell dependency on glucose by exporting glutamate. J Biol Chem 292, 14240–14249 (2017). [DOI] [PMC free article] [PubMed] [Google Scholar]
- 23.Goji T, Takahara K, Negishi M & Katoh H Cystine uptake through the cystine/glutamate antiporter xCT triggers glioblastoma cell death under glucose deprivation. J Biol Chem 292, 19721–19732 (2017). [DOI] [PMC free article] [PubMed] [Google Scholar]
- 24.Vander Heiden MG, Cantley LC & Thompson CB Understanding the Warburg effect: the metabolic requirements of cell proliferation. Science 324, 1029–1033 (2009). [DOI] [PMC free article] [PubMed] [Google Scholar]
- 25.Bak DW, Bechtel TJ, Falco JA & Weerapana E Cysteine reactivity across the subcellular universe. Curr Opin Chem Biol 48, 96–105 (2019). [DOI] [PMC free article] [PubMed] [Google Scholar]
- 26.Hay N Reprogramming glucose metabolism in cancer: can it be exploited for cancer therapy? Nat Rev Cancer 16, 635–649 (2016). [DOI] [PMC free article] [PubMed] [Google Scholar]
- 27.Zhang D et al. 2-Deoxy-D-glucose targeting of glucose metabolism in cancer cells as a potential therapy. Cancer letters 355, 176–183 (2014). [DOI] [PubMed] [Google Scholar]
- 28.Pereira DJ, Schoolwerth AC & Pais VM Cystinuria: current concepts and future directions. Clin Nephrol 83, 138–146 (2015). [DOI] [PubMed] [Google Scholar]
- 29.Elmonem MA et al. Cystinosis: a review. Orphanet J Rare Dis 11, 47 (2016). [DOI] [PMC free article] [PubMed] [Google Scholar]
- 30.Siebeneicher H et al. Identification and Optimization of the First Highly Selective GLUT1 Inhibitor BAY-876. ChemMedChem 11, 2261–2271 (2016). [DOI] [PMC free article] [PubMed] [Google Scholar]
- 31.Jozwiak P, Krzeslak A, Pomorski L & Lipinska A Expression of hypoxia-related glucose transporters GLUT1 and GLUT3 in benign, malignant and non-neoplastic thyroid lesions. Mol Med Rep 6, 601–606 (2012). [DOI] [PubMed] [Google Scholar]
- 32.Krzeslak A et al. Expression of GLUT1 and GLUT3 glucose transporters in endometrial and breast cancers. Pathology oncology research : POR 18, 721–728 (2012). [DOI] [PMC free article] [PubMed] [Google Scholar]
- 33.Ancey PB, Contat C & Meylan E Glucose transporters in cancer - from tumor cells to the tumor microenvironment. FEBS J 285, 2926–2943 (2018). [DOI] [PubMed] [Google Scholar]
- 34.Faubert B et al. Lactate Metabolism in Human Lung Tumors. Cell 171, 358–371 e359 (2017). [DOI] [PMC free article] [PubMed] [Google Scholar]
- 35.Hui S et al. Glucose feeds the TCA cycle via circulating lactate. Nature 551, 115–118 (2017). [DOI] [PMC free article] [PubMed] [Google Scholar]
- 36.Sabharwal SS & Schumacker PT Mitochondrial ROS in cancer: initiators, amplifiers or an Achilles’ heel? Nat Rev Cancer 14, 709–721 (2014). [DOI] [PMC free article] [PubMed] [Google Scholar]
- 37.Shimada K, Hayano M, Pagano NC & Stockwell BR Cell-Line Selectivity Improves the Predictive Power of Pharmacogenomic Analyses and Helps Identify NADPH as Biomarker for Ferroptosis Sensitivity. Cell Chem Biol 23, 225–235 (2016). [DOI] [PMC free article] [PubMed] [Google Scholar]
- 38.Zhang Y, Koppula P & Gan B Regulation of H2A ubiquitination and SLC7A11 expression by BAP1 and PRC1. Cell Cycle, 1–11 (2019). [DOI] [PMC free article] [PubMed] [Google Scholar]
- 39.Zhang Y, Zhuang L & Gan B BAP1 suppresses tumor development by inducing ferroptosis upon SLC7A11 repression. Molecular & cellular oncology 6, 1536845 (2019). [DOI] [PMC free article] [PubMed] [Google Scholar]
- 40.Sykiotis GP & Bohmann D Stress-activated cap’n’collar transcription factors in aging and human disease. Sci Signal 3, re3 (2010). [DOI] [PMC free article] [PubMed] [Google Scholar]
- 41.Rojo de la Vega M, Chapman E & Zhang DD NRF2 and the Hallmarks of Cancer. Cancer Cell (2018). [DOI] [PMC free article] [PubMed] [Google Scholar]
- 42.Liu X et al. LncRNA NBR2 engages a metabolic checkpoint by regulating AMPK under energy stress. Nat Cell Biol 18, 431–442 (2016). [DOI] [PMC free article] [PubMed] [Google Scholar]
- 43.Gu Y et al. mTORC2 Regulates Amino Acid Metabolism in Cancer by Phosphorylation of the Cystine-Glutamate Antiporter xCT. Mol Cell 67, 128–138 e127 (2017). [DOI] [PMC free article] [PubMed] [Google Scholar]
- 44.Lin A et al. FoxO transcription factors promote AKT Ser473 phosphorylation and renal tumor growth in response to pharmacological inhibition of the PI3K-AKT pathway. Cancer Res (2014). [DOI] [PMC free article] [PubMed] [Google Scholar]
- 45.Dai F et al. BAP1 inhibits the ER stress gene regulatory network and modulates metabolic stress response. Proc Natl Acad Sci U S A 114, 3192–3197 (2017). [DOI] [PMC free article] [PubMed] [Google Scholar]
- 46.Lin A et al. The FoxO-BNIP3 axis exerts a unique regulation of mTORC1 and cell survival under energy stress. Oncogene 33, 3183–3194 (2014). [DOI] [PMC free article] [PubMed] [Google Scholar]
- 47.Liu X & Gan B lncRNA NBR2 modulates cancer cell sensitivity to phenformin through GLUT1. Cell Cycle 15, 3471–3481 (2016). [DOI] [PMC free article] [PubMed] [Google Scholar]
- 48.Jeon SM, Chandel NS & Hay N AMPK regulates NADPH homeostasis to promote tumour cell survival during energy stress. Nature 485, 661–665 (2012). [DOI] [PMC free article] [PubMed] [Google Scholar]
- 49.Xiao ZD et al. Energy stress-induced lncRNA FILNC1 represses c-Myc-mediated energy metabolism and inhibits renal tumor development. Nature communications 8, 783 (2017). [DOI] [PMC free article] [PubMed] [Google Scholar]
- 50.Chauhan AS et al. STIM2 interacts with AMPK and regulates calcium-induced AMPK activation. FASEB J 33, 2957–2970 (2019). [DOI] [PMC free article] [PubMed] [Google Scholar]
- 51.Gan B et al. Lkb1 regulates quiescence and metabolic homeostasis of haematopoietic stem cells. Nature 468, 701–704 (2010). [DOI] [PMC free article] [PubMed] [Google Scholar]
- 52.Gan B et al. FoxOs enforce a progression checkpoint to constrain mTORC1-activated renal tumorigenesis. Cancer Cell 18, 472–484 (2010). [DOI] [PMC free article] [PubMed] [Google Scholar]
- 53.Gan B et al. mTORC1-dependent and -independent regulation of stem cell renewal, differentiation, and mobilization. Proc Natl Acad Sci U S A 105, 19384–19389 (2008). [DOI] [PMC free article] [PubMed] [Google Scholar]
- 54.Lu W et al. Metabolomic analysis via reversed-phase ion-pairing liquid chromatography coupled to a stand alone orbitrap mass spectrometer. Anal Chem 82, 3212–3221 (2010). [DOI] [PMC free article] [PubMed] [Google Scholar]
- 55.Melamud E, Vastag L & Rabinowitz JD Metabolomic analysis and visualization engine for LC-MS data. Anal Chem 82, 9818–9826 (2010). [DOI] [PMC free article] [PubMed] [Google Scholar]
- 56.Wallace M et al. Enzyme promiscuity drives branched-chain fatty acid synthesis in adipose tissues. Nature chemical biology 14, 1021–1031 (2018). [DOI] [PMC free article] [PubMed] [Google Scholar]
- 57.Young JD INCA: a computational platform for isotopically non-stationary metabolic flux analysis. Bioinformatics 30, 1333–1335 (2014). [DOI] [PMC free article] [PubMed] [Google Scholar]
- 58.Heinrich P et al. Correcting for natural isotope abundance and tracer impurity in MS-, MS/MS- and high-resolution-multiple-tracer-data from stable isotope labeling experiments with IsoCorrectoR. Sci Rep 8, 17910 (2018). [DOI] [PMC free article] [PubMed] [Google Scholar]
- 59.Badur MG et al. Oncogenic R132 IDH1 Mutations Limit NADPH for De Novo Lipogenesis through (D)2-Hydroxyglutarate Production in Fibrosarcoma Sells. Cell Rep 25, 1018–1026 e1014 (2018). [DOI] [PMC free article] [PubMed] [Google Scholar]
- 60.Lu W, Wang L, Chen L, Hui S & Rabinowitz JD Extraction and Quantitation of Nicotinamide Adenine Dinucleotide Redox Cofactors. Antioxid Redox Signal 28, 167–179 (2018). [DOI] [PMC free article] [PubMed] [Google Scholar]
- 61.Su X, Lu W & Rabinowitz JD Metabolite Spectral Accuracy on Orbitraps. Anal Chem 89, 5940–5948 (2017). [DOI] [PMC free article] [PubMed] [Google Scholar]
- 62.Yan X et al. Inhibition of Thioredoxin/Thioredoxin Reductase Induces Synthetic Lethality in Lung Cancers with Compromised Glutathione Homeostasis. Cancer Res 79, 125–132 (2019). [DOI] [PMC free article] [PubMed] [Google Scholar]
- 63.Lee H et al. BAF180 regulates cellular senescence and hematopoietic stem cell homeostasis through p21. Oncotarget 7, 19134–19146 (2016). [DOI] [PMC free article] [PubMed] [Google Scholar]
- 64.Gan B et al. Role of FIP200 in cardiac and liver development and its regulation of TNFalpha and TSC-mTOR signaling pathways. J Cell Biol 175, 121–133 (2006). [DOI] [PMC free article] [PubMed] [Google Scholar]
Associated Data
This section collects any data citations, data availability statements, or supplementary materials included in this article.
Supplementary Materials
Supplementary Table 1: Glucose metabolism related genes.
Supplementary Table 2: Summary of various approaches on rescuing redox defects and cell death in SLC7A11-high cancer cells under glucose starvation.
Supplementary Table 3: Oligos and shRNA sequences.
Supplementary Table 4: Information on human research participants (age, gender, genotypic information, diagnosis and treatment categories) of PDXs in this study.
Data Availability Statement
Source Data for Figs. 1–6 and Extended Data Figs. 1–7 are provided with the paper. The 33 cancer-type data were derived from the TCGA Research Network: http://cancergenome.nih.gov/. The RNAseq data from PDXs have been deposited in dbGAP under accession number phs001980.v1.p1. All data supporting the findings of this study are available from the corresponding author on reasonable request.


