

Abstract
The purpose of this study was to determine whether obesity and/or exercise training alters weight regain and musculoskeletal health after ovariectomy (OVX). Female rats were fed high fat diet (HFD) to reveal Obesity-Prone (OP) and Obesity-Resistant (OR) phenotypes. OP and OR exercising (EX) and sedentary (SED) rats were calorically restricted to lose 15% of body weight using medium fat diet (MFD). Rats were then maintained in energy balance for 8 weeks before OVX. Following OVX and a brief calorically limited phase, rats were allowed to eat ad libitum until body weight plateaued. Starting at weight loss, EX ran 1 h/d, 6 d/week, 15 m/min. Energy intake (EI), spontaneous physical activity (SPA), and total energy expenditure were evaluated at the end of weight maintenance preOVX, and at three time points postOVX: before weight regain, during early regain, and after regain. Data are presented as mean±SE. Exercise attenuated weight regain after OVX in OP only (OP-EX: 123±10g; OP-SED: 165±12g; OR-EX 121±6g; OR-SED: 116±6g), which was primarily an attenuation of fat gain. The early postOVX increase in EI explained much of the weight regain, and was similar across groups. EX improved bone strength, as did maintaining SPA. Group differences in muscle mitochondrial respiration were not significant. The large decrease in SPA due to OVX was persistent, but early weight regain was dependent on decreased SPA. In conclusion, leanness and exercise do not necessarily protect from OVX-induced weight gain. Exercise prevented weight gain in obese rats, but loss of SPA was the greatest contributor to postOVX weight gain. Thus, understanding the mechanisms resulting in reduction in SPA following ovarian hormone loss is critical in the prevention of menopause-associated metabolic dysfunction.
Keywords: Menopause, energy balance, spontaneous physical activity, obesity, exercise
Introduction
The high prevalence of obesity is accompanied by a high incidence of individuals who attempt to lose weight. Most weight loss strategies are only transiently effective, and a strong biological drive to regain weight underlies the high recidivism rates with obesity (1, 2). Adaptations to weight loss create a homeostatic system that encourages weight regain, such that maintaining a given weight is more difficult in those who were previously at a heavier weight compared to those individuals who have not lost weight. Some adaptations to weight loss include reductions in resting metabolic rate (RMR) relative to body size, and a reduced ability to modify substrate utilization in response to metabolic stress (3, 4).
A particularly vulnerable time for weight loss maintenance in women is during menopause, and it is very common for women to enter the menopausal transition with preexisting obesity and a history of weight loss. Further, the effects of obesity and weight loss on bone health are both controversial, but could result in women entering menopause with suboptimal bone quality. The transition through menopause is associated with weight gain, increased visceral adiposity, decreased bone mass, and a general decline in metabolic health (5, 6). In young women, the acute suppression of ovarian function results in a small, but significant, decline in total and resting energy expenditure (7). When food intake is not reduced to a sufficient extent, the decreased energy expenditure results in a positive energy imbalance and subsequent weight gain. We previously demonstrated that the combination of a history of weight loss and the loss of ovarian function have independent influences on weight gain in Wistar rats, such that there was a decrease in spontaneous physical activity (SPA) and an increase in food intake after loss of ovarian function (8, 9). These bioenergetic changes may exacerbate existing weight problems in overweight women and lead to the onset of obesity in lean women after menopause.
Exercise is often used to assist in weight control. It is unknown, however, how well exercise interventions affect food intake and counter weight regain when the loss of ovarian function occurs during weight loss maintenance. Weight loss maintenance trials in humans have failed to demonstrate the efficacy of exercise for preventing weight regain, partly because maintaining a high exercise compliance and adherence is more difficult in clinical trials than in preclinical trials (10, 11). However, findings from the National Weight Control Registry consistently show that those who are successful at weight loss maintenance exercise for more than 1 hour per day (12). Moreover, exercise reduces appetite and alters nutrient trafficking in male rats, which results in an attenuated drive to regain weight (13, 14). We found that exercise does not attenuate weight regain in ovary-intact female rodents, but there is evidence that exercise attenuates weight regain in ovariectomized (OVX) rats that lost weight after OVX as previously reviewed (11, 15). This dependency on sex hormones for the effect of exercise on weight regain highlights the need to understand the role of exercise in preventing weight regain when endogenous sex hormones change.
In humans, controlling for the timing of the onset of obesity, lifetime physical activity habits and history of weight loss attempts, while also separating the effect of aging from the effect of ovarian hormone loss due to the menopausal transition is extremely difficult. Therefore, we recreated this phenotypic milieu in rodents to gain novel insight into how exercise can counteract the energetic challenges of menopause. The purpose of this study was to determine whether exercise training affects the ability to maintain weight loss after OVX in those with preexisting obesity. We hypothesized that regular exercise would counteract the biological drive to regain weight by preserving insulin sensitivity, mitochondrial biogenesis, bone mass, and fat oxidation in muscle, bone, and liver, and the resulting energy expenditure that might otherwise decrease with the removal of ovarian hormones.
Methods
All procedures were approved by the University of Colorado Anschutz Medical Campus Institutional Animal Care and Use Committee. The study timeline with weight trajectories is shown in Figure 1A. Five-week old female Wistar rats (Charles River Laboratories, Wilmington, MA) were individually housed on a 14:10h light-dark cycle and provided free access to water. Obesity-Prone (OP, upper tertile; n=22) and Obesity-Resistant (OR, lower tertile; n=22) rats were identified after 6 weeks of high fat diet (HFD; 46% kcal fat, Research Diets D12344, New Brunswick, NJ) feeding based on weight gain and percentage body fat responses, and allowed to continue HFD feeding until 17-18 weeks of age, as previously described (Figure 1A, B) (3, 16, 17). Rats in the middle tertile were removed from the study. At 17-18 weeks of age, rats were further assigned within each tertile into sedentary (SED) or exercising (EX), balanced for weight and body fat percentage. All groups were switched to a medium fat diet (MFD; 25% kcal fat, Research Diets D07091301; see Table, SDC 1, Dietary formula of medium fat diet provided by Research Diets Inc.) and energy restricted to ~55% of the calories eaten ad libitum to induce a 15% weight loss over 2 weeks, and then kept in energy balance (EB) at the reduced weight for 8 weeks (Figure 1B). EB was maintained by providing a limited portion of MFD just prior to the start of the dark cycle.
Figure 1.

A-F. Obesity Prone (OP) and Obesity Resistant (OR) phenotypes were revealed with 13 weeks of high fat diet (HFD). Rats were switched to medium fat diet (MFD) for the weight loss, weight loss maintenance (WLM) and ad libitum (AL) refeeding phases. The solid black line is a general weight trajectory. C= Calorimetry data collection before OVX, after recovery from OVX but before AL feeding began (rats were maintained in energy balance), during the first week of PostOVX AL feeding, and just prior to sac (A). Obesity development and weight loss (B) before OVX, and weight regain (C). The rate of regain was highest in week 1 of refeeding (C, D). Fat mass (E) and lean mass (F) before and after weight loss and regain. †p<0.05 Phenotype x activity interaction; *p<0.01 Main effect of phenotype (OP>OR).
At the end of the 8wk caloric restriction/maintenance period, rats were surgically ovariectomized (OVX) using dorsal entry under isoflurane anesthesia (18). After OVX, we aimed to observe changes in energy expenditure (EE) and SPA, independent from refeeding. To do this, rats were provided a calorically limited (CL) amount of MFD during the 6-10 days of recovery after OVX, the last 3 days of which were in the metabolic monitoring system (described below). CL provisions were based on anticipated calories needed to maintain EB, which was initially the same as their preOVX intake. Adjustments to the food allotment were made if a 2-3 day trend of weight loss or gain occurred. After 3 days of metabolic monitoring in the CL phase, animals were allowed to eat MFD ad libitum for the remainder of the study. EX rats continued with their exercise program. Rats were euthanized by exsanguination under anesthesia once their weight plateaued, which occurred 9-11 weeks postOVX. Body composition, energy balance, SPA, and blood insulin and glucose data from the SED groups were compared to rats that did not lose weight (9) to test for additive effects of OVX and prior weight loss on postOVX weight gain as a distinct research question.
Programmed Exercise
At the start of weight loss, rats randomized to the EX groups were acclimated to treadmill exercise (Exer-6M Treadmill; Columbus Instruments). The first 4 weeks were a ramp up phase where time and speed were gradually increased to the final prescribed dose of exercise, which was 15 m/min for 60 min/day, 6 days/week. Exercise bouts occurred during the light cycle within 2 hours of the start of the dark cycle. Rats reached the full speed and time while they were in the weight maintenance phase and remained at the same full speed and time until euthanasia. Our pilot data indicated that the energy expended during treadmill exercise was very similar (<0.5 kcal difference) between OP and OR rats (data not shown). Rats were scored from 1 (worst) to 10 (best) during each bout of exercise based on the quality of running and amount of encouragement required to complete the exercise bout, as previously described (19).
Body Composition
Fat mass and fat free mass were measured using quantitative magnetic resonance (qMR; EchoMRI, Houston, TX) at 3 time points: 1. before the initiation of weight loss, 2. just prior to OVX, and 3. on the day of euthanasia.
Metabolic monitoring
Energy intake (EI), SPA, and total and resting energy expenditure (TEE, REE) were measured in metabolic monitoring systems with indirect calorimetry as previously described (9). Each metabolic cage was equipped with an animal activity meter (Opto-Max, Columbus Instruments, Columbus, OH), and total, ambulatory, and nonambulatory activity were monitored for each 24h period. Within the week prior to OVX, daily vaginal lavages were performed 4-5 hours prior to the start of the dark cycle to determine the timing of the estrus phase within the estrous cycle to time the start of metabolic monitoring. PreOVX metabolic monitoring lasted for 4 days. After recovery from OVX surgery (3-7 days), rats were monitored in the calorimeters for 3 days while on calorically limited (CL) provisions to remain in EB, plus 3 days of ad libitum (AL) refeeding. Finally, rats were monitored for 4 days during ad libitum feeding within a week of euthanasia (~ 9-11 weeks postOVX, Figure 1A).
Metabolic rate (MR) was calculated from gas exchange measurements acquired every 14 minutes using the Weir equation (20): MR = 3.941 x VO2 + 1.106 x VCO2 – 2.17 x N, where N is urinary nitrogen. MR was averaged and extrapolated over 24 hours to estimate TEE. Energy balance (EB) was calculated as the difference between EI and TEE. Metabolic data were derived as mean values from 4 days in PreOVX, 1-3 days in PostOVX-CL, 1-3 days in PostOVX-AL, and 1-3 days in PostOVX Final.
Skeletal Outcomes
Areal Bone Mineral Density and Bone Mineral Content
Immediately prior to both OVX and sacrifice, total body areal BMD (aBMD) and BMC were assessed using Dual-Energy X-ray Absorptiometry (DPX-IQ, Lunar Corp., Madison, WI) while under isoflurane anesthesia.
Long Bone Morphometry
Microcomputed tomography (Siemens Inveon; Erlangen, Germany) scans were performed on whole femora and tibiae at a resolution of 30 µm and 47 µm, respectively. Cortical cross-sectional area (CSA), thickness, second moments of area (Imax, Imin, measures of bending resistance in the directions of maximum and minimum stiffness), and section moduli (Zmax, Zmin, measures of bending strength in the directions of maximum and minimum strength) were measured along the diaphyseal shafts of tibiae and femurs using the BoneJ plugin for ImageJ (21). The volume of interest (VOI) for the tibial shaft was from the tibia-fibula junction to 14.1 mm proximal, averaged over 150 slices spaced 47 µm apart. The VOI for the femoral shaft was 6 mm in each direction from the femoral midshaft, averaged over 200 slices spaced 30 µm apart. Mechanical testing of hindlimb bones was performed as previously described (19).
Mitochondrial Respiration
Gastrocnemius skeletal muscle was rapidly excised from each hindlimb under anesthesia. Mitochondrial isolations were performed at 0-4°C according to the methods of Makinen and Lee (22). Resting (state 4) and maximal coupled (state 3) mitochondrial oxygen consumption was measured in a respiration chamber maintained at 37°C (Strathkelvin Instruments, North Lanarkshire, Scotland). Incubations were carried out at 37°C in a 0.5 mL final volume containing 100 mM KCl, 50 mM MOPS, 10 mM K2PO4, 10 mM MgCl2, 0.5 mM EGTA, 20 mM glucose, and 0.2% bovine serum albumin, pH 7.4. Mitochondrial respiration was monitored at the following concentrations: 1 mM malate, 10 mM glutamate, 1 mM pyruvate, 10 μM L-palmitoylcarnitine, and 10 mM succinate. Mitochondria and substrates were added, and the coupled maximal respiration rate was initiated with the addition of ADP (100 μM).
Serum Hormones and Substrates
Blood was collected from the inferior vena cava at the time of euthanasia, and plasma was stored at −80°C until analysis. All analyses were performed in duplicate. Plasma insulin, and undercarboxylated osteocalcin were measured by ELISA (80-INSRT-E01 ALPCO, Salem, NH and MK118 Takara Bio USA, Mountain View, CA respectively); plasma glucose was measured using a colorimetric assay (TR15421, Thermo Fisher Scientific, Waltham, MA). Follicle stimulating hormone (FSH) was measured by MILLIPLEX map Rat Pituitary Panel kit, EMD Millipore product # RPTMAG-86K.
Statistical Analyses
Primary Analyses using Phenotype and Exercise Status as Factors
Data were analyzed with SAS version 9.4. This study was designed to test a difference in the expected change in weight and fat mass between EX and SED rats (23). Based on our previous work in males, a sample size of 6 was required to detect a 35 g difference in weight gain between SED and EX rats at 80% power and a p-value of 0.05. Two way (phenotype, activity) ANOVA were used to test the hypothesis that exercise will attenuate the increases in weight and fat mass after OVX in OP and OR rats. In the case of a significant interaction, a Tukey posthoc comparison was made to test for differences between EX and SED. If the interaction was not significant, then main effects (phenotype, activity) were interpreted.
We performed similar 2-way ANOVAs on changes in EI, EE, EB, and SPA (secondary outcomes) as the mechanistic underpinnings for weight regain. 2-way ANOVAs at each time point for these outcomes are used for descriptive purposes to aid in the interpretation of change comparisons. End-of-study outcomes (e.g., bone and mitochondria outcomes) were also compared with 2-way ANOVAs. Finally, we performed an ANCOVA with TEE as the dependent variable and lean mass as the covariate to explore group differences in metabolic efficiency. Pearson’s product moment correlations were used to examine relationships among secondary outcomes. The level of significance was set at p<0.05.
Exploring the Role of Changes in Spontaneous Physical Activity on PostOVX Outcomes
Because we observed a very large weight regain and a very large reduction in SPA during the first week of AL refeeding, we performed a hypothesis-generating secondary analysis to explore whether the decrease in SPA after OVX was counteracting our expected effects of exercise. We split groups based on the median relative change in total SPA from preOVX to the early regain (1st 4 days) postOVX, designating them as ‘Sustained SPA (S-SPA)’ and ‘Declining SPA (D-SPA)’, and performed a 2-way ANOVA with total SPA and Exercise status as the factors. Five of 12 OP rats were S-SPA and seven of 13 OR rats were S-SPA. Rats that did not have SPA data during the early refeeding phase were not included in the secondary analysis. The level of significance was set at p<0.05.
Results
Prior to the Loss of Ovarian Function
Prior to OVX, all groups had similar lean mass, and the difference in body weight between OP and OR rats was driven by a higher fat mass in OP rats before (102±5 g vs 61±2 g) and after weight loss (43±4 g vs 22±2 g) (Figure 1B, E and F). There were no group differences in EI (Table 1) or SPA [see Figure, SDC 2, total, ambulatory, and nonambulatory spontaneous physical activity (SPA) progressively decreased (all p<0.01) from before OVX to the calorically limited phase (before regain) after OVX, to the early AL refeeding phase after OVX, and to just prior to sacrifice; p>0.36 for both] in the preOVX period. However, TEE was higher in both OP rats (p=0.032) and EX rats (p=0.012) compared to their OR and SED counterparts, and the increase in REE and EB in OP rats neared significance (p=0.090, 0.091; Table 1). Running compliance before OVX was similar between OR and OP rats (running scores: 8.1±0.2 and 7.7±0.3, p>0.29), and remained similar between OR and OP rats after OVX (running scores: 6.6±0.4 and 7.1±0.2, p>0.28).
Table 1.
Energy balance (EB), energy expenditure, energy intake before OVX, after OVX during caloric limitation (CL) and early ad libitum feeding (AL), and at end of study. Average of 3 days per feeding condition and time during preOVX due to cycle, 1-3 days postOVX; rats with preOVX and final data included.
| OR SED (n=5-7) | OR EX (n=5-8) | OP SED (n=7-8) | OP EX (n=5-6) | |
|---|---|---|---|---|
| EB | ||||
| PreOVXe | 0.6 ± 1.8 | −1.9 ± 1.0 | 0.5 ± 2.6 | −3.7 ± 1.6 |
| PostOVX CL | −0.4 ± 1.6 | −0.8 ± 3.7 | 0.4 ± 4.5 | −5.1 ± 2.5 |
| PostOVX AL | 51.8 ± 2.2 | 52.4 ± 4.9 | 51.0 ± 3.5 | 47.1 ± 4.5 |
| Final | 6.6 ± 3.4 | 12.4 ± 2.3 | 15.0 ± 2.5 | 12.8 ± 2.7 |
| TEE | ||||
| PreOVXbd | 40.6 ± 1.6 | 44.8 ± 1.3 | 44.1 ± 1.6 | 48.0 ± 1.2 |
| PostOVX CLbd | 40.7 ± 2.1 | 44.4 ± 1.3 | 44.2 ± 1.8 | 48.7 ± 0.9 |
| PostOVX AL | 51.0 ± 2.0 | 52.4 ± 2.1 | 51.7 ± 1.3 | 56.8 ± 3.0 |
| Final | 52.5 ± 1.5 | 52.8 ± 2.3 | 55.5 ± 2.1 | 53.4 ± 2.1 |
| REE | ||||
| PreOVXe | 28.9 ± 1.7 | 30.5 ± 1.1 | 30.6 ± 0.8 | 32.7 ± 1.1 |
| PostOVX CL | 29.0 ± 1.7 | 29.4 ± 1.2 | 30.9 ± 1.4 | 31.8 ± 1.0 |
| PostOVX AL | - | - | - | - |
| Final | 37.2 ± 1.1 | 36.7 ± 1.7 | 39.9 ± 1.8 | 37.7 ± 1.4 |
| Intake | ||||
| PreOVX | 40.4 ± 2.1 | 42.9 ± 1.7 | 44.6 ± 3.8 | 44.3 ± 2.0 |
| PostOVX CL | 40.4 ± 2.9 | 43.5 ± 3.2 | 44.5 ± 5.3 | 43.5 ± 2.4 |
| PostOVX AL | 102.8 ± 3.4 | 104.8 ± 4.4 | 102.7 ± 3.9 | 103.9 ± 7.3 |
| Final | 59.1 ± 3.5 | 65.2 ± 1.7 | 70.5 ± 4.1 | 66.1 ± 3.2 |
p<0.01,
p<0.05,
p=0.090 Main effect of phenotype (OP > OR);
p<0.01,
p<0.05.
Main effect of activity (SED vs EX). EB: energy balance; TEE: total energy expenditure: REE: resting energy expenditure. Note. REE not determined during AL because of excess consumption. All values in kcal mean±SEM.
Roles of Obesity and Exercise after OVX in Rats with Prior Weight Loss
EX rats met or surpassed their pre-weight loss weight within 2 weeks of OVX under ad libitum feeding conditions (13.9±1.5 days, Figure 1C). Although the rate of weight regain in the first 3 weeks of ad libitum feeding was similar (p>0.40) among all groups, exercise resulted in an eventual attenuation of weight regain in OP rats, which was still greater than in OR rats (interaction; p=0.01, Figure 1C–D). The divergence in weight regain trajectories emerged in weeks five (interaction; p=0.096; phenotype; p<0.01) and six (interaction; p=0.064). The reduction in weight regain in OP-EX compared to OP-SED was explained by smaller increases in both fat (interaction; p=0.09; phenotype; p<0.001) and lean mass (interaction; p=0.03), whereas OR-EX increased lean mass compared to OR-SED (Figures 1E–F).
There were no group differences in the increases in EB, nor were there group differences in EB during early regain or end of study (p>0.13 for group differences, Figure 2A). There were also no group differences in EI (Figure 2B). EI increased (p<0.01) similarly in all groups after OVX (p>0.35 for group difference in change), although EI at the end of regain tended to be higher in OP (p=0.072). After OVX, during the calorically limited phase, TEE remained higher in OP compared to OR and EX compared to SED rats (p=0.022, 0.028, Table 1). During early refeeding, TEE (Figure 2C) and REE increased similarly in all groups (all p>0.24). At the end of weight regain, the increases in TEE and REE remained similar among OR and OP groups. SED rats had a larger increase (p<0.040) in TEE and REE from PreOVX to the end of study, compared to EX rats (Table 1; Figure 2).
Figure 2.
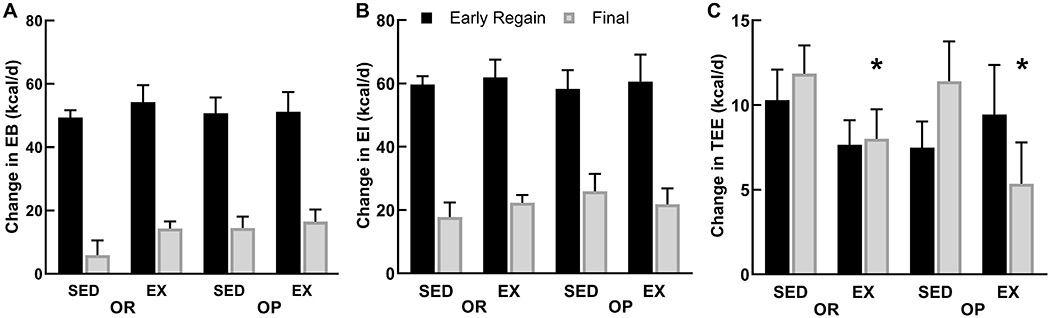
A-C. Increases in positive energy balance (A) after OVX were driven by the large increase in energy intake (B), especially during the early (1st week) regain phase. Energy intake, and the resulting EB were still higher than preOVX levels at the end of the study when weights plateaued, but to a lesser extent. Total energy expenditure (C) also increased during the postOVX early regaining phase, but remained higher than preOVX, largely because of the heavier body weight. *p<0.05 Main effect of activity (EX<SED).
SPA decreased (p<0.01) similarly in all groups after OVX (group differences in change all p>0.38, Figure 3; SDC 2—Supplemental Figure 1), and there were no group differences in total or ambulatory SPA counts at any time point (all p>0.20). The decrease (−13.2±5.1%) in total SPA after OVX was observed prior to refeeding, worsened during refeeding (−34.5±5.1%), and continued to decrease until the end of the study (−45.1±2.9%). Additionally, ambulatory SPA decreased (−14.8±6.5% before refeeding, −37.6±6.6% during early refeeding, −56.4±3.1% at the end of the study) to a greater extent than total or nonambulatory SPA. As a result, ambulatory SPA became less of a contributor to total SPA over time (51.6±1.0% of total SPA at preOVX to 39.6±0.7% of total SPA at the end of the study).
Figure 3.

Total spontaneous physical activity (SPA) preOVX, postOVX before regain (CL), postOVX during early regain (AL), and at the end of the study (Final) consists of ambulatory (solid bars) and nonambulatory (striped bars) SPA. Both ambulatory and nonambulatory SPA decrease over time, but ambulatory SPA is lost to a greater extent. All postOVX time points are significantly lower than preOVX values.
When adjusting for lean mass, exercising rats had a higher TEE before OVX (p=0.001) and during the calorically limited (p=0.007) phase [see Figure, SDC 3, Total energy expenditure (TEE), adjusted for body weight, lean mass, or fat mass before OVX, and after OVX during caloric limitation, during the first 3 days of regain, and just prior to sacrifice]. During the refeeding period, the difference in TEE between OP-EX (higher) and OP-SED was larger than the difference between the OR groups (interaction p=0.021; SDC 3—Supplemental Figure 2). However, TEE at the end of the study was similar among groups after adjusting for lean mass (p>0.69). Similar patterns were found when TEE was adjusted by fat mass or total body weight, but the interaction was not significant during refeeding.
Tibia size (CSA, periosteal circumference, cortical thickness) and strength-related outcomes (Imax, Imin, Zmax, Zmin) were not different between OR and OP rats, but were improved with exercise, such that improvements in size led to improvements in moduli and bending resistance (Figure 4). However, the effect of exercise on femur outcomes was not significant, due to the lack of an increase in exercising OP rats. We observed this pattern for EX to improve gastrocnemius mitochondrial respiration in OR rats, but not in OP rats, but it did not reach statistical significance (see Table, SDC 4, State 3 and state 4 respiration of gastrocnemius muscle). Resting (state 4) respiration in the presence of glutamate+malate or pyruvate+palmotylcarnitine was correlated with tibia and femur size (CSA), stiffness, and strength (Imax, Imin, experimental failure force) outcomes (r=0.40-0.56, p<0.05). Resting respiration in the presence of glutamate+malate was correlated with change in lean mass (r=0.39, p<0.03).
Figure 4.

A-D. Skeletal outcomes. A: tibia cross-sectional area (CSA), B: femur CSA, C: tibia maximum and minimum 2nd moment of area (Imax, Imin), D: femur Imax, Imin.
Corticosterone levels demonstrated an increase (p<0.001) over time, but an interaction (p=0.021) only existed at the end of the study, such that corticosterone was higher in OR-EX compared to OR-SED rats. In contrast, OP-EX had lower corticosterone than OP-SED. Insulin levels at the end of the study were higher in OP rats (p<0.05, SDC 1—Supplementary Table 1). FSH concentrations at the end of the study were lower in OP rats (p<0.05, see Table, SDC 5, Plasma FSH, insulin, and osteocalcin, and urinary corticosterone).
Exploring the Role of Changes in Spontaneous Physical Activity on PostOVX Outcomes
SPA change was independent of exercise, as SPA levels did not show signs of compensation for exercise status. Early change in SPA was correlated (p<0.05) with almost every major outcome, including weight and fat mass gain (r= −0.45 to −0.47), changes in EI and TEE (r= −0.41 to −0.66), Imin (r=0.45-0.55), glucose (r=0.39-0.53), and osteocalcin concentrations (r=0.44). Decreases in SPA were correlated with a lower mitochondrial respiration of pyruvate, glutamate, and glutamate+malate (r=0.45-0.51).
Our exploratory analysis uncovered that rats with higher levels of SPA before OVX had greater decreases in both total and ambulatory SPA after OVX, and were designated as D-SPA, compared to rats with lower preOVX levels of SPA. Rats that exhibited a smaller decrease in SPA post OVX during early refeeding were defined as S-SPA because they better sustained activity throughout the regain phase. S-SPA rats had a continued reduction in SPA throughout regain, whereas the decline in SPA in D-SPA rats slowed after the early refeeding phase. At the end of the regain period, S-SPA rats still better maintained SPA (p<0.05, Figure 5). The magnitude of decreases in SPA had an independent effect on rate of weight regain and the total weight regain through the first week of refeeding, such that D-SPA rats gained ~27% more weight than S-SPA rats during the first week (67.5±3.7 vs 53.4±7.1 g). This was associated with a greater increase in EI (p<0.05) in the D-SPA group during early refeeding. This, in turn, resulted in a greater total weight gain in D-SPA rats that neared significance (p=0.062). Independent of exercise or phenotype, S-SPA rats had greater strength in the tibia (failure load, Imin, Zmin, p<0.03 and Zpolar p=0.08), due to periosteal apposition (p=0.06). Within the exploratory analysis, the main effect of activity (EX vs SED) did not reach significance for any outcome [see Figure, SDC 6, Secondary analysis with SED and EX groups separated based on the median relative change (%) in spontaneous physical activity (SPA) from preOVX to the first week of postOVX ad libitum refeeding demonstrated two distinct patterns of loss of SPA].
Figure 5.

A-F. A: Secondary analysis based on the median relative change (%) in spontaneous physical activity (SPA) from preOVX to the first week of postOVX ad libitum refeeding demonstrated two distinct patterns of loss of SPA. B: Those who had the largest decreases in SPA after OVX were more active prior to OVX. C. Groups who remained closer to preOVX SPA levels (S-SPA) during early postOVX refeeding had lower early increases in energy intake (EI) and total energy expenditure (TEE), and D: slower weight regain over the 1st week of PostOVX AL refeeding. E: At the end of study, S-SPA rats had higher tibia resistance to bending. F: S-SPA groups tended to have less weight regain (p<0.06), which was primarily fat. N=5-8/grp. *p<0.05 Significantly different from their D-SPA counterparts.
Discussion
The most significant observation of this study was that after OVX, regular exercise attenuated weight regain in OP, but not OR, rats. A unique observation that stemmed from our secondary analysis was that the rate of decline in SPA after OVX independently affected food intake, weight regain, and bone outcomes, and this relationship was not diminished with regular exercise. Taken together, these data would suggest that leanness and exercise do not necessarily protect from biological drive to regain weight after the loss of ovarian function. Furthermore, adiposity and physical activity levels may modulate whether exercise has any effect on body weight regulation in this context. Therefore, it will be important to elucidate the underlying mechanisms of the interplay between SPA, the loss of ovarian hormones, and obesity and their effects on menopause-associated metabolic dysfunction.
It is very common for women to enter the menopausal transition with preexisting obesity and a history of weight loss, and exercise is often used to assist in weight control. We recreated this phenotypic milieu to gain novel insight into how exercise can counteract the energetic challenges of menopause. Combining a history of prolonged caloric restriction with loss of ovarian function resulted in rapid weight gain after OVX, as described in our recent paper (9). We expected exercise to counteract the biological drive to regain weight by preserving insulin sensitivity, mitochondrial biogenesis, and fat oxidation in muscle, bone, and liver, and the resulting energy expenditure that might otherwise decrease with the removal of ovarian hormones (8, 24–26). Exercise reduces overfeeding during weight regain in males, which can then prevent weight from returning to pre-weight loss levels (13). Prior work suggested that females under the same conditions would compensate for the energy deficit of exercise with increased food intake (27). This appears to be the case for female OR OVX rats in the current study and in intact females in our prior work (11). At present, it is unclear as to why adiposity levels modulate the effect of exercise on weight regain after OVX, but it appears that obesity is modulating how exercise and ovarian hormones interact in homeostatic regulation.
Considering that SPA markedly decreased after OVX, the increase in TEE during early regain was clearly a reflection of increased food intake and the resulting thermic effect of feeding. The changes in absolute TEE levels did not provide a clear explanation for the differential effects of exercise on weight regain in OR and OP rats. The adjusted (lean mass) analysis would, however, suggest that regular exercise reduced metabolic efficiency in OP rats. This effect on metabolic efficiency may have contributed to the attenuated weight regain over the subsequent 8 weeks of refeeding. Regardless of lean mass differences, the modest (~2 kcal/d) difference in EB between OP-EX and OP-SED could reasonably explain the differential weight gain when extrapolated over time.
Another factor that may have contributed to this differential weight regain is how the ingested energy is utilized and stored. We previously observed that OR female rats inherently have a greater capacity to oxidize dietary fat during overfeeding (3). Exercise training is known to induce a glycogen-sparing effect and increases the capacity to oxidize fat (28). In male OP rats, we observed that regular exercise increased the oxidation of dietary fat and trafficked excess carbohydrate through more energetically expensive pathways of deposition (de novo lipogenesis) (23). This differential fuel trafficking and use was associated with an increase in TEE and attenuated weight regain. In the present study, we speculated that exercise may have been less effective in OR females because of their inherent ability to take up and oxidize dietary fat. Contrary to this hypothesis, regular exercise tended to improve metabolic capacity of isolated mitochondria in OR, but not OP rats. Taken together, these data would suggest that the exercise-induced attenuation of weight regain in OP rats could not be linked to a preferential induction of metabolic capacity. To our surprise, it was the decline in SPA, and not the exercise intervention, that was associated with the metabolic characteristics of muscle mitochondrial function.
The bone formation response to mechanical loading is strongest when the loads (and resulting strains) are dynamic, rapid or large, and non-routine. Favorable skeletal adaptations with exercise were not surprising, because exercise provides dynamic loading (29). The effect of exercise was more evident in the tibia, which experiences greater mechanical strain during running. Our results clearly indicate that adiposity, which is static loading, did not induce favorable bone adaptations. We did, however, find an independent effect of SPA on skeletal outcomes in the secondary analysis. SPA generally consists of numerous low-level routine loads (30), which could protect osteocyte and osteoblast viability and potentiate the response to higher magnitude mechanical loading that comes with exercise (31).
Given that the changes in SPA correlated with so many of the outcomes in this study, it may be that we need to direct more attention to this critical variable and its impact on the metabolic effects of OVX. The fact that these rats had large individual variability in the change in SPA in response to OVX allowed us to perform a hypothesis-generating secondary analyses. The decline in SPA that occurs with OVX is thought to be estrogen-dependent (8, 32), but more recent evidence suggest that the compensatory increase in FSH may also be involved (33). We do not know what underlies the variability in the decrease in SPA or why those that had higher preOVX SPA lost more SPA following OVX, although central regulation is certainly involved (34). What we show here and in our previous report is that the decline in SPA precedes the weight regain (9). In this paper, we go further to show that these changes predict food intake, energy balance, and subsequent decline in metabolic health. Whether this relationship is mediated by the capacity to oxidize fat (35, 36), changes in insulin or leptin sensitivity (37), or some other mechanism, will need to be determined in future studies.
Surgical OVX, as used in the present study, imparts an abrupt change in the hypothalamic-pituitary-gonadal (HPG) axis, whereas menopause is a longer-term transition in which the function of the ovaries is highly variable. This limitation in modeling the human condition needs to be considered when translating our observations. While the timing may be different, both OVX and menopause lead to a compensatory increase in FSH, which has been implicated in having an independent effect on adiposity, bone density, and other aspects of metabolic health (33). In the present study, end-of-study FSH concentrations were lower in OP rats. It is unclear if FSH is a moderator of the effects of exercise on weight regain after the loss of ovarian function, but it is FSH has been proposed to have numerous effects on peripheral tissues through its putative receptor (38). Future studies that dissect out the specific effects of each component of the HPG axis are warranted, while considering the important differences between the surgical intervention and the menopausal transition.
Conclusion
In conclusion, leanness and exercise do not necessarily protect from OVX-induced weight gain. Exercise ultimately prevented weight gain in OP rats, but it was loss of SPA that was the greatest contributor to postOVX weight gain. These observations suggest a complex perturbation in homeostatic regulation that has implications for women at the menopausal transition. Further studies are needed to understand the interplay between adiposity, SPA, and the loss of ovarian function, so that we can better prevent menopause-associated metabolic dysfunction.
Supplementary Material
SDC 2: Supplemental Figure 1. A: In all groups, total, ambulatory, and nonambulatory spontaneous physical activity (SPA) progressively decreased (all p<0.01) from before OVX to the calorically limited phase (before regain) after OVX, to the early AL refeeding phase after OVX, and to just prior to sacrifice. No significant difference in change in SPA counts between groups. * p<0.01 different from previous time point.
SDC 3: Supplemental Figure 2. Total energy expenditure (TEE), adjusted for body weight, lean mass, or fat mass before OVX, and after OVX during caloric limitation, during the first 3 days of regain, and just prior to sacrifice. †p<0.05 phenotype x activity interaction (OP-SED < OP-EX). *p<0.05 main effect of activity (EX>SED).
SDC 6: Supplemental 3A-F. A: Secondary analysis with SED and EX groups separated based on the median relative change (%) in spontaneous physical activity (SPA) from preOVX to the first week of postOVX ad libitum refeeding demonstrated two distinct patterns of loss of SPA. B: Those who had the largest decreases in SPA (D-SPA) after OVX were more active prior to OVX. C. Groups who remained closer to preOVX SPA levels (S-SPA) during early postOVX AL refeeding had lower early increases in energy intake (EI) and total energy expenditure (TEE), and D: slower weight regain over the 1st week of overfeeding. E: At the end of study, S-SPA rats had higher tibia resistance to bending. F: S-SPA groups tended to have less total weight regain (p=0.06), which was mostly fat. N=5-8/grp. *p<0.05 Significantly different from their D-SPA counterparts.
SDC 1: Supplementary Table 1. Dietary formula of medium fat diet provided by Research Diets Inc.
SDC 4: Supplementary Table 2. State 3 and state 4 respiration of gastrocnemius muscle
SDC 5: Supplementary Table 3. Plasma FSH, insulin, and osteocalcin, and urinary corticosterone.
Acknowledgements
We appreciate the assistance of the Colorado Nutrition and Obesity Research Center’s Energy Balance Laboratory and Metabolic Core [National Institute of Diabetes and Digestive and Kidney Diseases (NIDDK) Grant DK-48520].
Grants
Funding Sources: This study was supported by the following National Institute of Health (NIH) grants: P50 HD073063 (PSM, VDS), T32 DK007658 (VDS), TR002534 (VDS), U54 AG062319 (PSM), P30 48520 (NORC), K99/R00 CA169430 (EDG), UL1TR002535 (JAH), TL1TR002533 (RF, DP).
Footnotes
Disclosures
No conflicts of interest, financial or otherwise, are declared by the authors. Results of the study do not constitute endorsement by the American College of Sports Medicine.
References
- 1.Kraschnewski JL, Boan J, Esposito J, et al. Long-term weight loss maintenance in the united states. Int J Obes. 2010;34(11):1644–54. [DOI] [PMC free article] [PubMed] [Google Scholar]
- 2.Maclean PS, Bergouignan A, Cornier MA and Jackman MR. Biology’s response to dieting: The impetus for weight regain. Am J Physiol Regul Integr Comp Physiol. 2011;301(3):R581–600. [DOI] [PMC free article] [PubMed] [Google Scholar]
- 3.Jackman MR, Kramer RE, MacLean PS and Bessesen DH. Trafficking of dietary fat in obesity-prone and obesity-resistant rats. Am J Physiol Endocrinol Metab. 2006;291(5):E1083–91. [DOI] [PubMed] [Google Scholar]
- 4.Astrup A The relevance of increased fat oxidation for body-weight management: Metabolic inflexibility in the predisposition to weight gain. Obes Rev. 2011;12(10):859–65. [DOI] [PubMed] [Google Scholar]
- 5.Polotsky HN and Polotsky AJ. Metabolic implications of menopause. Semin Reprod Med. 2010;28(5):426–34. [DOI] [PubMed] [Google Scholar]
- 6.Lobo RA. Metabolic syndrome after menopause and the role of hormones. Maturitas. 2008;60(1):10–8. [DOI] [PubMed] [Google Scholar]
- 7.Melanson EL, Gavin KM, Shea KL, et al. Regulation of energy expenditure by estradiol in premenopausal women. J Appl Physiol (1985). 2015;119(9):975–81. [DOI] [PMC free article] [PubMed] [Google Scholar]
- 8.Giles ED, Jackman MR, Johnson GC, Schedin PJ, Houser JL and MacLean PS. Effect of the estrous cycle and surgical ovariectomy on energy balance, fuel utilization, and physical activity in lean and obese female rats. Am J Physiol Regul Integr Comp Physiol. 2010;299(6):R1634–42. [DOI] [PMC free article] [PubMed] [Google Scholar]
- 9.Sherk VD, Jackman MR, Giles ED, et al. Prior weight loss exacerbates the biological drive to gain weight after the loss of ovarian function. Physiol Rep. 2017;5(10). [DOI] [PMC free article] [PubMed] [Google Scholar]
- 10.Tate DF, Jeffery RW, Sherwood NE and Wing RR. Long-term weight losses associated with prescription of higher physical activity goals. Are higher levels of physical activity protective against weight regain? Am J Clin Nutr. 2007;85(4):954–9. [DOI] [PubMed] [Google Scholar]
- 11.Foright RM, Presby DM, Sherk VD, et al. Is regular exercise an effective strategy for weight loss maintenance? Physiol Behav. 2018;188:86–93. [DOI] [PMC free article] [PubMed] [Google Scholar]
- 12.Catenacci VA, Ogden LG, Stuht J, et al. Physical activity patterns in the national weight control registry. Obesity. 2008;16(1):153–61. [DOI] [PMC free article] [PubMed] [Google Scholar]
- 13.MacLean PS, Higgins JA, Wyatt HR, et al. Regular exercise attenuates the metabolic drive to regain weight after long-term weight loss. Am J Physiol Regul Integr Comp Physiol. 2009;297(3):R793–802. [DOI] [PMC free article] [PubMed] [Google Scholar]
- 14.Giles ED, Steig AJ, Jackman MR, et al. Exercise decreases lipogenic gene expression in adipose tissue and alters adipocyte cellularity during weight regain after weight loss. Front Physiol. 2016;7:32. [DOI] [PMC free article] [PubMed] [Google Scholar]
- 15.Pighon A, Paquette A, Barsalani R, et al. Resistance training attenuates fat mass regain after weight loss in ovariectomized rats. Maturitas. 2009;64(1):52–7. [DOI] [PubMed] [Google Scholar]
- 16.Jackman MR, MacLean PS and Bessesen DH. Energy expenditure in obesity-prone and obesity-resistant rats before and after the introduction of a high-fat diet. Am J Physiol Regul Integr Comp Physiol. 2010;299(4):R1097–105. [DOI] [PMC free article] [PubMed] [Google Scholar]
- 17.Giles ED, Jackman MR and MacLean PS. Modeling diet-induced obesity with obesity-prone rats: Implications for studies in females. Front Nutr. 2016;3(50. [DOI] [PMC free article] [PubMed] [Google Scholar]
- 18.Park SB, Lee YJ and Chung CK. Bone mineral density changes after ovariectomy in rats as an osteopenic model : Stepwise description of double dorso-lateral approach. J Korean Neurosurg Soc. 2010;48(4):309–12. [DOI] [PMC free article] [PubMed] [Google Scholar]
- 19.Sherk VD, Carpenter RD, Giles ED, et al. Ibuprofen before exercise does not prevent cortical bone adaptations to training. Med Sci Sports Exerc. 2017;49(5):888–95. [DOI] [PMC free article] [PubMed] [Google Scholar]
- 20.Weir JB. New methods for calculating metabolic rate with special reference to protein metabolism. J Physiol. 1949;109(1–2):1–9. [DOI] [PMC free article] [PubMed] [Google Scholar]
- 21.Doube M, Klosowski MM, Arganda-Carreras I, et al. Bonej: Free and extensible bone image analysis in imagej. Bone. 2010;47(6):1076–9. [DOI] [PMC free article] [PubMed] [Google Scholar]
- 22.Makinen MW and Lee CP. Biochemical studies of skeletal muscle mitochondria. I. Microanalysis of cytochrome content, oxidative and phosphorylative activities of mammalian skeletal muscle mitochondria. Arch Biochem Biophys. 1968;126(1):75–82. [DOI] [PubMed] [Google Scholar]
- 23.Steig AJ, Jackman MR, Giles ED, et al. Exercise reduces appetite and traffics excess nutrients away from energetically efficient pathways of lipid deposition during the early stages of weight regain. Am J Physiol Regul Integr Comp Physiol. 2011;301(3):R656–67. [DOI] [PMC free article] [PubMed] [Google Scholar]
- 24.Oosthuyse T and Bosch AN. Oestrogen’s regulation of fat metabolism during exercise and gender specific effects. Curr Opin Pharmacol. 2012;12(3):363–71. [DOI] [PubMed] [Google Scholar]
- 25.Gupte AA, Pownall HJ and Hamilton DJ. Estrogen: An emerging regulator of insulin action and mitochondrial function. J Diabetes Res. 2015;2015(916585). [DOI] [PMC free article] [PubMed] [Google Scholar]
- 26.Rohling M, Herder C, Stemper T and Mussig K. Influence of acute and chronic exercise on glucose uptake. J Diabetes Res. 2016;2016(2868652). [DOI] [PMC free article] [PubMed] [Google Scholar]
- 27.Applegate EA, Upton DE and Stern JS. Food intake, body composition and blood lipids following treadmill exercise in male and female rats. Physiol Behav. 1982;28(5):917–20. [DOI] [PubMed] [Google Scholar]
- 28.Fan W, Waizenegger W, Lin CS, et al. Ppardelta promotes running endurance by preserving glucose. Cell Metab. 2017;25(5):1186–93 e4. [DOI] [PMC free article] [PubMed] [Google Scholar]
- 29.Turner CH. Three rules for bone adaptation to mechanical stimuli. Bone. 1998;23(5):399–407. [DOI] [PubMed] [Google Scholar]
- 30.Rubin CT and Lanyon LE. Regulation of bone formation by applied dynamic loads. J Bone Joint Surg Am. 1984;66(3):397–402. [PubMed] [Google Scholar]
- 31.Sherk VD and Rosen CJ. Senescent and apoptotic osteocytes and aging: Exercise to the rescue? Bone. 2019;121(255–8. [DOI] [PMC free article] [PubMed] [Google Scholar]
- 32.Gorzek JF, Hendrickson KC, Forstner JP, Rixen JL, Moran AL and Lowe DA. Estradiol and tamoxifen reverse ovariectomy-induced physical inactivity in mice. Med Sci Sports Exerc. 2007;39(2):248–56. [DOI] [PubMed] [Google Scholar]
- 33.Liu P, Ji Y, Yuen T, et al. Blocking fsh induces thermogenic adipose tissue and reduces body fat. Nature. 2017;546(7656):107–12. [DOI] [PMC free article] [PubMed] [Google Scholar]
- 34.Roberts MD, Ruegsegger GN, Brown JD and Booth FW. Mechanisms associated with physical activity behavior: Insights from rodent experiments. Exerc Sport Sci Rev. 2017;45(4):217–22. [DOI] [PubMed] [Google Scholar]
- 35.Bergouignan A, Momken I, Lefai E, et al. Activity energy expenditure is a major determinant of dietary fat oxidation and trafficking, but the deleterious effect of detraining is more marked than the beneficial effect of training at current recommendations. Am J Clin Nutr. 2013;98(3):648–58. [DOI] [PubMed] [Google Scholar]
- 36.Rynders CA, Bergouignan A, Kealey E and Bessesen DH. Ability to adjust nocturnal fat oxidation in response to overfeeding predicts 5-year weight gain in adults. Obesity. 2017;25(5):873–80. [DOI] [PMC free article] [PubMed] [Google Scholar]
- 37.Flores MB, Fernandes MF, Ropelle ER, et al. Exercise improves insulin and leptin sensitivity in hypothalamus of wistar rats. Diabetes. 2006;55(9):2554–61. [DOI] [PubMed] [Google Scholar]
- 38.Das N and Kumar TR. Molecular regulation of follicle-stimulating hormone synthesis, secretion and action. J Mol Endocrinol. 2018;60(3):R131–R55. [DOI] [PMC free article] [PubMed] [Google Scholar]
Associated Data
This section collects any data citations, data availability statements, or supplementary materials included in this article.
Supplementary Materials
SDC 2: Supplemental Figure 1. A: In all groups, total, ambulatory, and nonambulatory spontaneous physical activity (SPA) progressively decreased (all p<0.01) from before OVX to the calorically limited phase (before regain) after OVX, to the early AL refeeding phase after OVX, and to just prior to sacrifice. No significant difference in change in SPA counts between groups. * p<0.01 different from previous time point.
SDC 3: Supplemental Figure 2. Total energy expenditure (TEE), adjusted for body weight, lean mass, or fat mass before OVX, and after OVX during caloric limitation, during the first 3 days of regain, and just prior to sacrifice. †p<0.05 phenotype x activity interaction (OP-SED < OP-EX). *p<0.05 main effect of activity (EX>SED).
SDC 6: Supplemental 3A-F. A: Secondary analysis with SED and EX groups separated based on the median relative change (%) in spontaneous physical activity (SPA) from preOVX to the first week of postOVX ad libitum refeeding demonstrated two distinct patterns of loss of SPA. B: Those who had the largest decreases in SPA (D-SPA) after OVX were more active prior to OVX. C. Groups who remained closer to preOVX SPA levels (S-SPA) during early postOVX AL refeeding had lower early increases in energy intake (EI) and total energy expenditure (TEE), and D: slower weight regain over the 1st week of overfeeding. E: At the end of study, S-SPA rats had higher tibia resistance to bending. F: S-SPA groups tended to have less total weight regain (p=0.06), which was mostly fat. N=5-8/grp. *p<0.05 Significantly different from their D-SPA counterparts.
SDC 1: Supplementary Table 1. Dietary formula of medium fat diet provided by Research Diets Inc.
SDC 4: Supplementary Table 2. State 3 and state 4 respiration of gastrocnemius muscle
SDC 5: Supplementary Table 3. Plasma FSH, insulin, and osteocalcin, and urinary corticosterone.