

Abstract
Background: Progression of disease after hepatitis C virus (HCV) infection differs among individuals, indicating a possibility of participation of host genetic factors. 2′‐5′‐oligoadenylate synthetase 1 (OAS‐1), an important component of the innate immune system, has an antiviral function, and may therefore have a certain relationship with progression of disease.
Aim: To evaluate single nucleotide polymorphisms (SNPs) of OAS‐1 and its relationship with the disease status of HCV infection.
Methods: Six SNPs of OAS‐1 were selected and examined in 409 Japanese patients with chronic HCV infection using the TaqMan PCR genotyping method. The relationship of SNP genotypes and clinical manifestations of patients was analysed. Then, a pair of OAS‐1‐expression plasmids mimicking the clinical‐related SNPs were created and transfected into liver cells carrying the HCV subgenomic replicon or the full‐length genome, JFH1, and HCV replication after transfection was compared.
Results: Patients with genotypes A/A, A/G and G/G of an SNP of OAS‐1 at the exon 3 of its coding sequence were at gradient increased risks of suffering from higher serum alanine aminotransferase (P<0.001) and aspartate aminotransferase (P=0.001), higher degree of liver fibrosis (P=0.010) and higher presence of liver cirrhosis (P=0.001). By multivariate logistic regression analysis, genotype G/G was an independent factor associated with cirrhosis (P=0.013, odds ratio 3.11, 95% confidence interval 1.27–7.63). In liver cells, OAS‐1 with the G allele showed lower ability to inhibit virus replication than OAS‐1 with the A allele (P=0.004).
Conclusions: The SNP of OAS‐1 at the exon 3 of its coding sequence was associated with progression of disease in Japanese patients with HCV infection.
Keywords: cirrhosis, fibrosis, JFH1, replicon, SNP
When infected by the hepatitis C virus (HCV), some patients have minimal progression of disease while some develop a severe liver disease state such as an unremittent high transaminase level, liver fibrosis and cirrhosis (1, 2). Knowledge of the risk factors of developing into severe liver disease is important for treatment of chronic HCV infection. Understanding which patients are likely to develop significant liver disease would allow more rational use of therapy, and potentially help identify new therapeutic targets.
Ageing, male sex and alcohol consumption are already been known to be risk factors associated with progression of liver disease (3, 4, 5). However, even for patients of the same age, sex and with the same alcohol consumption, there are different styles of disease progression. To determine the difference of disease progression among patients, host genetic factors, such as single nucleotide polymorphism (SNP), have been receiving the attention of many scholars (6).
It is usually accepted that inflammation‐associated necrosis/apoptosis and regeneration ultimately lead to progression of liver disease (7, 8, 9). Genetic factors concerning innate immunity affect the suppression of HCV, and may therefore be related to sustained inflammation and progression of liver disease. 2′‐5′‐oligoadenylate synthetase 1 (OAS‐1) is an important component of the innate immune system (10). After binding with double‐strand RNA (dsRNA), it catalyses the formation of 2′‐5′‐linked oligoadenylate and activates RNaseL, which breaks down viral RNA (11, 12). An SNP of OAS‐1 had been reported to be related to sustained infection of Caucasian hepatitis C patients (13). Another SNP of OAS‐1 was reported in another study to be related to development of severe acute respiratory syndrome (SARS, a coronavirus infection) (14). A nonsense single nucleotide mutation in the gene encoding OAS‐1 was also reported to be associated with West Nile virus susceptibility in laboratory mice (15).
In our previous studies, we have reported the association of liver disease progression with the polymorphism of interleukin‐1β, UDP‐glucuronosyltransferase 1A7, MDM2, SCBY14, CRHR2 and GFRA1 (16, 17, 18). In this study, we first evaluated SNPs of OAS‐1 and its relationship with the disease status of chronic hepatitis C, and then created a pair of OAS‐1‐expression plasmids mimicking the SNPs that are related to clinical manifestations, to investigate its function in liver cell model.
Materials and methods
Patients
We studied 409 consecutive Japanese patients with chronic HCV infection who consulted the clinic of the University of Tokyo Hospital between August 2001 and June 2003 (227 men and 182 women, 22–84 years old). The genomic DNA of these patients was made available after obtaining written informed consent for genotyping. We also obtained approval from the institutional ethics committee (no. 400), and all the procedures followed institutional guidelines (19).
Patients selected for this study were those who tested positive for HCV antibody (Ortho Diagnostics, Tokyo, Japan), and HCV RNA was measured using the Amplicor HCV assay (Roche, Tokyo, Japan). All patients were hepatitis B surface antigen (Abbott Laboratories, North Chicago, IL, USA) negative. Among 179 cirrhotic patients, 54 patients were confirmed by biopsy. In patients without biopsy specimens, the diagnosis of cirrhosis was made by the presence of clinical manifestations of portal hypertension (e.g. varices, encephalopathy or ascites), biochemical abnormalities [elevated serum bilirubin, decreased serum albumin or prolonged prothrombin time (PT)] and obvious morphological change of the liver detected by hepatic imaging (e.g. ultrasonography, computed tomography, arteriography or magnetic resonance imaging). The diagnosis of HCC was made by several imaging methods and all confirmed histologically by sonography‐guided fine needle biopsy.
Polymorphism genotyping
Genomic DNA was extracted from 100 μl whole blood using the SepaGene kit (Sanko Junyaku, Tokyo, Japan) according to the manufacturer's instructions. Extracted DNA was dissolved in 20 μl of 10 mM Tris‐HCl buffer (pH 8.0) containing 1 mM EDTA, and was stored at −30 °C until use.
As shown in Table 1, six SNPs in the OAS‐1 gene were selected for study. We selected two SNP sites from the promoter region, two SNP sites from the coding sequence (CDS, both of two SNPs are nonsynonymous) and two SNP sites from the 3′‐untranslated region (UTR) or exon 6 (due to different transcripts). We selected these targets for the reason that different nucleic acids at the promoter region may lead to different levels of transcription, while different nucleic acids at the exon, which leads to substitution of amino acids, may eventually change the function of this protein.
Table 1.
Single nucleotide polymorphisms of 2′‐5′‐oligoadenylate synthetase 1 selected for study
| Role | Relative position | dbSNP ID | Alleles | Amino acid change |
|---|---|---|---|---|
| Promoter | −1377 | rs2158390 | G/C | – |
| Promoter | −580 | rs12322047 | A/G | – |
| CDS (exon 1) | 183 | rs1050994 | C/T | Asp/Asn |
| CDS (exon 3) | 4119 | rs3741981 | A/G | Ser/Gly |
| 3′‐UTR/exon 6 | 12458 | rs3177979 | A/G | – |
| 3′‐UTR/exon 6 | 12691 | rs2660 | A/G | – |
CDS, coding sequence; UTR, untranslated region.
We performed SNP genotyping using TaqMan SNP Genotyping Assays or Custom TaqMan SNP Genotyping Assays (20), and the ABI 7000 sequence detection system (Applied Biosystems, Foster City, CA, USA). The polymerase chain reaction (PCR) mixture contained 10 ng of genomic DNA, one‐fold TaqMan universal PCR master mix (Applied Biosystems), forward and reverse primers (900 μM each, Applied Biosystems) and 200 nM VIC‐labelled probe and 200 nM of FAM‐labelled probe (Applied Biosystems). Primers and probes were commercially available products of Applied Biosystems, but their sequence was closed under patent.
Polymerase chain reaction was carried out in 96‐well plates with a reaction volume of 25 μl. Thermal cycle conditions were 50 °C for 2 min, 95 °C for 10 min, 40 cycles of 92 °C for 15 s and 60 °C for 1 min. Completed PCR plates were read on an ABI PRISM 7000 sequence detector and analysed using allelic discrimination sequence detection software (Applied Biosystems). The genotype of each patient was determined from the figure represented by this software (Fig. 1).
Figure 1.

An example of TaqMan allelic discrimination. The figure shows a representative result of allelic discrimination of a 96‐well plate, with 91 samples and five controls. After real‐time polymerase chain reaction using TaqMan primers and probes, products were divided into three groups according to their original genotype. In this example, the horizontal axis means that the sample was detected by probe connecting with the OAS‐1/allele A single strain (a VIC‐labelled probe), and the vertical axis means that the sample was detected by probe connecting with the OAS‐1/allele G single strain (a FAM‐labelled probe). Therefore, human DNA of A/A type was only detected by the first probe (round‐shaped dots), the G/G type was only detected by the second probe (diamond‐shaped dots) and the A/G type was detected by both probes (triangle‐shaped dots). The square‐shaped dots were no‐template‐control samples, which showed no detection by any probe. OAS‐1, 2′‐5′‐oligoadenylate synthetase 1.
Construction of cell line carrying the hepatitis C virus subgenomic replicon or the full‐length hepatitis C virus
Human liver tumour cell line Huh7 was maintained in Dulbecco's modified Eagle medium (GIBCO BRL, Gaithersburg, MD, USA) supplemented with 10% heat‐inactivated fetal bovine serum in an atmosphere containing 5% CO2. In vitro‐transcribed HCV subgenomic RNA and full‐length JFH1 RNA were prepared as described previously (21, 22). An HCV subgenomic replicon plasmid expressing a chimeric protein consisting of neomycin phosphotransferase and firefly luciferase (kindly provided by Dr N. Sakamoto, Tokyo Medical and Dental University, Tokyo, Japan) (21) and a plasmid containing a full‐length HCV JFH1 cDNA downstream of T7 RNA promoter (a gift from Dr T. Wakita, National Institute of Infectious Diseases, Tokyo, Japan) (22) were linearized with XbaI. RNA transcripts were synthesized from 2 μg of the linearized DNA using the MEGAscript T7 system (Ambion, Austin, TX, USA) and added to 0.42 ml of 107/ml PBS‐washed Huh7 cells. The mixture was placed in an electroporation cuvette (Bio‐Rad Laboratories, Hercules, CA, USA) and pulsed with 0.27 kV for 30 μs. After 10 min of recovery at room temperature, cells were divided and plated onto five dishes for culture. Twenty‐four hours later, the medium was changed to 250 μg/ml G418‐containing medium, and 3 weeks later, survival colonies were picked up and passaged for further study.
These cells contained a stably harbouring HCV subgenomic replicon or full‐length HCV genome. We determined the relative amount of HCV subgenomic replicon according to firefly‐luciferase activity, and the relative amount of the full‐length HCV by Western blotting of the HCV core protein.
Construction and transfection of plasmids expressing 2′‐5′‐oligoadenylate synthetase 1
A pcDNA3 plasmid containing the OAS‐1 coding sequence (kindly provided by Dr Y. Li, Baylor College of Medicine, Houston, TX, USA) was sequenced to confirm the nucleotide sequence corresponding to the SNP that related to clinical manifestations. Site‐directed single nucleotide mutagenesis was performed using the Site Mutation System (Stratagene, La Jolla, CA, USA) to create the second plasmid having a mutation corresponding to SNP. Two plasmids had a difference in only one nucleotide, mimicking OAS‐1 having a major allele or a minor allele.
Transfection efficiency was monitored by cotransfection of pRL‐TK (Toyo Ink, Tokyo, Japan), a control plasmid expressing Renilla reniformis (seapansy) luciferase driven by the herpes simplex virus thymidine kinase promoter.
Each of two plasmids or pcDNA3 plasmid containing no OAS‐1 sequence as a negative control was transfected into Huh7 cells carrying the HCV subgenomic replicon or the full‐length HCV genome using Effectene Transfection Reagent (Qiagen, Hilden, Germany) according to the manufacturer's instructions. Huh7 cells carrying the HCV subgenomic replicon or the full‐length HCV were plated onto a well of a six‐well tissue culture plate 24 h before transfection. A total of 0.4 μg of plasmid (OAS‐1 expressing plasmid or mock plasmid plus pRL‐TK) was mixed with Effectene, and was added to each well of the cells.
Luciferase assay and quantification of hepatitis C virus core protein
Cells were harvested 48 h after transfection. For cells harbouring subgenomic replicon, luciferase assays were performed using the PicaGene dual seapansy system (Toyo Ink). Firefly‐luciferase activity and seapansy‐luciferase activity were measured as relative light units with a luminometer (Lumat LB9507, EG&G Berthold, Bad Wildbad, Germany). The firefly‐luciferase activity was then normalized for transfection efficiency based on the seapansy‐luciferase activity. Data were reported as the mean value from triplicate wells. The percentage of luciferase activities relative to that of control, which reflected the percentage of residual HCV replicon after overexpression of OAS‐1, was compared between the two kinds of plasmids. Besides the cotransfection of control plasmid expressing Renilla reniformis, Western blotting confirming OAS‐1 protein expression was also performed.
For cells harbouring the full‐length HCV genome, the amount of HCV core protein was determined by Western blotting 48 h after transfection. The relative level of the HCV core protein was compared among these cells transfected with two OAS‐1‐expressing plasmids.
Statistical analysis
Clinical parameters were evaluated using the t‐test or anova and the χ2‐test to determine their association with the genotype of OAS‐1 of patients. A P‐value of less than 0.05 was considered significant. Possible confounding effects among the variables were adjusted using a stepwise multivariate logistic regression model, and odds ratio and its 95% confidence intervals were calculated. In studies with cells, the experiment was repeated three times and the percentage of residual HCV replicon or HCV core protein after overexpression of OAS‐1 was compared using a t‐test. Data analysis was performed using spss version 12.0 (SPSS Inc., Chicago, IL, USA). The Hardy–Weinberg equilibrium (HWE) of alleles at individual loci was evaluated using HWE (ftp://linkage.rockefeller.edu/software).
Results
Frequency of 2′‐5′‐oligoadenylate synthetase 1 polymorphisms
Among six SNPs studied, two SNPs (rs12322047 and rs1050994), as were ever reported in the other population, were revealed to be only major allele (Table 2). This did not allow any further meaningful analyses. Genotype frequencies of rs2158390, rs3741981, rs3177979 and rs2660 are consistent with the data of the Japanese population reported before (http://snp.ims.u-tokyo.ac.jp). The genotype frequencies observed approximated those based on allele frequency calculations, and thus conformed to HWE. SNPs rs3177979 and rs2660 are of complete linkage. The frequency of each SNP in our population is listed in Table 2.
Table 2.
Frequency of 2′‐5′‐oligoadenylate synthetase 1polymorphisms
| dbSNP ID | Position | Total number | Number (%) | |||||
|---|---|---|---|---|---|---|---|---|
| Homozygosity | Heterozygosity | Minor alleles | ||||||
| rs12322047 | Promoter | 92 | A/A | 92 (100%) | A/G | 0 | G/G | 0 |
| rs2158390 | Promoter | 409 | G/G | 395 (96.6%) | G/C | 14 (3.4%) | C/C | 0 |
| rs1050994 | CDS | 409 | C/C | 409 (100%) | C/T | 0 | T/T | 0 |
| rs3741981 | CDS | 409 | A/A | 178 (43.5%) | A/G | 173 (42.3%) | G/G | 58 (14.2%) |
| rs3177979 | 3′UTR | 409 | A/A | 276 (67.5%) | A/G | 113 (27.6%) | G/G | 20 (4.9%) |
| rs2660 | 3′UTR | 409 | A/A | 276 (67.5%) | A/G | 113 (27.6%) | G/G | 20 (4.9%) |
CDS, coding sequence; UTR, untranslated region.
Association of genotype with patients' laboratory examinations
As shown in Table 3, for patients with the rs2158390 heterozygote, although there was a tendency towards a decrease of the platelet count (PLT), serum albumin level (ALB) and PT, and elevation of alanine aminotransferase (ALT), aspartine aminotransferase (AST), γ‐glutamine phosphatase (gGTP), alkaline phosphatase (ALP) and total bilirubin (TB), there was no statistically significant difference.
Table 3.
Association of genotype with patients' laboratory examinations
| Genotype | PLT | ALB | ALT | AST | ||||
|---|---|---|---|---|---|---|---|---|
| Value | P | Value | P | Value | P | Value | P | |
| rs2158390 G/G | 80.4 ± 1.6 | 0.157 | 3.9 ± 0.11 | 0.832 | 76.2 ± 2.9 | 0.704 | 70.4 ± 2.4 | 0.841 |
| G/C | 68.9 ± 6.2 | 3.8 ± 0.13 | 82.0 ± 9.5 | 73.0 ± 10.2 | ||||
| rs3741981 A/A | 79.8 ± 1.2 | 0.004 | 3.9 ± 0.03 | 0.075 | 68.3 ± 3.5 | 0.000 | 63.1 ± 2.6 | 0.001 |
| A/G | 79.6 ± 1.1 | 3.8 ± 0.04 | 75.0 ± 3.9 | 72.0 ± 3.7 | ||||
| G/G | 72.6 ± 2.1 | 3.8 ± 0.07 | 105.4 ± 11.0 | 88.9 ± 8.8 | ||||
| rs2660/A/A | 80.2 ± 2.1 | 0.942 | 4.0 ± 0.16 | 0.854 | 77.9 ± 3.3 | 0.017 | 71.6 ± 2.8 | 0.100 |
| rs3177979 A/G | 79.2 ± 1.5 | 3.9 ± 0.05 | 67.7 ± 4.0 | 64.7 ± 3.2 | ||||
| G/G | 81.4 ± 3.3 | 3.9 ± 0.13 | 105.1 ± 24.0 | 87.9 ± 20.4 | ||||
| Genotype | gGTP | ALP | TB | PT | ||||
|---|---|---|---|---|---|---|---|---|
| Value | P | Value | P | Value | P | Value | P | |
| rs2158390 G/G | 69.2 ± 3.8 | 0.590 | 218 ± 4.3 | 0.891 | 0.88 ± 0.03 | 0.377 | 14.1 ± 0.5 | 0.529 |
| G/C | 80.2 ± 16.7 | 222 ± 19.6 | 1.01 ± 0.21 | 12.4 ± 1.1 | ||||
| rs3741981 A/A | 62.5 ± 4.2 | 0.051 | 210 ± 6.4 | 0.095 | 0.84 ± 0.03 | 0.098 | 14.0 ± 0.4 | 0.144 |
| A/G | 69.8 ± 6.7 | 222 ± 6.1 | 0.88 ± 0.05 | 13.8 ± 0.5 | ||||
| G/G | 90.3 ± 11.4 | 237 ± 12.2 | 1.02 ± 0.07 | 12.2 ± 0.8 | ||||
| rs2660/A/A | 71.9 ± 4.9 | 0.023 | 219 ± 5.1 | 0.492 | 0.87 ± 0.03 | 0.909 | 14.2 ± 0.7 | 0.782 |
| rs3177979 A/G | 57.3 ± 4.4 | 222 ± 8.6 | 0.89 ± 0.07 | 13.5 ± 0.6 | ||||
| G/G | 104.5 ± 24.5 | 198 ± 13.9 | 0.92 ± 0.10 | 13.6 ± 1.5 | ||||
The units are PLT 103/μl; ALB g/dl; ALT IU/L; AST IU/L; gGTP IU/L; ALP IU/L; TB mg/dl; and PT second respectively.
ALB, serum albumin level; ALP, alkaline phosphatase; ALT, alanine aminotransferase; AST, aspartine aminotransferase; gGTP, γ‐glutamine phosphatase; PLT, platelet count; PT, prothrombin time; TB, total bilirubin.
For patients with rs3741981 homozygous wild type (A/A), heterozygous type (A/G) and homozygous minor allele (G/G), there was a gradient increase of ALT and AST (P<0.001 and P=0.001). A decrease of PLT was also found in the minor allele. There was also a tendency towards a decrease of ALB, and elevation of gGTP, ALP and TB, but not statistically significant.
In the situation of rs3177979/rs2660 (complete linkage), there was an increase of ALT and gGTP in the group of minor allele, but it did not show a gradient increase style from a homozygous wild type to a heterozygous type. The difference in the other laboratory examinations did not reach a statistically significant level.
We also tested 323 patients' peripheral serum HCV RNA level, but there was no difference in the HCV RNA level among patients with different genotypes (Table 4).
Table 4.
Association of 2′‐5′‐oligoadenylate synthetase 1 genotype and patients' hepatitis C virus RNA Level
| dbSNP ID | Genotype | Number | HCV RNA level (ng/μl) | P value |
|---|---|---|---|---|
| rs2158390 | G/G | 311 | 468 ± 19 | 0.881 |
| G/C | 12 | 483 ± 71 | ||
| rs3741981 | A/A | 139 | 491 ± 30 | 0.538 |
| A/G | 139 | 457 ± 26 | ||
| G/G | 45 | 435 ± 49 | ||
| rs2660/3177979 | A/A | 218 | 472 ± 23 | 0.924 |
| A/G | 89 | 464 ± 35 | ||
| G/G | 16 | 441 ± 71 |
HCV, hepatitis C virus.
Association of genotype with liver cirrhosis and degree of liver fibrosis
A relationship was found between the rs3741981 genotype and liver cirrhosis. Patients with rs3741981 genotypes A/A, A/G and G/G were at a gradient increased risk of suffering from liver cirrhosis (P=0.001, Table 5). No relationship was found between other SNPs and liver cirrhosis (Table 5). Among 95 patients with biopsy data of degree of fibrosis, a relationship between the rs3741981 genotype and the degree of liver fibrosis was also found. Patients with rs3741981 genotypes A/A, A/G and G/G were at a gradient increased risk of suffering from a higher degree of liver fibrosis (P=0.01, Table 6).
Table 5.
Association of 2′‐5′‐oligoadenylate synthetase 1 genotype and cirrhosis
| dbSNP ID | Genotype | Number | Cirrhosis (n=179) | No cirrhosis (n=230) | P value |
|---|---|---|---|---|---|
| rs2158390 | G/G | 395 | 172 (43.5%) | 223 (56.5%) | 0.785 |
| G/C | 14 | 7 (50.0%) | 7 (50.0%) | ||
| rs3741981 | A/A | 178 | 62 (34.8%) | 116 (65.2%) | 0.001 |
| A/G | 173 | 82 (47.4%) | 91 (52.6%) | ||
| G/G | 58 | 35 (60.3%) | 23 (39.7%) | ||
| rs2660/3177979 | A/A | 276 | 122 (44.2%) | 154 (55.8%) | 0.930 |
| A/G | 113 | 49 (43.4%) | 64 (56.6%) | ||
| G/G | 20 | 8 (40.0%) | 12 (60.0%) |
Table 6.
Association of 2′‐5′‐oligoadenylate synthetase 1 genotype and degree of fibrosis
| Genotype | Genotype | Number | F1 to F2 (n=20) | F3 to F4 (n=75) | P value |
|---|---|---|---|---|---|
| rs2158390 | G/G | 93 | 20 (21.5%) | 73 (78.5%) | 0.622 |
| G/C | 2 | 0 (0.0%) | 2 (100.0%) | ||
| rs3741981 | A/A | 41 | 14 (34.1%) | 27 (65.9%) | 0.010 |
| A/G | 42 | 3 (7.1%) | 39 (92.9%) | ||
| G/G | 12 | 3 (25.0%) | 9 (75.0%) | ||
| rs2660/3177979 | A/A | 67 | 17 (25.4%) | 50 (74.6%) | 0.166 |
| A/G | 25 | 2 (8.0%) | 23 (92.0%) | ||
| G/G | 3 | 1 (33.3%) | 2 (66.7%) |
In order to confirm the relationship between rs3741981 genotypes with liver cirrhosis, we also performed a multivariate analysis. The factors associated with liver cirrhosis in univariate analysis included rs3741981 genotype, age, PLT, ALB, TB, α‐fetoprotein level, PT and a diagnosis of hepatocellular carcinoma. Table 7 shows the factors associated with liver cirrhosis in multivariate analysis. The odds ratio of rs3741981 genotype G/G for liver cirrhosis was 3.1 (P=0.013, Table 7).
Table 7.
Multivariate analysis of factors related to cirrhosis
| Factors | P value | Odds ratio | 95% CI |
|---|---|---|---|
| rs3741981 | |||
| A/A | 1 | ||
| A/G | 0.089 | 1.708 | 0.922–3.165 |
| G/G | 0.013 | 3.112 | 1.269–7.631 |
| Age | 0.015 | 1.043 | 1.008–1.079 |
| PLT | 0.000 | 0.851 | 0.794–0.912 |
| ALB | 0.018 | 0.426 | 0.210–0.866 |
| PT | 0.005 | 0.966 | 0.944–0.990 |
| Diagnosis of HCC | 0.000 | 4.102 | 2.266–7.424 |
ALB, serum albumin level; CI, confidence interval; HCC, hepatocellular carcinoma; PLT, platelet count; PT, prothrombin time.
Relationship of genotype and interferon treatment response
Considering that OAS‐1 is an interferon (IFN)‐stimulated gene, we tested the relationship of genotype and IFN treatment response. Altogether, 107 patients in our population had data of IFN treatment response, but our result showed no relationship between genotype and IFN treatment response (Table 8).
Table 8.
Relationship of genotype and interferon treatment response
| dbSNP ID | Genotype | Number | Response (n=18) | No response (n=89) | P value |
|---|---|---|---|---|---|
| rs2158390 | G/G | 104 | 18 (17.3%) | 86 (82.7%) | 0.572 |
| G/C | 3 | 0 (0.0%) | 3 (100.0%) | ||
| rs3741981 | A/A | 41 | 7 (17.1%) | 34 (82.9%) | 0.820 |
| A/G | 49 | 9 (18.4%) | 40 (81.6%) | ||
| G/G | 17 | 2 (11.8%) | 15 (88.2%) | ||
| rs2660/3177979 | A/A | 71 | 12 (16.9%) | 59 (83.1%) | 0.894 |
| A/G | 32 | 5 (15.6%) | 27 (84.4%) | ||
| G/G | 4 | 1 (25.0%) | 3 (75.0%) |
Hepatitis C virus inhibitory effect of single nucleotide polymorphism‐simulating 2′‐5′‐oligoadenylate synthetase 1 in liver cells
A and G alleles of plasmids, mimicking the A/A and G/G genotypes of rs3741981, were confirmed by direct sequencing. Forty‐eight hours after transfection of these plasmids into Huh7 cells harbouring the HCV subgenomic replicon, a difference in the percentage of luciferase activities relative to that of control, which reflected the percentage of residual HCV replicon after overexpression of OAS‐1 with the A or the G allele, was found (Fig. 2). The percentage of residual HCV replicon after transfection of the G‐type plasmid was higher than that of the A‐type plasmid (P=0.004), indicating a weaker ability of G‐type OAS‐1 in inhibiting the HCV subgenomic replicon. As for Western blotting, no difference in the quantity of OAS‐1 expression was found between OAS‐1/allele A and OAS‐1/allele G (Fig. 3), indicating that the difference of virus suppression was due to the quality of OAS‐1.
Figure 2.
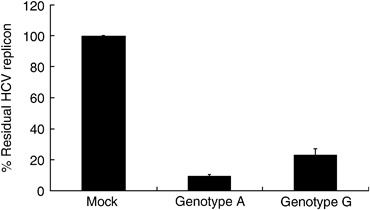
Effect of different OAS‐1 overexpressions on the hepatitis C virus (HCV) replicon. The A‐ and G‐type plasmids, mimicking the A/A and G/G genotype of an SNP rs3741981, were transfected into Huh7 cells harbouring the HCV subgenomic replicon, and luciferase activity was measured 48 h later. The values were displayed as the percentage of luciferase activities relative to that of control, which reflected the percentage of the residual HCV replicon after overexpression of OAS‐1. The percentage of residual HCV replicon after transfection of the G‐type plasmid was significantly higher than that of the A‐type plasmid (P=0.004). Error bars indicate standard deviation. OAS‐1, 2′‐5′‐oligoadenylate synthetase 1; SNP, single nucleotide polymorphism.
Figure 3.
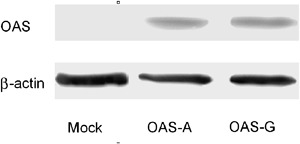
Western blotting of OAS‐1 after transfection of different plasmids. Each plasmid containing no OAS‐1 sequence, containing the OAS‐1 A‐type or G‐type sequence, was transfected into Huh7 cells harbouring the hepatitis C virus subgenomic replicon. Cell lysates were collected 48 h later, and Western blotting was performed. β‐actin was used as a quantitative control. The figure shows no difference in OAS‐1 expression between A‐type and G‐type plasmids. OAS‐1, 2′‐5′‐oligoadenylate synthetase 1.
While in cells harbouring the full‐length HCV genome, JFH1, the relative amounts of intracellular HCV core protein determined by Western blotting showed the same tendency as the results using the HCV subgenomic replicon, the relative amounts of intracellular HCV core protein determined by Western blotting are 100% for mock‐transfected, 77% for OAS‐1/allele A‐transfected and 84% for OAS‐1 allele G‐transfected.
Discussion
Our results suggested that a nonsynonymous SNP on exon 3 of OAS‐1 (rs3741981) was related to a higher serum transaminase level, a higher degree of liver fibrosis and the presence of cirrhosis. In fact, OAS‐1 having a G allele in rs3741981 has a weaker ability in suppressing HCV replication compared with OAS‐1 having an A allele. Thus, our results can be explained by the fact that patients with the rs3741981 G allele were weaker in suppressing HCV replication compared with patients with the rs3741981 A allele, which may lead to a higher degree of necrosis and regeneration, and ultimately fibrosis and cirrhosis of the liver.
The OAS‐1 gene, located on chromosome 12, has two major transcripts that are generated by alternative splicing at the last two exons. E16 (NM_002534) is a short transcript with five exons and is translated into p40 isoform. E18 (NM_016816) is a long transcript with six exons and is translated into p46 isoform (23, 24). The A/G polymorphism in exon 3 of OAS‐1 (rs3741981) causes amino acid substitution Ser162Gly in both isoforms, which is located near the dsRNA‐binding domain (amino acid 104‐158) of OAS‐1 (25).
The OAS‐1 protein belongs to the dsRNA‐binding protein family, which is characterized by having one or more dsRNA‐binding motif (dsRBM) and activation of enzyme activity after binding of the dsRBM with dsRNA. The A‐form double helix dsRNA, compared with the double‐stranded DNA, which is a B‐form double helix, is known for its shallower‐and‐broader minor groove and narrower‐and‐deeper major groove. A study showed that the dsRBM uniquely contacts the dsRNA helix in two successive minor grooves and once in the intervening major groove (26). Substitution of nearly all the amino acids within the consensus dsRBM decreases dsRNA binding (27, 28, 29).
An A to G substitution in the OAS‐1 gene results in a serine to glycine substitution in OAS‐1 protein, which may affect the three‐dimensional structure of dsRBM and thus weaken the binding of dsRNA and finally the ability to suppress virus replication. We tested this hypothesis using liver cells carrying the HCV subgenomic replicon or the full‐length HCV genome. Transfection of the OAS‐1 expression plasmid into cells harbouring the HCV subgenomic replicon of the full‐length genome (overexpression) resulted in inhibition of HCV, which was consistent with previous reports (30). In our experiments, cells transfected with the G‐type OAS‐1 plasmid showed higher HCV replication compared with the A type. Therefore, patients with the rs3741981 G allele were weaker in suppressing HCV replication compared with those with the A allele. The higher transaminase level might be the clinical evidence. Increased inflammation eventually led to fibrosis and cirrhosis of the liver. The rate of fibrosis progression was believed to be higher among patients with higher serum ALT and AST levels, as reported by Ghany et al. (7). Thus, by in vitro and in vivo study, we ratiocinated that G allele carriers had weaker virus clearance, which resulted in more inflammation, and then more fibrosis.
Another A/G polymorphism in exon 6 (rs3177979) of OAS‐1 causes the amino acid substitution Thr352Ala, which is located near the region related to the enzyme activity (amino acid 320‐344) of OAS‐1 (25). This could be the reason why it had a certain relationship with higher ALT.
Unfortunately, one of the shortcomings of our study was that only a part of the cases diagnosed as having cirrhosis had a pathological confirmation. We can only say that SNP of OAS‐1 has a relationship with clinically diagnosed cirrhosis. However, it still provided a clue to focus more attention on patients with the rs3741981 G allele, who were also more likely to suffer from higher serum transaminase and a higher degree of fibrosis. It is reasonable to assume that this group of patients was more likely to develop significant liver disease, i.e. should be intensively cared and followed.
There was no difference in the peripheral HCV RNA level among patients with different genotypes in our study. However, serum viral loads may be affected by both viral and host factors such as viral replication ability and polymorphisms of genes related to innate immunity, viral receptors and cellular genes to help viral replication. In fact, it was previously reported that the viral sequence affects the viral load (31). Moreover, it is possible that serum viral loads do not correlate with viral loads in the liver. It is the virus in the liver that leads to inflammation and fibrosis.
Our study showed no relationship of SNPs of OAS‐1 and IFN treatment response. Considering that OAS‐1 is one of IFN‐stimulated genes, Knapp et al. (13) studied the relationship of an SNP of OAS‐1 (rs2660) with the result of IFN therapy, and found that the genotype of rs2660 was not associated with response to IFN therapy but was associated with persistent infection of patients. The result of IFN therapy obtained by Knapp and colleagues is consistent with our study. It is interesting that previous papers reported an increase of OAS‐1 protein expression in persistent HCV infection but not in exogenous IFN treatment (32, 33). It seems that OAS‐1, as a component of the innate immune system and an IFN‐stimulated gene, is linked to persistent infection but not to the effect of exogenously administered IFN.
Although our result showed the relationship of the rs3741981 G allele with cirrhosis, the odds ratio of the genotype G/G was about 3.1, and for genotype A/G, the relationship was not statistically significant. Many statisticians consider that a 0.05 cut‐off is inadequate for genetic association studies. They rather recommend a 0.01 cut‐off to strengthen the value of the association. Therefore, our conclusion should be weakened to some extent. In fact, many genetic factors had been reported to associate with fibrosis/cirrhosis of the liver. Most reports were on cytokine polymorphisms. Polymorphisms of interleukin‐10 and tumour necrosis factor‐β were reported in many studies to relate to fibrosis (34, 35). The association of the polymorphism of complementary 5 and fibrosis degree was also reported recently (36). Patients with monocyte chemotactic protein‐1 genotype G/G or G/A were more likely to have advanced fibrosis and severe inflammation in the liver biopsy than those with genotype A/A (37). The polymorphism of other genes such as the angiotensinogen gene has also been reported to be associated with more advanced fibrosis (38). Patients with coagulation factor V Leiden mutation (A560G) were also more likely to progress to cirrhosis (39). In another study on different alleles for the microsomal epoxide hydrolase gene, an important antioxidant enzyme, patients with cirrhosis were more likely to have the slow metabolizer phenotype of this enzyme (40). It seems that many genetic factors can affect the progression of liver disease, involving different aspects of the liver such as immune, metabolism, circulation and so on. Therefore, in the future, many SNPs of a patient might be detected simultaneously in order to have a stronger prediction of the risk of developing significant liver disease.
In conclusion, our study once more proved the association of liver disease progression with genetic factors. The SNP of OAS‐1 at the exon 3 of its coding sequence, together with other genetic factors mentioned by us (16, 17, 18) and other scholars, might be useful in the assessment and treatment of hepatitis C.
Acknowledgements
This work was supported by Global COE Program ‘Center of Education and Research for Advanced Genome‐Based Medicine: For personalized medicine and the control of worldwide infectious diseases’, the Ministry of Education, Culture, Sports, Science and Technology of Japan, by grants‐in‐aid for scientific research from the Ministry of Education, Culture, Sports, Science and Technology of Japan, by Health and Labor Sciences Research Grants for Research on Hepatitis from the Ministry of Health, Labor and Welfare, Japan.
References
- 1. Heller T, Rehermann B. Acute hepatitis C: a multifaceted disease. Semin Liver Dis 2005; 25: 7–17. [DOI] [PubMed] [Google Scholar]
- 2. Shepard CW, Finelli L, Alter MJ. Global epidemiology of hepatitis C virus infection. Lancet Infect Dis 2005; 5: 558–67. [DOI] [PubMed] [Google Scholar]
- 3. Poynard T, Bedossa P, Opolon P. Natural history of liver fibrosis progression in patients with chronic hepatitis C. The OBSVIRC, METAVIR, CLINIVIR, and DOSVIRC groups. Lancet 1997; 349: 825–32. [DOI] [PubMed] [Google Scholar]
- 4. Minola E, Prati D, Suter F, et al Age at infection affects the long‐term outcome of transfusion‐associated chronic hepatitis C. Blood 2002; 99: 4588–91. [DOI] [PubMed] [Google Scholar]
- 5. Wright M, Goldin R, Fabre A, et al Measurement and determinants of the natural history of liver fibrosis in hepatitis C virus infection: a cross sectional and longitudinal study. Gut 2003; 52: 574–9. [DOI] [PMC free article] [PubMed] [Google Scholar]
- 6. Feld JJ, Liang TJ. Hepatitis C – identifying patients with progressive liver injury. Hepatology 2006; 43: S194–206. [DOI] [PubMed] [Google Scholar]
- 7. Ghany MG, Kleiner DE, Alter H, et al Progression of fibrosis in chronic hepatitis C. Gastroenterology 2003; 124: 97–104. [DOI] [PubMed] [Google Scholar]
- 8. Ryder SD, Irving WL, Jones DA, Neal KR, Underwood JC. Progression of hepatic fibrosis in patients with hepatitis C: a prospective repeat liver biopsy study. Gut 2004; 53: 451–5. [DOI] [PMC free article] [PubMed] [Google Scholar]
- 9. Asselah T, Boyer N, Guimont MC, et al Liver fibrosis is not associated with steatosis but with necroinflammation in French patients with chronic hepatitis C. Gut 2003; 52: 1638–43. [DOI] [PMC free article] [PubMed] [Google Scholar]
- 10. Gale M Jr, Foy EM. Evasion of intracellular host defence by hepatitis C virus. Nature 2005; 436: 939–45. [DOI] [PubMed] [Google Scholar]
- 11. Castelli J, Wood KA, Youle RJ. The 2‐5A system in viral infection and apoptosis. Biomed Pharmacother 1998; 52: 386–90. [DOI] [PubMed] [Google Scholar]
- 12. Pestka S, Langer JA, Zoon KC, Samuel CE. Interferons and their actions. Annu Rev Biochem 1987; 56: 727–77. [DOI] [PubMed] [Google Scholar]
- 13. Knapp S, Yee LJ, Frodsham AJ, et al Polymorphisms in interferon‐induced genes and the outcome of hepatitis C virus infection: roles of MxA, OAS-1 and PKR. Genes Immun 2003; 4: 411–9. [DOI] [PubMed] [Google Scholar]
- 14. Hamano E, Hijikata M, Itoyama S, et al Polymorphisms of interferon‐inducible genes OAS‐1 and MxA associated with SARS in the Vietnamese population. Biochem Biophys Res Commun 2005; 329: 1234–9. [DOI] [PMC free article] [PubMed] [Google Scholar]
- 15. Mashimo T, Lucas M, Simon‐Chazottes D, et al A nonsense mutation in the gene encoding 2′‐5′‐oligoadenylate synthetase/L1 isoform is associated with West Nile virus susceptibility in laboratory mice. Proc Natl Acad Sci USA 2002; 99: 11311–6. [DOI] [PMC free article] [PubMed] [Google Scholar]
- 16. Kato N, Ji G, Wang Y, et al Large‐scale search of single nucleotide polymorphisms for hepatocellular carcinoma susceptibility genes in patients with hepatitis C. Hepatology 2005; 42: 846–53. [DOI] [PubMed] [Google Scholar]
- 17. Wang Y, Kato N, Hoshida Y, et al UDP‐glucuronosyltransferase 1A7 genetic polymorphisms are associated with hepatocellular carcinoma in Japanese patients with hepatitis C virus infection. Clin Cancer Res 2004; 10: 2441–6. [DOI] [PubMed] [Google Scholar]
- 18. Wang Y, Kato N, Hoshida Y, et al Interleukin‐1beta gene polymorphisms associated with hepatocellular carcinoma in hepatitis C virus infection. Hepatology 2003; 37: 65–71. [DOI] [PubMed] [Google Scholar]
- 19. Hara K, Ohe K, Kadowaki T, et al Establishment of a method of anonymization of DNA samples in genetic research. J Hum Genet 2003; 48: 327–30. [DOI] [PubMed] [Google Scholar]
- 20. Livak KJ, Marmaro J, Todd JA. Towards fully automated genome‐wide polymorphism screening. Nat Genet 1995; 9: 341–2. [DOI] [PubMed] [Google Scholar]
- 21. Tanabe Y, Sakamoto N, Enomoto N, et al Synergistic inhibition of intracellular hepatitis C virus replication by combination of ribavirin and interferon‐alpha. J Infect Dis 2004; 189: 1129–39. [DOI] [PubMed] [Google Scholar]
- 22. Wakita T, Pietschmann T, Kato T, et al Production of infectious hepatitis C virus in tissue culture from a cloned viral genome. Nat Med 2005; 11: 791–6. [DOI] [PMC free article] [PubMed] [Google Scholar]
- 23. Justesen J, Hartmann R, Kjeldgaard NO. Gene structure and function of the 2′‐5′‐oligoadenylate synthetase family. Cell Mol Life Sci 2000; 57: 1593–612. [DOI] [PMC free article] [PubMed] [Google Scholar]
- 24. Rebouillat D, Hovanessian AG. The human 2′, 5′‐oligoadenylate synthetase family: interferon-induced proteins with unique enzymatic properties. J Interferon Cytokine Res 1999; 19: 295–308. [DOI] [PubMed] [Google Scholar]
- 25. Ghosh SK, Kusari J, Bandyopadhyay SK, et al Cloning, sequencing, and expression of two murine 2′‐5′‐oligoadenylate synthetases. Structure–function relationships. J Biol Chem 1991; 266: 15293–9. [PubMed] [Google Scholar]
- 26. Ryter JM, Schultz SC. Molecular basis of double‐stranded RNA–protein interactions: structure of a dsRNA-binding domain complexed with dsRNA. EMBO J 1998; 17: 7505–13. [DOI] [PMC free article] [PubMed] [Google Scholar]
- 27. Gatignol A, Buckler‐White A, Berkhout B, Jeang KT. Characterization of a human TAR RNA‐binding protein that activates the HIV‐1 LTR. Science 1991; 251: 1597–600. [DOI] [PubMed] [Google Scholar]
- 28. Krovat BC, Jantsch MF. Comparative mutational analysis of the double‐stranded RNA binding domains of Xenopus laevis RNA‐binding protein A. J Biol Chem 1996; 271: 28112–9. [DOI] [PubMed] [Google Scholar]
- 29. Green SR, Mathews MB. Two RNA‐binding motifs in the double‐stranded RNA‐activated protein kinase, DAI. Genes Dev 1992; 6: 2478–90. [DOI] [PubMed] [Google Scholar]
- 30. Itsui Y, Sakamoto N, Kurosaki M, et al Expressional screening of interferon‐stimulated genes for antiviral activity against hepatitis C virus replication. J Viral Hepat 2006; 13: 690–700. [DOI] [PubMed] [Google Scholar]
- 31. Watanabe H, Nagayama K, Enomoto N, et al Sequence elements correlating with circulating viral load in genotype 1b hepatitis C virus infection. Virology 2003; 311: 376–83. [DOI] [PubMed] [Google Scholar]
- 32. Pawlotsky JM, Hovanessian A, Roudot‐Thoraval F, et al Activity of the interferon‐induced 2′,5′‐oligoadenylate synthetase in patients with chronic hepatitis C. J Interferon Cytokine Res 1995; 15: 857–62. [DOI] [PubMed] [Google Scholar]
- 33. Okuno T, Shindo M, Arai K, et al 2′,5′ oligoadenylate synthetase activity in peripheral blood mononuclear cells and serum during interferon treatment of chronic non‐A, non‐B hepatitis. Gastroenterol Jpn 1991; 26: 603–10. [DOI] [PubMed] [Google Scholar]
- 34. Knapp S, Hennig BJ, Frodsham AJ, et al Interleukin‐10 promoter polymorphisms and the outcome of hepatitis C virus infection. Immunogenetics 2003; 55: 362–9. [DOI] [PubMed] [Google Scholar]
- 35. Goyal A, Kazim SN, Sakhuja P, et al Association of TNF‐beta polymorphism with disease severity among patients infected with hepatitis C virus. J Med Virol 2004; 72: 60–5. [DOI] [PubMed] [Google Scholar]
- 36. Hillebrandt S, Wasmuth HE, Weiskirchen R, et al Complement factor 5 is a quantitative trait gene that modifies liver fibrogenesis in mice and humans. Nat Genet 2005; 37: 835–43. [DOI] [PubMed] [Google Scholar]
- 37. Muhlbauer M, Bosserhoff AK, Hartmann A, et al A novel MCP‐1 gene polymorphism is associated with hepatic MCP‐1 expression and severity of HCV‐related liver disease. Gastroenterology 2003; 125: 1085–93. [DOI] [PubMed] [Google Scholar]
- 38. Powell EE, Edwards‐Smith CJ, Hay JL, et al Host genetic factors influence disease progression in chronic hepatitis C. Hepatology 2000; 31: 828–33. [DOI] [PubMed] [Google Scholar]
- 39. Wright M, Goldin R, Hellier S, et al Factor V Leiden polymorphism and the rate of fibrosis development in chronic hepatitis C virus infection. Gut 2003; 52: 1206–10. [DOI] [PMC free article] [PubMed] [Google Scholar]
- 40. Sonzogni L, Silvestri L, De Silvestri A, et al Polymorphisms of microsomal epoxide hydrolase gene and severity of HCV‐related liver disease. Hepatology 2002; 36: 195–201. [DOI] [PubMed] [Google Scholar]