

Abstract
In fewer than four months in 2003, severe acute respiratory syndrome (SARS) spread from China to 25 countries and Taiwan, becoming the first new, easily transmissible infectious disease of the twenty‐first century. The role of air transport in the diffusion of the disease became obvious early in the crisis; to assess that role more carefully, this study relates the spatial‐temporal pattern of the SARS outbreak to a measure of airline network accessibility. Specifically, the accessibility from those countries that were infected by SARS, beginning with China, to other countries was measured using airline schedules. The country‐pair accessibility measure, along with other country‐level factors relevant to the disease, were tested as determinants of the speed with which SARS arrived in infected countries as well as its failure to arrive in most countries. The analyses indicate that airline network accessibility was an especially influential variable but also that the importance of this variable diminished in the latter weeks of the outbreak. The latter finding is partly attributable to public health measures, particularly health screening in airports. The timing and geography of those measures are reviewed using data from media reports and interim World Health Organization (WHO) documents during the outbreak. The uneven effort to curtail the international diffusion of SARS suggests further planning is needed to develop a concerted response to contain future epidemics.
Keywords: East Asia, disease diffusion, severe acute respiratory syndrome (SARS), airline networks, public health
Introduction
Between November 2002 and July 2003, approximately 8100 people were infected with severe acute respiratory syndrome (SARS), with nearly 800 people dying as a result (World Health Organization (WHO) 2004). Although over 90% of those deaths and cases were concentrated in the People's Republic of China and its southeastern neighbours (Hong Kong, Macau, Taiwan, and Vietnam), SARS infected people across the world, including such disparate and distant places as Canada, South Africa, and Romania. One of the striking features of the SARS epidemic was the manner in which airline networks acted as corridors for the spread of the disease (Peiris and Guan 2004).
In this research, we test the significance of airline network accessibility as a factor explaining the spatial‐temporal spread of SARS at the country level, and then go on to examine geographic variations in the timing and nature of measures adopted by national governments to slow or stop the spread of the disease via air travel.
Transport and disease diffusion
The link between transport networks and disease, as the following examples suggest, is an old one. The catastrophic spread of bubonic plague in fourteenth century Eurasia was most rapid along trade routes across the Mediterranean Sea, taking much longer to move overland (Herlihy 1997). In nineteenth century America, the spread of cholera in three great epidemics (1832, 1844 and 1866) followed the transport routes of the time, spreading much more rapidly during the last epidemic along the nation's newly built railroad network (Pyle 1969). And more recently, ‘Patient Zero’, the somewhat misleading nickname given to a person who played an important role in the early spread of HIV/AIDS to North America (but was not necessarily the first person to do so), was a Canadian flight attendant (Gould 1993).
Improvements in mobility made possible by transport innovations have important implications for the spread of disease (Mayer 1998). Faster trips make it more likely that a person infected at the start of a journey will still be infectious at the end of that journey, severely weakening the epidemiological isolation afforded by distance (Cliff et al. 1998). In her influential book The coming plague, Garrett (1994, 571) put it more graphically, ‘Thanks to changes in Homo sapiens activities, in the ways in which the human species lived and worked on the planet at the end of the twentieth century, microbes no longer remained confined to remote ecospheres or rare reservoir species: for them, the earth had truly become a Global Village’. Indeed, diseases once limited mainly to developing countries are no longer as circumscribed (Mayer 2000), in part because one million people travel by air from developing to developed countries and vice versa per week.
There have been several previous efforts to quantify and model the significance of networks in shaping disease diffusion, including Pyle's (1969) examination of the diffusion of cholera from New Orleans and New York in 1832, Patterson and Pyle's (1983) analysis of the role played by colonial transport corridors during the 1918–19 influenza epidemic in sub‐Saharan Africa, and a study of the spread of influenza across France (Bonabeau et al. 1998). Among the most comprehensive studies examining the spatial spread of disease are two books by Cliff et al. (1998 , 2000). In Deciphering global epidemics (2000), they model geographic patterns in the incidence of six infectious diseases across 100 cities worldwide between 1888 and 1912. Transport networks, especially those of nineteenth century steamship lines, are mentioned in the book but play no role in their analyses. In Island epidemics (1998), which examined the disease record of populated islands across the world, air transport networks were analyzed as one factor shaping disease patterns. However, the link between the networks and disease was shown only with a single diagram, and no attempt was made to quantify this link or show how it was mediated by other factors such as the level of economic development, trade patterns, or immigration history.
The diffusion of infectious disease has been conceptualized with mathematical models developed in biostatistics (Rvachev and Longini 1985; Longini 1988; Sattenspiel and Dietz 1995; Arino and van den Driessche 2003). In one such study, that specifically incorporates the role played by air travel, Rvachev and Longini (1985) estimate the probability of diffusion based in part on the volume of international air traffic among 52 worldwide cities. They test the model against the 1968–9 Hong Kong flu pandemic and find that the predicted space–time spread of the disease matches the actual experience fairly well. However, the authors concede that the difficulty in obtaining actual origin–destination traffic flow data frustrates their efforts to fully assess the role of air travel in disease diffusion. Also, they indicate that to make the forecasts of their model more realistic, traffic data would have to be collected for three times as many cities as in their study. As described below, the methodology employed in the present study is less sensitive to the shortcomings of airline traffic data and includes a set of more than 200 sample cities.
SARS
SARS is a viral respiratory illness associated with a newly discovered coronavirus (SARS‐CoV). Symptoms of SARS include high fever and other flu‐like symptoms, which commonly progress to pneumonia. A crucial feature of the transmission of SARS that greatly facilitated the global containment of the disease is that patients are infectious only after they exhibit symptoms. As a result, some researchers feel ‘SARS might almost be classified as “easy” to manage’ (Weiss and McLean 2004, 1138). Another feature of SARS favourable to its containment is its transmission via large droplets (as opposed to small droplets or aerosols), requiring close contact (Centers for Disease Control and Prevention 2004; Shannon and Willoughby 2004).
The source of SARS CoV, from which the 2003 epidemic emerged, remains unknown; but evidence suggests that palm civets may have played a role in the spread of the disease to humans (Normile and Enserink 2003). Civets are a delicacy in southern China, the region where the index patient of the 2003 SARS epidemic became ill in November 2002 (WHO 2003e). The dense transport links between this region of China and the rest of the world, due to its recent economic growth, meant that this folk culinary tradition could have rapid, international ramifications.
By early February 2003, local transmission in southern China became widespread. In the same month, the first cases were recognized in Hong Kong; and in a ‘super spreading’ event, involving a hotel frequented by international travellers, the disease was first spread via airline transport beyond greater China (WHO 2003f), with the first cases reported in Vietnam, Canada, the United States, Singapore, the Philippines, and Taiwan within 10 days of the disease's arrival in Hong Kong.
Less than three months after the first international spread of SARS, probable cases of the disease were reported in 26 countries (Figure 1). Its rapid diffusion led to the 2 April 2003 issuance of the strictest travel advisory in the history of the WHO ‘as evidence mounted that SARS was spreading by air travel along international routes’ (WHO 2003e). As we describe below, the world's international airports became the setting for a highly uneven effort to intercept arriving and departing travellers that might carry the disease. On 5 July 2003, the WHO declared that the outbreak had been contained worldwide.
Figure 1.
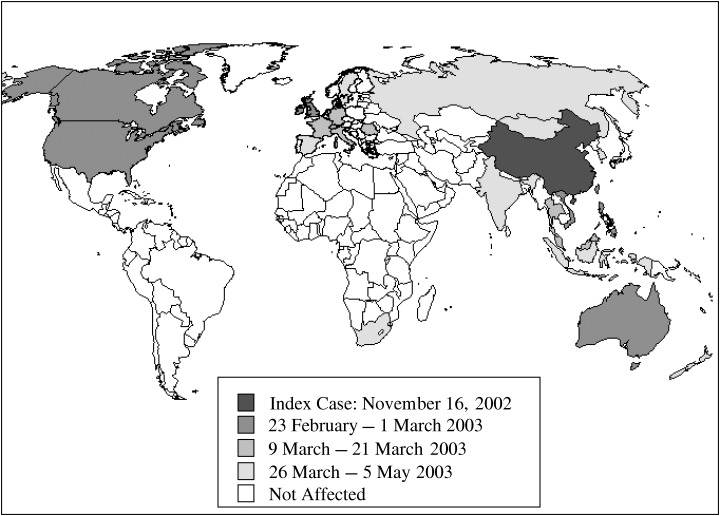
The diffusion of SARS
Modelling the diffusion of SARS as a function of airline network accessibility
The data
The diffusion of SARS As part of a massive public information effort, the WHO has produced detailed statistics on the spread of SARS available on its website since midway through the 2003 outbreak. In particular, the WHO has provided detailed information indicating the date of the first probable case for each country affected by the disease. Table 1 provides summary information for countries affected by SARS.
Table 1.
Summary information for SARS 2003 outbreak
| Area | Date of onset of first probable case | Date of onset of last probable case | Cumulative number of cases | Number of deaths |
|---|---|---|---|---|
| Australia | 26 February 2003 | 1 April 2003 | 6 | 0 |
| Canada | 23 February 2003 | 12 June 2003 | 251 | 43 |
| China | 16 November 2002 | 3 June 2003 | 5327 | 349 |
| China Hong Kong SAR | 15 February 2003 | 31 May 2003 | 1755 | 299 |
| China Macao SAR | 5 May 2003 | 5 May 2003 | 1 | 0 |
| China – Taiwan | 25 February 2003 | 15 June 2003 | 346 | 37 |
| France | 21 March 2003 | 3 May 2003 | 7 | 1 |
| Germany | 9 March 2003 | 6 May 2003 | 9 | 0 |
| India | 25 April 2003 | 6 May 2003 | 3 | 0 |
| Indonesia | 6 April 2003 | 17 April 2003 | 2 | 0 |
| Italy | 12 March 2003 | 20 April 2003 | 4 | 0 |
| Kuwait | 9 April 2003 | 9 April 2003 | 1 | 0 |
| Malaysia | 14 March 2003 | 22 April 2003 | 5 | 2 |
| Mongolia | 31 March 2003 | 6 May 2003 | 9 | 0 |
| New Zealand | 20 April 2003 | 20 April 2003 | 1 | 0 |
| Philippines | 25 February 2003 | 5 May 2003 | 14 | 2 |
| Ireland | 27 February 2003 | 27 February 2003 | 1 | 0 |
| South Korea | 25 April 2003 | 10 May 2003 | 3 | 0 |
| Romania | 19 March 2003 | 19 March 2003 | 1 | 0 |
| Russian Federation | 5 May 2003 | 5 May 2003 | 1 | 0 |
| Singapore | 25 February 2003 | 5 May 2003 | 238 | 33 |
| South Africa | 3 April 2003 | 3 April 2003 | 1 | 1 |
| Spain | 26 March 2003 | 26 March 2003 | 1 | 0 |
| Sweden | 28 March 2003 | 23 April 2003 | 5 | 0 |
| Switzerland | 9 March 2003 | 9 March 2003 | 1 | 0 |
| Thailand | 11 March 2003 | 27 March–2003 | 9 | 2 |
| United Kingdom | 1 March 2003 | 1 April 2003 | 4 | 0 |
| United States | 24 February 2003 | 13 July 2003 | 27 | 0 |
| Vietnam | 23 February 2003 | 14 April 2003 | 63 | 5 |
| Total | 8096 | 774 |
Source: WHO (2004)
Air transport network accessibility There are a number of different ways to measure accessibility in a transport network (Taaffe et al. 1996). We followed a methodology based in part on that employed by the International Air Transport Association (IATA) in deriving The global airport connectivity monitor (International Air Transport Association 1999). The IATA methodology takes into consideration the number of scheduled flights among cities (both on non‐stop flights and via connections at intermediate hubs).
Our decision to measure accessibility using airline schedules, instead of the actual number of passengers, was driven mainly by necessity. There simply is no source of data on origin–destination passenger traffic for a sufficiently large number of worldwide city‐pairs. Moreover, while it is true that it is the passengers and not the seats in which they sit that carry disease from place to place, we were interested in the utility of a schedule‐based accessibility measure as a tool in the arsenal of those responding to an outbreak. In a potential epidemic crisis, public health professionals can easily access complete airline schedules, but even rudimentary data on actual flown traffic are likely to be available only much later. Finally, scheduled airline services can be conceptualized as possible pathways for disease diffusion, with the greater frequency and directness of services among some cities facilitating the ease of movement for an infectious agent.
Accessibility was measured across a set of 207 cities. The set included all those cities that had scheduled airline services in March 2003 and met at least one of the several criteria below, designed to ensure broad geographic coverage of the world, whilst taking into account the likely pathways via which the disease spread:
-
•
the largest city in any country with a national population greater than 1 million;
-
•
any city ranking in the top 50 worldwide for airline passenger traffic as reported by Airports Council International (Airports Council International 2003);
-
•
any city scoring in the top 300 of nearly 900 cities worldwide, examined in a previous study (Bowen 2002) of global airline network accessibility patterns and located at least 400 km from any more accessible city, or any city meeting one of the other criteria;
-
•
the largest city with at least one non‐stop international flight per week in any Chinese province that experienced local transmission of SARS at any time during the outbreak (e.g. Xi’an in Shaanxi province).
The schedule information necessary to find the frequency and elapsed time for each connection among the 207 sample cities was drawn from the March 2003 edition of the electronic database OAG Max, a commercial product containing detailed schedules for virtually every airline in the world. March 2003 was selected because it was the month most pertinent to the diffusion of SARS.
The accessibility measures used in the analyses that follow are based on both first‐order links (nonstop flights) and second‐order links (one‐stop routings) between any pair of the sample cities. Second‐order links were constructed using criteria intended to make them as realistic as possible (e.g. minimum and maximum waiting times at an intermediate stop).
Every first‐order and second‐order linkage meeting the above criteria was given a score based on its total elapsed time versus the hypothetical time necessary to travel nonstop between the same two cities (even where no nonstop link existed). Faster linkages received a score closer to 1, poorer linkages a score closer to 0. Following the IATA methodology, ground time was doubled in the calculation of elapsed time, on the premise that passengers dislike ground time more than time spent in flight. In addition, if a second‐order linkage required passengers to transfer between airlines, an additional 30 min penalty was factored into the score for the linkage. An illustration is provided in Figure 2.
Figure 2.
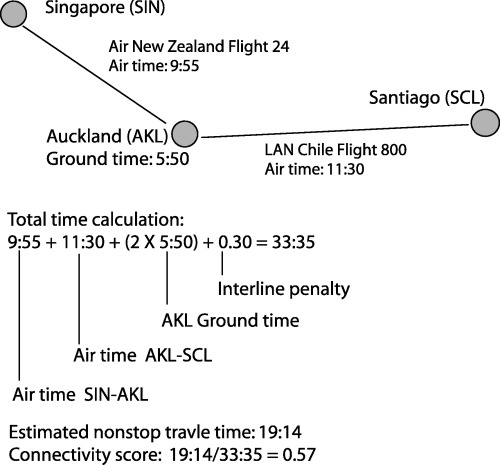
Example of the accessibility score for a second‐order routing
Third‐order and higher order links were not included in the calculation of accessibility, because the complexity of finding plausible high order linkages across 207 cities was incommensurate with the added accuracy and precision their inclusion would have gained. Moreover, the range of commercial aircraft in 2003 was such that a one‐stop link between any two‐sample cities was technically possible. In total, 56% of city‐pairs and 62% of country‐pairs were connected by at least a second‐order linkage.
Each first‐order and second‐order link was weighted by its weekly frequency. The maximum international city‐pair total accessibility score was, unsurprisingly, for New York City to London. The city‐pair data were aggregated again to produce a measure of accessibility for each country‐pair. The maximum country‐pair accessibility score was for USA–Canada. The accessibility scores for the ten countries best connected to China in March 2003 are shown in Table 2.
Table 2.
Airline network accessibility from China and the diffusion of SARS
| Area | Accessibility score | Earliest SARS case |
|---|---|---|
| United States | 2226.60 | 24 February 2003 |
| Japan | 620.75 | None |
| Australia | 612.43 | 26 February 2003 |
| Germany | 545.58 | 9 March 2003 |
| Canada | 535.96 | 23 February 2003 |
| Singapore | 473.43 | 25 February 2003 |
| United Kingdom | 470.26 | 1 March 2003 |
| France | 363.78 | 21 March 2003 |
| Thailand | 350.28 | 11 March 2003 |
| Taiwan | 321.42 | 25 February 2003 |
| Malaysia | 274.31 | 14 March 2003 |
| Italy | 265.77 | 12 March 2003 |
| Spain | 248.75 | 26 March 2003 |
| South Korea | 219.45 | 25 April 2003 |
| Netherlands | 214.43 | None |
| Philippines | 204.90 | 25 February 2003 |
| Switzerland | 192.50 | 9 March 2003 |
| Brazil | 189.89 | None |
| New Zealand | 180.52 | 20 April 2003 |
| Indonesia | 166.35 | 6 April 2003 |
Data for other explanatory factors While the role that airline networks played in the diffusion of SARS is our central interest, a variety of other factors affected the spread of the disease and mediated the role of airline networks. To represent those other factors, the following additional types of information were collected:
-
1
The number of Chinese ancestry residents, commonly termed the Overseas Chinese outside China, by country (Zheng 2003) as a percentage of total population (PCTOC). The Overseas Chinese appeared to have been important in the spread of SARS. For instance, the first case of SARS in Canada was an elderly Chinese‐Canadian who had recently returned from visiting relatives in China.
-
2
The national origin of foreign direct investment (FDI) in China. FDI is potentially important in explaining SARS because it generates ongoing international business passenger traffic (e.g. by managers) that can be expected to have been more resistant to SARS‐related fears than other kinds of passenger traffic (e.g. tourists). Data identifying the most important origin countries for FDI in China are published by the United Nations Conference on Trade and Development (UNCTAD). Unfortunately, it was not possible to get data measuring China‐bound FDI for every country. As a result, the relative importance of countries as sources of FDI in China is measured with a binary variable (TOPCHFDI). The 11 most important countries were assigned a value of 1; the remaining countries have a value of 0.
-
3
National development was represented by per capita gross national income (GNICAP). More developed countries can be expected, all other things being equal, to have generated more international traffic, but also to have been more successful in preventing the inward and outward transmission of SARS cases during the outbreak.
-
4
National population in 2003 (POP2003). Larger populations can be expected, all other things being equal, to have been more likely to be affected by SARS, given the greater scope for person‐to‐person contact with those from already infected countries.
Analyses of airline network accessibility and the diffusion of SARS
Airline network accessibility and the speed of SARS’ diffusion
To begin the analysis of airline network accessibility and the diffusion of SARS, we plot each country's accessibility to China (CHINA) against a variable (DAYS) measuring the number of days between the earliest onset of the first probable case of SARS in the country concerned to the containment of the outbreak on 5 July 2003. For those countries first affected after China, DAYS has a high value (e.g. 132 for both Vietnam and Canada); those countries affected late have a low value (e.g. 61 for the Russian Federation); all unaffected countries have a value of 0. The curvilinear pattern (Figure 3) indicates a decreasing propensity for higher accessibility to accelerate the spread of SARS. This outcome is to be expected, inasmuch as airline network accessibility is inversely proportional to the ‘distance’ over which the virus had to travel from China to infect a country, and spatial interactions for a wide variety of phenomena tend to be inversely related to the square of distance.
Figure 3.
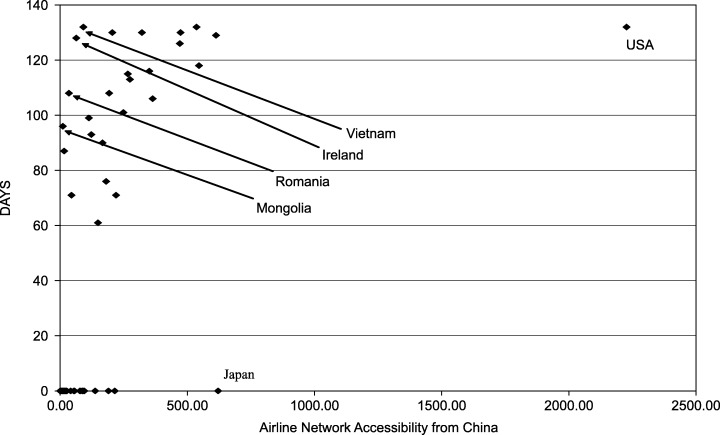
The diffusion of SARS and the airline network accessibility of China. The variable DAYS measures the number of days separating the date of the index case of SARS in a country and the official end of the outbreak on 5 July 2003. The airline network accessibility of a country from China is based on the frequency and directness of scheduled airline services
To further discern the effects of accessibility, and the other variables described above upon the country‐level space–time diffusion of SARS from China to the rest of the world, we employ regression analysis using DAYS as the dependent variable. To adjust for the curvilinear relationship observed between DAYS and CHINA, we use the square root (CHINA2) in this analysis. It should be noted that the distribution of DAYS is not normal, instead exhibiting a bimodal pattern with a cluster of high values (for countries affected soon after the disease arrived in Hong Kong) and a large number of 0s.
The results are summarized in Table 3. Only two independent variables are statistically significant: CHINA2 and PCTOC. Both are positively related to DAYS, indicating that airline network accessibility and the distribution of the Overseas Chinese were in fact significant variables in the diffusion of SARS.
Table 3.
Regression analysis of SARS’ diffusion
| Unstandardized coefficients | Standardized coefficients Beta | t | Signficance | ||
|---|---|---|---|---|---|
| B | Std error | ||||
| (Constant) | −5.163 | 3.999 | −1.291 | 0.199 | |
| CHINA2 | 4.487 | 0.707 | 0.725 | 6.345 | 0.000 |
| POP2003 | 2.226E−02 | 0.028 | 0.052 | 0.786 | 0.434 |
| GNICAP | −9.353E−06 | 0.000 | −0.002 | −0.022 | 0.982 |
| PCTOC | 0.798 | 0.277 | 0.201 | 2.882 | 0.005 |
| TOPCHFDI | −14.728 | 14.690 | −0.093 | −1.003 | 0.318 |
| DISTANCE | −1.104E−03 | 0.001 | −0.064 | −0.994 | 0.322 |
Dependent variable: DAYS.
Adjusted R 2= 0.545.
Variables are explained in the text.
The model explains approximately 55% of the variation in DAYS. The model was rerun with only CHINA2 and PCTOC in order to identify outliers. The strong positive outliers include Ireland (first onset of SARS occurred 98 days earlier than predicted), Vietnam, Romania, and Mongolia. The strong negative outliers include Japan (no recorded SARS cases versus a predicted first case on 27 February 2003) and the United States, whose dense air connections to China led to a predicted onset of the first American SARS case on 22 December 2002 – well before SARS had spread beyond China's borders.
Examining SARS’ diffusion in stages
To evaluate further the spatial‐temporal variation in the relationship between airline network accessibility and the speed of SARS’ diffusion, we partitioned the diffusion process beyond China into three phases, using natural breaks in the data. Eight days separated the arrival of the disease in the United Kingdom (1 March 2003) and Germany (9 March 2003), and 5 days separated its arrival in France (21 March 2003) and Spain (26 March 2003). Thus, the three phases are:
-
•
phase 1: 23 February−1 March 2003 (eight countries and Taiwan were infected);
-
•
phase 2: 9 March−21 March (seven countries);
-
•
phase 3: 26 March−5 May (ten countries).
We modelled the diffusion of the disease in each phase using logistic regression (Pampel 2000) to explain the arrival, or continued absence, of the disease in each successive phase as a function of the independent variables described above but with the following additions:
-
•
Distance to nearest already infected country. Our main concern is hierarchical diffusion via airline networks. To evaluate the significance of contagious diffusion processes working via transport modes other than air – particularly road networks linking adjacent countries – we include the simple distance to the nearest SARS‐infected country. In the earliest phase, the value of DISTANCE for each country is its distance to China. In subsequent phases, DISTANCE is the distance to the nearest country infected by the end of the preceding phase.
-
•
Accessibility to other infected countries. Cognizant of the fact that the spread of the disease in phases 2 and 3 may have been from sources other than China, we aggregate the country‐pair accessibility scores for all countries affected by SARS by the end of the preceding phase. In modelling the diffusion during phase 2, for instance, for each as‐yet‐uninfected country, we sum its country‐pair accessibility scores from China and all countries infected in phase 1 to create the variable PHS2CONX. Similarly, for phase 3, for each as‐yet‐uninfected country, we sum its country‐pair accessibility scores from China and all countries infected in phases 1 and 2 to create the variable PHS3CONX.
We used separate logistic regression models to identify the model best able to predict which countries would be newly infected in each phase. We used a forward stepwise algorithm with independent variables added to each model until no variable excluded from a model had an associated statistical significance of 0.05 or better. The results are summarized in 4, 5, 6.
Table 4.
Logistic regression analysis of SARS’ diffusion, stage 1
| Model summary | ||
|---|---|---|
| −2 Log likelihood | Cox & Snell R 2 | Nagelkerke R 2 |
| 35.881 | 0.207 | 0.507 |
| Variables in the equation | B | SE | Wald | df | Sig. | Exp(B) |
|---|---|---|---|---|---|---|
| CHINA2 | 0.251 | 0.064 | 15.231 | 1 | 0.000 | 1.285 |
| Constant | −5.340 | 1.066 | 25.115 | 1 | 0.000 | 0.005 |
| Classification table | Predicted | |||
|---|---|---|---|---|
| PHASE 1 | Percentage correct | |||
| Observed | 0 | 1 | ||
| PHASE 1 | 0 | 111 | 2 | 98.2 |
| 1 | 4 | 5 | 55.6 | |
| Overall percentage | 95.1 | |||
Table 5.
Logistic regression analysis of SARS’ diffusion, stage 2
| Model summary | ||
|---|---|---|
| −2 Log likelihood | Cox & Snell R 2 | Nagelkerke R 2 |
| 21.113 | 0.243 | 0.653 |
| Variables in the equation | B | SE | Wald | df | Sig. | Exp(B) |
|---|---|---|---|---|---|---|
| PCTOC | 0.351 | 0.304 | 1.328 | 1 | 0.249 | 1.420 |
| PHS2CNX | 0.027 | 0.008 | 11.725 | 1 | 0.001 | 1.027 |
| Constant | −4.136 | 0.716 | 33.393 | 1 | 0.000 | 0.016 |
| Classification table | Predicted | |||
|---|---|---|---|---|
| PHASE 2 | Percentage correct | |||
| Observed | 0 | 1 | ||
| PHASE 2 | 0 | 106 | 0 | 100.0 |
| 1 | 2 | 5 | 71.4 | |
| Overall percentage | 98.2 | |||
Table 6.
Logistic regression analysis of SARS’ diffusion, stage 3
| Model summary | ||
|---|---|---|
| −2 Log likelihood | Cox & Snell R 2 | Nagelkerke R 2 |
| 44.401 | 0.186 | 0.401 |
| Variables in the equation | B | SE | Wald | df | Sig. | Exp(B) |
|---|---|---|---|---|---|---|
| CHINA2 | 0.248 | 0.081 | 9.350 | 1 | 0.002 | 1.282 |
| POP2003 | 0.005 | 0.004 | 1.949 | 1 | 0.163 | 1.005 |
| Constant | −4.183 | 0.771 | 29.434 | 1 | 0.000 | 0.015 |
| Classification table | Predicted | |||
|---|---|---|---|---|
| PHASE 3 | Percentage correct | |||
| Observed | 0 | 1 | ||
| PHASE 3 | 0 | 94 | 2 | 97.9 |
| 1 | 7 | 3 | 30.0 | |
| Overall percentage | 91.5 | |||
Despite the breadth of the variable pools for these three analyses, the final models were similar in the importance of airline network accessibility. For both phase 1 and phase 3, CHINA2 was the most significant variable. The importance of China late in the outbreak is unsurprising, inasmuch as China (including Hong Kong) had by far the largest number of cases and was therefore far more likely than subsequently affected places (e.g. the Philippines) to be the source for newly infected countries. However, the significance of CHINA2 was markedly lower in phase 3 than phase 1. A likely explanation for the latter result is that the concerted effort to impede the spread of SARS via air travel had begun in earnest by phase 3.
The aggregated accessibility score (PHS2CONX) was the most powerful variable in explaining the pattern of diffusion in phase 2, during which the distribution of the Overseas Chinese population was also relevant. Conversely, in the model for phase 3, POP2003 was significant as SARS reached some of the world's most populous countries (e.g. India, Indonesia) in the final phase of the outbreak.
Examining the response to SARS’ diffusion via air travel
In the second part of our analysis, we first use interim documents from the WHO during the 2003 SARS epidemic and media reports to construct a chronological record of the efforts employed during the outbreak to inhibit SARS from spreading to other countries via air transport. Although 26 countries reported cases of SARS, 94% occurred in one of the following areas: Mainland China (63%), Hong Kong SAR (21%), Taiwan, China (4%), Singapore (3%) and Toronto, Canada (3%). These five areas were the epicentres from which the disease most likely spread to other countries, making them important areas in which to review the measures undertaken to contain the spread of the disease via air travel. Regrettably, of these, the country that had the great majority of cases throughout the outbreak is also the one for which the least information is available concerning its response. Media blackouts during the outbreak, and China's initial reluctance to share information with the global public health community (Pomfret 2003; deLisle 2003), limit the detail provided below.
Conversely, the US Center for Disease Control and Prevention (CDC) has made available some detailed information regarding the travel history of US SARS cases. These data can be used in the partial analysis of the effectiveness of responses to SARS. In particular, travel histories of the 27 imported cases of SARS (19 probable 1 and eight confirmed) to the United States will be compared to a timeline of response measures to elucidate the correlation between SARS control measures and their effect on the international spread of the disease.
Spatial‐temporal variation in the response to SARS
At the peak of the SARS outbreak, 32 international airports in 20 different countries applied surveillance measures to detect SARS cases. The efforts to contain the disease were mediated by varying degrees of alarm and bureaucratic capacity, accounting in part for the uneven speed with which officials acted to implement response measures.
At the global level, SARS containment efforts developed in three stages in broad correlation with WHO advisories:
-
•
On 15 March 2003 (by which time SARS had spread from China to 15 countries and Taiwan), the WHO released its initial warning of the SARS virus and recommended that international travellers worldwide bound for Asia be informed of the warning signs and symptoms of the disease (WHO 2003a).
-
•
On 27 March 2003 (by which time SARS had spread to 19 countries and Taiwan), the WHO recommended that in all areas of local transmission each departing passenger be asked by airline personnel:
-
if he or she had had contact with persons with SARS;
-
if he or she had any symptoms of SARS including fever and dry cough;
-
if any family member had had contact with the disease (WHO 2003b).
-
-
•
On 2 April 2003 (by which time SARS had spread to 21 countries and Taiwan), the WHO issued what it would hail as the ‘most stringent travel advisory issued in its 55‐year history’ (WHO 2003d), as it recommended that all but emergency travel to areas of local transmission be postponed.
The WHO advisories prompted governments in areas of local transmission to increase their actions to contain SARS. Figure 4 indicates the duration of WHO travel restrictions imposed in ten areas in which local transmission of SARS occurred.
Figure 4.
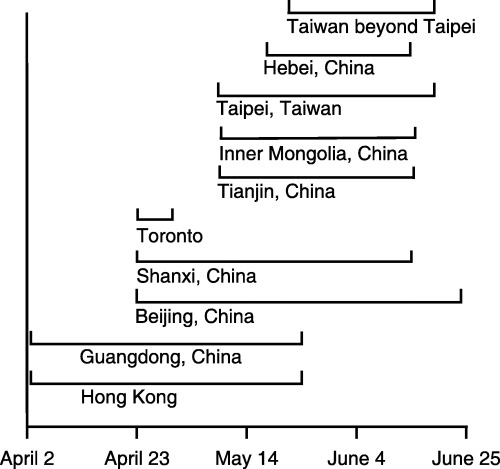
Timeline of WHO travel restrictions during the 2003 epidemic of SARS Source: WHO (2003d)
Under the umbrella of the WHO recommendations, SARS containment plans took on different forms in different countries. The summary of response measures in several SARS ‘hot zones’ (Figure 5) provides the discrete steps taken by each country in elevating its response to SARS.
Figure 5.
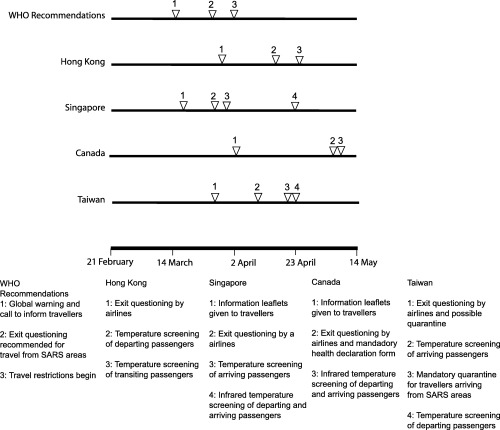
Chronological comparison of response measures taken in SARS ‘hot zones’ outside the Peoples Republic of China to curtail the spatial spread of the disease via airline transportation (WHO updates and local media reports)
China As a social and political crisis, the SARS epidemic has been described as the most severe faced by China's leadership since the 1989 Tiananmen Square protests (Osterholm 2005). China did not acquit itself well (deLisle 2003). In particular, its initial secrecy and denial, as well as its lack of a bureaucratic structure to report, screen, and quarantine infected persons, facilitated the early diffusion of SARS. The slow response of health authorities in Guangdong to the outbreak not only reflected its confusion with a concurrent, widespread influenza epidemic in the province, but also their reticence to inform national authorities of the problem (Weiss and McLean 2004). The provincial authorities’ sluggishness may have eased the disease's spread, especially to Beijing, which recorded the largest number of cases of any place in the world by the end of the outbreak.
The approach of China's national leadership to the disease also manifests the tension between the state's strong tendency towards secrecy and its unwillingness to bow to foreign pressure on the one hand, and its economic dependence on ties to the rest of the world on the other. Those ties were effectively severed by the fear of SARS. For example, the number of passengers departing Singapore (a key source of investment and managerial expertise) bound for China in May 2003 was nearly 90% lower than in May 2002 (Civil Aviation Authority of Singapore 2002 , 2003). In response, China's Health Ministry finally issued a battery of ‘Management Measures’ in mid‐May 2003. These included strict new rules governing the handling of SARS cases, with the rules to be enforced by harsh, new court‐approved penalties for non‐compliance. The belated response to SARS also included a stepped‐up effort to monitor arriving and departing air passengers; but we are unable to present a detailed timeline of measures adopted. In any case, by May 2003, travel to and from China had collapsed, diluting the threat of further diffusion of SARS via air travel. And the relatively few passengers departing from China were met with careful health checks, with more than 110 countries placing some type of travel restriction on visitors from China at the height of the outbreak (McKercher and Chon 2004).
Interestingly, the diffusion of SARS into the interior of China was less rapid than its spread overseas. By 18 May 2003, SARS had spread to 24 of China's 32 provinces. Among the uninfected provinces was Guizhou, just 500 km from Guangdong. Moreover, all but eight of the infected provinces had fewer than 20 cases in mid‐May 2003, a time when Beijing had over 2400 (Shannon and Willoughby 2004). The failure of China's vast floating population of rural–urban migrants to spread the disease more rapidly along the reverse pathways to their provincial homes might be attributed to draconian measures by localities within China to keep out travellers (deLisle 2003). More broadly, China's unbalanced economic development has resulted in a pattern of linkages from the booming coastal region that are stronger to overseas market (including those many thousands of miles away) than to the impoverished interior.
Hong Kong Special Admimistrative Region As one of the Pacific Rim's principal trading centres and a Special Administrative Region (SAR) of China bordering the province where the disease first emerged, Hong Kong was uniquely positioned to act as an epicentre for the diffusion of SARS (deLisle 2003). The international spread of the SARS virus began in late February 2003, when a health care professional from Guangdong province in southern China stayed in the Metropole Hotel in Hong Kong before becoming ill and being admitted to a hospital in Hong Kong. Visitors from Vietnam, Singapore, and Canada, staying on the same floor of the hotel as Hong Kong's index case, contracted the virus, and returned home aboard international flights. Three weeks later, the WHO's first international warning about SARS indicated that the disease appeared to be spreading via international air transport (WHO 2003e). International pressure quickly mounted on Hong Kong to curb the number of cases exported from its borders.
As a SAR, Hong Kong had considerable latitude to shape its own response to the disease apart from policies implemented (or perhaps more correctly, not implemented) at the national level. At Hong Kong's Chek Lap Kok Airport, response measures to contain the disease began 2 days after the WHO's 27 March call for passenger screening. The recommendation from the WHO played a central role in the decision to begin monitoring air passengers, as just one day prior to the WHO's recommendation, Hong Kong was described by the local South China Morning Post as doing little to monitor travellers at one of the world's major airline hubs ( South China Morning Post 2003). In implementing the WHO advisory, Hong Kong authorities placed responsibility on individual airlines to ask departing passengers WHO‐recommended questions.
On 17 April, Hong Kong health officials began a programme to screen the temperatures of all passengers departing Chek Lap Kok (Wu 2003; Michael 2003). The South China Morning Post immediately discovered loopholes in this programme that allowed thousands of transit passengers, including those from areas of local transmission, to leave Hong Kong unchecked (Phillips 2003). Under intense political pressure and media scrutiny, health authorities in Hong Kong made temperature screening on all transit passengers through Chek Lap Kok mandatory on 24 April. A combination of thermal imaging scanners (on loan from Singapore) and individual ear thermometers were used in this process (Michael 2003; Wu 2003; Chua 2004). It is worth noting that only South Korea, India, Russia, and ironically nearby Macao reported their first SARS cases after 24 April.
As an aside, the spread of SARS from Hong Kong featured the worst known instance of an infected airline passenger transmitting the disease to others in flight (Abraham 2005). An elderly traveller with SARS unwittingly infected 22 people during Air China flight 112 from Hong Kong to Beijing on 15 March. Apart from those on this one flight, only five other people in the world are believed to have caught the disease from a fellow airline passenger. Although air travel – especially air travel from Hong Kong – played a critical role as a conduit for the diffusion of SARS, aircraft air filtration systems and the characteristics of the disease itself made flying much safer than the popularity of facemasks among passengers on Asian flights during the outbreak would have suggested.
Singapore Singapore received international acclaim for its efforts to contain the SARS virus ( National Post 2003; WHO 2003c). Its success in this regard reflects the unusual capability of Singapore's bureaucracy, as well as the advantages of the city‐state's small size. Like developmental states elsewhere in Asia, Singapore has been noted for its ability to cultivate an elite corps of government policymakers; but Singapore has been unique in its use of the city‐state's vulnerability as a pretext for particularly aggressive government intervention in society. The vulnerability motif dates from Singapore's independence in 1965 as a very small, relatively affluent, Chinese‐majority country wedged between much larger, much poorer, Malay‐majority neighbours. Despite Singapore's enormous subsequent economic achievements, the government of Singapore has continued to emphasize the slim margin for error fostered by Singapore's small size. In the SARS crisis, the national sense of vulnerability gave the government extraordinary freedom to act, and generally it did so effectively.
Singapore's small size made SARS easier to manage as the great majority of visitors arrive via scheduled airline services at Changi Airport, Singapore's international air hub. (There are also two causeways linking Singapore to Malaysia and ferries to nearby points in Malaysia and Indonesia.) At Changi Airport, the response to SARS began just two days after the WHO's first recommendation to inform travellers of the signs and symptoms of SARS. Leaflets containing information about the SARS virus were disseminated among travellers beginning 17 March (Japan Economic Newswire 2003).
The day after the WHO's 27 March call for exit screening on departing passengers from areas of local transmission (including Singapore), the Civil Aviation Authority of Singapore (CAAS) instructed local airlines to follow WHO recommendations to question departing passengers. As in Hong Kong, the implementation of the containment effort was initially uneven. On 30 March, after more SARS cases had been imported into the city‐state, media reports indicated that only a portion of the airline staff in Changi Airport was following recommended screening procedures (Boo and Teo 2003).
From 31 March, all arriving passengers from SARS‐affected areas were required to undergo physical screening for symptoms of SARS (Henson 2003). Singapore continued to escalate its SARS surveillance efforts by designing a system with infrared scanners to screen the body temperature of travellers in Changi Airport (Tan and Goh 2003). A comprehensive system of mass temperature screening began on 23 April with three scanners monitoring all arriving passengers (regardless of the presence or absence of SARS in the country from which they had arrived) and four scanners monitoring all departing passengers (Siti 2003). While Singapore led the way in the rapid development and application of scanners to impede the diffusion of SARS, by the end of April they were also in use in Hong Kong; and China, the Philippines, Thailand, and Taiwan had ordered machines as well (Tan and Goh 2003; Chua 2004).
Canada In contrast to the acclaim garnered by Singapore, Canada's efforts have been the subject of significant criticism. Canadian health minister Anne McLellan responded to initial WHO recommendations by pledging to screen all passengers from Pearson International Airport in Toronto for flu‐like symptoms beginning 29 March. As the outbreak progressed, however, critics derided health‐screening efforts at Pearson International as belated and lackadaisical ( National Post 2003).
On 29 March, the day screening measures were to begin, federal government officials in Ottawa made a deliberate choice not to screen passengers at Pearson International (Lindgren and Kennedy 2003). Canada's National Post attributed Health Canada's decision to concerns about travel delays and passenger privacy (Blackwell and Evenson 2003). On 2 April, information leaflets were distributed to travellers boarding departing flights. The leaflets were intended to encourage passengers to postpone voluntarily their travel if they experienced any symptoms of SARS (McCarten 2003).
Beginning in the first week of May, during a second surge in Toronto SARS cases, passengers were required to complete both a Health Alert Card and a Traveler Contact Information Form upon arrival in either Toronto or Vancouver ( National Post 2003). By this time, exit screening at both airports included asking departing passengers the three WHO recommended questions concerning SARS symptoms and contacts; but the pace of SARS’ diffusion had already slowed markedly. In mid‐May, Canada further stepped up its efforts by deploying infrared thermal scanning machines at both Toronto's Pearson International Airport and Vancouver International Airport to screen both arriving and departing passengers at the country's two main gateways (St John et al. 2005).
It should be noted that the characteristics of SARS, including its very low prevalence among travellers and the propensity for infected persons to exhibit symptoms only some days after infection, made even infrared thermal screening at airports relatively ineffective. In Canada, for instance, of the nearly 800,000 travellers screened, only 191 were referred for further checks and none were found to have SARS (St John et al. 2005). A study of Canada's response to SARS suggested that the resources expended screening passengers may have been better spent on screening and infection control at health care facilities (St John et al. 2005).
Taiwan Like Hong Kong, Taiwan has a special relationship to the Peoples Republic of China (PRC). On the one hand, Taiwan is one of the most important sources of investment in China and many Taiwanese (managers, engineers, etc.) actually live in China. On the other hand, as a legacy of the long dispute between the government in Taipei and the government in Beijing, the former does not permit direct air links between China and Taiwan except through foreign cities and Hong Kong. Nevertheless, Taiwan was among the first places beyond China to which SARS spread.
Although Taiwan has experienced significant democratization since the late 1980s, its earlier history as a totalitarian state was evident in its response to SARS. Immediately following the WHO's recommendation for exit screening, Taiwanese health officials required all incoming air travellers to fill out a health declaration form, with compliance enforced by large fines and threats of internment. Beginning on 28 March, a massive campaign of home quarantine began which included travellers aboard flights with suspected SARS cases. Taiwan's response evolved to include mandatory temperature checks on all incoming passengers at the island's two main airports, beginning on 10 April (Rekhi 2003). The temperature screening was extended to include all departing passengers on 23 April.
A deluge of new cases beginning on 20 April spurred new SARS‐containment measures in Taiwan. Although the majority of new infections were confined to hospital settings, a mandatory 10‐day quarantine was enforced for all passengers arriving from areas of local transmission (Lo and Chiu 2003).
Analysis of SARS cases imported into the United States
Despite its strong connections to China, the United States was lightly affected by SARS; in particular there were no deaths attributable to the disease in the US. However, a special dataset pertaining to American SARS cases merits further consideration. As we have noted above, airline network accessibility appears to have been a less powerful force in explaining the late phase of SARS’ diffusion than it was in explaining earlier phases. A plausible explanation is that the escalating responses we have described impeded its spread. To analyse that contention further, we briefly analyse the travel histories of the 19 probable and eight confirmed cases reported in the US provided by the CDC. Of the eight confirmed cases of SARS in the US, six arrived before the WHO recommended screening passengers departing areas of local transmission. The two remaining confirmed cases arrived after this date from Toronto, where passenger screening was reportedly ‘lackadaisical’ ( National Post 2003). When the dataset is expanded to include all 27 probable and confirmed cases in the US, only three cases (11%) arrived in the US from locations with active health‐screening programmes (Table 7).
Table 7.
SARS cases imported to the United States by origin country and date
| Origin | 24 February−29 March | 30 March−13 June | ||
|---|---|---|---|---|
| Probable | Confirmed | Probable | Confirmed | |
| China | 9 | 1 | 0 | 0 |
| Hong Kong | 3 | 4 | 1 | 0 |
| Singapore | 1 | 1* | 1 | 0 |
| Taiwan | 0 | 1* | 1 | 0 |
| Vietnam | 1 | 0 | 0 | 0 |
| Canada | 1 | 0 | 0 | 2 |
| Germany | 1 | 0 | 0 | 0 |
| Total | 16 | 6 | 3 | 2 |
One case travelled to two destinations.
Probable and confirmed SARS cases imported to the United States before (24 February–29 March) and during (30 March–13 June) WHO recommended health‐screening measures in airports in areas of local transmission of SARS.
From these data, passenger health screening appears to coincide with the decrease in imported cases to the US. However, other variables may also have contributed to the decline in imported cases to the US from areas of local transmission, including the effective decrease in accessibility wrought by sharply lower passenger movements. For example, passenger traffic through Asia during the outbreak decreased by as much as 90% in Taiwan, 70% in Hong Kong and 55% in Singapore (Hendrickson 2003). A further complicating factor was the onset of summer in the northern hemisphere bringing warmer temperatures less favourable to the SARS virus.
Conclusion
The story of SARS attests to both the promise and the perils of globalization. On the one hand, some of the world's best scientists, doctors, and other health professionals from across much of the world, linked by the latest in information technology, were able to isolate and characterize the SARS‐CoV rapidly (Heymann 2004; Weiss and McLean 2004). On the other hand, SARS spread rapidly via a global airline network that, a century on from the Wright Brothers’ first flight, afforded unprecedented mobility. While it is true that the origin of the disease so close to Hong Kong made it especially prone to diffusion by air travel, and that a similar disease originating in Central Africa, for instance, would have spread more slowly (Weiss and McLean 2004), it is nevertheless apparent that the world was ill‐prepared to mitigate the diffusion of SARS via international air transport.
Although researchers have examined the potential of infectious disease to spread through the air transport network (Central Intelligence Agency 2000; Garrett 1994), most affected countries did not have previously prepared plans to implement health‐screening measures at airports during the 2003 SARS outbreak. While the threat of SARS was a global concern, the responses to contain SARS were heterogeneous across the affected countries. Infrared scanners in Singapore, mandatory quarantine in Taiwan and health notification cards in Toronto were all responses to mitigate the same disease. The WHO effectively established a global standard for containing the international spread of SARS to which nations compared their response efforts. Governments measured their containment efforts against WHO recommendations in press releases and, similarly, media reports either chastised or celebrated containment efforts, based on how they compared to those recommended by the WHO.
The different measures through which, and the speed with which, the WHO recommendations were implemented illustrated each nation's ability to react to circumstances rather than act according to a defined protocol. The escalation of uneven country‐specific responses contributed to a sense of panic, especially in Asia, that was incommensurate with the true scale of the threat (McKercher and Chon 2004). Indeed, on a global scale, the 2003 outbreak of SARS was a minor killer (Weiss and McLean 2004), but it still took nearly a thousand lives; and its human toll was exacerbated by its vast financial cost, estimated at US$40 billion for the Asia‐Pacific region alone (Osterholm 2005). Should a future epidemic arise in which an emerging or re‐emerging disease is more easily transmissible than SARS, a more uniform and planned response could be crucial to limiting both the loss of life and the economic devastation wrought by an outbreak.
Acknowledgements
We gratefully acknowledge the financial support of the Faculty Development Program, the College of Letters & Sciences, and the Department of Geography & Urban Planning, all at the University of Wisconsin‐Oshkosh. We thank Alison Siwek, SARS Surveillance/Investigative Coordinator, at the Centers for Disease Control and Prevention for providing the data on SARS cases imported into the US.
Note
Probable cases, as defined by the WHO, include patients with (i) high fever, (ii) radiographic evidence of respiratory distress syndrome and (iii) contact with a SARS patient or a travel history to a SARS‐infected area within a 10‐day period prior to the onset of illness. Confirmed cases are those for which the SARS antibodies have been detected in serological testing (WHO 2003g).
References
- Abraham T 2005. Twenty‐first century plague: the story of SARS The Johns Hopkins University Press, Baltimore [Google Scholar]
- Airports Council International 2003. Top 50 ACI airports by passenger traffic ACI World Report 3/4 March/April [Google Scholar]
- Arino J and Van Den Driessche P A multi‐city epidemic model Mathematical Population Studies 10 175–93 [Google Scholar]
- Blackwell T and Evenson B 2003. Outbreak closes 2nd hospital: number of possible SARS cases almost doubles, screening at airport questioned National Post 29 March [Google Scholar]
- Bonabeau E, Toubiana L and Flahault A 1998. The geographical spread of influenza Proceedings of the Royal Society of London – Biological Sciences 265 2421–5 [DOI] [PMC free article] [PubMed] [Google Scholar]
- Boo K and Teo G 2003. Passenger screening still lax Straits Times 30 March [Google Scholar]
- Bowen J 2002. Network change, deregulation, and access in the global airline industry Economic Geography 78 425–39 [Google Scholar]
- Centers for Disease Control and Prevention 2004. Basic information about SARS 13 January (http://www.cdc.gov/ncidod/sars/factsheet.htm) Accessed 11 December 2004
- Central Intelligence Agency 2000. The global infectious disease threat and its implications for the United States (NIE 99‐17D) Washington DC; [Google Scholar]
- Chua M H 2004. A defining moment: how Singapore beat SARS Institute of Policy Studies, Singapore [Google Scholar]
- Civil Aviation Authority of Singapore 2002. Air Transport Statistics May
- Civil Aviation Authority of Singapore 2003. Air Transport Statistics May
- Cliff A D, Haggett P and Smallman‐Raynor M R 1998. Island epidemics Oxford University Press, New York [Google Scholar]
- Cliff A D, Haggett P and Smallman‐Raynor M R 2000. Deciphering global epidemics: analytical approaches to the disease records of world cities, 1888–1912 Oxford University Press, New York [Google Scholar]
- DeLisle J 2003. SARS, Greater China, and the pathologies of globalization and transition Orbis 47 587–604 [DOI] [PMC free article] [PubMed] [Google Scholar]
- Garrett L 1994. The coming plague: newly emerging diseases in a world out of balance Farrar, Straus and Giroux, New York [Google Scholar]
- Gould P 1993. The slow plague: a geography of the AIDS pandemic Blackwell, Cambridge [Google Scholar]
- International Air Transport Association 1999. The Global Airport Connectivity Monitor – 1999 Edition London
- Hendrickson S 2003. July industry watch Sabre Industry Solutions (media.corporate‐ir.net/media_files/irol/73/73098/virtuals/060403/Webcast_FINAL.pdf) Accessed 16 September 2003
- Henson B 2003. Airport checks on SARS tightened Straits Times 31 March [Google Scholar]
- Herlihy D 1997. The Black Death and the transformation of the West Harvard, Cambridge [Google Scholar]
- Heymann D L 2004. The international response to the outbreak of SARS Philosophical Transactions of the Royal Society of London B 359 1127–9. [DOI] [PMC free article] [PubMed] [Google Scholar]
- Japan Economic Newswire 2003. SARS causes rising concern in H.K. Singapore 17 March [Google Scholar]
- Lindgren A and Kennedy M 2003. SARS war: next 2 days are critical Times Colonist 29 March [Google Scholar]
- Lo J and Chiu A 2003. Taiwan SARS clampdown shatters airlines: the most profitable and busiest route in Asia slashed by as much as two‐thirds by passenger quarantine South China Morning Post 29 April [Google Scholar]
- Longini I M 1988. A mathematical model for predicting the geographic spread of new infectious agents Mathematical Biosciences 90 367–83 [Google Scholar]
- Mayer J D 1998. The surveillance and control of emerging infectious diseases Applied Geographic Studies 2 261–78 [Google Scholar]
- Mayer J D 2000. Geography, ecology, and emerging infectious diseases Social Sciences & Medicine 50 937–52 [DOI] [PubMed] [Google Scholar]
- McCarten J 2003. Toronto travelers greet Health Canada's stark SARS warning with fear, doubt Canadian Press Newswire 2 April [Google Scholar]
- McKercher B and Chon K 2004. The over‐reaction to SARS and the collapse of Asian tourism Annals of Tourism Research 31 716–9 [DOI] [PMC free article] [PubMed] [Google Scholar]
- Michael P 2003. Health tests extended to air arrivals South China Morning Post 17 April [Google Scholar]
- National Post 2003. Soft on SARS 1 May A19
- Normile D and Enserink M 2003. Tracing the roots of a killer Science 301 18 July 297–9 [DOI] [PubMed] [Google Scholar]
- Osterholm M T 2005. Preparing for the next pandemic Foreign Affairs July/August 24–37
- Pampel F C 2000. Logistic regression: a primer Series number 07‐132 Sage, Thousand Oaks [Google Scholar]
- Patterson K D and Pyle G F 1983. The diffusion of influenza in sub‐Saharan Africa during the 1918–1919 pandemic Social Science and Medicine 17 1299–307 [DOI] [PubMed] [Google Scholar]
- Peiris J S M and Guan Y 2004. Confronting SARS: a view from Hong Kong Philosophical Transactions of the Royal Society of London B 359 1075–9 [DOI] [PMC free article] [PubMed] [Google Scholar]
- Phillips H 2003. Travellers escaping checkups at airport South China Morning Post 21 April [Google Scholar]
- Pomfret J China's slow reaction to fast‐moving illness. Washington Post. 2003;A18 [Google Scholar]
- Pyle G 1969. The diffusion of cholera in the United States in the nineteenth century Geographical Analysis 1 54–77 [DOI] [PubMed] [Google Scholar]
- Rekhi S 2003. Fit to fly: airlines strive to keep SARS bug at bay and stay in the air Straits Times 28 April [Google Scholar]
- Rvachev L and Longini I 1985. A mathematical model for the global spread of influenza Mathematical Biosciences 75 3–22 [Google Scholar]
- Sattenspiel L and Dietz K 1995. A structured epidemic model incorporating geographic mobility among regions Mathematical Biosciences 128 71–91 [DOI] [PubMed] [Google Scholar]
- Shannon G W and Willoughby J 2004. Severe acute respiratory syndrome (SARS) in Asia: a medical geographic perspective Eurasian Geography and Economics 45 359–81 [Google Scholar]
- Siti R 2003. Singapore extends high‐tech temp screening for SARS Japan Economic Newswire 23 April [Google Scholar]
- South China Morning Post 2003. A crisis that is testing Hong Kong's mettle 26 March
- St John R K, King A, De Jong D, Bodie‐Collins M, Squires S G and Tam T W S 2005. Border screening for SARS Emerging Infectious Diseases 11 6–10 [DOI] [PMC free article] [PubMed] [Google Scholar]
- Taaffe E J, Gauthier H L and O’Kelly M E 1996. Geography of Transportation 2nd ed Prentice Hall, Upper Saddle River [Google Scholar]
- Tan L and Goh C L 2003. S’pore's hot anti‐SARS export: thermal scanners The Straits Times 30 April [Google Scholar]
- Weiss R A and McLean A R 2004. What have we learnt from SARS? Philosophical Transactions of the Royal Society of London B 359 1137–40 [DOI] [PMC free article] [PubMed] [Google Scholar]
- WHO 2003a. Situation updates, SARS Update #3 18 March (http://www.who.int/csr/don/2003_03_18/en/) Accessed 16 September 2003
- WHO 2003b. Situation updates, SARS Update #11 27 March (http://www.who.int/csr/don/2003_03_27/en/) Accessed 16 September 2003
- WHO 2003c. Situation updates, SARS Update #53 12 May (http://www.who.int/csr/don/2003_05_212/en/) Accessed 16 September 2003
- WHO 2003d. Situation updates, SARS Update #92 1 July (http://www.who.int/csr/don/2003_07_01/en/) Accessed 16 September 2003
- WHO 2003e. Situation updates, SARS Update #95 4 July (http://www.who.int/csr/don/2003_07_04/en/) Accessed 16 September 2003
- WHO 2003f. Consensus document on the epidemiology of severe acute respiratory syndrome (SARS) (http://www.who.int/csr/sars/en/WHOconsensus.pdf) Accessed 16 September 2003
- WHO 2003g. Case definitions for surveillance of severe acute respiratory syndrome (SARS) (http://www.who.int/csr/sars/casedefinition/en) Accessed 16 September 2003
- WHO 2004. Summary of probable SARS cases with onset of illness from 1 November 2002 to 31 July 2003, 21 April (http://www.who.int/csr/sars/country/table2004_04_21/en/) Accessed 20 December 2004
- Wu E 2003. Air passengers warm to temperature checks South China Morning Post 18 April [Google Scholar]
- Zheng L 2003. Distribution of the overseas Chinese population (http://www.library.ohiou.edu/subjects/shao/databases_popdis.htm) Accessed 31 May 2003