ABSTRACT
Electrical signals (ESs) can be induced by local action of stressors in plants; they influence numerous physiological processes (photosynthesis, transpiration, respiration, genes expression, synthesis of phytohormones, etc.) and, thereby, induce a systemic adaptation response. Development of optical methods of a remote sensing of this response can be important for agricultural and ecological monitoring. Preliminarily, we showed (Sukhova et al., Plant Sign Behav 2019; 14:e1610301) that burning-induced ESs induced changes in leaf reflectance at broad spectral bands (400–500, 500–600, 600–700, and 700–800 nm). The aims of the present work were (i) investigation of ESs influence on difference reflectance indices (RIs) calculated on the basis of these broad spectral bands and (ii) analysis of connection of the indices with water content in plants. Pea seedlings were investigated. ESs were induced by burning of the first mature leaf; ESs had high amplitudes in the second leaf and had low amplitudes in the fourth leaf. It was shown that ESs induced significant changes in RIs, which were calculated on basis of intensities of the reflected light at (i) 400–500 and 600–700 nm, (ii) 500–600 and 700–800 nm, and (iii) 600–700 and 700–800 nm. The effect was strong in the second leaf and weak in the fourth leaf; that is, the response was dependent on the magnitude of ESs. ESs-induced changes in RI were strongly connected with ESs-induced decrease of leaf water content which was estimated on basis of decrease of water index. Thus, broadband RIs can be used for revealing the ESs-induced systemic stress response in plants.
KEYWORDS: Broadband reflectance indices, water index, variation potential, visible light
Introduction
An action of many stressors (high and low temperatures, mechanical wounding, excessive light, etc.) on plants is spatially heterogeneous; as a result, generation and propagation of stress signals are required for induction of a systemic adaptation response.1 Electrical signals (ESs) are known to play an important role in forming the system response.2–4 ESs include three main types of signals: an action potential, which is induced by non-damaging stressors, a variation potential, which is induced by damaging stressors (mainly, heating, and burning), and a system potential, which can additionally be generated by various stressors.3–10 It is known that ESs stimulate expression of defense genes,11,12 increase production of stress phytohormones (in particular, abscisic and jasmonic acids),13,14 change photosynthetic processes,15–18 modify opening of stomata and activity of transpiration,19–21 stimulate respiration,15,22 suppress phloem mass flow,23 increase ATP content,24 etc. It is probable that the final result of these numerous physiological changes is the increase of plant tolerance to stressors (i.e., development of the systemic adaptation response);3,4 this hypothesis is supported by the positive influence of electrical responses on plant thermotolerance.20,25-27
Considering the close connection between actions of stressors, electrical activity, and physiological processes, it can be supposed that ESs and ESs-induced systemic responses may be used for monitoring of plant damage induced by adverse factors and estimation of the following adaptation processes in these plants. Measurements of the electrical responses in plants can be used for displaying the action of stressors, which is based on different methods of identification and classification of electrical responses (e.g., machine learning algorithms, interval arithmetic, wavelet analysis, etc.),28–33 including a systemic analysis of all types of electrical activity as “plant electrome.”34,35 However, measurements of electrical activity are based on the application of electrodes and cannot be used for remote sensing plant systemic response on action of stressors.
Alternative approaches can be based on monitoring of ESs-induced changes in physiological processes by using optical methods, which are remote, fast, and relatively simple. In particular, methods based on reflectance measurements can be perspective tool for investigation of ESs-induced responses; however, there are only few works that are devoted to the use these methods for analysis of the problem. Considering the strong influence of ESs on photosynthetic processes (in particular, decrease of quantum yields of photosystem I and II (ФPSII) and increase of the non-photochemical quenching (NPQ) of chlorophyll fluorescence),3,15,16 using of the photochemical reflectance index (PRI) can be perspective approach for the remote sensing of ESs-induced systemic responses. Changes in this index are mainly caused by xanthophyll de-epoxidation36 and are related to changes in photosynthetic parameters including NPQ.36–40 Our results show that ESs can induce changes in PRI, and these changes are strongly related to the photosynthetic response.41
However, calculation of PRI is based on measurement of two narrow spectral bands at 531 and 579 nm36–40 and magnitudes of ESs-induced changes in this index are about 0.005,41 that is, use of PRI for remote sensing of the ESs-induced systemic response is technically a difficult problem. As a result, there is an important question: can reflectance at broad spectral bands (its measurement is technically simpler than measurement of narrow spectral bands) be used for displaying ESs-induced physiological changes? Our preliminary results42 showed that ESs can also increase the reflectance of plant leaves at broad spectral bands (400–500, 500–600, 600–700, and 700–800 nm). This increase was not related to the photosynthetic response and we speculated that the reflectance changes could be related to the changes in the leaf water content because ESs strongly influence transpiration in plant leaves.19–21
Thus, the current work is devoted to analysis of the two important points:
(i) Investigation of the ESs influence on difference reflectance indices (RIs), calculated on basis of the broad spectral bands (400–500, 500–600, 600–700, and 700–800 nm). The general equation for these RIs is as follows:
where RX and RY are intensities of the reflected light at spectral bands X and Y. Potentially, analysis of RIs can be more effective than analysis reflectance because it minimizes influence of the light intensity.
(ii) Analysis of relationships between these RIs and water content in plant leaves; this analysis can support/disprove hypothesis42 about a key role of ESs-induced changes in the water content for changes in reflectance at broad spectral bands; that is, it can clarify mechanisms of the reflectance changes after propagation of ESs.
Materials and methods
Plant materials
Two- to three-week-old pea seedlings (Pisum sativum L.) were used in experiments. In most of the experiments, the plants were hydroponically cultivated in a Binder KBW 240 plant growth chamber (BinderGmbH, Tuttlingen, Germany) at 24°C in 16/8-h (light/dark) photoperiod. In an additional series of experiments, where drought influence on RIs and water content was investigated, pea seedlings were cultivated in a sand substrate in a Binder KBW 240; the seedlings were irrigated (control) or were not irrigated (drought).
Induction and measurements of ESs
A local burning of stipule of the first mature leaf (flame, 3–4 s, about 1 cm2) was done for the induction of ESs (Figure 1a). The burning was done after adaptation of plants in a measuring system (75 min); this time included dark adaptation (15 min) and following light adaptation (60 min) (see section “Measurements chlorophyll fluorescence and reflected light” for details).
Figure 1.
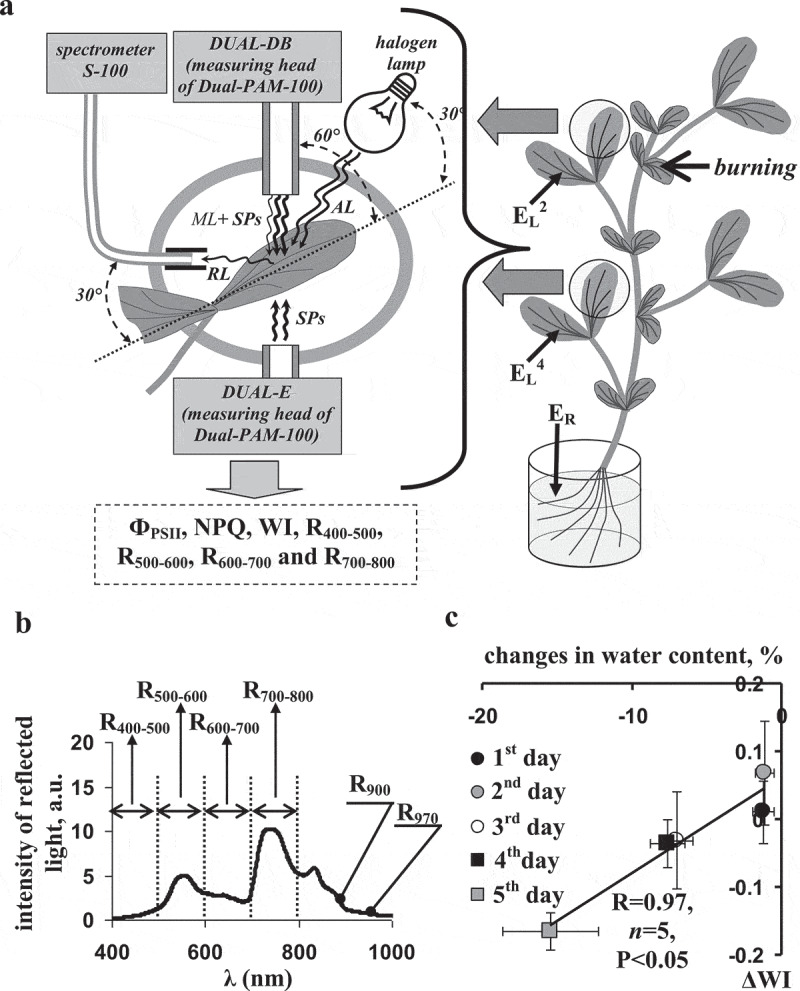
(a) Schematic of plant burning, locations of electrodes, and measurements of photosynthetic and spectral parameters. EL2 and EL2 are electrodes, which were placed on the leaflet of the second and fourth leaves, respectively; ER is the reference electrode. The local burning of the first mature leaf (flame, 3–4 s, approximately 1 cm2) was used for the induction of electrical signals and physiological responses (arrow). A PAM fluorometer Dual-PAM-100, including detector block Dual-DB and emitter block Dual-E, was used for measurements of the quantum yield of photosystem II (ФPSII) and non-photochemical quenching of chlorophyll fluorescence (NPQ). A spectrometer S-100 was used for measurement of the reflected light. AL is the actinic light (halogen lamp Osram Decostar, white light, about 630 μmol m−2s−1); SPs is the saturation pulses (Dual-PAM-100, 630 nm, 10 000 μmol m−2s−1, 300 ms); ML is the measuring light (Dual-PAM-100, 460 nm, 24 μmol m−2s−1, 2.5 µs pulses); RL is the reflected light. is the water index; R900 and R970 are intensities of the reflected light at 895–905 nm and 965–975 nm; R400–500, R500–600, R600–700, and R700–800 are average intensities of the reflected light at broad spectral bands (400–500, 500–600, 600–700, and 700–800 nm, respectively). (b) A spectrum of the reflected light in the pea leaf. (c) Connection between average decrease in WI (ΔWI) and average decrease in the relative water content during soil drought (1–5 d without irrigation). ΔWI was calculated as difference between WI in experiment (under the soil drought) and WI in control; change in the water contents was calculated analogically. R is the linear correlation coefficient.
ESs were extracellularly measured by Ag+/AgCl electrodes (EVL-1 M3.1, RUE “Gomel Measuring Equipment Plant,” Gomel, Belarus); the signal was amplified and digitized by amplifier IPL-113 (Semico, Novosibirsk, Russia). The electrodes were placed on leaflets in the second mature leaf (EL2) and the fourth mature leaf (EL4); they were contacted to the leaf surface through electroconductive gel Uniagel (Geltek-Medica, Moscow, Russia). The reference electrode (ER) was contacted with root solution.
Measurements chlorophyll fluorescence and spectrum of reflected light
Dual-PAM-100 (Heinz Walz GmbH, Effeltrich, Germany) was used for estimation of photosynthetic parameters on basis of the chlorophyll fluorescence measurement by PAM method (Figure 1a).43–45 The procedure of the measurement was described in detail in our earlier works.41,42,46 Briefly, the second and fourth leaves were investigated after the dark adaptation for 15 min. The first saturation pulse (SP) of red light (630 nm, 10 000 µmol m−2 s−1, 300 ms) was used for measurement of the dark (F0) and maximal (Fm) fluorescence yields. After that, SPs were generated every 30 s; the steady-state (F) and maximal (Fm′) fluorescence yields were periodically measured. A halogen lamp (Osram Decostar, 3000К, 20 W, 12 V, Germany) was used as a source of white actinic light (AL). Illumination by the AL was started at 15 s after the fourth SP; intensity of the leaf illumination was about 630 µmol m−2 s−1. The quantum yield of photosystem II and the NPQ of chlorophyll fluorescence were calculated using the equations and .43–45
The spectra of reflected light in the second and fourth leaves were measured by the S100 spectrometer (SOLAR Laser Systems, Minsk, Belarus); the spectral range of the S100 was 190–1050 nm; the spectral resolution was about 1 nm. It was connected with a fiber-optic cable; the tip of the fiber-optic cable was equipped with a small black tube (the simplest collimator). The distance from the surface of leaf to surface of the fiber-optic cable was about 1.5 cm; the angle between these surfaces was about 30°. The procedure of the measurement was described in detail in our earlier works.41,42,46 Briefly, the white AL was used as the incident light; the integration time was 5 s in our experiments. Continuously repeating measurements were used for the analysis of dynamics of changes in reflectance of pea leaves. These measurements were averaged for each 60 s; spectra, which were measured at the same time with SPs, were excluded from this averaging.
Calculation of difference RIs on the basis of broad spectral bands
In accordance with our earlier work,42 we calculated average intensities of the reflected light at broad spectral bands including 400–500 nm (R400–500), 500–600 nm (R500–600), 600–700 nm (R600–700), and 700–800 nm (R700–800) (Figure 1b). Equation (1) is used for calculation of difference RIs on basis of R400–500, R500–600, R600–700, and R700–800. It should be noted that Equation (1) can be used for calculating a number of RIs including the normalized difference vegetation index,47 normalized difference water index (WI),48 PRI,36–39 and many others. Using Equation (1) decreases errors related to the intensity of incident light.
There were six RIs that were calculated in the present work: RI(R400–500, R500–600), RI(R400–500, R600–700), RI(R400–500, R700–800), RI(R500–600, R600–700), RI(R500–600, R700–800), and RI(R600–700, R700–800). It is important that ESs-induced changes in RIs (ΔRIs) were investigated in the work. ΔRIs were calculated as difference between RIs after ESs induction and RIs before this induction. Absolute values of RIs had high standard errors; significant changes were absent (data not shown).
Calculation of the water index
WI is an estimator of water content in plants.49 WI is caluclated as R900/R970, where R900 and R970 are intensities of the reflected light at 900 and 970 nm. In the present work, R900 was calculated as averaged reflected light intensities from 895 – to 905 nm; R970 was calculated as averaged reflected light intensities from 965 – to 975 nm.
We analyzed changes in WI (ΔWI), which were induced by ESs and were analyzed for investigation of ESs influence on water content. Absolute values of WI had high standard errors and significant changes were absent (data not shown); thus, analysis of absolute values of WI could not be used in investigation.
Analysis of drought influence on reflectance indices
Additionally, we analyzed the efficiency of WI for estimation of water content in pea leaves and influence of decrease in the water content on RIs. We used separate series of pea seedlings, which were irrigated (control) or were not irrigated (drought) for 5 d.
WI and relative water content (which was calculated on basis of fresh and dry weights of leaves) were measured every day. Changes in water content and WI (ΔWI) were calculated as differences between parameters at drought and at control conditions for all days. Figure 1c shows that decrease in the leaf water content was strongly linearly correlated to the decrease in WI. The result showed that ΔWI could be used for estimation of changes in the water content in pea seedling in the following analysis.
RI(R400–500, R500–600), RI(R400–500, R600–700), RI(R400–500, R700–800), RI(R500–600, R600–700), RI(R500–600, R700–800), and RI(R600–700, R700–800) were measured in leaves of pea seedling under control (with irrigation) and experimental (drought, fifth day without irrigation) conditions. Differences between control and experimental RIs were calculated.
Statistics
A separate seedling of pea was used for each experiment. Quantities of repetitions were 5–7 in different variants; the quantities are shown in the figures. Representative records, mean values, standard errors, scatter plots, and linear correlation coefficients are presented in the figures. The Student’s t-test was used for the estimation of significance of differences in experiments. Significance of linear correlation coefficients was estimated on the basis of the standard table of critical values for Pearson correlation.
Results
Local burning-induced ESs and photosynthetic responses
Figure 2a shows ESs that were observed in the second and fourth mature leaves of pea seedlings after burning of the first leaf. ESs seemed to be typical variation potentials;8 in particular, they were variable and long term (more than 10 min) and their amplitudes decreased with increase in distance from the burned zone (the ESs in the second leaf were larger than those in the fourth leaf). Additionally, we investigated photosynthetic responses because these responses were caused by ESs and could be used as the additional indicator of the systemic adaptation response in the plant.3,4 Figure 2b shows that ESs induced photosynthetic responses (transient decrease of ФPSII and increase of NPQ); magnitudes of these responses in the second leaf were larger than those in the fourth leaves. The results were in a good agreement with our earlier works18,24,41,42 and showed possibility of the following analysis.
Figure 2.
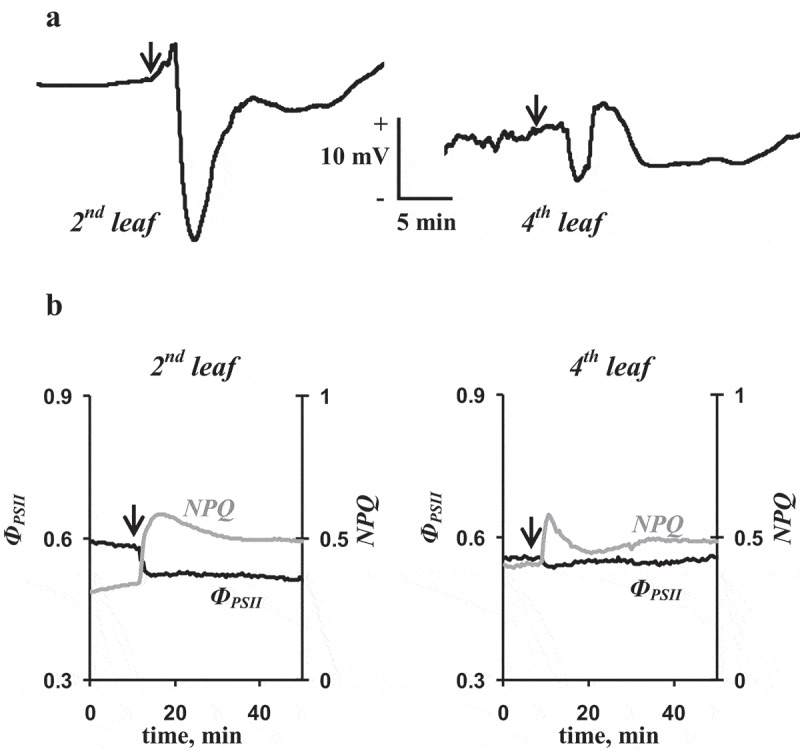
Records of burning-induced electrical signals (a) and changes in the quantum yield of photosystem II (ФPSII) and non-photochemical quenching of fluorescence (NPQ) (b) in second and fourth leaves of pea seedlings (n = 6–7). The local burning of the first mature leaf (flame, 3–4 s, approximately 1 cm2) was used for the induction of electrical signals and physiological responses (arrow). Electrical signals were measured by extracellular electrodes; changes in ФPSII and NPQ were measured by the PAM-fluorometer.
Changes in broadband RIs in leaves after the local burning
Figure 3 shows changes in RIs, calculated on basis of broad spectral bands, in the second leaf after the local burning of the first leaf. It should be noted that all RIs were changed after induction of ESs; however, only several RIs were significantly changed after the ESs induction: ΔRI(R400–500, R600–700) was gradually decreased (the decrease was reached in about 30 min after stimulation), ΔRI(R500–600, R700–800) and ΔRI(R600–700, R700–800) were increased (the increase had maximum in about 25–30 min after stimulation). Dynamics of these changes in RIs differed from dynamics of changes in ФPSII and NPQ in the second leaf. It was in a good agreement with our earlier results,42 which showed different dynamics of photosynthetic parameters and reflectance at broad spectral bands.
Figure 3.
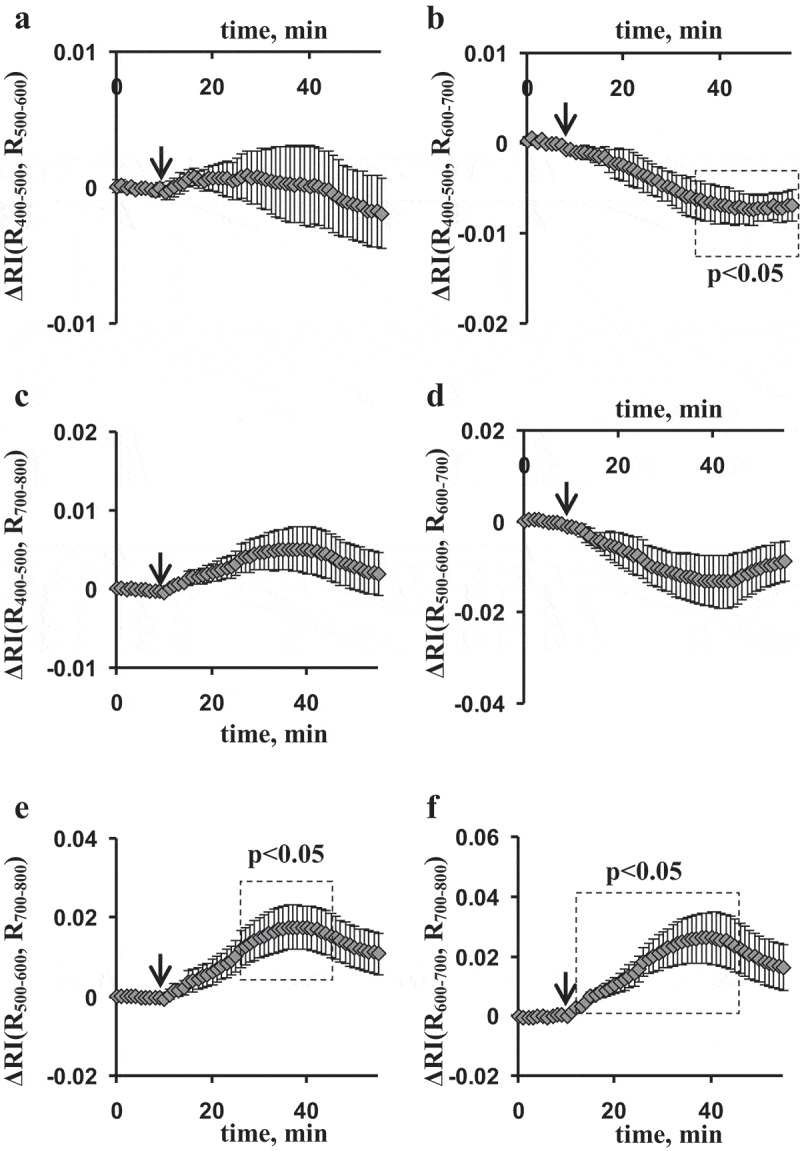
Average burning-induced changes in the reflectance indices (ΔRIs), calculated on basis of broad spectral bands in the second leaf of pea seedlings (n = 6). (a) The reflectance index was calculated on basis of intensities of the reflected light (r) at 400–500 and 500–600 nm; (b) the reflectance index was calculated on basis of intensities of the reflected light at 400–500 and 600–700 nm; (c) the reflectance index was calculated on basis of intensities of the reflected light at 400–500 and 700–800 nm; (d) the reflectance index was calculated on basis of intensities of the reflected light at 500–600 and 600–700 nm; (e) the reflectance index was calculated on basis of intensities of the reflected light at 500–600 and 700–800 nm; (f) the reflectance index was calculated on basis of intensities of the reflected light at 600–700 and 700–800 nm. The local burning of the first mature leaf (flame, 3–4 s, approximately 1 cm2) was used for induction of electrical signals and physiological responses (arrow). RI(Rx, Ry) was calculated as , where Rx and Ry were average intensities of reflected light in the broad spectral bands (400–500, 500–600, 600–700, and 700–800 nm). Change in RI was calculated as difference between current value of RI and value of RI before burning. Average values and standard errors are shown in the figure. Dotted boxes show significant differences from values before stimulation (p < .05).
Figure 4 shows changes in RIs in the fourth leaf after the local burning of the first leaf. ESs-induced changes in broadband RIs were qualitatively similar to the same changes in the second leaf; however, magnitudes of these changes were low. Only changes in RI(R500–600, R700–800) were significant in the fourth leaf. The results were in a good agreement with low magnitudes of ESs and photosynthetic responses in the fourth leaf; however, dynamics of changes in RIs also differed from dynamics of changes in photosynthetic parameters after induction of ESs.
Figure 4.
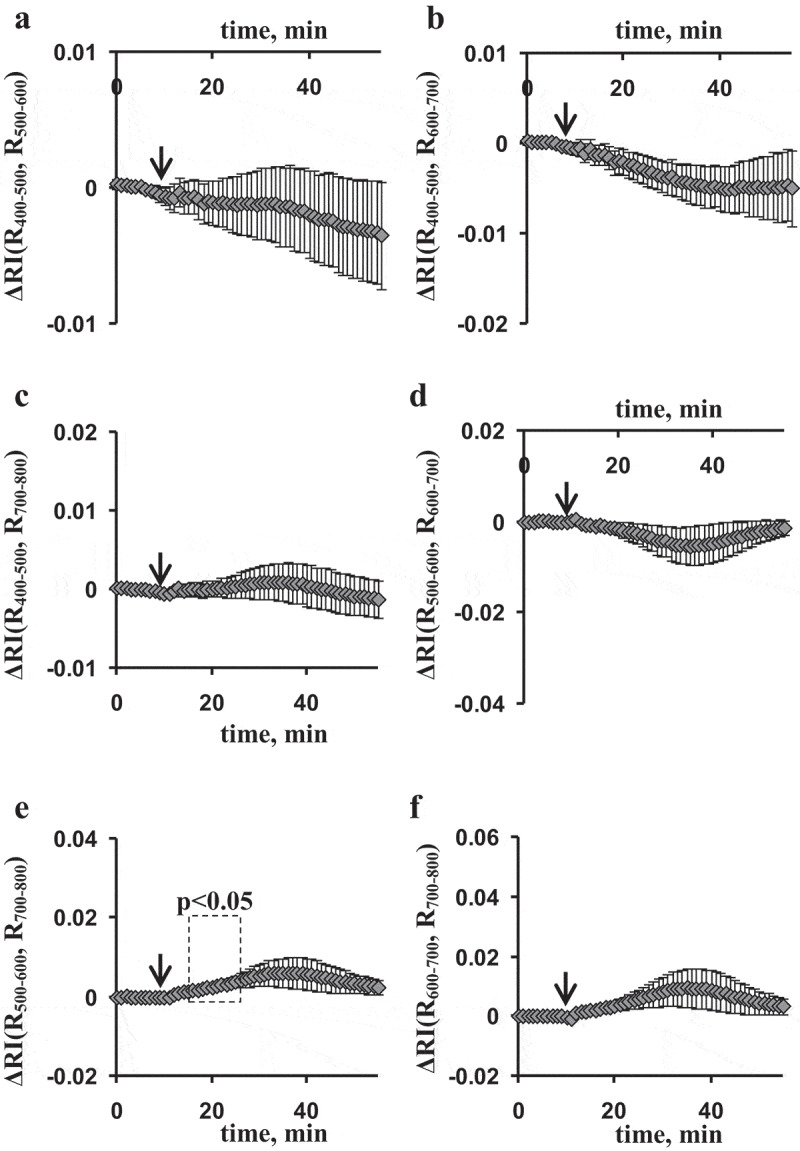
Average burning-induced changes in the reflectance indices (ΔRIs), calculated on basis of broad spectral bands in the fourth leaf of pea seedlings (n = 5). (a) The reflectance index was calculated on basis of intensities of the reflected light (r) at 400–500 and 500–600 nm; (b) the reflectance index was calculated on basis of intensities of the reflected light at 400–500 and 600–700 nm; (c) the reflectance index was calculated on basis of intensities of the reflected light at 400–500 and 700–800 nm; (d) the reflectance index was calculated on basis of intensities of the reflected light at 500–600 and 600–700 nm; (e) the reflectance index was calculated on basis of intensities of the reflected light at 500–600 and 700–800 nm; (f) the reflectance index was calculated on basis of intensities of the reflected light at 600–700 and 700–800 nm. The local burning of the first mature leaf (flame, 3–4 s, approximately 1 cm2) was used for induction of electrical signals and physiological responses (arrow). RI(Rx, Ry) was calculated as , where Rx and Ry were average intensities of reflected light in the broad spectral bands (400–500, 500–600, 600–700, and 700–800 nm). Change in RI was calculated as difference between current value of RI and value of RI before burning. Average values and standard errors are shown in the figure. Dotted boxes show significant differences from values before stimulation (p < .05).
Thus, local burning and induction and propagation of ESs can change broadband RIs; that is, changes in RIs could be indicators of the ESs-induced systemic adaptation response in plants. Potential mechanism of these RI changes could be related to the changes in water content;42 further, we analyzed this hypothesis.
Changes in leaf WI after the local burning and their connection with broadband RIs
Figure 5 shows changes in the WI in the second and fourth leaves after the local burning of the first leaf. It was shown (Figure 5a) that ESs significantly decreased WI in the second leaf; the decrease occurred in about 30 min after the local burning. Considering the relation between WI and the leaf water content (Figure 1c), this decrease of the WI was probably to show the decrease in water content in the second leaf after the ESs induction. Burning-induced changes in WI in the fourth leaf were very weak (Figure 5b).
Figure 5.
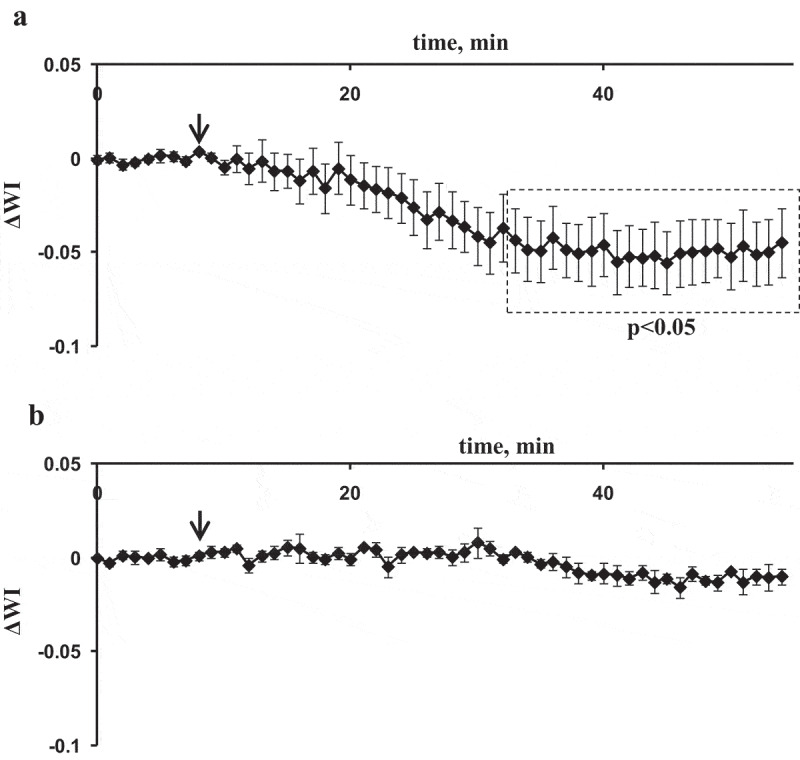
Average burning-induced changes in the water index (WI) in second (a) and fourth (b) leaves of pea seedlings (n = 5–6). The local burning of the first mature leaf (flame, 3–4 s, approximately 1 cm2) was used for induction of electrical signals and physiological responses (arrow). WI was calculated on basis of intensities of reflected light at 900 (R900) and 970 nm (R970) which were measured by the spectrometer; changes in WI were calculated as difference between current value of WI and value of WI before burning. Average values and standard errors are shown in the figure. Dotted boxes show significant differences from values before stimulation (p < .05).
Figure 6 shows scatter plots between ΔWI and investigated ΔRIs, which were based on all the experimental results (the second and fourth leaves). Excluding ΔRI(R400–500, R500–600), all ΔRIs were significantly correlated with decrease of WI; moreover, absolute values of correlation coefficients of ΔWI with ΔRI(R500–600, R600–700), ΔRI(R500–600, R700–800), and ΔRI(R600–700, R700–800) were more than 0.90. The result showed that ESs-induced changes in RIs can be potentially caused by changes in the water content in leaves.
Figure 6.
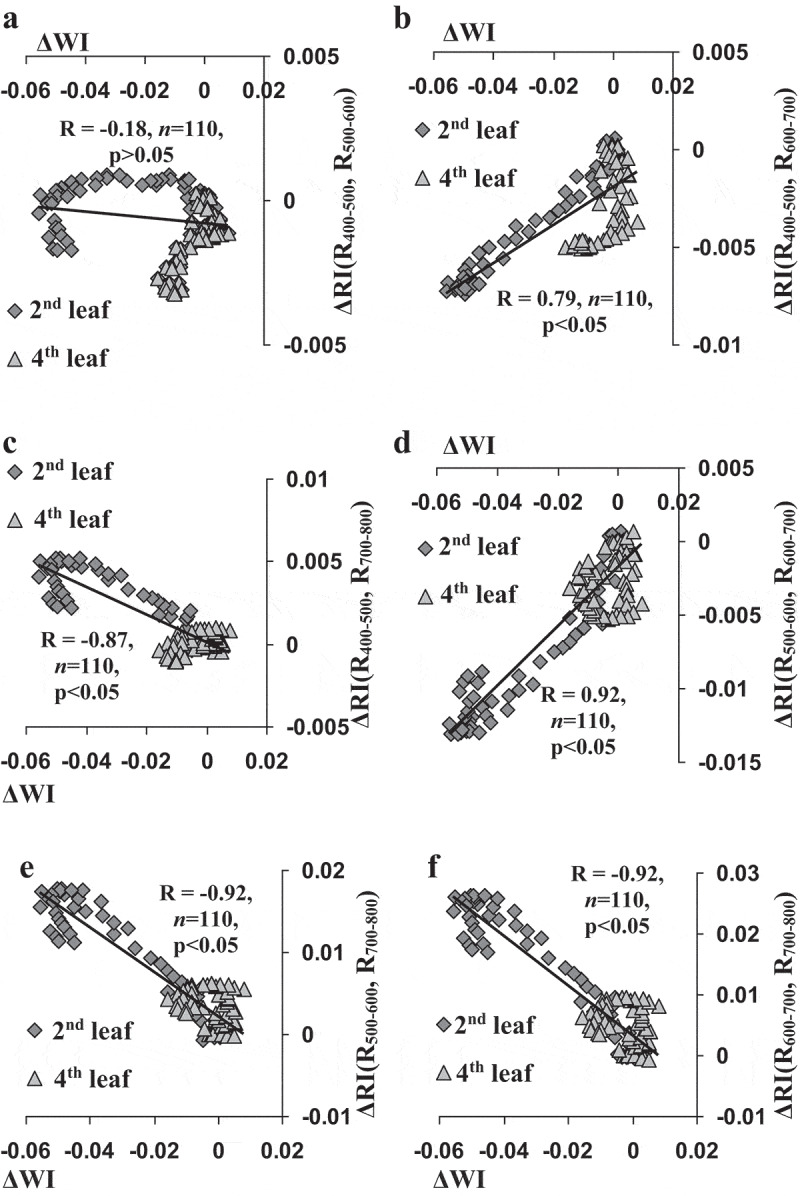
The scatter plots of average changes in reflectance indices (ΔRIs), which were calculated on basis of intensities of the reflected light (r) at 400–500 and 500–600 nm (a), 400–500 and 600–700 nm (b), 400–500 and 700–800 nm (c), 500–600 and 600–700 nm (d), 500–600 and 700–800 nm (e), and 600–700 and 700–800 nm (f) in second and fourth leaves after burning of the first leaf versus average values of changes in water index (ΔWI). All values of ΔWI from Figure 5 and all values of changes in reflectance indices from Figures 3 and 4 were used; standard errors were not shown. R is the linear correlation coefficient.
Changes in broadband RIs after drought-induced decrease of the water content in leaves
We used drought conditions to decrease the leaf water content; it could be expected that this decrease should induce changes in broadband RIs, which were similar to ESs-induced changes in these indices. Figure 7a shows that the leaf water content significantly decreased on the 5th day of drought.
Figure 7.
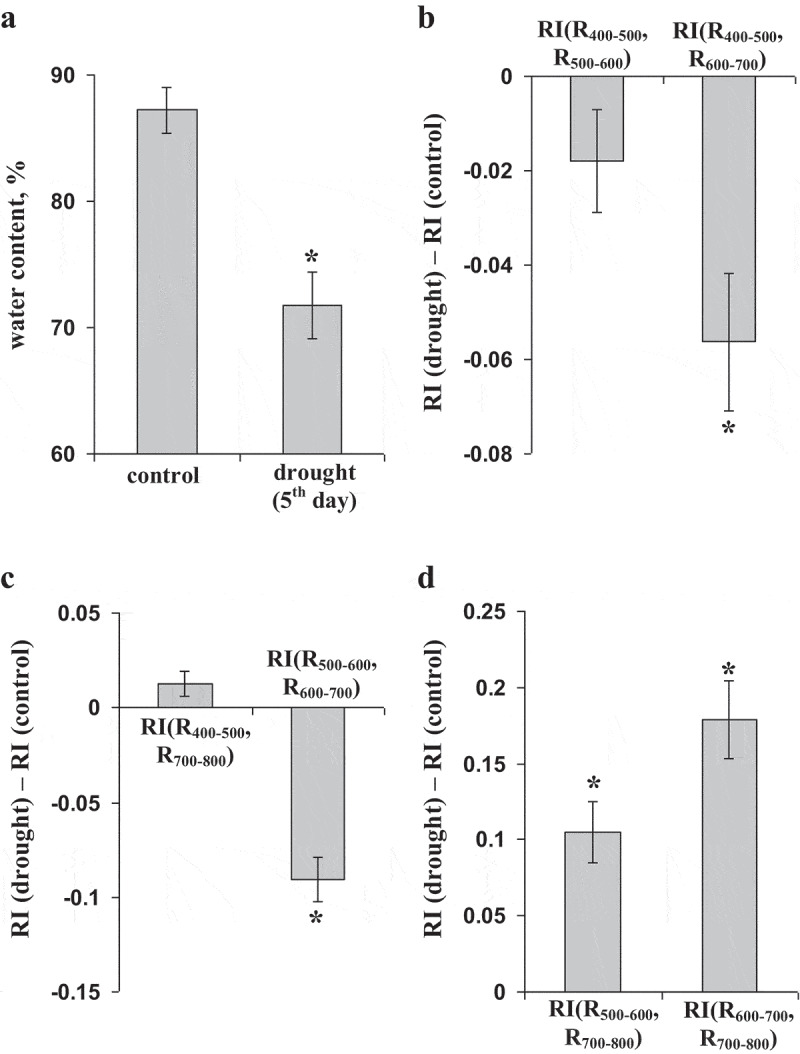
An influence of the drought on the relative water content and reflectance indices (RIs), calculated on basis of broad spectral bands (n = 5). (a) The relative water contents in pea leaves under control (irrigation) and experimental (drought, 5th day without irrigation) conditions. (b) Differences between control and experimental RIs for RI(R400–500, R500–600) and RI(R400–500, R600–700). (c) Differences between control and experimental RIs for RI(R400–500, R700–800) and RI(R500–600, R600–700). (d) Differences between control and experimental RIs for RI(R500–600, R700–800) and RI(R600–700, R700–800). * indicates that difference from control value (for the relative water content) or difference from “0” (for differences between control and experimental RIs) were significant (p < .05).
Figure 7b–d shows that the drought influenced RIs, calculated on the basis of broad spectral bands. In particular, RI(R400–500, R600–700) and RI(R500–600, R600–700) were significantly decreased in 5th day of drought; in contrast, RI(R500–600, R700–800) and RI(R600–700, R700–800) were significantly increased. These changes were similar to ESs-induced ones; they supported hypothesis about participation of decrease of the leaf water content in induction of changes in broadband RIs after local stimulation.
Discussion
ESs are known to be an important mechanism of the fast systemic adaptation response of plants on action of stressors,3,4 in particular, ESs induce changes in physiological processes that can be related to the changes in optical properties of leaves. It means that the systemic adaptation response can be potentially displayed in plants by optical methods of the remote sensing. These methods can be based on measurement of RIs; in particular, we earlier showed that ESs induced transient decrease of PRI.41 The decrease is strongly related to ESs-induced increase of the energy-dependent component of the NPQ;41 it is probable that both processes are caused by acidification of lumen in chloroplasts because ESs decrease pH in the lumen50 and the lumen acidification stimulates the energy-dependent NPQ43–45,51 and changes PRI.37–39
Thus, the photosynthetic response induced by electrical signals can be revealed on basis of changes in PRI. However, analysis of the relation between ESs-induced physiological processes and optical properties of leaves remains an important problem because other indicators can display other physiological changes. Our preliminary work42 shows that ESs induce changes in the leaf reflectance at 400–500, 500–600, 600–700, and 700–800 nm; these changes are not related to photosynthetic responses. The present work is devoted to further investigation of this effect and shows some important results.
First, it is shown that ESs change difference RIs, calculated on basis of broad spectral bands (Figures 3,4); these changes are significant for decrease of RI(R400–500, R600–700) and increase of RI(R500–600, R700–800) and RI(R600–700, R700–800). It is very probable that ESs-induced changes in broadband RIs are based on different magnitudes of ESs-induced changes in reflectance at broad spectral bands which are shown earlier.42 It should be noted that using RIs can decrease errors that are related to fluctuations of the light intensity (in accordance with Equation (1)) in comparison to use of the intensity of the reflected light; thus, display of ESs-induced changes in broadband RIs has practical importance.
Second, our results show that ESs can induce decrease in the leaf water content which is shown on basis of decrease of WI (Figure 5). ESs-induced changes in transpiration are well-known plant responses induced by local stimulations.4,13,19-21 These changes are hypothesized to be related to inactivation of the plasma membrane H+-ATP-ase, which is accompanied to the ESs generation;20 different dynamics of turgor drop in stomata and epidermal cells21 and production of stress phytohormones can also influence transpiration after induction of electrical signals.13 It should be noted that the parameters of ESs-induced changes in transpiration are dependent on environmental conditions.21,52 However, the ESs-induced decrease in the water content is a new and interesting result. It is in a good agreement with the fast increase of transpiration after ESs propagation and the following long-term decrease of transpiration, which are observed in some works.19,21 Considering our results and literature data, we can speculate the next chain of events: local damage of plant – induction and propagation of ESs in the plant – stomata opening and activation of transpiration in undamaged leaves– decrease of the water content in these leaves – decrease of transpiration (possibly, through production of stress phytohormones and stomata closing).
Third, the ESs-induced decrease in the leaf water content is strongly related to the changes in the most investigated broadband reflected indices (Figure 6). Additionally, decrease in the leaf water content under drought conditions can induce changes in these broadband RIs that are similar to the ones induced by ESs (Figure 7). These results support our previous hypothesis about relationship between ESs-induced changes in leaf reflectance at broad spectral bands and changes in transpiration and water content in the leaf.42 The mechanisms of influence of changes in the leaf water content on reflectance at broad spectral bands and RIs are not clear, now; it is possible that the effect can be connected with changes in the leaf thickness, with changes in concentrations of photosynthetic pigments, with heterogeneous water loss, that can influence light scattering in the leaf, etc.
Finally, our results show that ESs-induced changes in the leaf water content can be measured with using of reflectance measuring systems with broadband spectral resolution. It cannot be excluded that the standard digital camera can be used for the remote sensing of ESs-induced changes in physiological processes; however, this problem requires future investigations.
Funding Statement
The investigation of changes in water index and broad band reflectance indices was supported by the Russian Science Foundation, grant number 17-76-20032. The investigation of electrical signals and photosynthetic response was supported by the Russian Foundation for Basic Research, grant number 18-34-00637 mol_a.
Acknowledgments
The investigation of changes in water index and broadband reflectance indices was supported by the Russian Science Foundation, grant number 17-76-20032. The investigation of ESs and photosynthetic response was supported by the Russian Foundation for Basic Research, Project 18-34-00637 mol_a.
Disclosure of Potential Conflicts of Interest
No potential conflicts of interest were disclosed.
References
- 1.Hilleary R, Gilroy S.. Systemic signaling in response to wounding and pathogens. Curr Opin Plant Biol. 2018;43:1–12. doi: 10.1016/j.pbi.2017.12.009. [DOI] [PubMed] [Google Scholar]
- 2.Fromm J, Lautner S. Electrical signals and their physiological significance in plants. Plant Cell Environ. 2007;30:249–257. doi: 10.1111/j.1365-3040.2006.01614.x. [DOI] [PubMed] [Google Scholar]
- 3.Sukhov V. Electrical signals as mechanism of photosynthesis regulation in plants. Photosynth Res. 2016;130:373–387. doi: 10.1007/s11120-016-0270-x. [DOI] [PubMed] [Google Scholar]
- 4.Sukhov V, Sukhova E, Vodeneev V. Long-distance electrical signals as a link between the local action of stressors and the systemic physiological responses in higher plants. Progr Biophys Mol Biol. 2019;146:63–84. doi: 10.1016/j.pbiomolbio.2018.11.009. [DOI] [PubMed] [Google Scholar]
- 5.Beilby MJ. Action potential in charophytes. Int Rev Cyt. 2007;257:43–82. [DOI] [PubMed] [Google Scholar]
- 6.Mancuso S. Hydraulic and electrical transmission of wound-induced signals in Vitis vinifera. Aust J Plant Physiol. 1999;26:55–61. [Google Scholar]
- 7.Trebacz K, Dziubinska H, Krol E. Electrical signals in longdistance communication in plants. In: Baluska F, Mancuso S, Volkmann D, editors. Communication in plants. Neuronal aspects of plant life. Berlin, Germany: Springer; 2006. p. 277–290. [Google Scholar]
- 8.Vodeneev V, Akinchits E, Sukhov V. Variation potential in higher plants: mechanisms of generation and propagation. Plant Sign Behav. 2015;10:e1057365. doi: 10.1080/15592324.2015.1057365. [DOI] [PMC free article] [PubMed] [Google Scholar]
- 9.Zimmermann MR, Mithöfer A, Will T, Felle HH, Furch AC. Herbivore-triggered electrophysiological reactions: candidates for systemic signals in higher plants and the challenge of their identification. Plant Physiol. 2016;170:2407–2419. doi: 10.1104/pp.15.01736. [DOI] [PMC free article] [PubMed] [Google Scholar]
- 10.Sukhova E, Akinchits E, Sukhov V. Mathematical models of electrical activity in plants. J Membr Biol. 2017;250:407–423. doi: 10.1007/s00232-017-9969-7. [DOI] [PubMed] [Google Scholar]
- 11.Wildon DC, Thain JF, Minchin PEH, Gubb IR, Reilly AJ, Skipper YD, Doherty HM, O’Donnell PJ, Bowles D. Electrical signalling and systemic proteinase inhibitor induction in the wounded plant. Nature. 1992;360:62–65. doi: 10.1038/360062a0. [DOI] [Google Scholar]
- 12.Mousavi SA, Chauvin A, Pascaud F, Kellenberger S, Farmer EE. GLUTAMATE RECEPTOR-LIKE genes mediate leaf-to-leaf wound signalling. Nature. 2013;500:422–426. doi: 10.1038/nature12478. [DOI] [PubMed] [Google Scholar]
- 13.Hlaváčková V, Krchňák P, Nauš J, Novák O, Špundová M, Strnad M. Electrical and chemical signals involved in short-term systemic photosynthetic responses of tobacco plants to local burning. Planta. 2006;225:235–244. doi: 10.1007/s00425-006-0325-x. [DOI] [PubMed] [Google Scholar]
- 14.Krausko M, Perutka Z, Šebela M, Šamajová O, Šamaj J, Novák O, Pavlovič A. The role of electrical and jasmonate signalling in the recognition of captured prey in the carnivorous sundew plant Drosera capensis. New Phytol. 2017;213:1818–1835. doi: 10.1111/nph.2017.213.issue-4. [DOI] [PubMed] [Google Scholar]
- 15.Pavlovič A, Slováková L, Pandolfi C, Mancuso S. On the mechanism underlying photosynthetic limitation upon trigger hair irritation in the carnivorous plant Venus flytrap (Dionaea muscipula Ellis). J Exp Bot. 2011;62:1991–2000. doi: 10.1093/jxb/erq404. [DOI] [PMC free article] [PubMed] [Google Scholar]
- 16.Sukhov V, Sherstneva O, Surova L, Katicheva L, Vodeneev V. Proton cellular influx as a probable mechanism of variation potential influence on photosynthesis in pea. Plant Cell Environ. 2014;37:2532–2541. doi: 10.1111/pce.2014.37.issue-11. [DOI] [PubMed] [Google Scholar]
- 17.Białasek M, Górecka M, Mittler R, Karpiński S. Evidence for the involvement of electrical, calcium and ROS signaling in the systemic regulation of non-photochemical quenching and photosynthesis. Plant Cell Physiol. 2017;58:207–215. doi: 10.1093/pcp/pcw232. [DOI] [PMC free article] [PubMed] [Google Scholar]
- 18.Sukhova E, Mudrilov M, Vodeneev V, Sukhov V. Influence of the variation potential on photosynthetic flows of light energy and electrons in pea. Photosynth Res. 2018;136:215–228. doi: 10.1007/s11120-017-0460-1. [DOI] [PubMed] [Google Scholar]
- 19.Kaiser H, Grams TE. Rapid hydropassive opening and subsequent active stomatal closure follow heat-induced electrical signals in Mimosa pudica. J Exp Bot. 2006;57:2087–2092. doi: 10.1093/jxb/erj165. [DOI] [PubMed] [Google Scholar]
- 20.Sukhov V, Surova L, Sherstneva O, Bushueva A, Vodeneev V. Variation potential induces decreased PSI damage and increased PSII damage under high external temperatures in pea. Funct Plant Biol. 2015;42:727–736. doi: 10.1071/FP15052. [DOI] [PubMed] [Google Scholar]
- 21.Yudina LM, Sherstneva ON, Mysyagin SA, Vodeneev VA, Sukhov VS. Impact of local damage on transpiration of pea leaves at various air humidity. Russ J Plant Physiol. 2019;66:87–94. doi: 10.1134/S1021443719010163. [DOI] [Google Scholar]
- 22.Filek M, Kościelniak J. The effect of wounding the roots by high temperature on the respiration rate of the shoot and propagation of electric signal in horse bean seedlings (Vicia faba L. minor). Plant Sci. 1997;123:39–46. doi: 10.1016/S0168-9452(96)04567-0. [DOI] [Google Scholar]
- 23.Furch AC, Zimmermann MR, Will T, Hafke JB, van Bel AJ. Remote-controlled stop of phloem mass flow by biphasic occlusion in Cucurbita maxima. J Exp Bot. 2010;61:3697–3708. doi: 10.1093/jxb/erq181. [DOI] [PMC free article] [PubMed] [Google Scholar]
- 24.Surova L, Sherstneva O, Vodeneev V, Katicheva L, Semina M, Sukhov V. Variation potential-induced photosynthetic and respiratory changes increase ATP content in pea leaves. J Plant Physiol. 2016;202:57–64. doi: 10.1016/j.jplph.2016.05.024. [DOI] [PubMed] [Google Scholar]
- 25.Sukhov V, Surova L, Sherstneva O, Vodeneev V. Influence of variation potential on resistance of the photosynthetic machinery to heating in pea. Physiol Plant. 2014;152:773–783. doi: 10.1111/ppl.2014.152.issue-4. [DOI] [PubMed] [Google Scholar]
- 26.Surova L, Sherstneva O, Vodeneev V, Sukhov V. Variation potential propagation decreases heat-related damage of pea photosystem I by 2 different pathways. Plant Sign Behav. 2016;11:e1145334. doi: 10.1080/15592324.2016.1145334. [DOI] [PMC free article] [PubMed] [Google Scholar]
- 27.Sukhov V, Gaspirovich V, Mysyagin S, Vodeneev V. High-temperature tolerance of photosynthesis can be linked to local electrical responses in leaves of pea. Front Physiol. 2017;8:763. doi: 10.3389/fphys.2017.00763. [DOI] [PMC free article] [PubMed] [Google Scholar]
- 28.Chatterjee SK, Ghosh S, Das S, Manzella V, Vitaletti A, Masi E, Santopolo L, Mancuso S, Maharatna K. Forward and inverse modelling approaches for prediction of light stimulus from electrophysiological response in plants. Measurement. 2014;53:101–116. doi: 10.1016/j.measurement.2014.03.040. [DOI] [Google Scholar]
- 29.Chatterjee SK, Das S, Maharatna K, Masi E, Santopolo L, Mancuso S, Vitaletti A. Exploring strategies for classification of external stimuli using statistical features of the plant electrical response. J R Soc Interface. 2015;12:20141225. doi: 10.1098/rsif.2014.1225. [DOI] [PMC free article] [PubMed] [Google Scholar]
- 30.Chen Y, Zhao DJ, Wang ZY, Wang ZY, Tang GL, Huang L. Plant electrical signal classification based on waveform similarity. Algorithms. 2016;9:70. doi: 10.3390/a9040070. [DOI] [Google Scholar]
- 31.Chatterjee SK, Malik O, Gupta S. Chemical sensing employing plant electrical signal response-classification of stimuli using curve fitting coefficients as features. Biosensors. 2018;8:E83. doi: 10.3390/bios8030083. [DOI] [PMC free article] [PubMed] [Google Scholar]
- 32.Pereira DN, Papa JP, Saraiva GFR, Souza GM. Automatic classification of plant electrophysiological responses to environmental stimuli using machine learning and interval arithmetic. Comput Electron Agric. 2018;145:35–42. doi: 10.1016/j.compag.2017.12.024. [DOI] [Google Scholar]
- 33.Mudrilov M, Katicheva L, Ladeynova M, Balalaeva I, Sukhov V, Vodeneev V. Automatic determination of the parameters of electrical signals and functional responses of plants using the wavelet transformation method. Agriculture. 2020;10:7. doi: 10.3390/agriculture10010007. [DOI] [Google Scholar]
- 34.Souza GM, Ferreira AS, Saraiva GF, Toledo GR. Plant “electrome” can be pushed toward a self-organized critical state by external cues: evidences from a study with soybean seedlings subject to different environmental conditions. Plant Sign Behav. 2017;12:e1290040. doi: 10.1080/15592324.2017.1290040. [DOI] [PMC free article] [PubMed] [Google Scholar]
- 35.de Toledo GRA, Parise AG, Simmi FZ, Costa AVL, Senko LGS, Debono M-W, Souza GM. Plant electrome: the electrical dimension of plant life. Theor Exp Plant Physiol. 2019;31:21–46. doi: 10.1007/s40626-019-00145-x. [DOI] [Google Scholar]
- 36.Gamon JA, Peñuelas J, Field CB. A narrow-waveband spectral index that tracks diurnal changes in photosynthetic efficiency. Remote Sens Environ. 1992;41:35–44. doi: 10.1016/0034-4257(92)90059-S. [DOI] [Google Scholar]
- 37.Garbulsky MF, Peñuelas J, Gamon J, Inoue Y, Filella I. The photochemical reflectance index (PRI) and the remote sensing of leaf, canopy and ecosystem radiation use efficiencies. A Review and Meta-analysis. Remote Sens Environ. 2011;115:281–297. doi: 10.1016/j.rse.2010.08.023. [DOI] [Google Scholar]
- 38.Zhang C, Filella I, Garbulsky MF, Peñuelas J. Affecting factors and recent improvements of the photochemical reflectance index (PRI) for remotely sensing foliar, canopy and ecosystemic radiation-use efficiencies. Remote Sens. 2016;8:677. doi: 10.3390/rs8090677. [DOI] [Google Scholar]
- 39.Sukhova E, Sukhov V. Connection of the photochemical reflectance index (PRI) with the photosystem II quantum yield and nonphotochemical quenching can be dependent on variations of photosynthetic parameters among investigated plants: A meta-analysis. Remote Sens. 2018;10:771. doi: 10.3390/rs10050771. [DOI] [Google Scholar]
- 40.Sukhova E, Sukhov V. Analysis of light-induced changes in the photochemical reflectance index (PRI) in leaves of pea, wheat, and pumpkin using pulses of green-yellow measuring light. Remote Sens. 2019;11:810. doi: 10.3390/rs11070810. [DOI] [Google Scholar]
- 41.Sukhov V, Sukhova E, Gromova E, Surova L, Nerush V, Vodeneev V. The electrical signal-induced systemic photosynthetic response is accompanied by changes in the photochemical reflectance index in pea. Funct Plant Biol. 2018;46:328–338. doi: 10.1071/FP18224. [DOI] [PubMed] [Google Scholar]
- 42.Sukhova E, Yudina L, Akinchits E, Vodeneev V, Sukhov V. Influence of electrical signals on pea leaf reflectance in the 400-800 nm range. Plant Sign Behav. 2019;14:E1610301. doi: 10.1080/15592324.2019.1610301. [DOI] [PMC free article] [PubMed] [Google Scholar]
- 43.Maxwell K, Johnson GN. Chlorophyll fluorescence – a practical guide. J Exp Bot. 2000;51:659–668. doi: 10.1093/jexbot/51.345.659. [DOI] [PubMed] [Google Scholar]
- 44.Kalaji HM, Schansker G, Ladle RJ, Goltsev V, Bosa K, Allakhverdiev SI, Brestic M, Bussotti F, Calatayud A, Dąbrowski P, et al. Frequently asked questions about in vivo chlorophyll fluorescence: practical issues. Photosynth Res. 2014;122:121–158. [DOI] [PMC free article] [PubMed] [Google Scholar]
- 45.Porcar-Castell A, Tyystjärvi E, Atherton J, van der Tol C, Flexas J, Pfündel EE, Moreno J, Frankenberg C, Berry JA. Linking chlorophyll a fluorescence to photosynthesis for remote sensing applications: mechanisms and challenges. J Exp Bot. 2014;65:4065–4095. doi: 10.1093/jxb/eru191. [DOI] [PubMed] [Google Scholar]
- 46.Yudina L, Sukhova E, Gromova E, Nerush V, Vodeneev V, Sukhov V. A light-induced decrease in the photochemical reflectance index (PRI) can be used to estimate the energy-dependent component of non-photochemical quenching under heat stress and soil drought in pea, wheat, and pumpkin. Photosynth Res. 2020. [online early] doi: 10.1007/s11120-020-00718-x [DOI] [PubMed] [Google Scholar]
- 47.Rouse JW, Haas RH, Schell JA, Deering DW, Harlan JC. Monitoring the vernal advancement and retrogradation (green wave effect) of natural vegetation. Type III final rep. United States. NASA/GSFC, Greenbelt (MD); 1974. [Google Scholar]
- 48.Gao BC. NDWI – a normalized difference water index for remote sensing of vegetation liquid water from space. Remote Sens Environ. 1996;158:257–266. doi: 10.1016/S0034-4257(96)00067-3. [DOI] [Google Scholar]
- 49.Peñuelas J, Piñol J, Ogaya R, Filella I. Estimation of plant water concentration by the reflectance Water Index WI (R900/R970). Int J Remote Sens. 1997;18:2869–2875. doi: 10.1080/014311697217396. [DOI] [Google Scholar]
- 50.Sukhov V, Surova L, Morozova E, Sherstneva O, Vodeneev V. Changes in H+-ATP synthase activity, proton electrochemical gradient, and pH in pea chloroplast can be connected with variation potential. Front Plant Sci. 2016;7:1092. doi: 10.3389/fpls.2016.01092. [DOI] [PMC free article] [PubMed] [Google Scholar]
- 51.Ruban AV. Evolution under the sun: optimizing light harvesting in photosynthesis. J Exp Bot. 2015;66:7–23. doi: 10.1093/jxb/eru400. [DOI] [PubMed] [Google Scholar]
- 52.Vuralhan-Eckert J, Lautner S, Fromm J. Effect of simultaneously induced environmental stimuli on electrical signalling and gas exchange in maize plants. J Plant Physiol. 2018;223:32–36. doi: 10.1016/j.jplph.2018.02.003. [DOI] [PubMed] [Google Scholar]


