Highlights
-
•
Filtration of COVID-19 + airborne carrier, simulated by ambient aerosols 100 nm.
-
•
Ambient aerosol - Irregular shape, aerosol interactions, different properties.
-
•
Added electrostatic efficiency 100% – 180%X mechanical efficiency for aerosol >80 nm.
-
•
6-layer stack-up charged nanofibers 525 nm fiber diameter, max electrostatic capture, reduce △p.
-
•
50, 100, 300 nm. Ambient aerosol:88%, 88% 96%; NaCl aerosol:92%, 94%, 98%(N98) efficiency.
-
•
△P 2.65 mm water, 1/10 ≪ N95 respirator 25–35 mm water≪ N98, Quality Factor = 0.1 – 0.13/Pa.
Keywords: Novel coronavirus, COVID-19, Nano-aerosol, Electrostatically charged PVDF nanofiber filter, Multimodule/multilayer, Facemask/Respirator
Abstract
The novel coronavirus (COVID-19), average size 100 nm, can be aerosolized by cough, sneeze, speech and breath of infected persons. The airborne carrier for the COVID-19 can be tiny droplets and particulates from infected person, fine suspended mists (humidity) in air, or ambient aerosols in air. To-date, unfortunately there are no test standards for nano-aerosols (≤100 nm). A goal in our study is to develop air filters (e.g. respirator, facemask, ventilator, medical breathing filter/system) with 90% capture on 100-nm airborne COVID-19 with pressure drop of less than 30 Pa (3.1 mm water). There are two challenges. First, this airborne bio-nanoaerosol (combined virus and carrier) is amorphous unlike cubic NaCl crystals. Second, unlike standard laboratory tests on NaCl and test oil (DOP) droplets, these polydispersed aerosols all challenge the filter simultaneously and they are of different sizes and can interact among themselves complicating the filtration process. For the first time, we have studied these two effects using ambient aerosols (simulating the bio-nanoaerosols of coronavirus plus carrier of different shapes and sizes) to challenge electrostatically charged multilayer/multimodule nanofiber filters. This problem is fundamentally complicated due to mechanical and electrostatic interactions among aerosols of different sizes with induced charges of different magnitudes.
The test filters were arranged in 2, 4, and 6 multiple-modules stack-up with each module having 0.765 g/m2 of charged PVDF nanofibers (mean diameter 525 ± 191 nm). This configuration minimized electrical interference among neighboring charged nanofibers and reduced flow resistance in the filter. For ambient aerosol size>80 nm (applicable to the smallest COVID-19), the electrostatic effect contributes 100–180% more efficiency to the existing mechanical efficiency (due to diffusion and interception) depending on the number of modules in the filter. By stacking-up modules to increase fiber basis weight in the filter, a 6-layer charged nanofiber filter achieved 88%, 88% and 96% filtration efficiency for, respectively, 55-nm, 100-nm and 300-nm ambient aerosol. This is very close to attaining our set goal of 90%-efficiency on the 100-nm ambient aerosol. The pressure drop for the 6-layer nanofiber filter was only 26 Pa (2.65 mm water column) which was below our limit of 30 Pa (3.1 mm water). For the test multi-module filters, a high ‘quality factor’ (efficiency-to-pressure-drop ratio) of about 0.1 to 0.13 Pa−1 can be consistently maintained, which was far better than conventional filters.
Using the same PVDF 6-layer charged nanofiber filter, laboratory tests results using monodispersed NaCl aerosols of 50, 100, and 300 nm yielded filtration efficiency, respectively, 92%, 94% and 98% (qualified for 'N98 standard') with same pressure drop of 26 Pa. The 2–6% discrepancy in efficiency for the NaCl aerosols was primarily attributed to the absence of interaction among aerosols of different sizes using monodispersed NaCl aerosols in the laboratory. This discrepancy can be further reduced with increasing number of modules in the filter and for larger 300-nm aerosol. The 6-layer charged nanofiber filter was qualified as a 'N98 respirator' (98% capture efficiency for 300-nm NaCl aerosols) but with pressure drop of only 2.65-mm water which was 1/10 below conventional N95 with 25-mm (exhaling) to 35-mm (inhaling) water column! The 6-layer charged PVDF nanofiber filter provides good personal protection against airborne COVID-19 virus and nano-aerosols from pollution based on the N98 standard, yet it is at least 10X more breathable than a conventional N95 respirator.
1. Introduction
Recent pandemic of the novel coronavirus (COVID-19) has caused an unprecedent concern in personal protection, facemask, respirator, and ventilator, for adequate protection against the airborne virus. Within four months since the outbreak in mid-December 2019, over 2.7 million people got infected across 210 countries around the globe and over 180,000 people died. These staggering numbers continue to rise exponentially and far exceed the SARS coronavirus outbreak in 2003 in which there were 8,098 reported cases with 774 deaths within the 8-month infection period.
The size of COVID-19 virus is 60–140 nm with nanospikes coated on its spherical viral capsid/envelop with heights of 9–12 nm [1]. COVID-19 belongs to the coronavirus family for which their family members, SARS and MERS, are also well known. SARS virus has a size of about 81 ± 11 nm [2], [3] with the virus capsid wrapped by at least 15 spikes [2]. MERS virus has a spherical shape with size of 118–136 nm and has spikes 16–21 nm on its surface [4]. Under scanning electron microscope (SEM), the spikes of the virus appear as a corona wrapping around the virus [1] for which the coronavirus was given the name. The virus spikes (largely protein) are used for anchoring to its carrier and host cells. Some viruses, such as the coronavirus, have more prominent spikes than others. The familiar Influenza virus, which affects many and lead to numerous deaths during the flu season, has majority size of about 120 nm [5] and it too has spikes, which are less conspicuous. One of the influenzas, Influenza A has a size of 100 nm [6]. All these viruses can be aerosolized as they can be attached to fine aerosols (solid particle or droplet) from infected person, but the coronavirus is better equipped with prominent spikes for better anchorage to their carriers during transport as well as their host cells. Once airborne, there is possibility that they can be transferred to ambient aerosols during their flight as well. The smaller the aerosol that the virus is attached to, the longer that the combined aerosol (virus and carrier aerosol) is suspended in air or airborne, the longer distance for which the virus can spread. Similar phenomenon can be found in air pollution in that the finer the particulates, the longer they are suspended in air, and further they can travel.
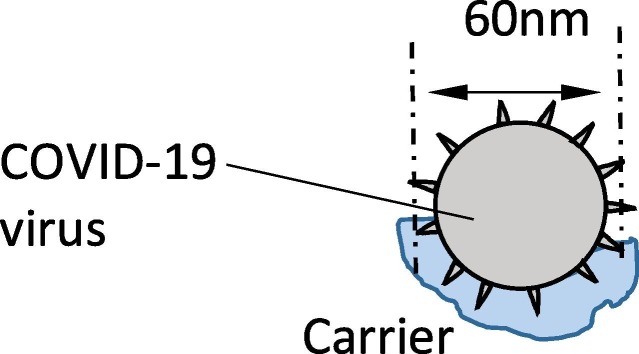
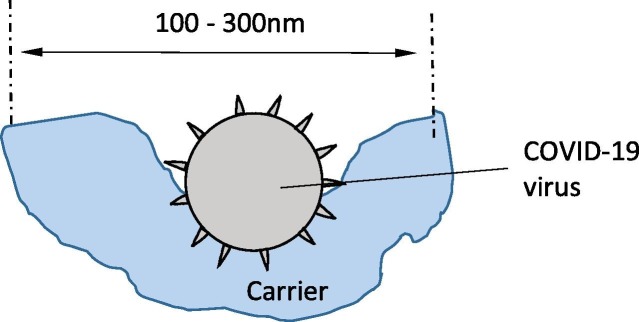
For COVID-19 virus, the minimum size [1] is about 60 nm. When attached to a smaller carrier aerosol, the combined size is still about 60 nm, see Schematic 1a , but it can also be attached to a larger carrier aerosol with combined size of say 100 nm or larger, Schematic 1b . There is test standard from National Institute for Occupational Safety and Health (NIOSH) for 300 nm for N95 (95% efficiency on capture of 300 nm) or N99 (99% efficiency on capture of 300 nm), but there are no test standards on aerosol less than 300 nm. 300 nm corresponds to the typical size of aerosol for which the filtration efficiency for common filters made of nonwoven microfibers is the lowest (i.e. maximum penetration of aerosol through the filter) due to poor mechanical mechanisms (diffusion and interception). This size is known as the most penetrating particle size (MPPS). For filters using fiber diameter different from microfibers with 2–15 µm fiber diameter, MPPS with the minimum efficiency or most penetration size may not correspond to 300 nm.
Schematic 1a.
Coronavirus attached to a carrier of similar size or smaller and become airborne. The resulting aerosol is 60 nm.
Schematic 1b.
Coronavirus (60–140 nm) attached to a carrier of larger size and become airborne. The resulting aerosol may be 100–300 nm.
The carrier aerosol can be fine particles, fine droplets, finer mists (ambient humidity), and even ambient aerosols, they need not be spherical. For ambient aerosol from pollution emission, they are not spherical either and can be fractal or irregular shape depending on its original shape and agglomeration [7]. There is very little study on adopting ambient aerosol for filtration testing as most test aerosols are generated in the laboratory using NaCl aerosols, organic oil droplets, or DOP. These aerosols have structural shape, approximately cubic or spherical.
Ambient aerosols have a wide range of sizes from emission of diesel and gasoline vehicles with virgin size, typically 10–100 nm. These particles collide and agglomerate in size to larger aerosols. However, the shear force generating from by-passing vehicles breaks down the agglomerates reducing them to smaller size. As such, there is an equilibrium size distribution due to balance of agglomeration and attrition on aerosol size. The median size of this distribution has been found to be about 80 nm in heavy traffic area [8]. In addition, another contribution to ambient aerosol is from photochemical reaction of gases in the atmosphere, generating fine aerosols 20–50 nm. Close to the ocean, water vapor under high humidity can condense under high relative humidity back to fine water droplets/mists that can be ultrafine with size below 100 nm. As can be seen, these are all nano-aerosol with size less than 100 nm. Therefore, ambient air can have aerosols – below 100 nm and of course larger aerosols. They are irregular shape, with some composition of fine water droplets, especially in locations near the open water. Given ambient aerosols have both high concentration of nano-aerosols (less than100 nm) and larger aerosols (>100 nm), they are good candidates in filter testing for use to simulate the combined aerosol, i.e. coronavirus with carrier aerosol. The drawback is that ambient aerosols may change over time and does not provide a stable source of aerosols. When tests are carried out within a short period, and the filtration efficiency is based on the ratio of the filter upstream and downstream aerosol concentrations, it should not be affect significantly. Using ambient aerosols for filter testing would be satisfactory once these limitations are well observed. However, we need to pay heed to the fact that the concentration of the challenging aerosol should not be too low, which might affect the accuracy of the result.
Non-woven materials have been a reliable material for producing synthetic fibers with different diameters and morphology for air filtration. Microfibers from melt-blown process can generate microfibers with diameter 2 to 15 μm [9]. They are commonly used as non-woven filter media. Nanofibers, 200–600 nm, produced from electrospinning [10] offer a better filter media for filtration of small aerosols, especially for nano-aerosols by diffusion and interception [11].
Filters made of polyvinyl alcohol (PVA) nanofibers have been used to filter ambient aerosols [8], the filter relies heavily on mechanical diffusion as most aerosols are nano-aerosols. The filtration efficiency for capturing the 100-nm nano-aerosol was 70.6% at face velocity of 5.5 cm/s [8]. It would be most desirable if the efficiency can be further improved, for example, using charged polyvinylidene fluoride (PVDF) nanofibers. Stable charged PVDF nanofiber filter has been developed based on tests on NaCl aerosols [12]. There is no evidence that the charged nanofiber filter would work on ambient aerosols, which are fractal shape and irregular, and with different physical (including electrical) properties.
In this study, we will develop charged nanofiber for capturing ambient aerosol, which is used to simulate the combined aerosol due to COVID-19 virus being attached to airborne carrier. We will examine aerosol with size 20–300 nm with focus on 100 nm which simulates the representative combined aerosol (virus and carrier). We will also examine the 55 nm ambient aerosol, which simulates the smallest combined aerosol as the smallest virus is 60 nm and assuming the worst case that it is attached to a carrier not far bigger than its size. We will also examine the 300 nm aerosol (greater than nano-aerosol) as test standard is being set exclusively on this aerosol size by NIOSH. Electrostatic charged PVDF nanofibers [6] will be optimized to develop a filter such that the efficiency for the 100 nm (nano-aerosol) simulating COVID-19 (and other viruses and pollutants) will reach closely 90% and the pressure drop of the filter should not exceed 30 Pa (3.06 mm water column). In the module/layer, nanofibers in the module/layer will be electrostatically charged and small amounts of nanofibers will be used to reduce fiber packing together with insulator barriers to minimize electrostatic interference among fibers. The filter will be arranged in stack-up form of multiple modules or multiple layers [13] to increase the fiber basis weight such that it reaches the efficiency target. The filters with various amounts of stack-up, 2, 3, 4 etc. layers will be compared to the ideal scenario with constant quality factor, QF, which measures constant benefit-to-cost ratio. Electrostatic charged fibers and arrangement of charged fibers in multiple modules/layers are the two technology backbones to raise the performance of the filter for filtering the simulated coronavirus with a carrier. There are some specific issues to be addressed in this study:
-
1.
Very few literatures address filtrating of irregular shape ambient aerosols, and it is the objective of the present study to use ambient aerosols to represent the airborne virus with the carrier as ambient aerosols are present in high concentration in the surroundings and they can potentially be the carrier of viruses. Unlike NaCl crystals and DOP, can ambient aerosols with different physical properties and irregular shape be effectively electrostatically charged before capture (i.e. dielectrophoresis)?
-
2.
In laboratory testing, only one aerosol size (i.e. monodispersed) is used to challenge the filter at a given time, there is no interaction of different aerosol sizes challenging the filter. For ambient aerosol all sizes of aerosols challenge the filter at the same time. There may be complicated interactions of the charged aerosols of different sizes prior to their capture by the charged fiber despite this may take place at close distance to the charged fiber.
-
3.
Smaller aerosols will have smaller induced dipoles which lead to lower capture in comparison to the larger aerosols. What aerosol size range does the electrostatic force act most effectively?
-
4.
Typically, the efficiency for charged microfiber filter increases monotonically with increasing aerosol size. The efficiency versus aerosol size curve does not exhibit a U-shape characteristic. This is because the electrostatic capture dominates over the mechanical capture by diffusion and interception with large diameter fiber (>1 µm). It would be interesting to see if nanofiber filter with diameter only a fraction of a micrometer also has similar characteristics. Because the diffusion capture mechanism is much stronger for the nanofibers as compared to the conventional microfibers, the efficiency characteristics with aerosol size might be different.
-
5.
When the basis weight is increased in a filter, the increased in pressure usually is much more than the increase in efficiency. This is especially with high efficiency filter. It would be interesting to investigate whether the multimodule/multilayering approach can maintain a constant ratio of benefit-to-cost, i.e. constant QF (to be defined later).
-
6.
What would be the configuration of the multilayer filter to achieve 90% capture for the 100 nm, 60 nm and even 300 nm aerosols (simulating various possible sizes of the COVID-19 with carrier) with pressure drop not to exceed 30 Pa (3.1 mm water)?
All the above issues will be addressed in our current study.
2. Test setup
2.1. Electrospinning
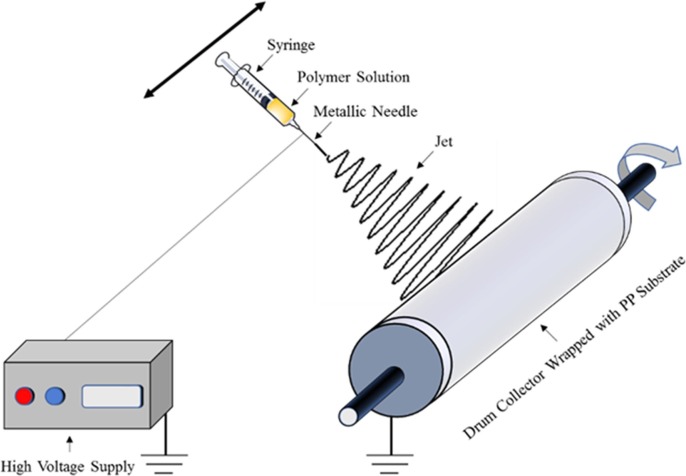
PVDF with molecular weight 530,000 pellets was dissolved in solvent mixture of dimethylformamide and acetone solvent for 24 h under 70 °C. The typical ingredient for the precursor solution was 20% g of PVDF solute in 100 mL of solution (20 %w/v). The well-mixed precursor solution was fed to a syringe connected to a high voltage supply of 20,000 V. The ground collector was placed at 15 cm from the syringe tip. A control amount of PVDF solution (0.9 mL/h) was delivered by the syringe using the syringe pump to establish a droplet at the syringe tip. Under the strong electrostatic field, the droplet took on the shape of a Taylor cone. Once the electrostatic force acting on the cone-shape droplet has overcome the surface tension force acting on the droplet, a jet was sent out through the cone-shape droplet towards the collector. During free flight, the jet continued to thin out in diameter as the solvent was continuously being evaporated and the ‘positive’ electrical charges deposited along the jet repelled against each other thereby further stretching out the fiber jet and reducing the fiber diameter. By the time when the fiber jet landed onto the substrate laid over the collector surface, the fiber reduced in diameter corresponding to a nanofiber (≪1μm). To get a uniform nanofiber mat, a rotating drum collector was used with rotation speed of 10 rev/min. The humidity during electrospinning was maintained at 40 ± 2% to control the evaporation rate. The electrospinning process is depicted in Fig. 1a . The nanofiber mat was dried in an oven overnight at 40 °C for curing to allow residual solvent to be evaporated.
Fig. 1a.
Electrospinning nanofibers using a syringe connected to a high voltage supply.
First, the basic module or basic layer with 0.765 g/m2 (gsm) for the multi-module/multi-layer was prepared and increasing basis weight was achieved by stacking multiple number of the basic layer in 2, 3, 4, and 6 etc. to achieve 1.53, 2.295, 3.06, and 4.59 gsm, respectively. To get the same basis weight in a single layer, the time for electrospinning was adjusted accordingly.
2.2. Charging
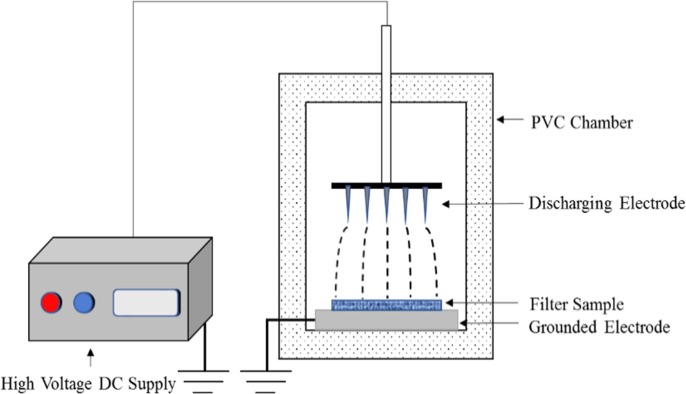
A 10x10 cm2 mat was prepared for corona discharge. The setup is illustrated in Fig. 1b . The details of corona charging have been reported earlier [12]. A homemade 5-wire charge head was used to impart electrostatic charges to the target mat distanced, 30 mm away. The charging voltage was 15,000 V and charging time was 1 min. The condition has been optimized to impart the maximum amounts of space charges uniformly and stably onto the PVDF nanofiber mat to avoid burning the mat locally.
Fig. 1b.
Corona discharge.
2.3. Portable test setup
In our investigation, we have developed a portable filter tests rig, see Fig. 1c . There were two identical filter holders, one of which has a test filter while the other was deliberately left blank. Upstream they were taking in aerosol stream from the ambient. Downstream of the filter holders, the stream was directed to a common ball valve that can select flow from either holder to the vacuum pump with a slip stream being taken out for measuring aerosol concentration. A Portable Aerosols Mobility Spectrometer (PAMS) was used to measure the number concentration of a given stream. The size range of aerosols that can be measured was between 10 and 433 nm. When the ball valve was switched directing airflow from the blank holder, the concentration-size measurement corresponded to that of the unfiltered ambient aerosols, Cu(Dp). On the other hand, concentration of the filtered stream Cd(Dp) can be measured when the ball valve was directing the airflow downstream of the holder that has an installed filter. Thus, the filter grade efficiency η(Dp) can be inferred from the following equation,
| (1a) |
Fig. 1c.
Portable test rig for measuring unfiltered and filtered air, respectively, from the ambient.
The advantage of the test rig can be used for testing at any locations indoors or outdoors. We have selected an outdoor location which was 30 m from a busy road for which there was a stable concentration of aerosols generated from the traffic with various types of by-passing vehicles, from diesel buses (Euro 4 and 5), LPG fuelled mini-vans and taxis, to gasoline vehicles. Aerosols were also generated from the photochemical oxidation of pollutants gases (NOx and hydrocarbon gases). Also, in 20 m from the test rig, a small fountain generated water spray that became fine mist due to evaporation during hot weather when the test was carried out with temperature of 30 °C and relative humidity of 90%. The mist served as fine water droplets simulating those from the infected person as well as from the humidity in ambient. Multimodule charged and uncharged nanofiber filters with stack-up filter layers 2, 3, 4, 6 were used as the test filters. The basic module/layer has 0.765 gm−2 of PVDF nanofibers either uncharged or electrostatically charged. Tests were conducted with face velocity of 5.3 cm/s. When the flow was switched for the filter that has the test filter, there was additional pressure drop and the vacuum pump was adjusted to ensure the face velocity stayed constant at 5.3 cm/s. The flow rate was measured by a flow meter (TSI flow meter model 4100) upstream of the intake (not shown in Fig. 1c)
3. Filtration model
There were two types of fibers in the present study, uncharged and charged nanofibers.
3.1. Uncharged nanofiber in filter
The filter efficiency η can be expressed as a function of the single fiber efficiency ηs, filter thickness h, fiber packing α, and the fiber diameter df [14],
| (1b) |
The mechanical capture from uncharged fibers capture is due to interception (aerosol followed by streamline which gets intercepted by fiber) and diffusion (random walk) with respective single-fiber efficiency for interception ηR and diffusion ηD. Assuming these are independent mechanism, the total single fiber efficiency is
| (2) |
3.2. Interception
The single fiber efficiency for interception is given by [14]:
| (3) |
where the aerosol diameter to the fiber diameter Dp/df is the interception ratio.
3.3. Diffusion
The theoretical single fiber efficiency for diffusion is given by [15]
| (4) |
| (5a) |
| (5b) |
The Kuwabara hydrodynamic factor is given by
| (6) |
In Eq. (5a), we have modified y from 0.388, to be a function of Pe due to the dominant diffusion [13].
| (7) |
| (8) |
In Eq. (8), Peclet number (Pe) measures the effect of convection to diffusion. Under relatively low face velocity (e.g. under 10 cm/s) and using nanofiber filter for capturing nano-aerosols, the convective term udf is relatively small. In contrast, the diffusion coefficient D is very large, especially for nano-aerosols below 100 nm, as it is inversely related to the aerosol diameter Dp and is proportional to the Cunningham slip factor Cn which increases with small Dp.
| (9) |
where Cn is given by Rader [16],
| (10) |
where
| (11) |
λ is the mean free path for air and for STP condition, and it is approximately 65 nm. The knudsen number , Kn, measures the flow slip. Kn≪0.001 corresponds to continuum flow regime, 0.001 < Kn less than 0.25 to aerodynamic slip regime, 0.25 < Kn l< 10 to transition regime, and Kn > 10 to free molecular flow regime. It is noted that as for small sized aerosols Kn can be very large and so is Cn.
From mass balance:
| (12) |
where W is the specific fibers deposit per unit filter area, or commonly referred as the basis weight, in gsm, ρf the fiber density, α the fiber packing density, and h the filter thickness.
The pressure drop, Δp, depends on fiber diameter df, air viscosity μ, filter thickness h and fiber packing α. These are related by Davis’ equation [17], [18], [19], [20], which is assumed to hold on pressure drop across a filter with nanofibers:
| (13) |
| (14) |
when pressure drop and basis weight are known, α can be solved from Eq. (14), and h can be inferred from Eq. (12).
The filter efficiency for uncharged filter can then be calculated from Eqs. 1–14.
3.4. Charged nanofiber in filter
For charged fiber, the single fiber efficiency due to induction of dipoles followed by electrostatic attraction of opposite charge from dipole of the aerosol to the charged fiber can be approximated by [12],
| (15) |
where Z = CnDp2/u [21], [22], [23], ηo is the dielectrophoresis efficiency due to induction followed by attraction. b is less than unity and typically about 0.5 ± 0.1 and a is a constant [12].
Assuming independent capture mechanisms, the single-fiber efficiency for charged filter is simply superposition of diffusion, interception and electrostatic capture,
| (16) |
With electrostatically charged fibers, Eq. (16) replaces Eq. (2) which pertains only to mechanical capture with uncharged filter.
The equations discussed in the foregoing will be used in the next section for making comparison with test results.
4. Results and discussions
4.1. Morphology of nanofibers
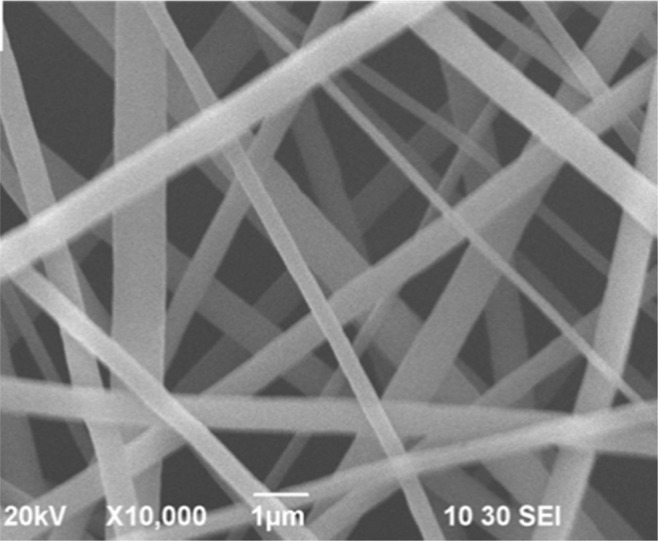
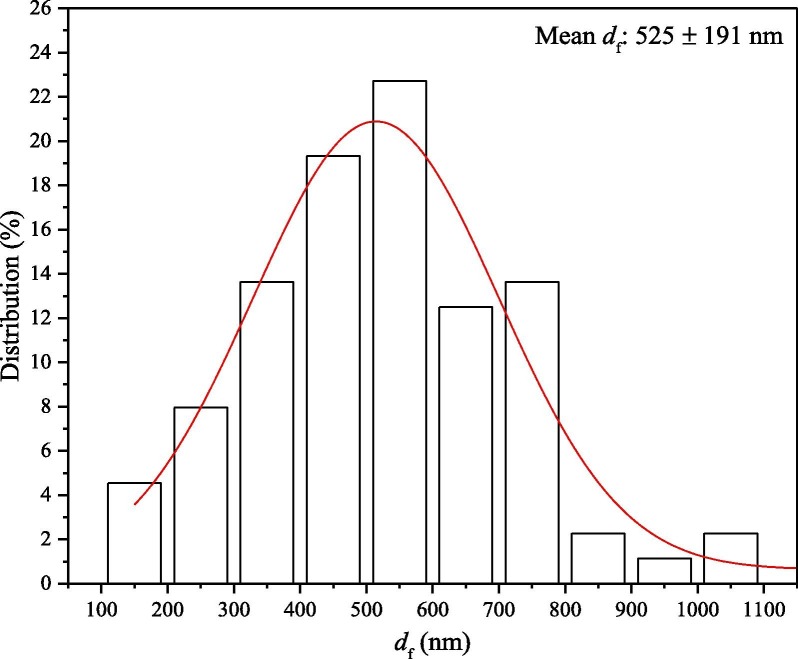
Fig. 2a shows the SEM image of the nanofiber mat being used in the test. Fig. 2b shows the fiber diameter distribution of our test sample using a count of 100 fibers from various samples. As can be seen in Fig. 2b, the mean fiber diameter is 525 ± 191 nm. About 80% of all the fibers are within the one standard deviation, i.e. between 334 nm and 716 nm. There are some smaller fibers 150 – 350 nm that can improve filtration while the larger fibers provide mechanical strength/support and low pressure drop for the filter, see Fig. 2a.
Fig. 2a.
PVDF nanofibers.
Fig. 2b.
Distribution of nanofiber diameter with mean fiber diameter 525 nm ± 191 nm.
4.2. Test aerosols
Fig. 3 shows the typical log-normal distribution on size of the ambient aerosols (expressed in aerodynamic diameter as converted from electrical mobility diameter similar to the analysis made in Ref. [8]). The median size of the measured ambient aerosols was 70 nm with size range that spanned 10 to 433 nm. The peak value was 85.86 count/cm3 at 83.81 nm and about 80% of the total particle concentration was within the range of 30–200 nm. There was a large percentage of aerosols under 100 nm falling into the category of nano-aerosols. As mentioned, COVID-19 has a size range of 60 to 140 nm with average of 100 nm, and they can be aerosolized by attaching to carrier particles (solid or fine liquid droplet) from the infected person. The bio-nanoaerosol (virus and nuclei) under airborne can be modified in size, through evaporation and re-attachment to other aerosols in air. The evaporation rate depends on the relative humidity of the environment. In cold and dry environment, the size of the fine mist/droplet can be reduced significantly by evaporation. This implies that the aerosol can become smaller in size during free flight and it can be carried farther in distance similar to that of the nano-sized pollutants from combustion emsission. In any event, the smallest aerosol is 60 nm and the aerosol size can be larger. Here, in our subsequent study we will examine the filtration efficiency of nano-aerosol, i.e. 100 nm aerosol. This also corresponds to the average size of SARS virus and influenza virus (80–120 nm), and it is slightly smaller than the measles virus (120–250 nm), which is a well-known airborne virus. In all cases, these nano-aerosol viruses can be aerosolized and become airborne when anchored to a carrier.
Fig. 3.
Typical size distribution of aerosols detected by inner condensation particle counter (CPC) of PAMS of ambient aerosols with median size at 75 nm.
4.3. Two-Layer capture
4.3.1. Uncharged 2L filter
The test efficiency from filtration using a 2-layer (2L) uncharged and charged PVDF filter is shown in Fig. 4 . The open-square symbols represent the filtration of 2L uncharged filter with 1.53gsm (2X0.765gsm) of PVDF nanofibers. Of interest is that the most penetrating particle size (MPPS), corresponding to the minimum efficiency, is about 150 nm. As can be seen, there is a distinct U-shape behavior showing diffusion capture being effective for aerosols<150 nm, while interception is effective for aerosols>150 nm. The experimental set-up was valid up to 400 nm at which incoming aerosol concentration was low and deduced efficiency became unreliable. The model for mechanical capture Eqs. (1)–(14) was used to predict performance and this was included as a dotted curve in Fig. 4 for making comparison with the test results. As seen, the comparison between experiment and theoretical prediction is reasonable. Bear in mind that, unlike laboratory testing for which only one test aerosol size is ‘allowed’ to challenge the filter at a given time, here aerosols of all sizes challenged the filter simultaneously. The interaction of aerosols of different sizes before being captured by the filter can be extremely complex. Given the reasonable agreement between experiment and prediction, we can only conclude that the theory is approximately correct despite there was mechanical interaction of aerosols of different sizes during filtration. This is also in accord with the earlier test work using PVA nanofibers for mechanical filtration [8].
Fig. 4.
Efficiency of 2L PVDF nanofiber filter versus aerosol size, 10–400 nm. Measurement of 2L PVDF filter.
4.3.2. Charged 2L filter
With charged 2L filter having the same basis weight of 1.53 gsm as the uncharged filter studied previously, the test results are shown by the solid square symbols in Fig. 4. Interestingly, a U-shape curve is also evident from the experimental data. Unlike with charged microfiber filter, for which a typical efficiency curve is monotonically increasing with increasing aerosol size, here with charged nanofiber filter, a flatter U-shape curve is clearly seen. The reason for this difference with the microfiber filter is that nanofiber filter has a very strong diffusion behavior for small aerosols unlike the case of microfiber filter where diffusion is much subdued. Charged microfiber filter replies mainly on electrostatic effect as their diffusion capture is relatively weak, while charged nanofiber filter is strong in both diffusion and electrostatic for aerosol capture. The MPPS has been shifted to 70 nm instead of the 150 nm and the efficiency at MPPS is elevated from 24% to 48% (prediction) and more like 58% (actual data). This again is courtesy of the electrostatic capture by dielectrophoresis. Using the single fiber efficiency model Eq. (15), we matched the theoretical model Eqs. 1, 3–16 with experimental data. A good match is with the parameters a = 1.0(1011) m−1s−1 and b = 0.6. Indeed, b also matches well with previous finding of 0.4 – 0.6 [12] whereas the value of a is higher. The single fiber dielectrophoresis efficiency as given by Eq. (15) with a = 1.0(1011) m-1s−1 and b = 0.6 is shown in Fig. 5 . It is a simple power law function that depends on the parameter, Z = CnDp2/u [9], [11], [12], [13]. The functional dependence on this group of variables have been verified by independent experiments [12].
Fig. 5.
Empirical relationship of Z and single-fiber efficiency due to dielectrophoretic effect.
4.4. 4L and 6L filters
Fig. 6 shows the test results using a 4L filter with each module/layer having a basis weight of 0.765gsm. The total basis weight for the filter is 3.06 gsm of nanofibers. Both the mechanical capture by diffusion and interception have been raised as compared to 2L with lower fiber basis weight. The U-shape curve for mechanical capture remains evident. The MPPS for mechanical capture is still at 150 nm. The measured efficiency between Dp = 50 and 150 nm were 10–20% higher than the prediction given by the dotted curve. This might be related to interaction of aerosols of different sizes that enhanced the capture. For the charged filter, the prediction (solid curve) is 5–8% higher than measurements for aerosol size from 10 to 100 nm, but for larger aerosols better match was obtained until 250 nm. For the 100 nm nano-aerosol, the uncharged 4L nanofiber filter yields efficiency of 60% while the charged nanofiber filter 85%. The added 25% due to electrostatic effect is quite substantial. For the 60 nm aerosol, which corresponds to the minimum size of the COVID-19, the charged 4L PVDF filter yields 80% efficiency which was only 5% lower than that at 100 nm, while the uncharged 4L filter yield 65% efficiency. Of interest is that between 20 and 400 nm, the measured efficiency is between 80 and 90% despite it still maintains a flattened U-shape behavior. It is less than the distinct U-shape as in prediction (depicted by the solid curve), nevertheless it is still present. This indicates diffusion plays a strong role for capturing the nano-aerosols less than 100 nm.
Fig. 6.
Efficiency versus aerosol size for 4L filter.
Fig. 7 compares the test results for a 6L (total 4.59 gsm) between the uncharged and charged filter. The pressure drop of the filter was 25.8 Pa. The uncharged filter exhibited again a typical U-shape with MPPS at 150 nm with efficiency of 62% efficiency. There was a rough agreement between the prediction with the measurements, which were somewhat scattered. This might be related to the mechanical interaction of aerosols of all sizes before being captured by the fiber by diffusion and interception.
Fig. 7.
Efficiency versus aerosol size for 6L filter.
On the other hand, the charged filter also has a U-shape behavior with MPPS at 75 nm at 85% efficiency. Between 10 and 30 nm, and between 120 and 400 nm, the efficiency was over 90% reaching to 100% for some smaller aerosols. Between 30 and 120 nm the efficiency was 85%-90%. As can be seen in Fig. 7, the theoretical model (solid curve) predicted accurately the measurements to within 5%.
4.5. Pressure drop
The pressure drop between single and multilayer filters are compared in Fig. 8 . In general, for the basis weight less than 2.3 gsm, there is little difference between the two as both are quite low. However, above 2.3 gsm with high filtration efficiency, the pressure drop escalates and there is increasing difference between multilayer versus single layer where all the nanofibers are incorporated into a single layer. For the latter, the porosity and permeability to airflow in the nanofiber mat are significantly cut-back, thereby increasing the pressure drop.
Fig. 8.
Pressure drop comparison between single and multilayering.
4.6. Quantifying the added electrostatic benefit
The difference in efficiency between the charged and uncharged filter in Fig. 4, Fig. 6, Fig. 7 for 2L, 4L and 6L, respectively, represents the added electrostatic efficiency from the charged fibers. The ratio of electrostatic efficiency for charged fibers to the mechanical efficiency (diffusion and interception) for uncharged fibers is shown in Fig. 9 . The formulae for the calculations are given in Appendix A. In the figure, four curves are shown corresponding to the 2L, 3L, 4L and 6L, respectively. Each curve has a rapid rise above zero for Dp less than 80 nm and increases modestly as Dp > 80 nm. For the 2L nanofiber filter, the overall efficiency is not that high, as Dp > 80 nm the added electric effect was 1.4–1.8X the mechanical efficiency due to diffusion and interception. On the other hand, for the 6L nanofiber filter where the total efficiency from charged fiber was already >85%, the efficiency from added electric effect alone was only 1.0–1.4X the mechanical efficiency. Regardless, the aerosols with size >80 nm receive the most benefit from the added electric effect while aerosol with size less than 80 nm receive lesser benefit. The 80-nm aerosol also corresponds approximately to the minimum size of the COVID-19 virus, which is 60 nm [1]. Thus, charged nanofiber filter adds another 100% to 180% equivalence of existing mechanical efficiency to the filter without incurring additional pressure drop. This enhances greatly the capture of the airborne viruses, which are in the size range > 80 nm.
Fig. 9.
Electrostatic to mechanical capture efficiency.
4.7. Achieving high efficiency with higher nanofiber basis weight by multilayering/multimodule
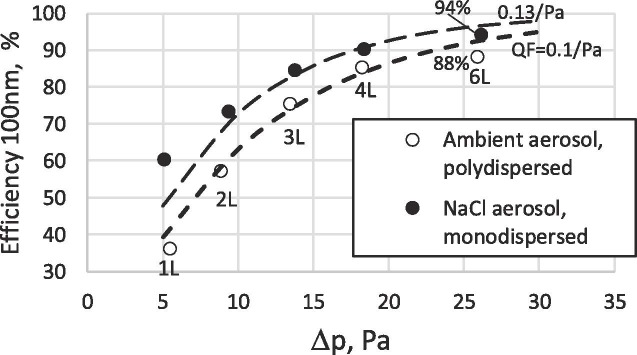
To increase the capture efficiency, the basis weight of the nanofibers in the filter needs to be increased. This can be effectively carried out using multilayering or multi-modular approach by stacking charged nanofiber layer/module with modular basis weight 0.765gsm until the efficiency reaches the target, 90% capture for 100-nm aerosol. The basis weight of a single layer (0.765gsm) was selected such that it can provide an efficiency of about 40% for the 100 nm ambient aerosol. Fig. 10 shows the 100-nm aerosol capture efficiency for the 1L(0.765gsm), 2L(1.53gsm), 3L(2.295gsm), 4L(3.06gsm), and 6L(4.59gsm) filters, respectively, plotted against pressure drop across the filter. The test results for the 100 nm (nano-aerosols) are represented by the hollow circles. As shown in Fig. 10, both efficiency (i.e. benefit) and pressure drop (i.e. costs) increase with increasing basis weight (gsm) through multilayering, i.e. by stacking-up of multiples of the single-layer filter with 0.765gsm nanofibers.
Fig. 10.
Efficiency (100 nm) and pressure drop versus increasing layers and comparing with iso-QF condition with QF = 0.1 Pa−1.
The benefit-to-cost ratio is gaged by the quality factor (QE), defined by
| (17) |
During the increase of fiber basis weight, QF often drops as the efficiency increases marginally while pressure drop increases substantially. Higher pressure drop means higher operating power to drive flow through the filter as power is the product of flow rate and pressure drop. Even for use in personal protection, it is highly desirable to maintain constant QF with higher efficiency and better protection. The relationship between efficiency for a given aerosol size capture and pressure drop associated with the filter for constant QF can be obtained by rearranging Eq. (17) as follows,
| (18) |
The curve with constant QF in a η versus Δp plot represents an iso-QF curve. In Fig. 10, the trajectory for QF = 0.1 Pa−1 is shown by the solid curve, which is essentially an exponential curve with initial linear rise followed by diminishing increase in the η along the coordinate axis with increasing Δp along the abscissa axis. Interestingly, the test results for η(100 nm) versus Δp compared very well with the iso-QF curve corresponding to QF = 0.1 Pa−1. This implies that the multilayering or multi-modular approach that have been adopted is indeed a cost-effective approach to develop a high-performance filter to capture nano-aerosols of 100 nm. This is to be contrast with conventional filter design for which QF keeps decreasing with higher fiber basis weight for achieving higher performance. With a 6L charged nanofiber filter, the efficiency reached 88% for the 100=nm nano-aerosols.
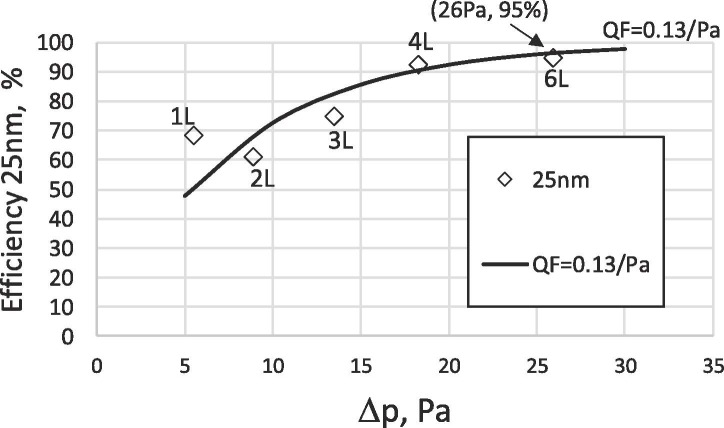
In Fig. 11a , the test result of 25-nm aerosol for different filter stack-up is compared to the curves corresponding to Iso-QF = 0.13 and 0.1 Pa−1, respectively. As can be seen, the test results with increasing fiber through multilayering is in-line with the approach of maintaining constant QF between 0.1 and 0.13 Pa−1. The improved performance is attributed to the strong diffusion mechanism as the electrostatic interaction is almost negligible. This can be seen in Fig. 9 (see data on the left side of the graph) in which the ratio of electrostatic efficiency to that of the mechanical efficiency is between 0.2 and 0.5. With 6L filter (charged/uncharged), one can achieve 95% efficiency for these tiny aerosols, which when inhaled can penetrate deep into our respiratory system causing infection. Because they are so tiny, they can further transfer to the circulatory system of our body leading to chronic diseases, such as cardiovascular diseases. Becasue of their deep penetration once entering our body, there is prelimnary evidence that the tiny COVID-19 virus is also known to infect our blood as well as our kidney and other vital organs. The filtration behavior of the smallest COVID-19 is simulated using the 55-nm ambient aerosol as will be presented next.
Fig. 11a.
Efficiency (25 nm) and pressure drop vs. increasing layers and comparing with iso-QF condition with QF = 0.13 Pa−1.
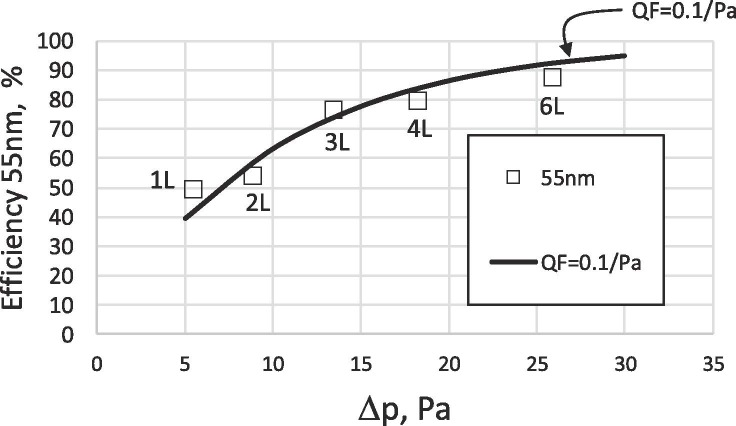
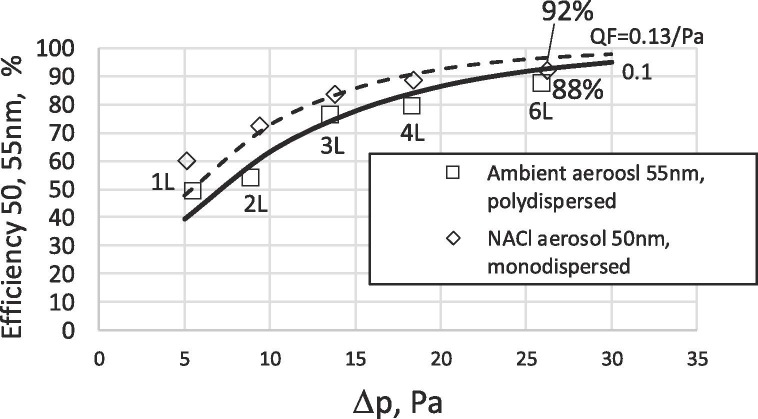
Suppose the smallest size of COVID-19, 60 nm [9], is attached to a carrier even smaller compared to the virus itself and becomes airborne. This scenario can be simulated using a 55 nm ambient aerosol. In Fig. 11b , the measured filtration efficiency on 55 nm aerosol is plotted against pressure drop for multilayered filters 2L, 3L, up to 6L. With 6L, the efficiency reaches 88% and the series of stack-up nanofiber filters follow nicely the iso-QF trajectory of 0.1 Pa−1.
Fig. 11b.
Efficiency (55 nm) and pressure drop vs. increasing layers and comparing with iso-QF condition with QF = 0.1 Pa−1.
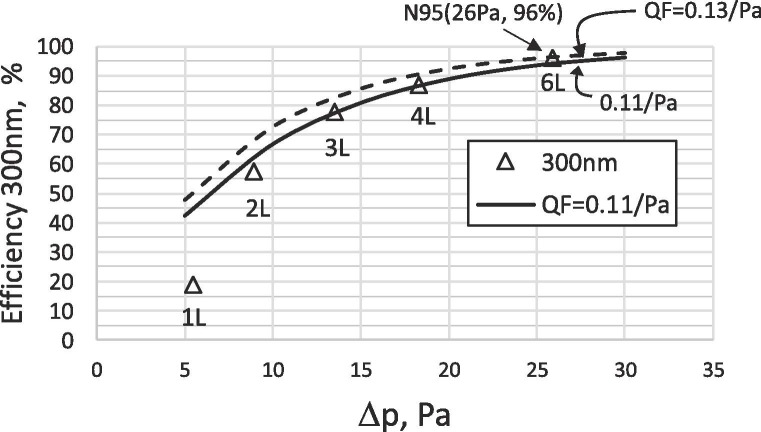
As discussed, the virus can be attached to any carrier (solid or droplet) from the respiratory track of the infected person or being transferred to other aerosols suspended in air. The size of the overall aerosol can be larger than the virus itself. Suppose the overall size of the combined aerosol is 300 nm for which the standards on N95 and N99 were being set. The efficiency for filtering this larger submicron aerosol can be determined from the tests for different multilayered filters with their respective pressure drop as depicted in Fig. 11c . Also, the iso-QE curves for 0.11 and 0.13 Pa−1 are plotted in the same graph for making comparison with the measurements. Generally, the test data (2L, 3L, 4L) follows the 0.11 Pa−1 iso-QF curve. The 1L data is an outlier because with 1 layer there is possible non-uniformity of fiber distribution in the filter that leads to significant scatter from the majority of the test data, see Fig. 10, Fig. 11a, Fig. 11b for the 1L test data. The 6L data has higher QF of 0.13 Pa−1. In fact, with 6L charged filter, both mechanical and electrostatic effects raised the filtration efficiency of ambient aerosol to 96%, which meets the 95% required for the N95 respirator. The pressure drop of 26 Pa (2.65 mm water column) is significantly lower than the conventional N95 respirator which has pressure drop of 245 Pa (25 mm water) for exhalation resistance to 343 Pa (35 mm water) for inhalation resistance.
Fig. 11c.
Efficiency (300 nm) and pressure drop vs. increasing layers and comparing with iso-QF condition with QF = 0.11 and 0.13 Pa−1.
Fig. 10, Fig. 11a, Fig. 11b, Fig. 11c, Fig. 12, Fig. 13, Fig. 14a, Fig. 14b, Fig. 14c , demonstrate an important strategy for developing high-efficiency, low pressure drop filter. This is to stagger modular filters or multilayering in which the efficiency gain with additional modules provide a constant benefit-to-cost ratio. Otherwise, we may have diminishing return for which there is little gain in efficiency, yet much higher incurred pressure drop.
Fig. 12.
Multi vs. single layer, and uncharged vs. charged on filtration efficiency of 100-nm aerosol.
Fig. 13.
Multi vs. single layer, and uncharged vs. charged on filtration efficiency of 55-nm aerosol.
Fig. 14a.
100-nm ambient aerosol with polydispersed size distribution versus 100-nm monodispersed NaCl aerosol challenging the filter both at 5.3 cm/s.
Fig. 14b.
55-nm ambient aerosol with polydispersed size distribution versus 50-nm monodispersed NaCl aerosol challenging the filter both at 5.3 cm/s.
Fig. 14c.
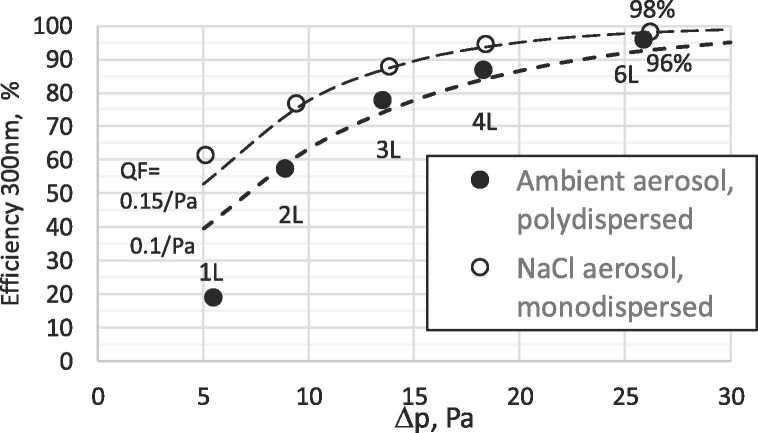
300-nm ambient aerosol with polydispersed size distribution versus 300-nm monodispersed NaCl aerosol challenging the filter both at 5.3 cm/s.
4.8. Elements for enhancing filter performance
It is prudent to review the two elements incorporated in the present study to improve the filter performance. First, the PVDF filter is electrostatically charged to improve the capture using dielectrophoresis in addition to the mechanical diffusion and interception which play the key roles for capturing nano-aerosols (≤100 nm) and larger submicron aerosols (>100 nm). Second, the nanofiber basis weight is increased by stack-up in multiples of a single layer/module until the target efficiency is reached. The permeable, electrical-insulator supports for nanofibers in the multilayer filter provide (a) shielding of electrical interference between adjacent layers of charged fibers and on the incoming aerosols, and (b) macropores to the filter easing the flow restriction from the micropores of the nanofibers. Further, the reduced fiber packing density due to use of smaller amounts of fibers in each module reduces the electrical interference and enhances the air permeability of the module.
Fig. 12 shows the efficiency for the 100 nm versus pressure drop graph. There are 4 curves:
-
a)
The bottom curve corresponds to increasing uncharged nanofibers in a single layer from 0.765gsm to 3.06gsm.
-
b)
The second curve from the bottom corresponds to using multilayering from 1L to 4L with each layer of 0.765gsm uncharged nanofibers.
-
c)
The third curve from the bottom corresponds to charged fibers all incorporated in a single layer.
-
d)
The fourth curve from the bottom corresponds to charged fiber arranged in multilayering, 2L to 6L.
These 4 curves can be used to quantify the effects of uncharged versus charged fibers, and single versus multiple layers. In Fig. 12, uncharged single layer to charged single layer, is represented by the difference between curve (a) and curve (c) with 20+% efficiency differential and ΔQF = 0.03 Pa−1. Single charged layer to multiple charged layers with the same basis weight is represented by the difference between curve (c) and curve (d) with 20% differential efficiency and ΔQF = 0.04 Pa−1. Alternatively, uncharged single layer to uncharged multilayer is represented by curve (a) to curve (b) with 10–15% differential increase in efficiency and ΔQF = 0.01 Pa−1; and uncharged to charged multilayer filter with the same basis weight is represented by curve (b) to curve (d) with 30% increase in efficiency and ΔQF = 0.06 Pa−1. Regardless of the paths taken, the two technologies raise the overall efficiency by 40%+ and QF by 0.07 Pa−1. As such, multilayering together with charging nanofiber layer are two essential elements to get the non-woven nanofiber filter achieving superior performance.
A parallel improvement can be witnessed also with the smaller aerosol, 55 nm as depicted in Fig. 13. This corresponds to the minimum COVID-19 virus with 60 nm diameter being attached to an even smaller carrier aerosol (Schematic 1a). Similar behavior is found as with the 100 nm aerosol as in Fig. 12 but because of the smaller aerosol size, the electrostatic effect is slightly reduced, see also Fig. 9. Nevertheless, the behavior is almost identical to that of the 100 nm nano-aerosol. The overall increase in efficiency from the added electrostatic effect together with multilayering is about 35% and the overall QF increase is 0.065 Pa−1. These metrics are slightly below those of the 100 nm aerosol.
4.9. Comparing polydispersed ambient aerosol versus monodispersed NaCl aerosol
The entire study on airborne virus attached to carrier is being simulated by ambient aerosols that have irregular shape, different physical properties, and with aerosols of all sizes challenging the filter simultaneously. These are different from the traditional test standards using NaCl and DOP aerosols.
First, the irregular shape ambient aerosols might have some effects as compared to the aerosols which are cubic (NaCl) and spherical (DOP) on induction of the dipoles and subsequent attraction by the charged fibers, i.e. dielectrophoresis.
Second, ambient aerosols contain both organic and inorganic matters, which are different in physical properties (other than shape) from pure NaCl crystals or DOP aerosols, and the dielectrophoretic effect might be different.
Third, as the aerosols are in the proximity of the charged fiber, once dipoles are induced on the aerosols, there might be interactions among charged aerosols of different sizes before being captured by the charged fibers. This is quite different from the case of monodispersed aerosols challenging the filter as interactions from different size aerosols are absent.
We might not be able to quantify the effect from each of the above factors, but limited testing can be conducted on one of the standard aerosols and the results can be compared with tthose obtained from the ambient aerosols.
Using monodispersed NaCl aerosols, a series of tests was conducted using the same series of multilayer nanofiber filters developed, 2L, 3L, 4L, and 6L using the single-layer building block (1L). The setup has been discussed in previous work [11], [13]. The efficiency for 100-nm NaCl aerosol versus pressure drop of the filter is shown in Fig. 14a. It is given by the solid circle. As can be seen, at the same pressure drop and the same basis weight the monodispersed NaCl has higher efficiency than that of the polydispersed ambient aerosols. The difference in the two approaches is larger with less modules and becomes lesser with more modules. Interestingly, the trend of the curve for 1L, 2L, 3L, 4L, and 6L is identical between NaCl and ambient aerosols. It is believed that the interaction of aerosol of different size might be the dominant factor among the three factors that cause discrepancy. Despite charge induction on the aerosol takes place at close distance in the proximity of the charged fibers, the aerosols with induced charge dipoles might still interact among themselves before the attraction with the charged nanofibers. Once the number of layers increase, this aerosol-aerosol interaction effect might be reduced as the aerosols have more direct interactions with the charged nanofibers while travelling inside the fiber layers. This can explain the large difference between the NaCl monodispersed aerosol challenge for the 1L (24%) and 2L filters (10%), but as there are more layers in the multilayer filter, this difference is progressively reduced, e.g. 14% for 2L filter and 6% for 6L filter, see Fig. 14a.
Similar comparisons have been made for the 50-nm NaCl and 55-nm ambient aerosols in Fig. 14b. This simulates the case of the minimum COVID-19 virus attaching to a smaller aerosol (Schematic 1). Again, the efficiency versus pressure drop have similar trend for both the NaCl and ambient aerosols as with the 100 nm. The NaCl aerosol has higher efficiency than that of the ambient aerosol for the same multilayer configuration. The pressure drop is the same as it is only related to the filter itself. The difference between the two tests (NaCl and ambient aerosols) narrows down to within 4% at 6L for the 50–55 nm aerosols.
For the 300 nm which simulates the COVID-19 attaching to a larger carrier (Schematic 2) as shown in Fig. 14c, similar comments can be drawn as with the 50–55 nm and 100 nm cases. Despite the large difference with the 1L and 2L, the 6L charged nanofiber filter provides a filtration efficiency of 98% for the NaCl aerosol, and a filtration efficiency of 96% for the ambient aerosol. This difference narrows down to 2%, which is within experimental error. In other words, the difference between the two system (NaCl versus ambient aerosols) becomes almost negligible for larger aerosol size and more layers in the multilayer filter.
An important point here is that for tests using ambient aerosol with polydispersed size distribution challenging the filter, this results in lower capture efficiency due to aerosols of different sizes interacting with each other mechanically and electrostatically. This interaction is eliminated with tests using monodispersed NaCl aerosols. Despite the test efficiency on the 300-nm ambient aerosol was 96%, the 300 nm NaCl aerosols test on the same filter would have had a higher efficiency of 98%. Therefore, the 6L charged nanofiber filter is qualified for 'N98 respirator standard' but with pressure drop of only 26 Pa (2.5 mm water) which is far below that of conventional N95 respirator, 250–350 Pa.
Another important point is that the more layer that multilayer charged nanofiber filter has, the less is the aerosol size interactions. The interactions will be shifted to the aerosol-fiber interaction by dielectrophoresis. This is another advantage of the multimodule/multilayer charged nanofiber filter.
5. Conclusions
In our present study, we use ambient aerosols to simulate the bio-nano-aerosol (combined COVID-19 virus attaching to carrier). The virus carrier can be solid particulates or droplets from the infected person, fine mists (humidity in air), or suspended ambient aerosols. The ambient aerosols allow us to investigate into the irregular shape of the combined aerosol, different physical (including electrical) properties of the aerosol other NaCl and DOP on dielectrophoresis, and interactions (electrical and mechanical) among aerosols of different sizes on filtration.
The following conclusions can be drawn from the present investigation:
-
1.
Ambient aerosols 10–400 nm can be captured with uncharged and charged PVDF nanofiber filter. For the uncharged nanofiber filter, the mechanisms are diffusion and interception. This is characterized by the U-shape behavior with the least efficiency at MPPS of 150 nm. Below 150 nm, diffusion dominates while above 150 nm, interception dominates. The behavior can be predicted using correlation with modification on the diffusion effect at low Peclet number as diffusion is quite strong for nanofiber filter and nano-aerosols under 100 nm.
-
2.
When nanofibers are charged, the dielectrophoresis further help to capture aerosols, this is especially for large aerosols>80 nm. The characteristics U-shape efficiency versus aerosol size is still present showing diffusion is still important for the nanofiber filter unlike the case for microfibers. In fact, diffusion, interception and dielectrophoresis can all contribute to capture of nano-aerosols independent of each other. For charged filter, the MPPS has been shifted to about 75 nm due to the dielectrophoresis capture. Using simple power law correlation based on ηo=(aZ)b with Z = CnDp2/u for the single fiber efficiency due to dielectrophoresis, the charged nanofiber filter efficiency can be predicted reasonably.
-
3.
Based on the measured efficiency of respectively charged and uncharged filters operating under similar condition, the efficiency due to dielectrophoresis can be determined. The added electrostatic effect is approximately 1.0 to 1.8 times that of the mechanical efficiency (or 50% to 64% of the total filter efficiency) depending the number of layers, 2L to 6L, in the filter. The smaller number of layers, the lower is the total efficiency, the higher is the electrostatic added benefit; and vice versa. This benefit is very prominent for D p > 80 nm. For smaller aerosols, this added benefit drops off substantially because of the small dipole moment associated with the small aerosol size.
-
4.
When the fibers are charged, multilayering is essential to distribute the nanofibers to reduce electrical interference and reduce pressure drop. For the 100 nm aerosol, the efficiency increase from these two effects is almost 40%+ and the quality factor QF is nearly doubled of its initial value, to 0.07 Pa−1!
-
5.
Multilayering approach has been used to increase the fiber basis weight such that QF, a measure of benefit-to-cost, remains unchanged. This is a very important strategy, otherwise, we may have a high efficiency filter, yet also much higher Δp. The QF for the tested filters stayed at a high value of 0.1 – 0.13 Pa−1.
-
6.
Limited experiments have also been carried out using monodispersed NaCl aerosols for 50 nm, 100 nm, and 300 nm, respectively. It was found that they behave similarly as that carried out using the polydispersed ambient aerosols when multiple layers were used to build up the amounts of nanofibers in the filter to achieve high efficiency. This proves that the ambient aerosol test results are valid, despite the efficiency is lower as compared to the laboratory monodispersed NaCl aerosols by 2–10% depending on the number of layers in the multilayer filter. This discrepancy is related to adopting ambient aerosol with amorphous shape and more so the complicated interaction of ambient aerosols of different sizes undergoing dielectrophoresis (induction followed by electrostatic attraction). The discrepancy between the two approaches reduces with more layers in the multilayer charged nanofiber filter. This is because the multilayer filter promotes more interaction between the aerosols and the charged fibers via dielectrophoresis and reduces the self-interactions of charged aerosols of different sizes among themselves.
-
7.
A 6-layer (6L) multimodule/multilayer charged nanofiber filter can achieve 88%, 88% and 96% for the ambient aerosol size of 50, 100, and 300 nm. This is close to reaching the goal of 90% for the nano-aerosols at 100 nm. The same filter when tested with the monodispersed NaCl aerosols can achieve 92%, 94%, and 98% for aerosol size of 50, 100, and 300 nm, respectively. In all cases, the pressure drop was 26 Pa for the 6L nanofiber filter which was below the set 30-Pa limit.
-
8.
Despite the test efficiency on the 300-nm ambient aerosol was 96%, the 300 nm NaCl aerosols test on the same filter would have achieved a higher efficiency of 98%. Therefore, the 6L charged nanofiber filter is equivalent to 'N98 respirator standard' but with pressure drop of only 26 Pa (2.5 mm water) which is significantly below that of conventional N95 respirator. (Note, N98 does not exist, only N95, N99, and N100 are being used, but what we have achieved is an equivalence of a N98 requirement of 98% capture on 300-nm aerosol.)
The 6-layer charged nanofiber filter provides good personal protection against coronavirus aerosols, especially the recent COVID-19, and nano-aerosols from pollution based on the 'N98' equivalence, yet it is at least 10 folds more breathable than a conventional N95 respirator. In general, the multilayer/multi-modular electrostatically charged PVDF nanofiber filter is a novel filtration technology [24] that provides excellent health protection for people, especially against the invisible airborne viruses and pollutants.
CRediT authorship contribution statement
Wallace Woon-Fong Leung: Conceptualization, Formal analysis, Methodology, Supervision, Writing - original draft, Funding acquisition, Project administration, Resources. Qiangqiang Sun: Investigation, Methodology, Software, Data curation, Formal analysis, Validation.
Declaration of Competing Interest
The authors declared that there is no conflict of interest.
Acknowledgements
QQ Sun wants to thank Mechanical Engineering of the Hong Kong Polytechnic University for partial support of his PhD study.
Appendix A.
| (A1) |
where ηs1 and ηs2 are the single fiber efficiency due to mechanical and electrical capture, respectively, and η1 and η2 are the uncharged and charged efficiency for the filter, respectively. They are defined by,
| (A2) |
| (A3) |
Rearranging,
| (A4) |
References
- 1.Zhu N. A Novel Coronavirus from Patients with Pneumonia in China, 2019. New England J. Med. 2020 doi: 10.1056/NEJMoa2001017. [DOI] [PMC free article] [PubMed] [Google Scholar]
- 2.Lin S. Surface ultrastructure of SARS coronavirus revealed by atomic force microscopy. Cell. Microbiol. 2005;7(12):1763–1770. doi: 10.1111/j.1462-5822.2005.00593.x. [DOI] [PMC free article] [PubMed] [Google Scholar]
- 3.C. Ultrastructural Characterization of SARS Coronavirus, Emerging Infectious Diseases • www.cdc.gov/eid • Vol. 10, No. 2, February 2004. [DOI] [PMC free article] [PubMed]
- 4.https://www.aabb.org/tm/eid/Documents/middle-east-respiratory-syndrome-coronavirus.pdf.
- 5.Harris A., Cardone G., Winkler D.C., Heymann J.B., Brecher M., White J.M., Steven A.C. Influenza virus plesiomorphy characterized by cryo electron tomography. Proc. Natl. Acad Sci. USA. 2006;103:19123–19127. doi: 10.1073/pnas.0607614103. [DOI] [PMC free article] [PubMed] [Google Scholar]
- 6.Noda T. Ultracentrifugation deforms unfixed influenza A virions. J. Gen. Virol. 2011;92:2485–2493. doi: 10.1099/vir.0.036715-0. [DOI] [PMC free article] [PubMed] [Google Scholar]
- 7.Shi Y.Y. Nanoscale characterization of PM2.5 airborne pollutants reveal high adhesiveness and aggregation capability of soot particles. 2015;5:11232. doi: 10.1038/srep11232. [DOI] [PMC free article] [PubMed] [Google Scholar]
- 8.Leung W.W.F. Yuen Ting Chau, Experiments on filtering nano-aerosols from vehicular and atmospheric pollutants under dominant diffusion using nanofiber filter. Sep. and Purif. Tech. J. 2019;213:186–198. [Google Scholar]
- 9.Hutton I.M. Handbook of non-woven media. Elsevier Sciences. 2007 [Google Scholar]
- 10.Lee J.K., Ahn Y.C., Park S.K., Kim G.T., Hwang Y.H., Lee C.G., Shin H.S. Development of high efficiency nanofilters made of nanofibers. Curr. Appl Phys. 2006;6:1030–1035. [Google Scholar]
- 11.Hung C.H., Leung W.W.F. Investigating the filtration of nano-aerosol using nanofiber filter under low Peclet number regime. Sep. Purif. Tech. 2011;79(1):34–42. [Google Scholar]
- 12.Sun Q.Q., Leung W.W.F. Charged PVDF multi-layer filters with enhanced filtration performance for filtering nano-aerosols. Sep. Purif. Tech. J. 2019;212:854–876. [Google Scholar]
- 13.Leung W.W.F., Hung C.H., Yuan P.T. Effect of face velocity, nanofiber packing density and thickness on filtration performance of filters with nanofibers coated on a substrate. Sep. Purif. Technol. 2010;71:30–37. [Google Scholar]
- 14.Brown R.C. first ed. Pergamon Press; Oxford: 1993. Air Filtration: An Integrated Approach to the Theory and Applications of Fibrous Filters. [Google Scholar]
- 15.Payet S., Bouland D., Madelaine G., Renoux A. Penetration and pressure drop of a HEPA filter during loading with submicron liquid particles. J. Aerosol Sci. 1992;23:723–735. [Google Scholar]
- 16.Rader D.J. Momentum slip correction factor for small particles in nine common gases. J. Aerosol Sci. 1990;21:161–168. [Google Scholar]
- 17.Davies C.N. The separation of airborne dust and particulates. Proc. Inst. Mech. Eng. Part. 1952;1B:185–213. [Google Scholar]
- 18.Werner R.M., Clarenburg L.A. Aerosol filters. Pressure drop across single-component glass fiber filters. Ind. Eng. Chem. Proc. Des. Dev. 1965;4:288–293. [Google Scholar]
- 19.Pich J. Theory of aerosol filtration by fibrous and membrane filters. In: Davies C.N., editor. Aerosol Science. Academic Press; London: 1966. pp. 223–283. [Google Scholar]
- 20.Kirsch A.A., Stechkina I.B. Fundamentals of Aerosol Science. John Wiley & Sons; New York: 1978. pp. 165–256. [Google Scholar]
- 21.Emi H., Kanaoka C., Otani Y., Iiyama T. Effect of charging state of particles on electret filtration. Aersol Sci. Technol. 1987;7:1–13. [Google Scholar]
- 22.Emi H., Kanaoka C., Otani Y., Ishiguro T. Collection mechanism of electret filter. Particulate Sci. Technol. 1987;5:161–171. [Google Scholar]
- 23.Romay F.J., Liu B.Y.H., Chae S.J. Experimental study of electrostatic capture mechanisms in commercial electret filters. Aersol Sci. Technol. 1998;28:224–234. [Google Scholar]
- 24.WWF Leung, Electrostatically-charged nanofiber media and fabrication method thereof, US patent pending, No. 62 / 657, 966, Apr. 16, 2018.


