Abstract
Endochondral ossification, an important bone formation process in vertebrates, highly depends on proper functioning of growth plate chondrocytes1. Their proliferation determines longitudinal bone growth and the matrix deposited provides a scaffold for future bone formation. However, these two energy-dependent anabolic processes occur in an avascular environment1,2. In addition, the centre of the expanding growth plate becomes hypoxic and local activation of the hypoxia-inducible transcription factor HIF-1α is necessary for chondrocyte survival by still unknown cell-intrinsic mechanisms3–6. Whether HIF-1α signalling has to be contained in the other regions of the growth plate and whether chondrocyte metabolism controls cell function remains undefined. We here show that prolonged HIF-1α signalling in chondrocytes leads to skeletal dysplasia by interfering with cellular bioenergetics and biosynthesis. Decreased glucose oxidation results in an energy deficit, which limits proliferation, activates the unfolded protein response (UPR) and reduces collagen synthesis. However, enhanced glutamine flux increases α-ketoglutarate (αKG) levels, which in turn increases collagen proline and lysine hydroxylation. This metabolically regulated collagen modification renders the cartilaginous matrix more resistant to protease-mediated degradation and thereby increases bone mass. Thus, inappropriate HIF-1α signalling results in skeletal dysplasia caused by collagen overmodification, an effect that may also contribute to other extracellular matrix-related diseases such as cancer and fibrosis.
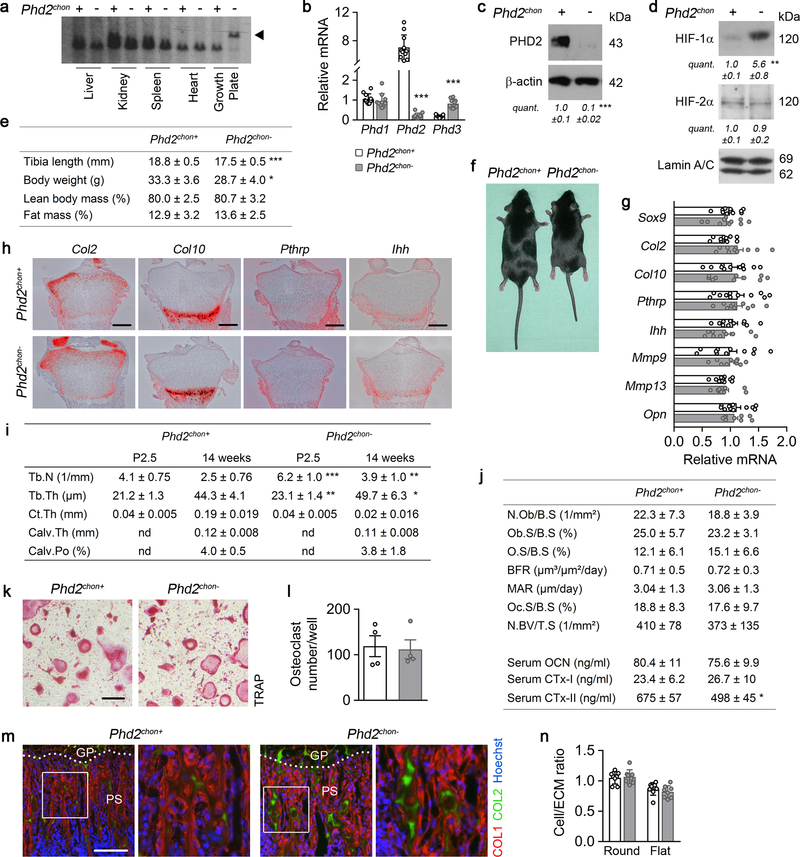
To investigate whether HIF signalling needs to be controlled in growth plate chondrocytes, we conditionally inactivated HIF prolyl hydroxylase 2 (PHD2; Phd2chon- mice), its main negative regulator7, resulting in HIF-1α accumulation (Extended Data Fig. 1a–d).
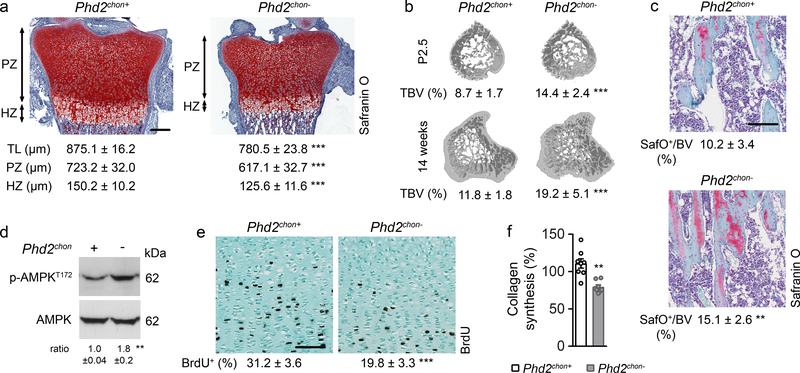
This approach caused skeletal dysplasia, characterized by impaired longitudinal bone growth and increased trabecular bone mass (Fig. 1a,b, Extended Data Fig. 1e,f). The growth plate was shorter, but normally organized and, interestingly, the high bone mass was not due to altered bone resorption or formation (Extended Data Fig. 1g–l). Instead, we observed more cartilage remnants in the bony trabeculae, evidenced by more type II collagen (COL2)-positive and proteoglycan-rich matrix (Fig. 1c, Extended Data Fig. 1m). The decreased serum CTx-II levels, measuring COL2 degradation, indicated that the cartilage matrix was incompletely resorbed, and the unaltered chondrocyte-to-matrix ratio pointed to a qualitative, rather than quantitative, change in matrix properties (Extended Data Fig. 1j,n). Thus, inactive oxygen sensing in chondrocytes increases trabecular bone mass, caused by abundant cartilage remnants, likely resulting from modifications in the cartilage matrix itself.
Figure 1. Skeletal dysplasia in Phd2chon- mice.
(a) Safranin O staining of the growth plate of neonatal (P2.5) mice, with quantification of the total length (TL), of the proliferating (PZ) and hypertrophic zone (HZ) (n=8 mice). (b) 3D microCT models of the tibial metaphysis and quantification of trabecular bone volume (TBV) in neonatal (n=10 mice) and adult (14 weeks) mice (n=10 Phd2chon+ − 8 Phd2chon- mice). (c) Safranin O staining of the tibia of adult mice with quantification of the percentage Safranin O (SafO) positive matrix (red) relative to BV (n=8 Phd2chon+ − 9 Phd2chon- mice). (d) P-AMPKT172 and AMPK immunoblot, with quantification of p-AMPKT172 to AMPK ratio. Representative images of 4 independent experiments are shown. (e) BrdU immunostaining of neonatal growth plates with quantification of the percentage BrdU-positive cells (n=6 mice). (f) Collagen synthesis in cultured chondrocytes (n=8 biologically independent samples). Data are means ± SD in (a-c, e), or means ± SEM in (d, f). **p<0.01 vs. Phd2chon+, ***p<0.001 vs. Phd2chon+ (two-sided Student’s t-test). Exact p values: 0.0000002 (TL; a), 0.00001 (PZ; a), 0.0005 (HZ; a), 0.00001 (P2,5; b), 0.0006 (14w; b), 0.004 (c), 0.004 (d), 0.0002 (e), 0.0004 (f). Scale bar in (a) is 250 μm, scale bars in (c) and (e) are 100 μm.
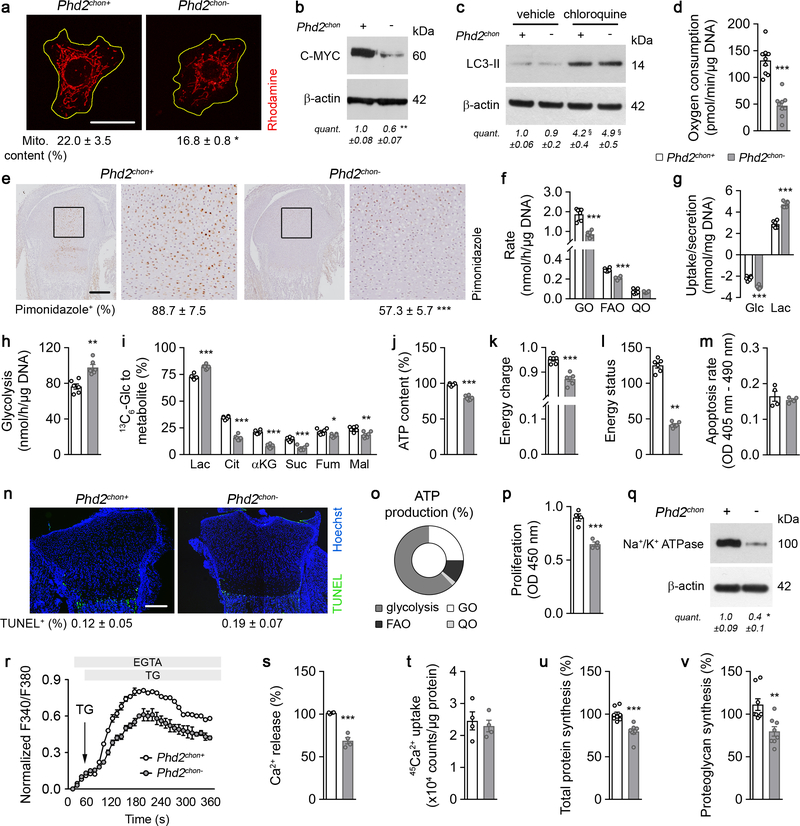
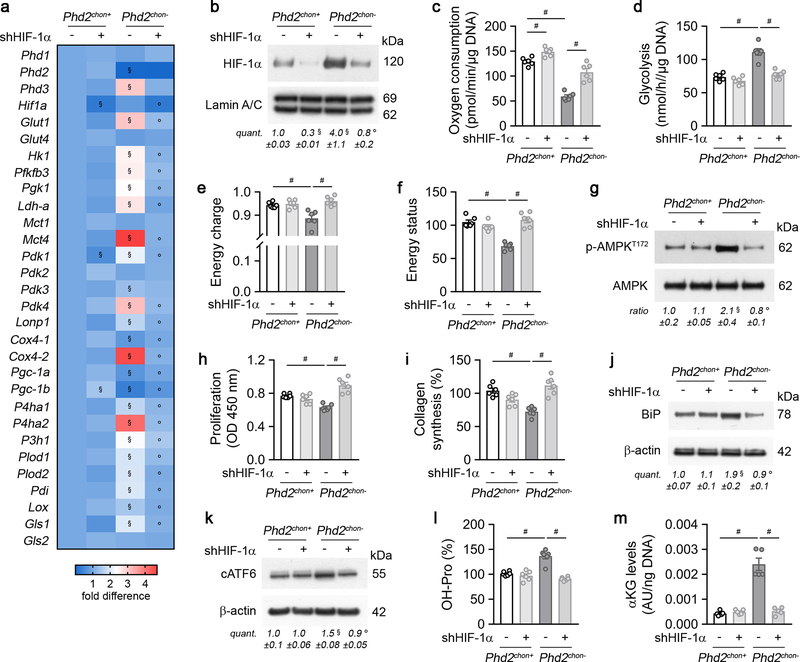
HIF-1α stabilization in PHD2-deficient chondrocytes resulted, as expected7,8, in metabolic reprogramming. Mitochondrial content was reduced, likely because of decreased biogenesis without changing autophagy (Extended Data Fig. 2a–c). Consistently, mitochondrial oxygen consumption was decreased, making centrally localized chondrocytes less hypoxic (Extended Data Fig. 2d,e). Oxidation of glucose and fatty acids, but not glutamine, was decreased (Extended Data Fig. 2f). The compensatory increase in glycolytic flux could however not avoid energy distress, evidenced by decreased ATP content, energy charge, energy status and activation of AMP-activated protein kinase signalling (AMPK) (Fig. 1d, Extended Data Fig. 2g–l). Despite the energy deficit, apoptosis was not increased (Extended Data Fig. 2m,n). The metabolic changes and energy deficit were HIF-1α-mediated, as they were reversed by silencing HIF-1α (Extended Data Fig. 3a–g). Thus, although chondrocytes generate the majority (>60%) of their ATP through glycolysis (Extended Data Fig. 2o), they require oxidative metabolism to avoid energy distress and HIF-1α signalling needs therefore to be controlled.
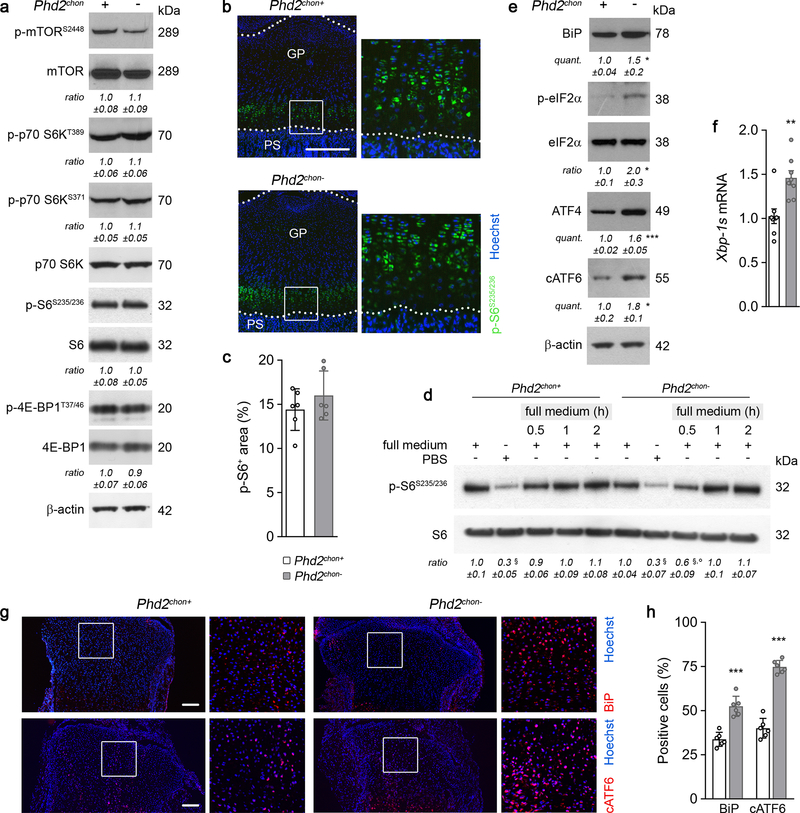
To survive with an energy deficit, cells decrease their energy-consuming processes9,10, effects also observed in PHD2-deficient chondrocytes. Firstly, proliferation was decreased, measured by BrdU incorporation (Fig. 1e, Extended Data Fig. 2p). Secondly, ATP-consuming ion transport mechanisms were reduced, including decreased Na+/K+ ATPase protein levels and lower activity of the sarco/endoplasmic reticulum calcium-ATPase (SERCA), shown by reduced Ca2+ release upon addition of SERCA-inhibitor thapsigargin (Extended Data Fig. 2q–s). The decreased SERCA activity was caused by the energy deficit, as normalizing ATP levels restored the Ca2+ loading capacity of the ER in mutant chondrocytes (Extended Data Fig. 2t). Thirdly, energy shortage affected matrix production, as abundant energy is required for protein synthesis in specialized secretory cells11. PHD2-deficient chondrocytes displayed decreased global protein synthesis and synthesis of specific proteins including collagen and proteoglycans (Fig. 1f, Extended Data Fig. 2u,v). The decreased protein synthesis was not caused by altered activity of mammalian target of rapamycin (mTOR), but rather by UPR activation, evidenced by increased levels of binding immunoglobulin protein and activation of ER stress sensors (Extended Data Fig. 4a–h). The decreased proliferation and protein synthesis were restored by HIF-1α knockdown (Extended Data Fig. 3h–k). Thus, the energy stress in PHD2-deficient chondrocytes reduces energy expenditure, including proliferation and protein synthesis.
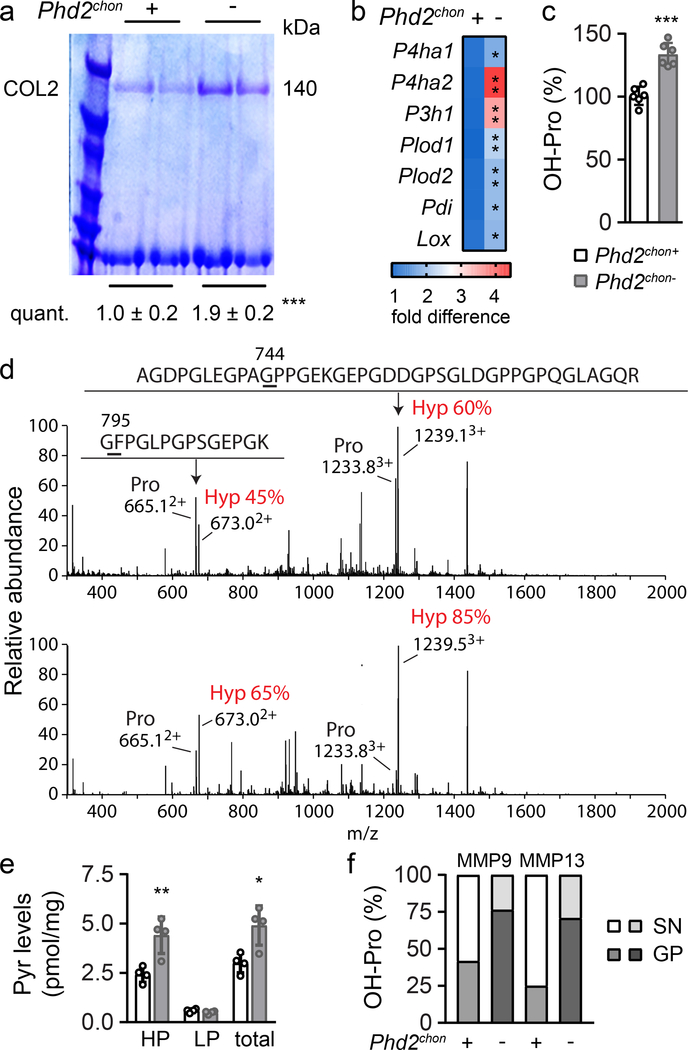
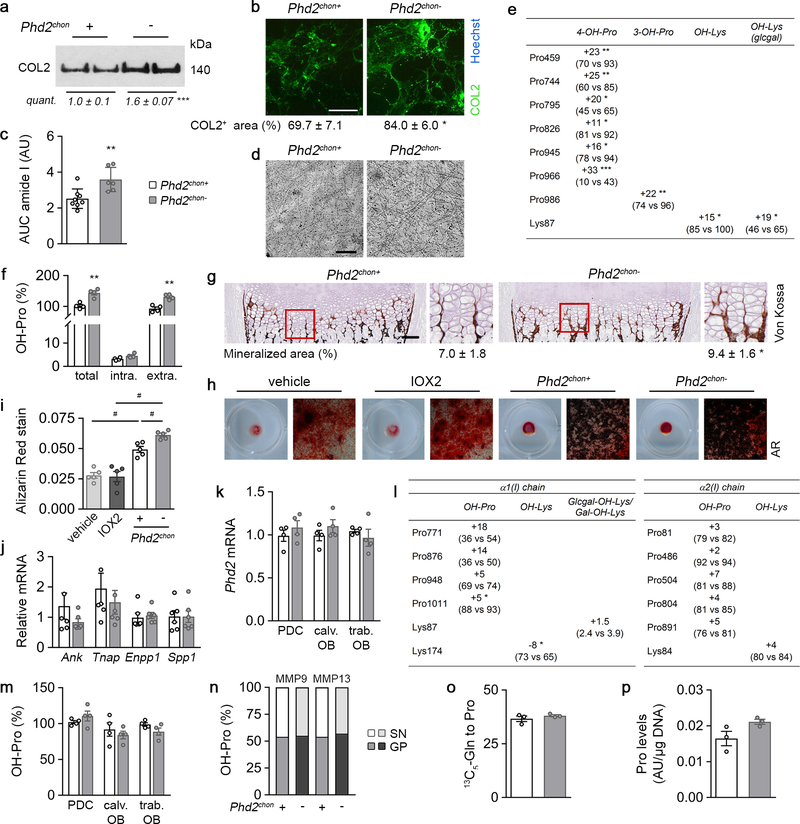
Despite the decreased collagen synthesis by PHD2-deficient chondrocytes, total and extracellular COL2 content was increased, as demonstrated by gel electrophoresis, immunostaining, Fourier transformed infrared spectroscopy and transmission electron microscopy (Fig. 1f, 2a; Extended Data Fig. 5a–d). To explain this apparent controversy, we hypothesized that collagen turnover was decreased because of altered posttranslational modifications. Transcript levels of collagen modifying enzymes were increased in mutant chondrocytes (Fig. 2b), including collagen prolyl hydroxylases (P4HA1–2 associated with protein disulphide isomerase (PDI) and P3H1), lysine hydroxylases (PLOD1–2) and lysyl oxidase (LOX). Hydroxylation of proline enhances the stability of the collagen triple helices and the lysine modifications increase crosslinking12. Accordingly, hydroxyproline content was increased, mainly because numerous proline residues in COL2 were more often hydroxylated (Fig. 2c,d, Extended Data Fig. 5e,f). Hydroxylation of Lysine 87 occurred also more frequently, which, together with the increased Lox levels, explains the higher hydroxylysylpyridinoline (HP) cross-link content and total pyridinoline levels (Fig. 2e, Extended Data Fig. 5e). These data indicate that the collagen fibrils were significantly more cross-linked in mutant growth plates. Collagen modifications can affect collagen breakdown13,14 and, indeed, mutant collagen fibres were more resistant to degradation by matrix metalloproteinase 9 (MMP9) or MMP13 (Fig. 2f). These findings explain the decreased CTx-II serum levels, the increased collagen density in the growth plates and the presence of cartilage remnants in Phd2chon- mice (Fig. 1c, 2a; Extended Data Fig. 1j). Moreover, increased collagen cross-linking promotes extracellular matrix mineralization15, which clarifies the increased mineralization of mutant growth plates (Extended Data Fig. 5g–j). These effects were HIF-1α-mediated, as decreasing HIF-1α levels in PHD2-deficient chondrocytes was sufficient to reverse the increased hydroxyproline levels, to prevent the accumulation of collagen remnants and to normalize bone mass in an ectopic model of endochondral ossification16 (Extended Data Fig. 3l, 6a,d,e). Of note, prolyl/lysine hydroxylation and MMP-mediated degradation of COL1 produced by osteogenic cells was not altered, indicating a COL2-specific effect (Extended Data Fig. 5k–n). Thus, HIF-1α-induced metabolic changes in PHD2-deficient chondrocytes reduce collagen synthesis but enhance collagen modifications, resulting in a denser collagen matrix that hinders cartilage degradation.
Figure 2. Altered collagen processing in Phd2chon- growth plates.
(a) Type II collagen (COL2) levels in neonatal (P2.5) growth plates, analysed by SDS page and Coomassie staining. Protein loading was normalized to growth plate weight. Representative images of 2 experiments, each with 2 biologically independent replicates, are shown. (b) P4ha1, Ph4ha2, P3h1, Plod1, Plod2, Pdi and Lox mRNA levels in neonatal growth plates (n=4 biologically independent samples). (c) Hydroxyproline (OH-Pro) content in neonatal growth plates, normalized for tissue weight (n=6 biologically independent samples). (d) Mass spectral analysis of Pro744 and Pro795 hydroxylation in peptides obtained after in-gel trypsin digest of the α1(II) chain of collagen extracted from neonatal growth plates. Representative images of 4 biologically independent samples are shown. Hyp is hydroxyproline. (e) Hydroxylysylpyridinoline (HP) and lysylpyridinoline (LP) content and total pyridinoline (Pyr) cross-links (total) in neonatal growth plates, normalized for tissue weight (n=4 biologically independent samples). (f) OH-Pro content in neonatal growth plates (GP) and supernatant (SN), after incubation with MMP9 or MMP13 (n=5 biologically independent samples). Data are means ± SD. *p<0.05 vs. Phd2chon+, **p<0.01 vs. Phd2chon+, ***p<0.001 vs. Phd2chon+ (two-sided Student’s t-test). Exact p values: 0.0009 (a), 0.045 (P4ha1; b), 0.0013 (P4ha2; b), 0.006 (P3h1; b), 0.0017 (Plod1; b), 0.002 (Plod2; b), 0.010 (Pdi; b), 0.03 (Lox; b), 0.00004 (c), 0.007 (HP; e), 0.014 (total; e).
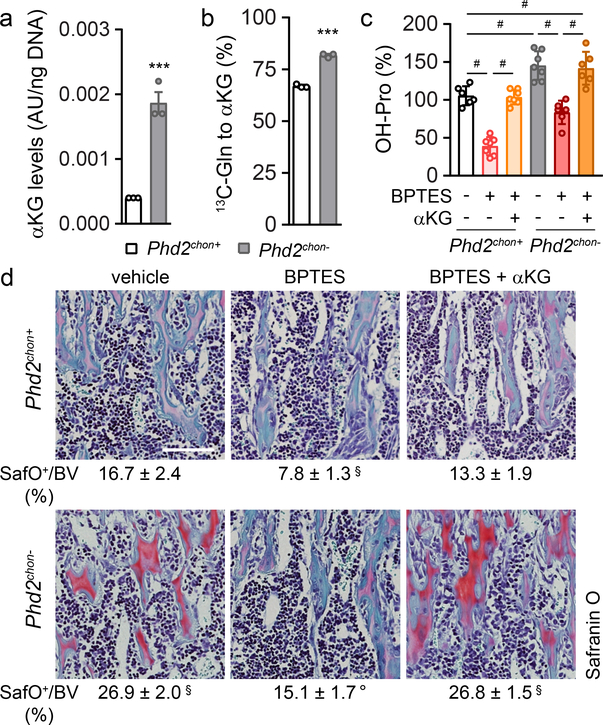
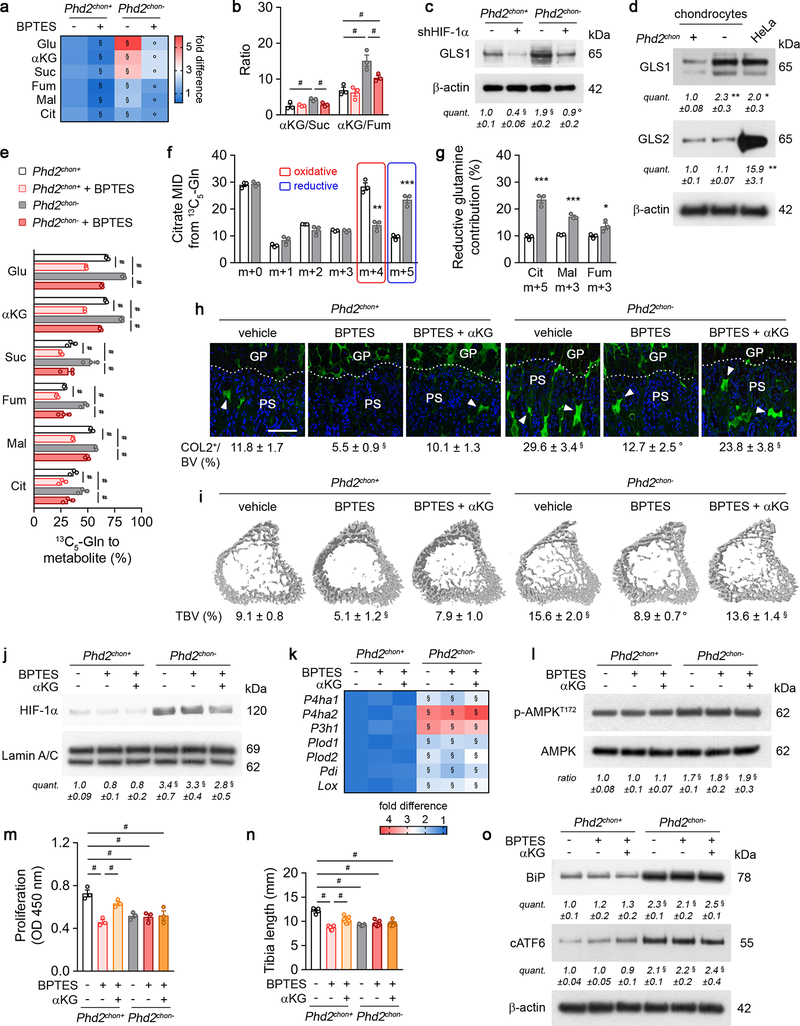
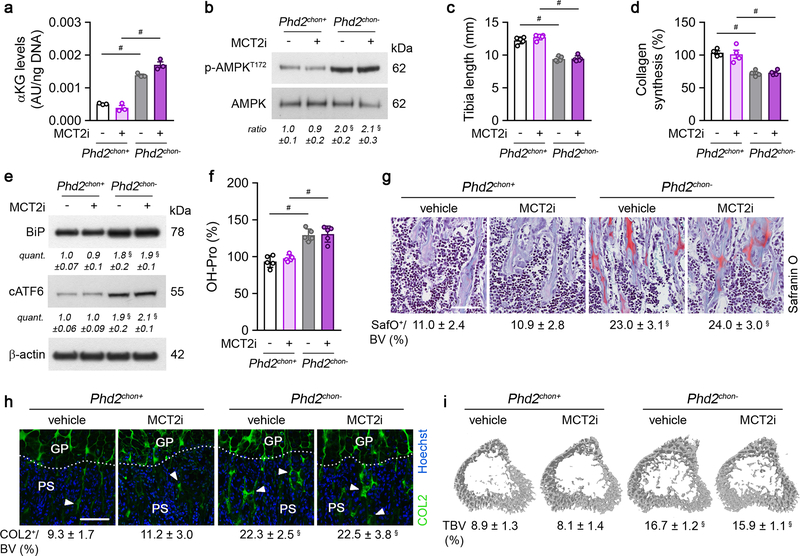
The enzyme activity of P4HA, P3H1 and PLOD highly depends on the availability of the metabolic co-substrate αKG, relative to the inhibitory metabolites succinate and fumarate17,18. Consistent with the increased enzyme levels in PHD2-deficient chondrocytes, intracellular αKG levels were increased by 400% in a HIF-dependent manner, resulting in a higher αKG/succinate (2.2-fold) and αKG/fumarate (2.3-fold) ratio (Fig. 3a; Extended data Fig. 3m, 7a,b). The increased αKG levels did not derive from glucose but from glutamine, through increased HIF-1α-regulated expression of glutaminase 1 (GLS1) (Fig. 3b, Extended Data Fig. 7c–e). Of note, glutamine was primarily metabolized in the TCA cycle via reductive carboxylation (Extended Data Fig. 7f,g). The increased conversion of glutamine to αKG to favour collagen hydroxylation distinguishes chondrocytes from tumour cells in two aspects. First, metastasizing breast tumour cells metabolize pyruvate to αKG to control collagen synthesis and modification19. We excluded extracellular pyruvate as nutritional source for αKG in chondrocytes, as blocking the pyruvate transporter monocarboxylate transporter 2 did not affect collagen and bone properties in wild-type and PHD2-deficient cells/mice (Extended Data Fig. 8a–i). Second, in many malignant cells, glutamine functions as a carbon donor for the synthesis of proline20, a major building block of collagen. However, deletion of PHD2 did not alter the fractional contribution from 13C5-glutamine to proline in chondrocytes and did not affect intracellular proline levels (Extended Data Fig. 5o,p). Together, these data suggest that PHD2 inactivation stimulates, via GLS1, the flux of glutamine to αKG, which is not only used to supply the TCA cycle, but also to support αKG-dependent collagen hydroxylation.
Figure 3. Enhanced collagen hydroxylation relies on glutamine-dependent α-ketoglutarate production.
(a) Intracellular α-ketoglutarate (αKG) levels in cultured chondrocytes (n=3 biologically independent samples). (b) Fractional contribution of 13C5-glutamine (Gln) to αKG (n=3 biologically independent samples). (c) Hydroxyproline (OH-Pro) content in neonatal growth plates of mice treated with BPTES, with or without αKG (n=6 for Phd2chon+-veh, Phd2chon--BPTES or Phd2chon--BPTES+αKG mice; and n=7 for Phd2chon+-BPTES, Phd2chon+-BPTES+αKG or Phd2chon--veh mice). (d) Safranin O staining of the tibia of mice treated with BPTES, with or without αKG, and quantification of the percentage Safranin O (SafO) positive matrix relative to bone volume (BV) (n=5 for Phd2chon+-BPTES mice; n=6 for Phd2chon+-veh or Phd2chon--veh mice; and n=7 for Phd2chon+-BPTES+αKG, Phd2chon--BPTES or Phd2chon--BPTES+αKG mice). Scale bar is 250 μm. Data are means ± SEM in (a, b), or means ± SD in (c,d). ***p<0.001 vs. Phd2chon+ (two-sided Student’s t-test), #p<0.05 (ANOVA), §p<0.05 vs. Phd2chon+-veh, °p<0.05 vs. Phd2chon--veh (ANOVA). Exact p values: 0.0009 (a); 0.00004 (b); Phd2chon+-veh vs. Phd2chon--veh 0.0010 (c) or 0.00001 (d); Phd2chon+-veh vs. Phd2chon+-BPTES 0.000001 (c) or 0.00003 (d); Phd2chon+-veh vs. Phd2chon--BPTES+αKG 0.005 (c) or 0.000002 (d); Phd2chon+-BPTES vs. Phd2chon+-BPTES+αKG 0.0000001 (c); Phd2chon--veh vs. Phd2chon--BPTES 0.00005 (c) or 0.0000002 (d); Phd2chon--BPTES vs. Phd2chon--BPTES+αKG 0.0003 (c).
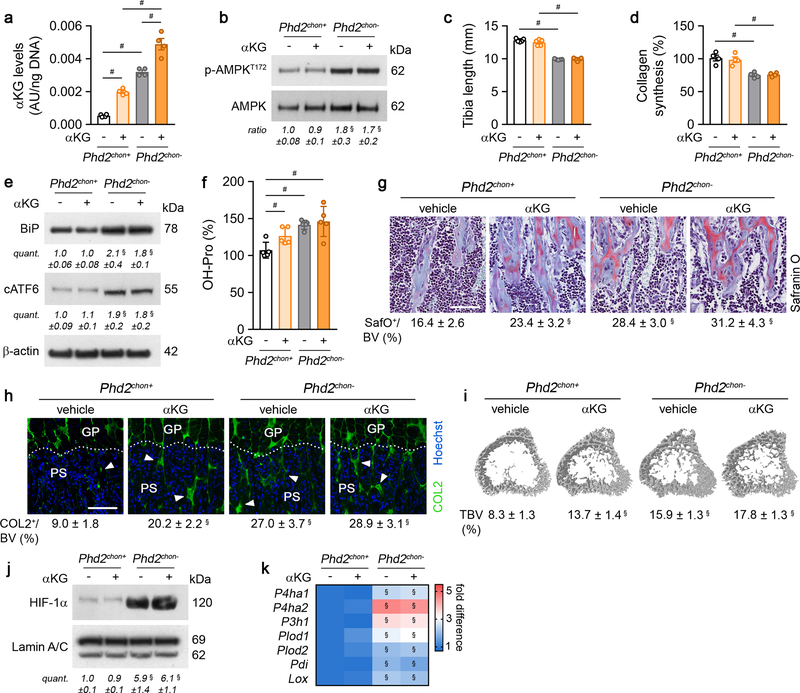
To validate the importance of αKG availability for collagen hydroxylation, we used two approaches. First, administration of dimethyl-αKG to wild-type cells/mice did not affect energy homeostasis or expenditure, but increased growth plate hydroxyproline levels, resulting in more COL2-positive cartilage remnants and increased bone mass, and importantly, these effects were not caused by HIF-1α-driven gene expression (Extended Data Fig. 9a–k). Of note, αKG-treated mutant mice did not display further changes in collagen or bone, likely because collagen hydroxylase activity was already maximal (Extended Data Fig. 9a–k). Secondly, treating PHD2-deficient chondrocytes/mice with the GLS1 inhibitor bis-2-(5-phenylacetamido-1,3,4-thiadiazol-2-yl)ethyl sulphide (BPTES) decreased intracellular αKG levels, because fractional contribution from 13C5-glutamine was reduced, thereby normalizing the enhanced hydroxyproline levels, the increased amount of COL2-positive cartilage remnants and the higher bone volume (Fig. 3c,d; Extended Data Fig. 7a,e,h,i). This BPTES-induced decrease in αKG had no effect on the increased HIF-1α levels or its target enzymes involved in collagen hydroxylation, nor on energy-related parameters (Extended Data Fig. 7j–o). Administration of dimethyl-αKG to BPTES-treated mutant cells/mice re-established the mutant phenotype with respect to collagen levels and bone volume (Fig. 3c,d, Extended Data Fig. 7h,i), further confirming that PHD2-deficient chondrocytes rely on glutamine-derived αKG to support enhanced collagen hydroxylation. Of note, GLS1 inhibition also negatively affected collagen and bone properties in wild-type mice, but impaired chondrocyte proliferation as well, suggesting that glutamine metabolism controls multiple cell functions during bone development (Fig. 3c,d, Extended Data Fig. 7h,i, m,n). Finally, the effects of pharmacological GLS1 inhibition were confirmed genetically in vitro and in vivo, using an ectopic endochondral bone formation model (Extended Data Fig. 6b,d–f,h–k). Together, these data indicate that the primary role of glutamine in PHD2-deficient chondrocytes is not to support oxidative ATP generation, but to facilitate collagen hydroxylation.
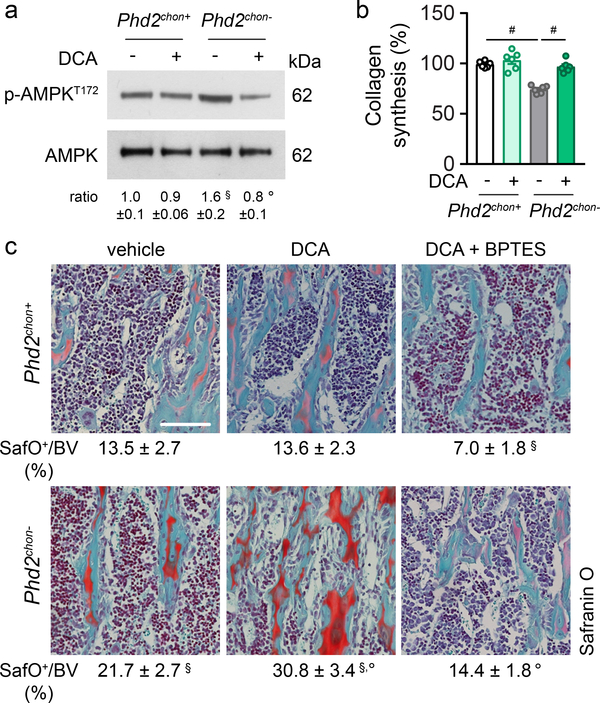
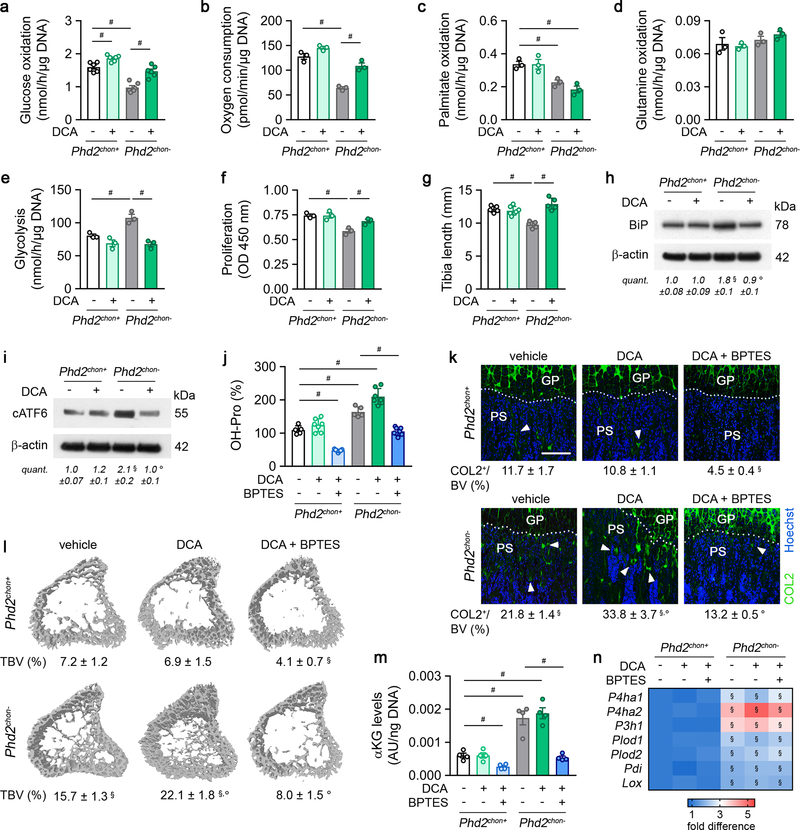
Glucose metabolism, on the other hand, controls energy balance in PHD2-deficient chondrocytes, as the switch from glucose oxidation to glycolysis resulted in energy deficit (Fig. 1d, Extended Data Fig. 2f–l). To confirm, we treated PHD2-deficient chondrocytes with the pyruvate dehydrogenase kinase (PDK) inhibitor dichloroacetic acid (DCA), resulting in increased glucose oxidation and oxygen consumption rate, without affecting palmitate and glutamine oxidation, but causing reduced glycolysis (Extended Data Fig. 10a–e). DCA treatment had no effect in wild-type cells. Restoring glucose oxidation in PHD2-deficient chondrocytes by blocking PDK corrected the energy deficit, restored proliferation and prevented UPR activation, accompanied by increased collagen synthesis and hydroxyproline levels (Fig. 4a,b, Extended Data Fig. 10f–j). These metabolic changes further augmented the COL2-positive cartilage remnants and, consequently, mineralized bone mass (Fig. 4c, Extended Data Fig. 10k,l). In line, silencing PDK1 using shRNA normalized proliferation of PHD2-deficient chondrocytes and resulted in accumulation of cartilage remnants in ectopic bone ossicles (Extended Data Fig. 6c–e,g–k). The observation of more abundant cartilage remnants in DCA-treated mutant mice can be explained by the restored collagen synthesis combined with the increased αKG levels, which favour collagen hydroxylation. Indeed, co-administration of BPTES to DCA-treated mutant mice normalized the increase in αKG and hydroxyproline levels, COL2-positive cartilage remnants and mineralized bone mass to the levels of wild-type mice, changes that were not caused by transcriptional effects (Fig. 4c; Extended Data Fig. 10j–n). Taken together, confined HIF signalling permits oxidative glucose metabolism in chondrocytes to maintain optimal energy balance during endochondral ossification.
Figure 4. Stimulating glucose oxidation in PHD2-deficient chondrocytes avoids energy deficit and restores collagen synthesis.
P-AMPKT172 and AMPK immunoblot with quantification of p-AMPKT172 to AMPK ratio in cultured chondrocytes, with or without DCA treatment. Representative images of 3 independent experiments are shown. (b) Collagen synthesis in cultured chondrocytes, with or without DCA treatment (n=6 biologically independent samples). (c) Safranin O staining of the tibia of mice treated with DCA, with or without BPTES, with quantification of the percentage Safranin O (SafO) positive matrix relative to bone volume (BV) (n=5 for Phd2chon+-veh or Phd2chon--veh mice; n=7 for Phd2chon+-DCA, Phd2chon+-DCA+BPTES, Phd2chon--DCA, Phd2chon--DCA+BPTES mice). Scale bar is 250 μm. Data are means ± SEM in (a, b), or means ± SD in (c). #p<0.05 (ANOVA), §p<0.05 vs. Phd2chon+-veh, °p<0.05 vs. Phd2chon--veh (ANOVA). Exact p values: Phd2chon+-veh vs. Phd2chon--veh 0.03 (a), 0.0000002 (b) or 0.0014 (c); Phd2chon--veh vs. Phd2chon--DCA 0.013 (a), 0.00013 (b) or 0.0006 (c); Phd2chon+-veh vs. Phd2chon+-DCA+BPTES 0.0006 (c); Phd2chon+-veh vs. Phd2chon--DCA 0.000003 (c); Phd2chon--veh vs. Phd2chon--DCA+BPTES 0.0002 (c).
Thus, despite their avascular environment, growth plate chondrocytes require PHD2-regulated HIF-1α inactivation to avoid metabolically induced skeletal dysplasia. Glycolysis is the most important energy-producing pathway in chondrocytes, but glucose oxidation is needed for adequate proliferation and protein synthesis, and these pathways thus require controlled HIF-1α activation. Furthermore, HIF-1α signalling not only regulates collagen modifications transcriptionally, but also metabolically by controlling glutamine-derived co-substrate levels that stimulate enzyme activity. Together, the PHD2 oxygen sensor is a central gatekeeper of chondrocyte metabolism that controls bone growth and mass. Our findings also hold important translational implications, as several pathologies are associated with changes in extracellular matrix deposition and/or remodelling such as cancer21 (as shown by Elia et al.19), osteogenesis imperfecta22 and fibrosis23. Further research is warranted to explore the therapeutic potential of metabolically targeting the collagen defects in these diseases23,24.
Methods
Animals
Chondrocyte-specific deletion of PHD2 was obtained by crossing Phd2fl/fl mice (exon 2 was flanked by LoxP sites, mice were generated as described before25) with transgenic mice expressing Cre recombinase under the control of the type II collagen (Col2) gene promoter26 (Col2-Cre+ Phd2fl/fl, referred to as Phd2chon-). Col2-Cre- Phd2fl/fl (referred to as Phd2chon+) littermates were used as controls in all experiments. Analysis was performed on 2.5 day-old (P2.5), 10 day-old (P10) or 14-week-old male mice unless stated otherwise. Dichloroacetic acid (DCA; 100 μg/g body weight), bis-2-(5 phenylacetamido-1, 2, 4-thiadiazol-2-yl) ethyl sulphide (BPTES; 25 μg/g body weight), dimethyl-α-ketoglutarate (dimethyl-αKG; 50 μg/g body weight) or α-cyano-4-hydroxycinnamic acid (MCT2 inhibitor, MCT2i; 60 μg/g body weight) were administered daily via intraperitoneal injection from P2.5 to P9.5. DCA, BPTES and dimethyl-αKG were dissolved in DMSO, α-cyano-4-hydroxycinnamic acid was dissolved in a mix containing 1.5% DMSO, 60% β-cyclodextrin, 35% polyethylene glycol and 5% ethanol and pH neutralized with NaOH. All components were from Sigma-Aldrich. For mouse experiments, researchers blinded to the group allocation performed analysis. Mice were bred in conventional conditions in our animal housing facility. All procedures involving animals and their care were approved by the Institutional Animal Care and Research Advisory Committee of the KU Leuven.
Southern blot analysis was used to assess the recombination efficiency and specificity in Phd2chon- mice. Genomic DNA was digested overnight with EcoR1. Fragments were separated on a 0.7% agarose gel, which was subsequently incubated for 30 minutes in denaturation buffer (0.5 M NaOH, 1.5 M NaCl), followed by 30 minutes in neutralization buffer (1.5 M NaCl, 0.5 M Tris-HCl pH 7.2, 1 mM EDTA). The gel was then soaked in 10x SSC solution for 10 minutes prior to capillary transfer overnight. The blot was incubated with a probe (PCR fragment from genomic sequence) which was labeled with 32P-CTP using the RedPrime II Random Prime labeling System (GE Healthcare) according to manufacturer’s instructions.
Cell culture
Isolation and culture of growth plate chondrocytes
Primary growth plate chondrocytes were isolated as described before27. Briefly, chondrocytes were isolated from growth plates of the proximal tibia and distal femur of 5-day-old mice. After removal of the perichondrium, isolated growth plates were pre-digested on a shaker for 30 minutes at room temperature with 0.1% collagenase type II (Gibco) dissolved in culture medium (DMEM/F12 medium supplemented with 10% fetal calf serum (FCS), 100 units/ml penicillin, 50 μg/ml streptomycin, 50 μg/ml ascorbic acid, and 100 μg/ml sodium pyruvate; all from Gibco). The remaining growth plate fragments were subsequently digested in 0.2% collagenase type II for 3 hours on an incubator shaker at 37°C. The obtained cell suspension of the second digest was filtered through a 40 μm nylon mesh and single cells were recovered by centrifugation. Primary chondrocytes were seeded at a density of 5.7×10⁵ cells/cm2 and medium was changed every other day. Cells were treated with DCA (1 mM), BPTES (5 μM), dimethyl-αKG (0.5 mM), MCT2i (1.5 mM), chloroquine (10 μM) or DMSO as vehicle-control.
Chondrocyte micromass cultures
To assess micromass mineralization, 2×10⁵ chondrocytes were seeded in a 10 μl droplet of growth medium and left to adhere for 2 hours. Subsequently, growth medium supplemented with 50 μg/ml ascorbic acid and 4 mM β-glycerophosphate (both Sigma-Aldrich) was added. After 6 days, micromasses were stained with Alizarin Red and Alizarin Red staining intensity was quantified by measuring absorbance at 405 nm after dye extraction with 10% acetic acid.
Primary osteoclast culture
For in vitro osteoclast formation, bone marrow cells (collected by flushing long bones) were plated overnight in αMEM containing 10% FCS, 100 units/ml penicillin and 50 μg/ml streptomycin (all from Gibco). Non-adherent cells were collected after 72 hours and plated in αMEM supplemented with 20 ng/ml macrophage colony-stimulating factor (M-CSF; Bio-Techne) and 100 ng/ml receptor activator of nuclear factor kappa-B ligand (RANKL; Peprotech) (i.e. day 1). At day 6, osteoclast differentiation was assessed by TRAP-staining. Cells were fixed in 4% paraformaldehyde for 10 minutes, followed by permeabilization with 0.1% Triton X-100 for 1 minute and incubation in 0.1 M sodium acetate containing naphtol AS-MX phosphate (Sigma-Aldrich), Fast Red violet LB salt (Sigma-Aldrich) and dimethylformamide (Merck). Positively stained cells containing 3 or more nuclei were considered as osteoclasts.
Periosteal cell culture
Skeletal progenitor cells from the periosteum were isolated as described before16. Briefly, stromal cells from the periosteum were released by a twofold collagenase-dispase digest (3 mg/ml collagenase and 4 mg/ml dispase) and cultured in αMEM with 2 mM glutaMAX™-1, containing 10% FCS, 100 units/ml penicillin and 50 μg/ml streptomycin (all from Gibco).
Isolation and culture of primary osteoblasts
Primary osteoblasts were isolated from the calvaria of 5-day-old mice or from the long bones of 8-week-old mice as previously described28. Primary calvarial osteoblasts were prepared by six sequential digestions in a collagenase-dispase mixture (3 mg/ml collagenase and 4 mg/ml dispase in αMEM with 2 mM glutaMAX™-1, containing 100 units/ml penicillin and 50 μg/ml streptomycin). Cells isolated in fractions 2 to 6 were pooled and cultured until confluence in αMEM with 2 mM glutaMAX™-1, containing 10% FCS, 100 units/ml penicillin and 50 μg/ml streptomycin. To isolate trabecular osteoblasts, long bones were first incubated in collagenase-dispase mixture for 20 minutes at 37°C to remove remaining periosteal cells. Next, epiphyses were cut away and bone marrow was flushed out. The remaining bone was cut into small pieces and trabecular osteoblasts were isolated by incubating the fragments with the collagenase-dispase mixture for 30 minutes at 37°C. Cells were passed through a 70 μm nylon mesh (BD Falcon), washed twice and cultured in αMEM with 2 mM glutaMAX™-1, containing 10% FCS, 100 units/ml penicillin and 50 μg/ml streptomycin.
Knockdown strategies
To silence HIF-1α (5’-CCGGTGGATAGCGATATGGTCAATGCTCGAGCATTGACCATATCGCTATCCATTTTTG-3’), GLS1 (5’-CCGGGAGGGAAGGTTGCTGATTATACTCGAGTATAATCAGCAACCTTCCCTCTTTTTG-3’) or PDK1 (5’-CCGGGCCTGTTAGATTGGCAAATATCTCGAGATATTTGCCAATCTAACAGGCTTTTTG-3’), we transduced cells in the presence of 8 μg/ml polybrene (Sigma-Aldrich) with a lentivirus carrying gene-targeting shRNA (MOI 25) as described before29,30. A nonsense scrambled shRNA sequence was used as negative control. To silence PHD2 in periosteal cells, we transduced cells isolated from Phd2fl/fl mice with an adenovirus carrying a Cre recombinase. An adenovirus carrying an empty vector was used as negative control. After 24 hours, virus-containing medium was changed to normal culture medium and 48 hours later, cells were used for further experiments.
RNA analysis
RNA was isolated and purified with the RNeasy Mini Kit (QIAGEN) according to the manufacturer’s instructions. cDNA was synthesized from 1 μg RNA using reverse transcriptase Superscript II RT (Thermo Fisher Scientific). Analysis of gene expression was performed by Taqman quantitative RT-PCR using custom-made primers and probes, or premade primer sets (Integrated DNA Technologies, Inc.). Expression levels were normalized relative to the expression of Hprt. For quantification of gene expression, ΔΔCt method was used. Sequences or premade primer set identification numbers are available upon request.
Protein analyses by Western blot and ELISA
For whole cell lysates, cells were rinsed with ice-cold PBS and lysed in a total cell lysis buffer (50 mM Tris-HCl pH 8.5, 150 mM NaCl, 0.1% SDS, 1% NP40, 1% sodium desoxycholate, supplemented with 1 mM PMSF, 5 μg/ml aprotinine, 5 μg/ml leupeptin and 0.33 μg/ml antipain). Nuclear protein fractions were prepared by lysing the cells first in a hypotonic buffer (20 mM Hepes pH 7.9, 10 mM KCl, 1.5 mM MgCl2, 1 mM EDTA, 0.5% NP40, 1 mM DTT, supplemented with 1 mM Na3VO4, 20 mM NaF, 1 mM PMSF, 5 μg/ml aprotinine, 5 μg/ml leupeptin and 0.33 μg/ml antipain) for 15 minutes at 4°C, followed by mechanical disruption of the cell membranes. Nuclei were pelleted from the lysates by centrifugation. The pellet was resuspended in a nuclear extraction buffer (50 mM Hepes pH 7.9, 500 mM NaCl, 1% NP40, supplemented with 1 mM PMSF, 5 μg/ml aprotinine, 5 μg/ml leupeptin and 0.33 μg/ml antipain) and after sonication incubated for 15 minutes at 4°C. Protein concentrations were determined with the BCA Protein Assay Reagent (Thermo Fisher Scientific).
Proteins were separated by SDS-PAGE under reducing conditions and transferred to a nitrocellulose membrane (GE Healthcare). Membranes were blocked with 5% dry milk or bovine serum albumin (Sigma-Aldrich) in Tris-buffered saline with 0.1% Tween-20 for 60 minutes at room temperature and incubated overnight at 4°C with primary antibodies against PHD2 (Bio-Techne), HIF-1α (Bio-Techne), HIF-2α (Abcam), phosphorylated AMPK (Threonin 172, p-AMPKT172; Cell Signaling Technologies), AMPK (Cell Signaling Technologies), Na+/K+ ATPase (Cell Signaling Technologies), LC3-II (Cell Signaling Technologies), C-MYC (Cell Signaling Technologies) BiP (Santa Cruz Biotechnologies), phosphorylated eIF2α (Cell Signaling Technologies), eIF2α (Cell Signaling Technologies), ATF4 (Santa Cruz Biotechnologies), ATF6 (Bio-Techne), COL2 (Merck), glutaminase 1 (GLS1; Abcam), GLS2 (Bio-Techne), phosphorylated mTOR (Serine 2448, p-mTORS2448; Cell Signaling Technologies), mTOR (Cell Signaling Technologies), phosphorylated p70 S6 kinase (Threonine 389, p-p70 S6KT389; Serine 371, p-p70 S6KS371; Cell Signaling Technologies), p70 S6K (Cell Signaling Technologies), phosphorylated S6 (Serine 235 and 236, S6S235/236; Cell Signaling Technologies), S6 (Cell Signaling Technologies), phosphorylated 4E-BP1 (Threonine 37/46, p-4E-BP1T37/46; Cell Signaling Technologies), 4E-BP1 (Cell Signaling Technologies), β-actin (Sigma-Aldrich) and Lamin A/C (Santa Cruz Biotechnologies). Signals were detected by enhanced chemiluminescence (Western Lightning Plus ECL; PerkinElmer) after incubation with appropriate HRP-conjugated secondary antibodies (Dako). Protein levels were quantified relative to loading control or non-phosphorylated protein.
Proliferation and apoptosis were quantified by ELISA assays. Proliferation was measured by 5’-bromo-2’-deoxyuridine (BrdU) incorporation, added during the last 4 hours, using the Cell Proliferation Biotrack ELISA system (GE Healthcare). Apoptosis was assessed using the Cell Death Detection ELISAplus kit (Sigma-Aldrich). All ELISAs were performed according to manufacturer’s instructions and values were normalized to the amount of DNA.
Metabolism assays
Glucose oxidation
For glucose oxidation29, cells were incubated for 5 hours in growth medium containing 0.55 μCi/ml [6-14C]-D-glucose (PerkinElmer). To stop cellular metabolism, 250 μl of a 2 M perchloric acid solution was added and wells were covered with a Whatman paper soaked with 1x hyamine hydroxide. 14CO2 released during the oxidation of glucose was absorbed into the paper overnight at room temperature. Radioactivity in the paper was determined by liquid scintillation counting, and values were normalized to DNA content.
Glutamine oxidation
Cells were incubated for 6 hours in growth medium containing 0.5 μCi/ml [U-14C]-glutamine (PerkinElmer)29. Thereafter, 250 μl of 2 M perchloric acid was added to each well to stop cellular metabolism and 14CO2 was collected as described above for glucose oxidation.
Fatty acid oxidation
Palmitate β-oxidation29 was measured after incubation of the cells with 2 μCi/ml [9,10-3H]-palmitic acid (PerkinElmer) for 2 hours. Then, the culture medium was transferred into glass vials sealed with rubber caps. 3H2O was captured in hanging wells containing a Whatman paper soaked with H2O over a period of 48 hours at 37°C. Radioactivity in the paper was determined by liquid scintillation counting, and values were normalized to DNA content.
Glycolysis
For measurement of the glycolytic flux29, cells were incubated for 2 hours in growth medium containing 0.4 μCi/ml [5-3H]-D-glucose (PerkinElmer). 3H2O was captured and measured analogously to fatty acid oxidation.
Oxygen consumption
The oxygen consumption rate29 was quantified using an XF24 analyzer (Seahorse Bioscience Europe). Cells were seeded on Seahorse XF24 tissue culture plates. The assay medium was unbuffered DMEM supplemented with 5 mM D-glucose and 2 mM L-glutamine, pH 7.4 (all from Gibco). The measurement of oxygen consumption was performed during 10 minute-intervals (2 minutes mixing, 2 minutes recovery, 6 minutes measuring) for 3 hours, and values were normalized to DNA content.
Glucose consumption and lactate production
Lactate and glucose concentration in conditioned culture medium was measured using a Dimension analyzer (Siemens Healthcare Diagnostics) and results were normalized to DNA content.
Energy levels
For determination of energy charge and status, cells were harvested in ice cold 0.4 M perchloric acid supplemented with 0.5 mM EDTA. ATP, ADP and AMP were measured using ion-pair reversed phase high-performance liquid chromatography (HPLC) as previously described29,30. Energy balance was calculated as ([ATP] + ½ [ADP]) / ([ATP] + [ADP] + [AMP]) and energy status was determined as the ratio of ATP over AMP. Intracellular ATP levels were also measured using the ATPlite ATP detection assay (PerkinElmer) according to the manufacturer’s instructions, and values were normalized to DNA content.
Mass spectrometry
For 13C-carbon incorporation from glucose and glutamine in metabolites, cells were incubated for 72 hours with 13C6-glucose or 13C5-glutamine (both from Sigma-Aldrich). Metabolites for subsequent mass spectrometry (MS) analysis were prepared by quenching the cells in liquid nitrogen follow by a cold two-phase methanol-water-chloroform extraction29,31,32. Phase separation was achieved by centrifugation at 4 °C. The methanol-water phase containing polar metabolites was separated and dried using a vacuum concentrator. Dried metabolite samples were stored at −80 °C.
Gas chromatography-mass spectrometric analysis
Polar metabolites were derivatized and measured as described before29,31,32. In brief, polar metabolites were derivatized with 20 mg/ml methoxyamine in pyridine for 90 minutes at 37 °C and subsequently with N-(tert-butyldimethylsilyl)-N-methyl-trifluoroacetamide, with 1% tert-butyldimethylchlorosilane for 60 minutes at 60 °C. Metabolites were measured with a 7890A GC system (Agilent Technologies) combined with a 5975C Inert MS system (Agilent Technologies). One microliter of sample was injected in splitless mode with an inlet temperature of 270 °C onto a DB35MS column. The carrier gas was helium with a flow rate of 1 ml/min. For the measurement of polar metabolites, the GC oven was held at 100 °C for 3 minutes and then ramped to 300 °C with a gradient of 2.5 °C/min. The MS system was operated under electron impact ionization at 70 eV and a mass range of 100–650 atomic mass units (amu) was scanned. Mass distribution vectors were extracted from the raw ion chromatograms using a custom Matlab M-file, which applies consistent integration bounds and baseline correction to each ion. Moreover, we corrected for naturally occurring isotopes. Total contribution of carbon was calculated using the following equation33:
where n is the number of C atoms in the metabolite, i represents the different mass isotopomers and m refers to the abundance of a certain mass. For metabolite levels, arbitrary units of the metabolites of interest were normalized to an internal standard and DNA content.
Liquid chromatography-mass spectrometric analysis
For assessing glutamine consumption, glutamine levels were measured in conditioned medium using liquid chromatography-mass spectrometry. Polar metabolites were measured as described before34. Polar metabolites were resuspended in 60% acetonitrile. Targeted measurements of polar metabolites were performed with a 1290 Infinity II HPLC (Agilent) coupled to a 6470 triple quadrupole mass spectrometer (Agilent). Samples were injected onto a iHILIC-Fusion(P) column. The solvent, composed of acetonitrile and ammonium acetate (10 mM, pH 9.3), was used at a flow rate of 0.100 ml/min. Data analysis was performed with the Agilent Mass Hunter software. Metabolite levels were normalized to DNA content.
Mitochondrial content
The mitochondrial content was analysed after rhodamine labelling by confocal microscopy on a Zeiss LSM 510 META system (Zeiss) as described before35. Briefly, chondrocytes were seeded on coverslips and pulse-loaded with 200 μM rhodamine 123 (Thermo Fisher Scientific) for 40 seconds at room temperature. After loading, cells were thoroughly washed with HEPES-Tris medium (132 mM NaCl, 4.2 mM KCl, 1 mM CaCl2, 1 mM MgCl2, 5.5 mM D-glucose and 10 mM HEPES pH 7.4) before mounting coverslips with Fluomount (Dako).
Collagen analysis
Protein translation
Collagen, proteoglycan or total protein synthesis was quantified in vitro, by incubation of cultured chondrocytes with 20 uCi/ml 3H-proline (PerkinElmer), 35S-sulphate (PerkinElmer) or 35S-methionine (MP Biomedicals), respectively, as described before36,37. Briefly, after overnight labelling, cells were lysed in extraction buffer (11% acetic acid H2O with 0.25% BSA) to quantify collagen and total protein synthesis and proteins were precipitated by the addition of 20% trichloroacetic acid. For the analysis of proteoglycan synthesis, cells were lysed in 0.2 M NaOH and proteoglycans were precipitated with 1% cetylpyridinium chloride. Radioactivity was determined by liquid scintillation counting, and normalized for DNA content.
Collagen content
Intact type II collagen α-chains were solubilized using a guanidine-based extraction method. Briefly, growth plates were cut into smaller pieces, washed with 150 mM NaCl, 0.05 M Tris-HCl pH 7.5 and proteoglycans were solubilized with 4 M guanidine HCl, 0.05 M Tris-HCl pH 7.5, with protease inhibitors (1 mM PMSF, 5 μg/ml aprotinine, 5 μg/ml leupeptin and 0.33 μg/ml antipain) for 24 hours at 4°C. Collagens were solubilized with 1mg/ml pepsin in 3% acetic acid for 24 hours at 4°C. After centrifugation, supernatant was dialyzed against 0.4 M NaCl, 0.01 M EDTA, 0.05 M Tris-HCl pH 7.5 two times for 24 hours at 4°C, collagen α-chains were resolved by SDS-PAGE and afterwards stained with Coomassie Blue R-250 (Sigma-Aldrich).
Collagen hydroxylation analysis using electrospray MS
Preparation of type I and type II collagens from adult bone and neonatal growth plates was performed as described in Weiss et al38. Briefly, bone was demineralized in 0.1 M HCl at 4°C, washed, and solubilized by heat denaturation in SDS-PAGE sample buffer. For the growth plate, proteoglycans were removed with 4 M guanidine HCl, 0.05 M Tris-HCl, pH 7.5 with protease inhibitors (5 mM 1,10-phenanthroline and 2 mM PMSF) for 24 hours at 4°C and the residue was washed thoroughly. Collagens were solubilized with pepsin (1:20, pepsin/dry tissue) in 3% acetic acid for 24 hours at 4°C, and were run on 6% SDS-PAGE gels. After in-gel trypsin digestion, electrospray MS was performed using an LTQ XL ion-trap mass spectrometer equipped with in-line liquid chromatography (Thermo Fisher Scientific) using a C4 5 μm capillary column (300μm x 150mm; Higgins Analytical RS-15M3-W045) eluted at 4.5 μl/min. Proteome Discoverer search software (Thermo Fisher Scientific) was used for peptide identification using the NCBI protein database. Proline and lysine modifications were examined manually by scrolling or averaging the full scan over several minutes so that all of the post-translational variations of a given peptide appeared together in the full scan.
Hydroxyproline content
Hydroxyproline content was quantified by a colorimetric protocol as described by Creemers et al39. Briefly, neonatal growth plates or cultured cells were hydrolysed for 3.5 hours at 135°C in 6 N HCl. To distinguish between hydroxyproline content in cell extracts and extracellular matrix of cultured cells, we detached cells with 10 mM NaHPO4, 150 mM NaCl and 0.5% Triton X-100 and hydrolysis was subsequently performed on either the cell extract or the deposited matrix. Thereafter, samples were vacuum-evaporated and dissolved in demineralized water. Next, hydroxyproline residues were oxidized by adding chloramine-T, followed by the addition of Ehrlich’s aldehyde reagent and incubation of the samples at 65°C for chromophore development. A standard curve was made to calculate the absolute amount of hydroxyproline per sample, which was finally normalized to tissue wet weight. To assess collagen-resistance to MMP-mediated degradation, neonatal growth plates or crushed metaphyseal bone was incubated with MMP9 (0.4 ng/μl; Bio-Techne) or MMP-13 (0.2 ng/μl; Bio-Techne) for 24 hours at 37°C prior to hydrolysis of remaining tissue and supernatant.
Cartilage collagen cross-link analysis
Collagen cross-link analysis was performed by HPLC on growth plates isolated from 5-day-old mice after acid hydrolysis as previously described40. The amount of collagen cross-links was normalized for tissue wet weight.
Intracellular Ca2+ measurements
The intracellular Ca2+ concentration [Ca2+]i was measured using the ratiometric fluorescent Ca2+ dye Fura2-AM (Thermo Fisher Scientific) and the FlexStation3 (Molecular Devices) as previously described41,42. The Ca2+ content of the ER was measured by applying thapsigargin (2 μM; Sigma-Aldrich) in the presence of 3 mM EGTA (a cell-impermeable Ca2+ chelator, added 30 seconds prior to thapsigargin treatment) and quantifying the rise in F340/F380. Normalized Ca2+-rise (R) in the cytosol of cultured chondrocytes was calculated as (R-R0)/R0. The basal F340/380 signals were calibrated to obtain basal cytosolic [Ca2+] as described before43. The total Ca2+-loading capacity of the endoplasmic reticulum (ER) in the presence of exogenously added Mg/ATP (5 mM) and mitochondrial inhibitors (10 mM NaN3) was analyzed in plasma membrane-permeabilised chondrocytes using unidirectional 45Ca2+ uptake (0.3 MBq/ml) experiments performed as described before44, allowing direct access to ER Ca2+ stores. The ER 45Ca2+ loading capacity was normalized to protein content.
Transmission electron microscopy and Fourier transform infrared microscopy
Transmission electron microscopy of the epiphyseal growth plate was performed following standard procedures45. Briefly, growth plates isolated from neonatal mice were fixed in 2.5% glutaraldehyde in 0.1 M Na-cacodylate buffer pH 7.3. Next, the growth plate were post-fixed in 2% osmiumtetroxide in Na-cacodylate buffer, followed by dehydration in a graded ethanol series and staining with 1% uranyl acetate in 70% ethanol. Following further dehydration, the samples were impregnated overnight in a desiccator with freshly prepared Agar 100 (EPON 812 medium), initiated by means of a graded propylene oxide – Agar 100 series. Consequently, samples were transferred to freshly prepared Agar 100 and placed in a desiccator for 6 hours. Ultra-thin sections (70 nm) were made, positioned on a copper grid, and contrasted with 4% uranyl acetate and lead citrate. TEM images were made on a JEOL JEM 2100 electron microscope (JEOL) at 200 kV.
Fourier transform infrared microscopy (FTIR) data were acquired from methyl metacrylate (MMA) tibia sections of neonatal mice, mounted on CaF2 windows, on a Bruker IFS66 spectrometer equipped with an IR microscope and liquid nitrogen cooled mercury cadmium telluride detector. Collagen content in the growth plate was calculated from the integrated area of the amide I absorption peak (1590–1695 cm−1), after baseline correction for the absorption spectrum of MMA.
Ectopic bone ossicle model
As a model for endochondral ossification, we used a recently described ectopic bone ossicle model16. Briefly, periosteal cells were isolated and cultured in αMEM with 2 mM glutaMAX™-1, containing 10% FCS, 100 units/ml penicillin and 50 μg/ml streptomycin supplemented with 5 U/ml heparin (LEO Pharma) and 5 ng/ml human recombinant fibroblast growth factor 2 (FGF 2) (R&D Systems) to induce chondrogenic differentiation upon implantation. At passage 3, FGF2-pretreated periosteal cells were embedded in a type I collagen gel (5 mg/ml in PBS; Corning GmbH) at a density of 1×10⁷ cells/ml, and 100 μl was injected subcutaneously as previously described16. Three weeks after implantation, bone ossicles were collected, fixed in 2% paraformaldehyde, and processed for microCT and histological analysis.
MicroCT
We performed microCT analysis of mineralized bone mass using a desktop micro-tomographic image system and related software, as described before46. Briefly, tibias were scanned using the SkyScan 1172 microCT system (Bruker) at a pixel size of 5 μm with 50 kV tube voltage and 0.5 mm aluminum filter. Projection data was reconstructed using the NRecon software (Bruker), trabecular and cortical volumes of interest were selected manually and 3D morphometric parameters were calculated using CT Analyzer software (Bruker) according to the guidelines of the American Society for Bone and Mineral Research47.
DEXA
Body composition (lean body mass and total fat mass) was analysed in vivo by DEXA (PIXImus densitometer; Lunar Corp.) using ultra high resolution (0.18 × 0.18 pixels, resolution of 1.6 line pairs/mm) and software version 1.4548.
Serum biochemistry
Serum osteocalcin was measured by an in-house radioimmunoassay49. Serum CTx-I and CTx-II levels were measured by a RatLaps and Serum Preclinical Cartilaps ELISA kit (Immunodiagnostic Systems), respectively.
(Immuno)Histochemistry and histomorphometry
Histochemical staining
Histomorphometric analysis of murine long bones was performed as previously described3,27. Briefly, osteoblasts were quantified on H&E-stained sections, whereas osteoclasts were visualized on TRAP-stained sections. Unmineralized (osteoid) and mineralized bone matrix was quantified on Goldner or Von Kossa-stained sections, respectively. To analyze dynamic bone parameters, calcein (16 mg/kg body weight; Sigma-Aldrich) was administered via intraperitoneal injection 4 days and 1 day prior to sacrifice. Cartilage matrix proteoglycans were visualized by Safranin O staining. To detect apoptosis, TUNEL staining was performed on paraffin-embedded sections with an In Situ Cell Death Detection Kit (Roche). Sections were permeabilised for 2 minutes on ice in 0.1% sodium citrate containing 0.1% Triton X-100. TUNEL reaction mixture was applied for 1 hour at 37°C. Sections were counterstained with Hoechst to visualize nuclei.
Immunohistochemical staining
To visualize hypoxic regions or cell proliferation29, mice were injected with pimonidazole (Hypoxyprobe-1 PLUS Kit, Natural Pharmacia International; 60 μg/g body weight) or BrdU (Harlan SeraLab; 150 μg/g body weight), respectively, prior to sacrifice. Immunohistochemical staining conditions were slightly adapted according to the type of tissue and the antibody used. Generally, paraffin sections were de-waxed, rehydrated, incubated with Antigen Retrieval Solution (Dako) and washed in TBS. Endogenous peroxidase activity was blocked by immersing the sections in 0.3% H2O2 in methanol for 20 minutes. Unspecific antibody binding was blocked by incubation of the sections in 2% BSA-supplemented TBS for 30 minutes. Subsequently, sections were incubated overnight with primary antibody against pimonidazole (hypoxic regions), COL1 (bone; Bio-Techne), COL2 (cartilage; Chemicon), BrdU (proliferating cells), BiP (UPR), ATF6 (UPR) or p-S6S235/236 (mTOR signalling). Signal visualization was generally obtained using fluorophore-labelled secondary antibodies or through a biotin-HRP streptavidin mediated reaction. For COL2 immunostaining, sections were pre-digested with 0.025% pepsin in 0.2 N HCl for 10 minutes at 37°C, fixed in 4% paraformaldehyde, treated with 0.2% Triton X-100 and quenched in 50 mM NH4Cl prior to incubation with the primary antibody. Hoechst staining was used to visualize cell nuclei.
Bone histomorphometry
Images were acquired on an Axioplan 2 microscope (Zeiss) and histomorphometric analyses were performed using related Axiovision software (Zeiss). Data were expressed according to the American Society for Bone and Mineral Research standardized histomorphometry nomenclature50.
In situ hybridization
Plasmids containing cDNA fragments used as probes for Col2 (F. Luyten, KU Leuven), Col10 (H.M. Kronenberg, Harvard Medical School), Ihh (U.I. Chung, Massachusetts General Hospital) and Pthrp (U.I. Chung) were generously provided. After linearization of the plasmid downstream of the inserted cDNA fragment, sense and antisense riboprobes were obtained by in vitro transcription with T7 TNA polymerase according to the manufacturer’s instructions. 35S-labeled riboprobes were generated according to Wilkinson et al. The probes were subjected to limited alkaline hydrolysis to obtain fragments of an average length of 350 nucleotides.
Radioactive in situ hybridization was carried out on paraformaldehyde-fixed paraffin sections using the protocol described by Wilkinson et al. with minor modifications. The paraffin sections were de-waxed, fixed in 4% paraformaldehyde, treated with 20 μg/ml proteinase K, fixed again, incubated in 0.1% NaBH4 in PBS and acetylated in a solution of 0.1 M triethanolamine with 2.5 μg/ml acetic anhydride. The sections were hybridized overnight at 55°C with 35S-labeled denatured probes at a final activity of 105 cpm/μl, followed by a high stringency wash at 62°C. After several washes, the sections were treated with 20 μg/ml ribonuclease A at 37°C for 30 minutes. Finally, the sections were dehydrated, air-dried and coated with autoradiography emulsion type NTB (Kodak) diluted 1:1 with 2% glycerol for autoradiography. The exposure time (at 4°C in a light-safe box) varied from one to several days depending on the probe. Bright field and dark field images were taken on an Axioplan 2 microscope (Zeiss) and were superimposed and pseudo-coloured with Adobe Photoshop.
Statistics
Data are presented as means ± SEM or means ± SD. n values represent the number of independent experiments performed or the number of individual mice phenotyped. For each independent in vitro experiment, at least three technical replicates were used. For immunoblots, representative images were shown of at least three independent experiments using samples from different mice/cell lysates. No statistical methods were used to pre-determine sample size for in vitro experiments. For in vivo experiments, sample size was based on results from previous studies. Data were analysed by two-sided two-sample Student’s t-test, and one-way ANOVA with Tukey-Kramer post-hoc test using the NCSS statistical software. Differences were considered statistically significant at p<0.05.
Extended Data
Extended Data Figure 1. Phenotype of Phd2chon- mice.
(a) Southern blot analysis showing efficient and selective recombination (black arrowhead) of the Phd2 gene in neonatal (P2.5) growth plate tissue from Phd2chon- mice. Representative images of 3 independent experiments are shown. (b) Phd1, Phd2 and Phd3 mRNA levels in neonatal growth plates (n= independent samples from 11 Phd2chon+ and 10 Phd2chon- mice). (c-d) Immunoblot of PHD2 and β-actin (c), and of HIF-1α, HIF-2α and Lamin A/C (d) levels in growth plate tissue (c) and cultured chondrocytes (d). Representative images of 4 independent experiments are shown. (e) Quantification of tibia length (n=11 Phd2chon+ − 8 Phd2chon- mice), body weight (n=11 Phd2chon+ − 8 Phd2chon- mice), lean body mass (n=4 mice) and fat mass (n=4 mice) of adult (14-week-old) mice. (f) Growth-related phenotype in adult Phd2chon- mice. (g) Sox9, Col2, Col10, Pthrp, Ihh, Mmp9, Mmp13 and Opn mRNA levels in neonatal growth plates (n= independent samples from 11 Phd2chon+ and 10 Phd2chon- mice). (h) In situ hybridization for Col2, Col10, Pthrp and Ihh on neonatal growth plates (n=4 biologically independent samples; scale bar is 250 μm). (i) Quantification of trabecular number (Tb.N; for P2.5, n=10 mice, for 14 weeks, n=11 Phd2chon+ − 8 Phd2chon- mice) and thickness (Tb.Th; for P2.5, n=10 mice, for 14 weeks, n=11 Phd2chon+ − 8 Phd2chon- mice), cortical thickness (Ct.Th; for P2.5, n=10 mice, for 14 weeks, n=11 Phd2chon+ − 8 Phd2chon- mice), calvarial thickness (calv.Th; n=4 mice) and porosity (calv.Po; n=4 mice) in neonatal and adult mice. Nd is not determined. (j) Quantification of osteoblast number (N.Ob/B.S; n=4 Phd2chon+ − 5 Phd2chon- mice), osteoblast surface (Ob.S/B.S; n=4 Phd2chon+ − 5 Phd2chon- mice) and osteoid surface per bone surface (O.S/B.S; n=6 mice), bone formation rate (BFR; n=4 mice), mineral apposition rate (MAR; n=4 mice), osteoclast surface per bone surface (Oc.S/B.S; n=11 Phd2chon+ − 7 Phd2chon- mice), blood vessel number per tissue surface (N.BV/T.S; ; n=9 Phd2chon+ − 6 Phd2chon- mice), and serum osteocalcin (OCN; n=16 biologically independent samples), CTx-I (n=8 biologically independent samples) and CTx-II levels (n=9 biologically independent samples) in adult mice. (k-l) Representative images of TRAP-positive multinuclear cells formed after one week of culture (k) with quantification (l) of the number of osteoclasts formed per well (n=4 biologically independent samples; scale bar is 50 μm). Quantification was based on the number of nuclei per osteoclast. (m) Type I collagen (COL1) and COL2 immunostaining of the metaphysis of neonatal mice (n=8 mice). Scale bar is 100 μm. (n) Quantification of the cell/extracellular matrix (ECM) ratio in two zones of the growth plate (n=8 mice). Data are means ± SEM in (c, d, l), or means ± SD in (b, e, g, i, j, n). *p<0.05 vs. Phd2chon+, **p<0.01 vs. Phd2chon+, ***p<0.001 vs. Phd2chon+ (two-sided Student’s t-test). Exact p values: 0.000000001 (Phd2; b), 0.00000002 (Phd3; b), 0.00003 (c), 0.0014 (HIF-1α; d), 0.00005 (tibia length; e), 0.019 (body weight; e), 0.00003 (Tb.N P2.5; i), 0.003 (Tb.N 14 weeks; i), 0.006 (Tb.Th P2.5; i), 0.037 (Tb.Th 14 weeks; i) or 0.02 (Serum CTx-II; j).
Extended Data Figure 2. Metabolic alterations in PHD2-deficient chondrocytes.
(a) Rhodamine labelling of mitochondria, with quantification of mitochondrial content (n= samples from 3 Phd2chon+ and 4 Phd2chon- mice). Yellow line denotes cell membrane. (b-c) Immunoblot of C-MYC (b), LC3-II (c) and β-actin levels in cultured chondrocytes. Representative images of 4 independent experiments are shown. (d) Oxygen consumption in cultured chondrocytes (n=9 biologically independent samples). (e) Pimonidazole immunostaining on neonatal (P2.5) growth plates, with a higher magnification of the boxed area and quantification of pimonidazole-positive cells within the growth plate (n=4 mice). (f) Glucose oxidation (GO), fatty acid oxidation (FAO) and glutamine oxidation (QO) in cultured chondrocytes (n=6 biologically independent samples). (g) Glucose (Glc) uptake and lactate (Lac) secretion (n=6 biologically independent samples). (h) Glycolytic flux (n=6 biologically independent samples). (i) Fractional contribution of 13C6- Glc to Lac, citrate (Cit), α-ketoglutarate (αKG), succinate (Suc), fumarate (Fum) and malate (Mal) (n=6 biologically independent samples). (j-l) ATP content (j), energy charge ([ATP] + ½ [ADP] / [ATP] + [ADP] + [AMP]; k), and energy status (ratio of ATP to AMP levels; l) (n=6 biologically independent samples). (m) Apoptosis rate of cultured chondrocytes (n=4 independent experiments). (n) TUNEL immunostaining of neonatal growth plates (n=6 mice). (o) ATP production resulting from glycolysis, GO, FAO and QO in cultured chondrocytes (n=6 biologically independent samples. (p) Proliferation rate of cultured chondrocytes (n=4 independent experiments). (q) Immunoblot of Na+/K+ ATPase and β-actin levels. Representative images of 3 independent experiments are shown. (r) Normalized Ca2+-rise in the cytosol of cultured chondrocytes upon stimulation with thapsigargin (TG) in the presence of EGTA (n=4 biologically independent samples). (s) Quantification of the Ca2+ release from the endoplasmic reticulum (ER) upon stimulation with TG (n=4 biologically independent samples). (t) 45Ca2+ loading capacity of the ER of permeabilised chondrocytes in intracellular-like medium supplemented with 5 mM Mg/ATP and 45Ca2+ (n=4 biologically independent samples). (u-v) Total protein (u) and proteoglycan synthesis (v) (n=8 biologically independent samples). Data are means ± SEM in (a-d, f-m, o-v), or means ± SD in (e, n). *p<0.05 vs. Phd2chon+, **p<0.01 vs. Phd2chon+, ***p<0.001 vs. Phd2chon+ (two-sided Student’s t-test), §p<0.05 vs. Phd2chon+-veh (ANOVA). Exact p values: 0.03 (a); 0.016 (b); Phd2chon+-veh vs. Phd2chon--veh 0.0004 (c); Phd2chon+-veh vs. Phd2chon--chloroquine 0.0002 (c); 0.000002 (d); 0.0005 (e); 0.00003 (GO; f); 0.000004 (FAO; f); 0.00001 (Glc; g); 0.000001 (Lac; g); 0.0007 (h); 0.00002 (Lac; i); 0.000002 (Cit; i); 0.000001 (αKG; i); 0.00009 (Suc; i); 0.011 (Fum; i); 0.004 (Mal; i); 0.000001 (j); 0.00005 (k); 0.00000001 (l); 0.0007 (p); 0.012 (q); 0.0003 (s); 0.0002 (u); 0.003 (v). Scale bar in (a) is 10 μm, and scale bars in (e, n) are 250 μm.
Extended Data Figure 3. HIF-1α silencing in PHD2-deficient chondrocytes.
(a) Expression of indicated genes in cultured chondrocytes, transduced with scrambled shRNA (shScr; -) or shRNA against HIF-1α (shHIF-1α) (n=3 biologically independent samples). (b) HIF-1α and Lamin A/C immunoblot of cultured chondrocytes, transduced with shScr or shHIF-1α. Representative images of 3 independent experiments are shown. (c-f) Oxygen consumption (c), glycolytic flux (d), energy charge (e) and energy status (f) of cultured chondrocytes, transduced with shScr or shHIF-1α (n=6 biologically independent samples). (g) P-AMPKT172 and AMPK immunoblot with quantification of p-AMPKT172 to AMPK ratio in cultured chondrocytes, transduced with shScr or shHIF-1α. Representative images of 3 independent experiments are shown. (h-i) Proliferation (h) and collagen synthesis (i) in cultured chondrocytes, transduced with shScr or shHIF-1α (n=6 biologically independent samples). (j-k) BiP (j), cleaved (c)ATF6 (k) and β-actin immunoblot of cultured chondrocytes, transduced with shScr or shHIF-1α. Representative images of 3 independent experiments are shown. (l-m) Hydroxyproline (OH-Pro) (l; n=6 biologically independent samples) and α-ketoglutarate (αKG) levels (m; n=5 biologically independent samples) in cultured chondrocytes, transduced with shScr or shHIF-1α. Data are means ± SEM. #p<0.05 (ANOVA), §p<0.05 vs. Phd2chon+-shScr, °p<0.05 vs. Phd2chon--shScr (ANOVA). Exact p values: Phd2chon+-shScr vs. Phd2chon+-shHIF-1α 0.0003 (b) or 0.002 (c); Phd2chon+-shScr vs. Phd2chon--shScr 0.050 (b), 0.0000002 (c), 0.00003 (d), 0.004 (e), 0.000002 (f), 0.050 (g), 0.00002 (h), 0.00005 (i), 0.004 (j), 0.03 (k), 0.00012 (l) or 0.00005 (m); Phd2chon--shScr vs. Phd2chon--shHIF-1α 0.045 (b), 0.00010 (c), 0.00011 (d), 0.0010 (e), 0.000012 (f), 0.03 (g), 0.00005 (h), 0.00010 (i), 0.004 (j), 0.006 (k), 0.00001 (l) or 0.0008 (m).
Extended Data Figure 4. mTOR signalling and the unfolded protein response in PHD2-deficient chondrocytes.
(a) Immunoblot and quantification of phosphorylated (at Serine 2448) mTOR (p-mTORS2448), mTOR, phosphorylated (at Threonine 389 and Serine 371) p70 S6 kinase (p-p70 S6KT389 and p-p70 S6KS371), p70 S6K, phosphorylated (at Serine 235 and 236) S6 (p-S6S235/236) and S6, phosphorylated (at Threonine 37 and 46) 4E-BP1 (p-4E-BP1T37/46), 4E-BP1 and β-actin in cultured chondrocytes. Representative images of 3 independent experiments are shown. (b-c) p-S6S235/236 immunostaining on neonatal (P2.5) growth plates (b), with a higher magnification of the boxed area and quantification (c) of the p-S6+ area (n=6 mice). GP is growth plate, PS is primary spongiosa. (d) Immunoblot of p-S6S235/236 and S6 in cultured chondrocytes. Cells were either cultured in full medium or in nutrient-deprived conditions (PBS), and then switched to full medium for indicated times. Representative images of 3 independent experiments are shown. These data show the absence of enhanced mTOR signalling. (e) Immunoblot and quantification of BiP, (p-)eIF2α, ATF4 and cleaved (c)ATF6 protein levels. Representative images of 3 independent experiments are shown. (f) Spliced Xbp-1 (Xbp-1s) mRNA levels in neonatal growth plates (n=8 biologically independent samples). (g-h) BiP and cATF6 immunostaining (g) of neonatal growth plates with quantification (h) of the percentage of positive cells (n=6 mice). Data are means ± SEM in (a, d, e), or means ± SD in (c, f, h). *p<0.05 vs. Phd2chon+, **p<0.01 vs. Phd2chon+, ***p<0.001 vs. Phd2chon+ (two-sided Student’s t-test), §p<0.05 vs. Phd2chon+-full medium, °p<0.05 vs. Phd2chon+-full medium 0.5 h (ANOVA). Exact p values: Phd2chon+-full vs. Phd2chon+-PBS 0.003 (d); Phd2chon+-full vs. Phd2chon--PBS 0.005 (d), Phd2chon+-full vs. Phd2chon−−0.5 h 0.03 (d); Phd2chon+−0.5 h vs. Phd2chon−−0.5 h 0.04 (d); 0.04 (BiP; e); 0.02 (p-eIF2a; e); 0.0005 (ATF4; e); 0.02 (cATF6; e); 0.002 (f); 0.00005 (BiP; h); 0.000009 (cATF6; h). Scale bars are 250 μm.
Extended Data Figure 5. PHD2 controls type II collagen (COL2) modifications.
(a) COL2 protein levels in neonatal (P2.5) growth plates, visualized by COL2 Western Blot. Protein loading was normalized to growth plate weight. Representative images of 2 experiments, each with 2 biologically independent replicates, are shown. (b) COL2 immunostaining of extracellular matrix produced by cultured chondrocytes and after removal of cells, with quantification of the COL2 positive area (n=4 mice). (c) Amide I peak (area under the curve, AUC), representing collagen, from FT-IR spectra of neonatal growth plates (n= samples from 8 Phd2chon+ and 6 Phd2chon- mice). (d) Transmission electron microscopy images of the collagen network in neonatal growth plates (n=3 mice). (e) Increase in hydroxylation and/or glycosylation (as %) of proline (Pro) and lysine (Lys) residues in type II collagen of Phd2chon- mice compared to Phd2chon+ mice (n=4 biologically independent samples). Glcgal is glucosyl-galactosyl. (f) Total, intracellular and extracellular hydroxyproline (OH-Pro) content of cultured chondrocytes (n=4 biologically independent samples). (g) Von Kossa staining of neonatal growth plates, with quantification of the percentage mineralized matrix (n=8 mice, boxed areas are enlarged). (h-i) Micromass mineralization, as evidenced by Alizarin Red (AR) staining (h), with quantification of AR intensity (i) (n=5 biologically independent samples) showing that increased matrix mineralization is not caused by HIF-1α-induced changes in mineralization capacity. (j) Expression of genes involved in mineralization (Ank, Tnap, Enpp1 and Spp1) is not changed in neonatal growth plates (n=6 biologically independent samples). (k) Phd2 mRNA levels in cultured periosteum-derived cells (PDC), calvarial osteoblasts (calv. OB) and trabecular (trab.) OB (n=4 biologically independent samples). (l) Change in hydroxylation and/or glycosylation (as %) of proline (OH-Pro) and lysine (OH-Lys) residues in type I collagen of Phd2chon- mice compared to Phd2chon+ mice (n=4 biologically independent samples). (m) OH-Pro levels in cultured PDC, and calvarial and trabecular osteoblasts (n=4 biologically independent samples). (n) OH-Pro content in bone tissue and supernatant, after incubation with MMP9 or MMP13 (n=4 biologically independent samples). (o) Fractional contribution of 13C5-glutamine (Gln) to proline (n=3 biologically independent samples). (p) Intracellular proline levels in cultured Phd2chon+ and Phd2chon- chondrocytes (n=3 biologically independent samples). Data are means ± SD in (a, c, g, j), or means ± SEM in (b, f, i, k-p). *p<0.05 vs. Phd2chon+, **p<0.01 vs. Phd2chon+, ***p<0.001 vs. Phd2chon+ (two-sided Student’s t-test), #p<0.05 (ANOVA). Exact p values: 0.0003 (a); 0.02 (b); 0.006 (c); 0.0018 (Pro459; e); 0.008 (Pro744; e); 0.014 (Pro795; e); 0.015 (Pro826; e); 0.016 (Pro945; e); 0.00015 (Pro966; e); 0.008 (Pro986; e); 0.019 (Lys87; e); 0.002 (total; f); 0.0014 (extra; f); 0.012 (g); vehicle vs. Phd2chon+ 0.0002 (i); IOX2 vs. Phd2chon- 0.0001 (i); Phd2chon+ vs. Phd2chon- 0.004 (i); 0.015 (Pro1011; l); 0.012 (Lys174; l). Scale bar in (b) is 50 μm, 0.5 μm in (d), and 100 μm in (g).
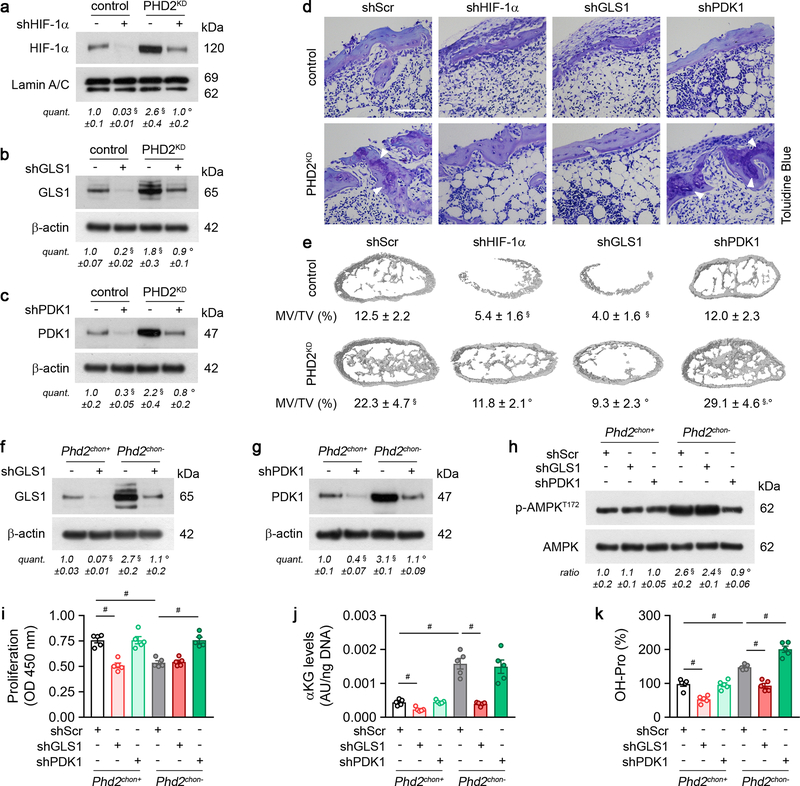
Extended Data Figure 6. Genetic confirmation of HIF-1α signalling and metabolic adaptations.
(a-c) Immunoblot of HIF-1α (a), GLS1 (b), PDK1 (c), Lamin A/C and β-actin in cultured control or PHD2-deficient (PHD2KD) periosteal cells, transduced with scrambled shRNA (shScr; -) or gene-specific shRNAs. Representative images of 3 independent experiments are shown. (d) Toluidine Blue staining of bone ossicles (n=5 biologically independent samples). Arrowheads indicate cartilage remnants (scale bar is 100 μm). (e) 3D CT models of bone ossicles, with quantification of the mineralized tissue volume (MV/TV) (n=5 biologically independent samples). (f-g) Immunoblot of GLS1 (f), PDK1 (g), and β-actin in cultured chondrocytes, transduced with shScr or gene-specific shRNAs. Representative images of 3 independent experiments are shown. (h) P-AMPKT172 and AMPK immunoblot with quantification of p-AMPKT172 to AMPK ratio in cultured chondrocytes, transduced with shScr or gene-specific shRNAs. Representative images of 3 independent experiments are shown. (i-k) Proliferation (i), α-ketoglutarate (αKG) levels (j) and hydroxyproline (OH-Pro) content (k) in cultured chondrocytes, transduced with shScr or gene-specific shRNAs (n=5 biologically independent samples). Data are means ± SEM in (a-c, f-k), or means ± SD in (e). #p<0.05 (ANOVA), §p<0.05 vs. control/Phd2chon+-shScr, °p<0.05 vs. PHD2KD/Phd2chon--shScr (ANOVA). Exact p values: control-shScr vs. control-gene specific shRNA 0.0005 (a), 0.0003 (b), 0.010 (c), 0.0004 (shHIF-1α; e) or 0.00012 (shGLS1; e); control-shScr vs. PHD2KD-shScr 0.02 (a), 0.04 (b), 0.046 (c) or 0.003 (e); PHD2KD-shScr vs. PHD2KD-gene specific shRNA 0.03 (a), 0.03 (b), 0.03 (c), 0.002 (shHIF-1α; e), 0.0005 (shGLS1; e), 0.049 (shPDK1; e); Phd2chon+-shScr vs. Phd2chon+-gene specific shRNA 0.000010 (shGLS1; f), 0.006 (shPDK1; g), 0.00011 (shGLS1; i), 0.002 (shGLS1;j) or 0.0006 (shGLS1; k); Phd2chon+-shScr vs. Phd2chon--shScr 0.0020 (f), 0.00010 (g), 0.006 (h), 0.00012 (i), 0.00011 (j) or 0.0002 (k); Phd2chon--shScr vs. Phd2chon--gene specific shRNA 0.005 (shGLS1; f), 0.00015 (shPDK1; g), 0.003 (shPDK1; h), 0.0002 (shPDK1; i), 0.00008 (shGLS1; j), 0.00010 (shGLS1; k) or 0.0006 (shPDK1; k); Phd2chon+-shScr vs. Phd2chon--gene specific shRNA 0.002 (shGLS1; h).
Extended Data Figure 7. PHD2-deficient chondrocytes display enhanced glutamine metabolism.
(a) Intracellular glutamate (Glu), α-ketoglutarate (αKG), succinate (Suc), fumarate (Fum), malate (Mal) and citrate (Cit) levels in cultured chondrocytes, with or without BPTES treatment (n=3 biologically independent samples). (b) Ratio of αKG/Suc and αKG/Fum (n=3 biologically independent samples). (c) GLS1 and β-actin immunoblot of cultured chondrocytes transduced with scrambled shRNA (shScr; -) or shRNA against HIF-1α (shHIF-1α). Representative images of 3 independent experiments are shown. (d) Immunoblot of GLS1, GLS2 and β-actin in cultured chondrocytes, compared to HeLa cells. Representative images of 3 independent experiments are shown. (e) Fractional contribution of 13C5-glutamine (Gln) to Glu, αKG, Suc, Fum, Mal and Cit in cultured chondrocytes, with or without BPTES treatment (n=3 biologically independent samples). (f) Citrate mass isotopomer distribution (MID) from 13C5-Gln (n=3 biologically independent samples). (g) Relative abundance of reductive carboxylation-specific mass isotopomers of Cit, Mal and Fum (n=3 biologically independent samples). (h) Type II collagen (COL2) immunostaining of the tibia of neonatal (P2.5) mice treated with BPTES and/or αKG with quantification of the percentage COL2-positive matrix (green) relative to bone volume (BV) (n=5 for Phd2chon+-veh or Phd2chon--veh mice; and n=7 for Phd2chon+-BPTES, Phd2chon+-BPTES+αKG, Phd2chon--BPTES or Phd2chon--BPTES+αKG mice). Scale bar is 250 μm, GP is growth plate, PS is primary spongiosa, arrowheads indicate COL2 cartilage remnants. (i) 3D microCT models of the tibial metaphysis of mice treated with BPTES, with or without αKG, and quantification of trabecular bone volume (TBV) (n=6 for Phd2chon+-veh, Phd2chon+-BPTES+αKG or Phd2chon--veh mice; n=5 for Phd2chon+-BPTES mice; and n=7 for Phd2chon--BPTES or Phd2chon--BPTES+αKG mice). (j) Immunoblot of HIF-1α and Lamin A/C in cultured chondrocytes treated with BPTES, with or without αKG. Representative images of 3 independent experiments are shown. (k) Relative mRNA levels of indicated genes in growth plates derived from mice treated with BPTES, with or without αKG (n=3 biologically independent samples). (l) Immunoblot of p-AMPKT172 and AMPK in cultured chondrocytes treated with BPTES, with or without αKG. Representative images of 3 independent experiments are shown. (m) Proliferation, as determined by BrdU incorporation, of cultured chondrocytes, treated with BPTES, with or without αKG (n=3 biologically independent samples). (n) Tibia length of mice treated with BPTES, with or without αKG (n=5 for Phd2chon+-veh or Phd2chon--veh mice; and n=7 for Phd2chon+-BPTES, Phd2chon+-BPTES+αKG, Phd2chon--BPTES or Phd2chon--BPTES+αKG mice). (o) BiP, cleaved (c)ATF6 and β-actin immunoblot in cultured chondrocytes treated with BPTES, with or without αKG. Representative images of 3 independent experiments are shown. Data are means ± SEM in (a-g, j, l, m, o), or means ± SD in (h, i, k, n). *p<0.05 vs. Phd2chon+, **p<0.01 vs. Phd2chon+, ***p<0.001 vs. Phd2chon+ (two-sided Student’s t-test), #p<0.05 (ANOVA), §p<0.05 vs. Phd2chon+-shScr/veh, °p<0.05 vs. Phd2chon--shScr/veh (ANOVA). Exact p values: Phd2chon+-veh vs. Phd2chon--veh 0.045 (αKG/Suc; b), 0.010 (αKG/Fum; b), 0.00008 (Glu; e), 0.00004 (αKG; e), 0.02 (Suc; e), 0.0007 (Fum; e), 0.009 (Mal; e), 0.050 (Cit; e), 0.00001 (h), 0.00003 (i), 0.03 (j), 0.0001 (P4ha1; k), 0.0006 (P4ha2; k), 0.00002 (P3h1; k), 0.0001 (Plod1; k), 0.0002 (Plod2; k), 0.0003 (Pdi; k), 0.0004 (Lox; k), 0.004 (l), 0.006 (m), 0.000002 (n), 0.0005 (BiP; o) or 0.002 (cATF6; o); Phd2chon+-veh vs. Phd2chon+-BPTES 0.00001 (Glu; e), 0.000003 (αKG; e), 0.02 (Suc; e), 0.0006 (Fum; e), 0.00005 (Mal; e), 0.02 (Cit; e), 0.00001 (h), 0.0001 (i), 0.002 (m) or 0.0000001 (n); Phd2chon+-BPTES vs. Phd2chon+-BPTES+αKG 0.004 (m) or 0.0003 (n); Phd2chon+-veh vs. Phd2chon--BPTES 0.03 (αKG/Fum; b), 0.005 (j), 0.0003 (P4ha1; k), 0.001 (P4ha2; k), 0.0006 (P3h1; k), 0.0001 (Plod1; k), 0.0006 (Plod2; k), 0.002 (Pdi; k), 0.0006 (Lox; k), 0.012 (l), 0.007 (m), 0.000007 (n), 0.003 (BiP; o) or 0.004 (cATF6; o); Phd2chon+-veh vs. Phd2chon--BPTES+αKG 0.00006 (h), 0.00002 (i), 0.03 (j), 0.0003 (P4ha1; k), 0.001 (P4ha2; k), 0.0001 (P3h1; k), 0.00008 (Plod1; k), 0.0007 (Plod2; k), 0.00003 (Pdi; k), 0.0003 (Lox; k), 0.04 (l), 0.019 (m), 0.000005 (n), 0.02 (BiP; o) or 0.0010 (cATF6; o); Phd2chon--veh vs. Phd2chon--BPTES 0.025 (αKG/Suc; b), 0.049 (αKG/Fum; b), 0.00001 (Glu; e), 0.00001 (αKG; e), 0.02 (Suc; e), 0.006 (Fum; e), 0.002 (Mal; e), 0.02 (Cit; e), 0.000002 (h) or 0.000005 (i); Phd2chon+-shScr vs. Phd2chon--shScr 0.007 (c); Phd2chon+-veh vs. Phd2chon+-shHIF-1α 0.006 (c); Phd2chon--veh vs. Phd2chon--shHIF-1α 0.013 (c); Phd2chon+ vs. Phd2chon- 0.007 (GLS1; d), 0.0013 (m+4; f), 0.0006 (m+5; f), 0.0006 (Cit; g), 0.0002 (Mal; g) or 0.048 (Fum; g); Phd2chon+ vs. HeLa 0.04 (GLS1; d) or 0.0088 (GLS2; d).
Extended Data Figure 8. Inhibition of pyruvate uptake does not affect collagen or bone properties.
(a) Intracellular α-ketoglutarate (αKG) levels in cultured chondrocytes, with or without treatment with an inhibitor of monocarboxylate transporter 2 (MCT2i) (n=3 biologically independent samples). (b) P-AMPKT172 and AMPK immunoblot with quantification of p-AMPKT172 to AMPK ratio in cultured chondrocytes treated with MCT2i. Representative images of 3 independent experiments are shown. (c) Tibia length of mice treated with MCT2i (n=5 mice). (d) Collagen synthesis in cultured chondrocytes, with or without MCT2i treatment (n=4 biologically independent samples). (e) BiP, cleaved (c)ATF6 and β-actin immunoblot in cultured chondrocytes treated with MCT2i. Representative images of 3 independent experiments are shown. (f) Hydroxyproline (OH-Pro) content in neonatal growth plates of mice treated with MCT2i (n=5 biologically independent samples). (g) Safranin O staining of the tibia of mice treated with MCT2i, and quantification of the percentage Safranin O (SafO) positive matrix relative to bone volume (BV) (n=5 mice). (h) Type II collagen (COL2) immunostaining of the tibia of mice treated with MCT2i, with quantification of the percentage COL2-positive matrix (green) relative to bone volume (n=5 mice). GP is growth plate, PS is primary spongiosa, arrowheads indicate COL2 cartilage remnants. (i) 3D microCT models of the tibial metaphysis of mice treated with MCT2i, and quantification of trabecular bone volume (TBV) (n=5 mice). Data are means ± SEM in (a-b, d-e), or means ± SD in (c, f-i). #p<0.05 (ANOVA), §p<0.05 vs. Phd2chon+-veh (ANOVA). Exact p values: Phd2chon+-veh vs. Phd2chon--veh 0.00002 (a), 0.015 (b), 0.00001 (c), 0.00011 (d), 0.012 (BiP; e), 0.008 (cATF6; e), 0.00012 (f), 0.00013 (g), 0.00001 (h) or 0.00001 (i); Phd2chon+-MCT2i vs. Phd2chon--MCT2i 0.0003 (a), 0.000002 (c), 0.005 (d) or 0.0003 (f); Phd2chon+-veh vs. Phd2chon--MCT2i 0.02 (b), 0.004 (BiP; e), 0.002 (cATF6; e), 0.00007 (g), 0.0001 (h) or 0.00002 (i). Scale bars in (g) and (h) are 250 μm.
Extended Data Figure 9. Administration of α-ketoglutarate increases collagen hydroxylation and bone mass in wild-type mice.
(a) Intracellular α-ketoglutarate (αKG) levels in cultured chondrocytes, with or without supplementation of dimethyl-αKG (hereafter αKG) (n=4 biologically independent samples). (b) P-AMPKT172 and AMPK immunoblot with quantification of p-AMPKT172 to AMPK ratio in cultured chondrocytes, with or without αKG supplementation. Representative images of 3 independent experiments are shown. (c) Tibia length of mice treated with αKG (n=5 mice). (d) Collagen synthesis in cultured chondrocytes, with or without αKG supplementation (n=4 biologically independent samples). (e) Immunoblot of BiP, cleaved (c)ATF6 and β-actin in cultured chondrocytes, with or without αKG supplementation. Representative images of 3 independent experiments are shown. (f) Hydroxyproline (OH-Pro) content in neonatal growth plates of mice treated with αKG (n=5 biologically independent samples). (g) Safranin O staining of the tibia of mice treated with αKG, and quantification of the percentage Safranin O (SafO) positive matrix relative to bone volume (BV) (n=5 mice). (h) Type II collagen (COL2) immunostaining of the tibia of mice treated with αKG, with quantification of the percentage COL2-positive matrix (green) relative to bone volume (n=5 mice). GP is growth plate, PS is primary spongiosa, arrowheads indicate COL2 cartilage remnants. (i) 3D microCT models of the tibial metaphysis of mice treated with αKG, and quantification of trabecular bone volume (TBV) (n=5 mice). (j) Immunoblot of HIF-1α and Lamin A/C in cultured chondrocytes, with or without αKG supplementation. Representative images of 3 independent experiments are shown. (k) Relative mRNA levels of indicated genes in growth plates derived from mice treated with αKG (n=3 biologically independent samples). Data are means ± SEM in (a-b, d-e, j), or means ± SD in (c, f-i, k). #p<0.05 (ANOVA), §p<0.05 vs. Phd2chon+-veh (ANOVA). Exact p values: Phd2chon+-veh vs. Phd2chon--veh 0.000001 (a), 0.04 (b), 0.00000001 (c), 0.002 (d), 0.046 (BiP; e), 0.011 (cATF6; e), 0.0003 (f), 0.0002 (g), 0.000004 (h), 0.00002 (i), 0.03 (j), 0.00008 (P4ha1; k), 0.0007 (P4ha2; k), 0.0003 (P3h1; k), 0.004 (Plod1; k), 0.0005 (Plod2; k), 0.0005 (Pdi; k) or 0.002 (Lox; k); Phd2chon+-veh vs. Phd2chon+-αKG 0.000007 (a), 0.02 (f), 0.006 (g), 0.00002 (h) or 0.0003 (i); Phd2chon+-veh vs. Phd2chon--αKG 0.02 (b), 0.008 (BiP; e), 0.02 (cATF6; e), 0.005 (f), 0.0003 (g), 0.000002 (h), 0.000003 (i), 0.010 (j), 0.0010 (P4ha1; k), 0.002 (P4ha2; k), 0.0011 (P3h1; k), 0.02 (Plod1; k), 0.00001 (Plod2; k), 0.007 (Pdi; k) or 0.004 (Lox; k); Phd2chon+-αKG vs. Phd2chon--αKG 0.0002 (a), 0.00000007 (c) or 0.002 (d); Phd2chon--veh vs. Phd2chon--αKG 0.003 (a). Scale bars in (g) and (h) are 250 μm.
Extended Data Figure 10. Normalization of glucose oxidation corrects the energy deficit in PHD2-deficient chondrocytes.
(a-e) Glucose oxidation (a), oxygen consumption (b), palmitate oxidation (c), glutamine oxidation (d) and glycolytic flux (e) in cultured chondrocytes, with or without DCA treatment (n=6 biologically independent samples for a, n=3 biologically independent samples for b-e). (f) Proliferation, as determined by BrdU incorporation, of cultured chondrocytes, with or without DCA treatment (n=3 biologically independent samples). (g) Tibia length of mice treated with DCA (n=5 Phd2chon+-veh, Phd2chon--veh or Phd2chon--DCA mice - n=7 Phd2chon+-DCA). (h-i) BiP (h), cleaved (c)ATF6 (i) and β-actin immunoblot in cultured DCA-treated chondrocytes. Representative images of 3 independent experiments are shown. (j) Hydroxyproline (OH-Pro) content in neonatal growth plates of mice treated with DCA, with or without BPTES (n=5 from Phd2chon+-veh or Phd2chon--veh mice - n=7 from Phd2chon+-DCA, Phd2chon+-DCA+BPTES, Phd2chon--DCA or Phd2chon--DCA+BPTES mice). (k) Type II collagen (COL2) immunostaining of the tibia of mice treated with DCA, with or without BPTES with quantification of the percentage COL2-positive matrix (green) relative to bone volume (BV) (n=5 from Phd2chon+-veh mice - n=7 from Phd2chon--veh, Phd2chon+-DCA, Phd2chon+-DCA+BPTES, Phd2chon--DCA or Phd2chon--DCA+BPTES mice). Scale bar is 250 μm, GP is growth plate, PS is primary spongiosa, arrowheads indicate COL2 cartilage remnants. (l) 3D microCT models of the tibial metaphysis of mice treated with DCA, with or without BPTES, and quantification of trabecular bone volume (TBV) (n=5 from Phd2chon+-veh or Phd2chon--veh mice - n=7 from Phd2chon+-DCA, Phd2chon+-DCA+BPTES, Phd2chon--DCA or Phd2chon--DCA+BPTES mice). (m) Intracellular α-ketoglutarate (αKG) levels in cultured chondrocytes treated with DCA, with or without BPTES (n=4 biologically independent samples). (n) Relative mRNA levels of indicated genes in growth plates derived from mice treated with DCA, with or without BPTES (n=3 biologically independent samples). Data are means ± SEM in (a-f, h-i, m), or means ± SD in (g, j-l, n). #p<0.05 (ANOVA), §p<0.05 vs. Phd2chon+-veh, °p<0.05 vs. Phd2chon--veh (ANOVA). Exact p values: Phd2chon+-veh vs. Phd2chon--veh 0.00002 (a), 0.0006 (b), 0.0009 (c), 0.0096 (e), 0.003 (f), 0.00006 (g), 0.003 (h), 0.005 (i), 0.0003 (j), 0.0000004 (k), 0.0002 (l), 0.002 (m), 0.00008 (P4ha1; n), 0.00003 (P4ha2; n), 0.0004 (P3h1; n), 0.004 (Plod1; n), 0.005 (Plod2; n), 0.0002 (Pdi; n) or 0.002 (Lox; n); Phd2chon+-veh vs. Phd2chon+-DCA 0.003 (a); Phd2chon--veh vs. Phd2chon--DCA 0.0003 (a), 0.002 (b), 0.003 (e), 0.02 (f), 0.00012 (g), 0.004 (h), 0.005 (i), 0.000003 (k) or 0.0001 (l); Phd2chon+-veh vs. Phd2chon--DCA 0.005 (c), 0.000008 (j), 0.0000002 (k), 0.00005 (l), 0.0004 (m), 0.0002 (P4ha1; n), 0.00003 (P4ha2; n), 0.00001 (P3h1; n), 0.0004 (Plod1; n), 0.001 (Plod2; n), 0.001 (Pdi; n) or 0.00008 (Lox; n); Phd2chon+-veh vs. Phd2chon+-DCA+BPTES 0.0000002 (j), 0.0003 (k), 0.004 (l) or 0.005 (m); Phd2chon--veh vs. Phd2chon--DCA+BPTES 0.00002 (j), 0.000000002 (k), 0.000003 (l), 0.0014 (m), 0.0008 (P4ha1; n), 0.0002 (P4ha2; n), 0.0001 (P3h1; n), 0.0001 (Plod1; n), 0.001 (Plod2; n), 0.001 (Pdi; n) or 0.0002 (Lox; n).
Supplementary Material
Acknowledgements
The authors wish to thank I. Stockmans, K. Moermans, T. Luyten, J.-P. Decuypere, E. Van Herck and I. Jans for technical assistance. G.C. acknowledges funding from the Research Foundation-Flanders (FWO: G.0A72.13, G.0964.14 and G.0A42.16); P.C. from long-term structural funding – Methusalem Funding by the Flemish Government; S.-M.F. from Marie Curie-CIG, FWO-Odysseus II, and FWO-Research Grants/Projects; D.R.E. NIH grants AR037318 from NIAMS and HD070394 from NICHD; and G.B. from KU Leuven OnderzoeksToelage. S.S. is a postdoctoral fellow from the FWO. G.R. is supported by consecutive PhD fellowships from the Emmanuel van der Schueren - Kom op tegen Kanker foundation and FWO. S.L. is supported by a FWO doctoral grant strategic basic research. The authors declare no conflict of interest.
Footnotes
Data Availability
Source Data are provided in the online version of the paper, uncropped blots are provided in Supplementary Fig. 1. Any additional information required to interpret, replicate or build upon the findings of this study are available from the corresponding author upon reasonable request.
Main text references
- 1.Kronenberg HM Developmental regulation of the growth plate. Nature 423, 332–336, doi: 10.1038/nature01657 (2003). [DOI] [PubMed] [Google Scholar]
- 2.Buttgereit F & Brand MD A hierarchy of ATP-consuming processes in mammalian cells. Biochem J 312 ( Pt 1), 163–167 (1995). [DOI] [PMC free article] [PubMed] [Google Scholar]
- 3.Maes C et al. VEGF-independent cell-autonomous functions of HIF-1alpha regulating oxygen consumption in fetal cartilage are critical for chondrocyte survival. J Bone Miner Res 27, 596–609, doi: 10.1002/jbmr.1487 (2012). [DOI] [PubMed] [Google Scholar]
- 4.Pfander D, Cramer T, Schipani E & Johnson RS HIF-1alpha controls extracellular matrix synthesis by epiphyseal chondrocytes. J Cell Sci 116, 1819–1826 (2003). [DOI] [PubMed] [Google Scholar]
- 5.Aro E et al. Hypoxia-inducible factor-1 (HIF-1) but not HIF-2 is essential for hypoxic induction of collagen prolyl 4-hydroxylases in primary newborn mouse epiphyseal growth plate chondrocytes. J Biol Chem 287, 37134–37144, doi: 10.1074/jbc.M112.352872 (2012). [DOI] [PMC free article] [PubMed] [Google Scholar]
- 6.Schipani E et al. Hypoxia in cartilage: HIF-1alpha is essential for chondrocyte growth arrest and survival. Genes Dev 15, 2865–2876, doi: 10.1101/gad.934301 (2001). [DOI] [PMC free article] [PubMed] [Google Scholar]
- 7.Aragones J, Fraisl P, Baes M & Carmeliet P Oxygen sensors at the crossroad of metabolism. Cell Metab 9, 11–22, doi: 10.1016/j.cmet.2008.10.001 (2009). [DOI] [PubMed] [Google Scholar]
- 8.Nakazawa MS, Keith B & Simon MC Oxygen availability and metabolic adaptations. Nat Rev Cancer 16, 663–673, doi: 10.1038/nrc.2016.84 (2016). [DOI] [PMC free article] [PubMed] [Google Scholar]
- 9.Hochachka PW, Buck LT, Doll CJ & Land SC Unifying theory of hypoxia tolerance: molecular/metabolic defense and rescue mechanisms for surviving oxygen lack. Proc Natl Acad Sci U S A 93, 9493–9498 (1996). [DOI] [PMC free article] [PubMed] [Google Scholar]
- 10.Wheaton WW & Chandel NS Hypoxia. 2. Hypoxia regulates cellular metabolism. Am J Physiol Cell Physiol 300, C385–393, doi: 10.1152/ajpcell.00485.2010 (2011). [DOI] [PMC free article] [PubMed] [Google Scholar]
- 11.Cheng K et al. Hypoxia-inducible factor-1alpha regulates beta cell function in mouse and human islets. J Clin Invest 120, 2171–2183, doi: 10.1172/JCI35846 (2010). [DOI] [PMC free article] [PubMed] [Google Scholar]
- 12.Myllyharju J & Kivirikko KI Collagens, modifying enzymes and their mutations in humans, flies and worms. Trends Genet 20, 33–43, doi: 10.1016/j.tig.2003.11.004 (2004). [DOI] [PubMed] [Google Scholar]
- 13.Vater CA, Harris ED Jr. & Siegel RC Native cross-links in collagen fibrils induce resistance to human synovial collagenase. Biochem J 181, 639–645 (1979). [DOI] [PMC free article] [PubMed] [Google Scholar]
- 14.Jarman-Smith ML et al. Porcine collagen crosslinking, degradation and its capability for fibroblast adhesion and proliferation. J Mater Sci Mater Med 15, 925–932, doi: 10.1023/B:JMSM.0000036281.47596.cc (2004). [DOI] [PubMed] [Google Scholar]
- 15.Gerstenfeld LC, Riva A, Hodgens K, Eyre DR & Landis WJ Post-translational control of collagen fibrillogenesis in mineralizing cultures of chick osteoblasts. J Bone Miner Res 8, 1031–1043, doi: 10.1002/jbmr.5650080903 (1993). [DOI] [PubMed] [Google Scholar]
- 16.van Gastel N et al. Expansion of murine periosteal progenitor cells with fibroblast growth factor 2 reveals an intrinsic endochondral ossification program mediated by bone morphogenetic protein 2. Stem Cells 32, 2407–2418, doi: 10.1002/stem.1783 (2014). [DOI] [PubMed] [Google Scholar]
- 17.Myllyharju J Prolyl 4-hydroxylases, key enzymes in the synthesis of collagens and regulation of the response to hypoxia, and their roles as treatment targets. Ann Med 40, 402–417, doi: 10.1080/07853890801986594 (2008). [DOI] [PubMed] [Google Scholar]
- 18.Lorendeau D, Christen S, Rinaldi G & Fendt SM Metabolic control of signalling pathways and metabolic auto-regulation. Biol Cell 107, 251–272, doi: 10.1111/boc.201500015 (2015). [DOI] [PubMed] [Google Scholar]
- 19.Elia I et al. Environmental pyruvate drives extracellular matrix remodelling by breast cancer cells. submitted (2017). [Google Scholar]
- 20.Altman BJ, Stine ZE & Dang CV From Krebs to clinic: glutamine metabolism to cancer therapy. Nat Rev Cancer 16, 619–634, doi: 10.1038/nrc.2016.71 (2016). [DOI] [PMC free article] [PubMed] [Google Scholar]
- 21.Semenza GL Molecular mechanisms mediating metastasis of hypoxic breast cancer cells. Trends Mol Med 18, 534–543, doi: 10.1016/j.molmed.2012.08.001 (2012). [DOI] [PMC free article] [PubMed] [Google Scholar]
- 22.Marini JC et al. Osteogenesis imperfecta. Nat Rev Dis Primers 3, 17052, doi: 10.1038/nrdp.2017.52 (2017). [DOI] [PubMed] [Google Scholar]
- 23.Wynn TA & Ramalingam TR Mechanisms of fibrosis: therapeutic translation for fibrotic disease. Nat Med 18, 1028–1040, doi: 10.1038/nm.2807 (2012). [DOI] [PMC free article] [PubMed] [Google Scholar]
- 24.Bonnans C, Chou J & Werb Z Remodelling the extracellular matrix in development and disease. Nat Rev Mol Cell Biol 15, 786–801, doi: 10.1038/nrm3904 (2014). [DOI] [PMC free article] [PubMed] [Google Scholar]
Methods references
- 25.Mazzone M et al. Heterozygous deficiency of PHD2 restores tumor oxygenation and inhibits metastasis via endothelial normalization. Cell 136, 839–851, doi: 10.1016/j.cell.2009.01.020 (2009). [DOI] [PMC free article] [PubMed] [Google Scholar]
- 26.Ovchinnikov DA, Deng JM, Ogunrinu G & Behringer RR Col2a1-directed expression of Cre recombinase in differentiating chondrocytes in transgenic mice. Genesis 26, 145–146 (2000). [PubMed] [Google Scholar]
- 27.Maes C et al. Soluble VEGF isoforms are essential for establishing epiphyseal vascularization and regulating chondrocyte development and survival. J Clin Invest 113, 188–199, doi: 10.1172/JCI19383 (2004). [DOI] [PMC free article] [PubMed] [Google Scholar]
- 28.Stegen S et al. Osteocytic oxygen sensing controls bone mass through epigenetic regulation of sclerostin. Nat Commun 9, 2557, doi: 10.1038/s41467-018-04679-7 (2018). [DOI] [PMC free article] [PubMed] [Google Scholar]
- 29.Stegen S et al. HIF-1alpha Promotes Glutamine-Mediated Redox Homeostasis and Glycogen-Dependent Bioenergetics to Support Postimplantation Bone Cell Survival. Cell Metab 23, 265–279, doi: 10.1016/j.cmet.2016.01.002 (2016). [DOI] [PMC free article] [PubMed] [Google Scholar]
- 30.Stegen S et al. Adequate hypoxia inducible factor 1alpha signaling is indispensable for bone regeneration. Bone 87, 176–186, doi: 10.1016/j.bone.2016.03.014 (2016). [DOI] [PubMed] [Google Scholar]
- 31.Christen S et al. Breast Cancer-Derived Lung Metastases Show Increased Pyruvate Carboxylase-Dependent Anaplerosis. Cell Rep 17, 837–848, doi: 10.1016/j.celrep.2016.09.042 (2016). [DOI] [PubMed] [Google Scholar]
- 32.Lorendeau D et al. Dual loss of succinate dehydrogenase (SDH) and complex I activity is necessary to recapitulate the metabolic phenotype of SDH mutant tumors. Metab Eng 43, 187–197, doi: 10.1016/j.ymben.2016.11.005 (2017). [DOI] [PubMed] [Google Scholar]
- 33.Buescher JM et al. A roadmap for interpreting (13)C metabolite labeling patterns from cells. Curr Opin Biotechnol 34, 189–201, doi: 10.1016/j.copbio.2015.02.003 (2015). [DOI] [PMC free article] [PubMed] [Google Scholar]
- 34.Elia I et al. Proline metabolism supports metastasis formation and could be inhibited to selectively target metastasizing cancer cells. Nat Commun 8, 15267, doi: 10.1038/ncomms15267 (2017). [DOI] [PMC free article] [PubMed] [Google Scholar]
- 35.Koopman WJ, Visch HJ, Smeitink JA & Willems PH Simultaneous quantitative measurement and automated analysis of mitochondrial morphology, mass, potential, and motility in living human skin fibroblasts. Cytometry A 69, 1–12, doi: 10.1002/cyto.a.20198 (2006). [DOI] [PubMed] [Google Scholar]
- 36.Sunic D, Belford DA, McNeil JD & Wiebkin OW Insulin-like growth factor binding proteins (IGF-BPs) in bovine articular and ovine growth-plate chondrocyte cultures: their regulation by IGFs and modulation of proteoglycan synthesis. Biochim Biophys Acta 1245, 43–48 (1995). [DOI] [PubMed] [Google Scholar]
- 37.Carmeliet G, Himpens B & Cassiman JJ Selective increase in the binding of the alpha 1 beta 1 integrin for collagen type IV during neurite outgrowth of human neuroblastoma TR 14 cells. J Cell Sci 107 ( Pt 12), 3379–3392 (1994). [DOI] [PubMed] [Google Scholar]
- 38.Weis MA et al. Location of 3-hydroxyproline residues in collagen types I, II, III, and V/XI implies a role in fibril supramolecular assembly. J Biol Chem 285, 2580–2590, doi: 10.1074/jbc.M109.068726 (2010). [DOI] [PMC free article] [PubMed] [Google Scholar]
- 39.Creemers LB, Jansen DC, van Veen-Reurings A, van den Bos T & Everts V Microassay for the assessment of low levels of hydroxyproline. Biotechniques 22, 656–658 (1997). [DOI] [PubMed] [Google Scholar]
- 40.Daci E, Verstuyf A, Moermans K, Bouillon R & Carmeliet G Mice lacking the plasminogen activator inhibitor 1 are protected from trabecular bone loss induced by estrogen deficiency. J Bone Miner Res 15, 1510–1516, doi: 10.1359/jbmr.2000.15.8.1510 (2000). [DOI] [PubMed] [Google Scholar]
- 41.Decuypere JP et al. STIM1, but not STIM2, is required for proper agonist-induced Ca2+ signaling. Cell Calcium 48, 161–167, doi: 10.1016/j.ceca.2010.08.003 (2010). [DOI] [PubMed] [Google Scholar]
- 42.Masuyama R et al. TRPV4-mediated calcium influx regulates terminal differentiation of osteoclasts. Cell Metab 8, 257–265, doi: 10.1016/j.cmet.2008.08.002 (2008). [DOI] [PubMed] [Google Scholar]
- 43.Grynkiewicz G, Poenie M & Tsien RY A new generation of Ca2+ indicators with greatly improved fluorescence properties. J Biol Chem 260, 3440–3450 (1985). [PubMed] [Google Scholar]
- 44.Missiaen L, Luyten T, Bultynck G, Parys JB & De Smedt H Measurement of intracellular Ca2+ release in intact and permeabilized cells using 45Ca2+. Cold Spring Harb Protoc 2014, 263–270, doi: 10.1101/pdb.top066126 (2014). [DOI] [PubMed] [Google Scholar]
- 45.Storkebaum E et al. Impaired autonomic regulation of resistance arteries in mice with low vascular endothelial growth factor or upon vascular endothelial growth factor trap delivery. Circulation 122, 273–281, doi: 10.1161/CIRCULATIONAHA.109.929364 (2010). [DOI] [PubMed] [Google Scholar]
- 46.Laperre K et al. Development of micro-CT protocols for in vivo follow-up of mouse bone architecture without major radiation side effects. Bone 49, 613–622, doi: 10.1016/j.bone.2011.06.031 (2011). [DOI] [PubMed] [Google Scholar]
- 47.Bouxsein ML et al. Guidelines for assessment of bone microstructure in rodents using micro-computed tomography. J Bone Miner Res 25, 1468–1486, doi: 10.1002/jbmr.141 (2010). [DOI] [PubMed] [Google Scholar]
- 48.Callewaert F et al. Differential regulation of bone and body composition in male mice with combined inactivation of androgen and estrogen receptor-alpha. FASEB J 23, 232–240, doi: 10.1096/fj.08-113456 (2009). [DOI] [PubMed] [Google Scholar]
- 49.Verhaeghe J, Van Herck E, Van Bree R, Van Assche FA & Bouillon R Osteocalcin during the reproductive cycle in normal and diabetic rats. J Endocrinol 120, 143–151 (1989). [DOI] [PubMed] [Google Scholar]
- 50.Dempster DW et al. Standardized nomenclature, symbols, and units for bone histomorphometry: a 2012 update of the report of the ASBMR Histomorphometry Nomenclature Committee. J Bone Miner Res 28, 2–17, doi: 10.1002/jbmr.1805 (2013). [DOI] [PMC free article] [PubMed] [Google Scholar]
Associated Data
This section collects any data citations, data availability statements, or supplementary materials included in this article.


