

Abstract
In this study, we aimed at analyzing the associations between transmission of and deaths caused by SARS-CoV-2 and meteorological variables, such as average temperature, minimum temperature, maximum temperature, and precipitation. Two outcome measures were considered, with the first aiming to study SARS-CoV-2 infections and the second aiming to study COVID-19 mortality. Daily data as well as data on SARS-CoV-2 infections and COVID-19 mortality obtained between December 1, 2019 and March 28, 2020 were collected from weather stations around the world. The country's population density and time of exposure to the disease were used as control variables. Finally, a month dummy variable was added. Daily data by country were analyzed using the panel data model. An increase in the average daily temperature by one degree Fahrenheit reduced the number of cases by approximately 6.4 cases/day. There was a negative correlation between the average temperature per country and the number of cases of SARS-CoV-2 infections. This association remained strong even with the incorporation of additional variables and controls (maximum temperature, average temperature, minimum temperature, and precipitation) and fixed country effects. There was a positive correlation between precipitation and SARS-CoV-2 transmission. Countries with higher rainfall measurements showed an increase in disease transmission. For each average inch/day, there was an increase of 56.01 cases/day. COVID-19 mortality showed no significant association with temperature.
Keywords: COVID-19, Climate variables, Temperature, Precipitation
Graphical abstract
Highlights
-
•
First study covering all countries affected by COVID-19 verifying the association with climate variables.
-
•
Negative association between country average temperature and COVID-19 infections.
-
•
Positive associations between country precipitation and COVID-19 infections.
-
•
No association between deaths and country temperature or precipitation.
1. Introduction
This is the third time in less than two decades that the world authorities are facing an epidemic with high transmissibility, caused by subtypes of a coronavirus (Munster et al., 2020; Gorbalenya, 2020). The first epidemic occurred during 2002–2003 in Guangdong province, China. The disease was termed ‘severe acute respiratory syndrome’ (SARS) and was caused by a newly identified coronavirus that was named SARS coronavirus (SARS-CoV) (Lin et al., 2006). SARS-CoV infected 8000 individuals from several countries and resulted in 774 deaths. The second epidemic occurred in 2012 in the Middle East. This disease was termed ‘Middle East respiratory syndrome’ and was caused by a new virus called MERS coronavirus (MERS-CoV). MERS-CoV infected 2494 individuals and resulted in around 860 deaths (Munster et al., 2020). At the end of 2019, a third epidemic occurred. This was caused by another new type of coronavirus designated by the World Health Organization as SARS-CoV-2. The resultant disease was named ‘coronavirus disease’ (COVID-19); the disease is now a worldwide pandemic (Gorbalenya, 2020).
The recently emerged SARS-CoV-2 was first identified in the city of Wuhan, Hubei province, China. The virus infects humans and a variety of animals, mainly pigs and bats (Velavan and Meyer, 2020). Infection results in a spectrum of clinical manifestations, which are mainly respiratory, ranging in severity from benign to lethal, and it is sometimes asymptomatic (Velavan and Meyer, 2020; Fehr and Perlman, 2015).
In an attempt to understand these epidemics, studies have examined factors that could influence the spread of coronaviruses (Chan et al., 2011). In general, three factors affect the epidemiology of communicable diseases: the agent of transmission, the host, and the environment (Lin et al., 2006).
Historically, the occurrences of SARS were partly associated with environmental factors (Lin et al., 2006). An ecological study conducted in China found that air pollution was associated with lethality in individuals affected by SARS. This was attributed to the fact that short- or long-term exposure to certain pollutants can compromise lung function (Cui et al., 2003). Another environmental factor was air temperature. Lin et al. (2006) identified, for the first time, that the incidence of SARS was 18 times higher at lower air temperatures than at higher temperatures. The authors reported that respiratory system diseases are more common in colder environments and that the virulence of agents deteriorates at higher climatic temperatures, as they may not be able to withstand the environmental changes. In addition, they pointed out that the transmissibility of SARS-CoV, in terms of climatic fluctuations, is similar to that of the influenza virus. Furthermore, the incidence of influenza increases significantly with low temperatures and high relative humidity (Park, 2020), indicating that climatic factors can significantly affect viral transmission.
In the case of SARS-CoV-2, meteorological factors seem to influence the spread of the virus (Oliveiros et al., 2020; Bao et al., 2016). Oliveiros et al. (2020) identified that the speed of transmission was positively correlated with temperature and correlated with humidity. Thus, it is expected that if the temperature rises to 20 °C, transmission rates increase by an average of 1.8 days. Regarding temperature and mortality rate, a study conducted in four Chinese cities found that colder temperatures had a greater effect on mortality (Bao et al., 2016). This is in contrast to the results of the study by Li et al. (2019), which showed that both cold and heat can adversely impact the mortality resulting from respiratory syndromes.
On the basis of the assumption that different climatic conditions play a significant role in the course of COVID-19, it is essential to identify associations between environmental factors, such as average, maximum, and minimum temperatures; precipitation; and demographic density, and SARS-CoV-2 transmission and COVID-19 mortality in humans.
2. Methods
2.1. Data collection
Data for the period from December 1, 2019 to March 30, 2020 were collected. For meteorological variables, weather station data were extracted from the National Oceanic and Atmospheric Administration (NOAA) database. Daily data from meteorological stations were segregated by country, and the following variables were recorded: precipitation, average temperature, maximum temperature, and minimum temperature (NOAA, 2020). Daily averages of each meteorological variable for the different countries were calculated. Finally, data on daily infection and death rates were extracted from World Health Organization reports (WHO, 2020).
The demographic density of each country was used as a control variable, with data obtained from the Food and Agriculture Organization and World Bank population estimates for the year 2018 (World Bank, 2020). The country's time of exposure to the epidemic was calculated from the temporal distance, in days, between the first case registered in the territory and the time of study. A summary of the variables is provided in Table 1 .
Table 1.
Data summary.
| Variable | Label | Range | Source | Measurement |
|---|---|---|---|---|
| Average temperature | TAVG | 2019/12/01 to 2020/03/28 | NOAA, 2020 | Degrees Fahrenheit |
| Maximum temperature | TMAX | 2019/12/01 to 2020/03/28 | NOAA, 2020 | Degrees Fahrenheit |
| Minimum Temperature | TMIN | 2019/12/01 to 2020/03/30 | NOAA, 2020 | Degrees Fahrenheit |
| Precipitation | – | 2019/12/01 to 2020/03/30 | NOAA, 2020 | Inches |
| Population density | – | 2018 | World Bank, 2020 | Persons per km2 |
| SARS-CoV-2 Infections | – | 2019/12/01 to 2020/03/28 | WHO, 2020 | Number of Infections |
| SARS-CoV-2 Deaths | – | 2019/12/01 to 2020/03/28 | WHO, 2020 | Number of Deaths |
2.2. Model
To analyze the association between the number of cases of and deaths from COVID-19 and climatic aspects, we used Eq. (1), as estimated by a panel data strategy (Wooldridge, 2002):
| (1) |
Where Y it is the dependent variable (total number of cases of SARS-CoV-2 infections or total number of deaths from COVID-19) for 249 countries “i” over the period “t” from December 1, 2019 to March 30, 2020; σ is a constant; u i is the control for specific characteristics of the countries that are fixed over the analyzed period; and X it is a vector that includes all explanatory variables of the model, including the variable of interest, that is, the mean temperature.
In addition, we included other controls that may be related to the disease, such as average rainfall and the country's time of exposure to the epidemic. We included as binary variables D t, which captures specific effects associated with the months of January and February, and ε it, which is the error term of this equation that includes all factors that are associated with Y it and are not included in the equation.
The advantage of this strategy in relation to a traditional ordinary least squares estimate is that we can control for some country-specific factors that are fixed in time and associated with the number of deaths associated with SARS-CoV-2 infection.
2.3. Data processing strategy
Two specific outcomes measures were considered. For the first, we analyzed the influence of climatic variables on SARS-CoV-2 infections, and for the second, we analyzed the influence of climatic variables on COVID-19 mortality.
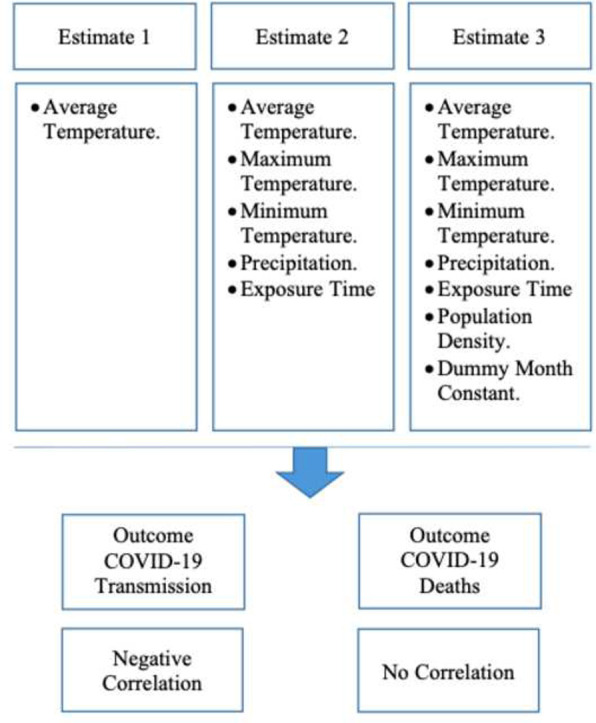
Three estimates were tested for each outcome and are shown in Fig. 1 . The first included only the average temperature; the second included the average temperature, minimum temperature, maximum temperature, precipitation, and the country's time of exposure to the epidemic; and the third included the average temperature, minimum temperature, maximum temperature, precipitation, the country's time of exposure to the epidemic, population density, and a variable to capture the specific month effects (complete specification).
Fig. 1.

Data processing strategy.
3. Results
Table 2 shows the results of correlation analysis between the number of confirmed COVID-19 cases and the average temperature by country. In the first estimated model, there is a negative correlation between the two variables. The significance of this relationship remains even after the inclusion of additional variables such as maximum and minimum temperatures (averages) and time of exposure to the disease. Even with the complete specification that includes two binary variables capturing specific effects for the months of the year and controlling for population density, the results suggest that an increase in temperature is associated with a decrease in the number of infections.
Table 2.
Outcome 1: Correlation between COVID-19 cases and climatic characteristics.
| Estimate 1 |
Estimate 2 |
Estimate 3 |
||||
|---|---|---|---|---|---|---|
| β | Zd | β | Zd | β | Zd | |
| TAVGa | −1.44***e | (−3.05) | −6.47*** | (−2.69) | −6.40*** | (−2.64) |
| TMAXb | – | – | 3.71*** | (2.45) | 3.76*** | (2.45) |
| TMINc | – | – | 1.28 | (0.88) | 1.22 | (0.79) |
| Precipitation | – | – | 56.72*** | (8.74) | 56.01*** | (8.74) |
| Exposure Time | – | – | 15.51*** | (32.17) | 15.73*** | (31.16) |
| Population Density | No | No | Yes | |||
| Dummy Month | No | No | Yes | |||
| Constant | −49.83 | (−1.59) | 15.51 | (32.17) | 15.73 | (31.16) |
| Observations | 18,066 | 9409 | 9409 | |||
Average temperature.
Maximum temperature.
Minimum temperature.
Z statistics in parentheses.
* p < .10, ** p < .05, *** p < .01.
The coefficients shown in Table 2 cannot measure causality. There are several other factors that can affect the variable of interest, on which we do not have information, such as the number of beds and the patients' respective levels of social isolation. However, an association was observed between the climate and the number of COVID-19 cases. These models appear to be quite robust, particularly after the incorporation of controls such as additional climate variables and also month fixed effects.
Table 3 shows the results of correlation analysis between COVID-19 mortality and climatic variables. For this outcome measure, there were no significant associations between the coefficients and mortality or average temperature. It is possible that factors other than climate are related to mortality. In the first estimate, we evaluated only the relationship between COVID-19 mortality rates and the average temperature by country, which was significant. In the second estimate, we included the average, minimum, and maximum temperatures as well as the country's time of exposure to the disease and did not identify any significant association. In the last estimate, in addition to the controls already included in the previous specification, we also incorporated binary variables to capture any effects that were specific to this period. However, no significant correlation was identified between COVID-19 mortality rates and temperature.
Table 3.
Outcome 2: Correlation between COVID-19 deaths and climatic characteristics.
| Estimate 1 |
Estimate 2 |
Estimate 3 |
||||
|---|---|---|---|---|---|---|
| β | Zd | β | Zd | β | Zd | |
| TAVGa | 0.053***e | (2.07) | −0.10 | (−0.68) | −0.10 | (−0.67) |
| TMAXb | – | – | 0.01 | (0.18) | 0.02 | (0.30) |
| TMINc | – | – | 0.01 | 0.12 | 0.001 | (0.01) |
| Precipitation | – | – | 0.34 | (0.72) | 0.33 | (0.72) |
| Exposure Time | – | – | 0.85*** | (30.05) | 0.86*** | (29.12) |
| Population Density | No | No | Yes | |||
| Dummy Month | No | No | Yes | |||
| Constant | 1.55 | (0.90) | 2.26 | (1.25) | 1.53 | (0.80) |
| Observations | 18,066 | 9409 | 9409 | |||
Average temperature.
Maximum temperature.
Minimum temperature.
Z statistics in parentheses.
* p < .10, ** p < .05, *** p < .01.
4. Discussion
Several factors can influence SAR-CoV-2 transmission, including environmental variables, population density, and medical care (Wang et al., 2020). This study aimed to identify the associations between environmental variables and SARS-CoV-2 transmission/COVID-19 mortality. A negative correlation was identified between temperature and the number infections.
Although it is known that the influence of temperature on human health can vary between countries and even regions (Hajat and Kosatky, 2010), the findings of this study are in agreement with the current literature in that temperature influences the transmission of viruses that cause respiratory syndromes, such as the influenza virus (Park, 2020) and SARS-CoV-2 (Ma et al., 2020). By investigating the relationship between temperature and respiratory diseases, studies have indicated that SARS-CoV and the influenza virus survive only under certain climatic conditions and that their transmissibility is sensitive to rising temperatures (Jaakkola et al., 2014; Chan et al., 2011), similar to the transmissibility of SARS-CoV-2 (Wang et al., 2020).
The influenza virus is more transmissible at lower temperatures (Lowen and Steel, 2014) because cold weather results in the weakening of host immunity, increasing susceptibility to infection (Kudo et al., 2019). Considering that the transmissibility of coronaviruses is similar to that of the influenza virus (Lin et al., 2006), it can be assumed that these mechanisms also apply to the transmission of SARS-CoV-2 (Wang et al., 2020).
In the model in which we considered only the average temperature, the observed correlation indicated that for every one degree Fahrenheit increase in temperature, there was a reduction in the number of infections by 1.44 cases/day. Under the composite model (estimate 3 of outcome measure 1), the association was stronger in that there was a decrease in the number of infections by 6.40 cases/day for each degree increase in temperature.
The second finding of this study was the significant association between mortality and average temperature, which was not maintained when other variables were added, indicating that non-climatic variables may be related to COVID-19 mortality. This finding differs from the findings of Ma et al. (2020), who stated that temperature and COVID-19 mortality are negatively associated. One possible reason for the conflicting results is the limited geographical scope of the study by Ma et al., which focused only on China and its climate. Our study included data from a range of countries and climatic regions.
Environmental factors that influence the relationship between temperature and mortality, such as latitude (Bao et al., 2016); humidity (Jaakkola et al., 2014; Kudo et al., 2019); air pollution (Cai et al., 2007); and sociodemographic factors, such as age, sex, and income (Bao et al., 2016), have been reported. Chan et al. (2011) reported that people who live at low latitudes have a relatively weak adaptive capacity to cold and a strong adaptive capacity to heat, and the reverse has also been shown. High humidity, which is associated with low temperatures, is an important factor in the transmissibility of the influenza virus, either by conserving virulence or weakening the host by cooling the body or drying the respiratory tract (Jaakkola et al., 2014).
A study reported that temperature and humidity are associated with a higher risk of COVID-19 (Wang et al., 2020). Therefore, although humidity was not considered in our research because of the lack of information on this variable from some meteorological stations, precipitation seems to be an important factor that must be considered. We found that there was a positive correlation between precipitation and SARS-CoV-2 transmission, showing that for each 1-in. increase in precipitation/day, there was an increase of 56.01 cases/day.
Another result concerns the country's time of exposure to SARS-CoV-2. As expected, this variable also showed a positive correlation, showing that for each additional day of exposure there was an average increase of 15.73 cases/day. This finding is consistent with the behavioral evidence on SARS-CoV-2 transmission, that is, after community infection, transmission follows the same geometric progression (Correia et al., 2020).
It is important to mention that our study only interpreted the significance of the coefficients and not their magnitude because of the probable existence of endogeneity in the estimated relationships, considering that a series of regressors are associated with temperature and disease mortality at the same time.
5. Conclusion
This is the first global study covering all countries affected by COVID-19. We examined the associations between climatic variables and SARS-CoV-2 transmission and COVID-19 mortality. The findings showed a negative correlation between a country's average temperature and the number of COVID-19 cases, the absence of a correlation between mortality and the average temperature, and a positive correlation between the country's time of exposure to the virus and the number of cases. In addition, this study reported that precipitation as an important factor in the transmissibility of the virus.
This research provides important information that can inform the decisions of local and global health authorities. As climatic variations are associated with the transmissibility of SARS-CoV-2, new policies to reinforce health systems or social isolation methods can be adopted, depending on temperature and precipitation patterns.
As a limitation, we highlight the absence of humidity data, in view of its important role in the virulence of respiratory syndromes. However, because of the current data restrictions, this factor could not be considered, and it should be included in future studies. We also suggest that future studies focus on micro-regions to capture temperature patterns and include variables related to solar radiation.
Abbreviations
- COVID-19
Corona Virus Disease 2019
- OLS
Ordinary Least Squares
- TAVG
Average Temperature
- TMAX
Maximum Temperature
- TMIN
Minimum Temperature
- NOAA
National Oceanic and Atmospheric Administration
- WHO
World Health Organization
Ethical approval and consent to participate
Not applicable.
Availability of supporting data
Climate Data: National Oceanic and Atmospheric Administration website.
COVID-19 Data: World Health Organization website.
Demographic Data: World Bank website.
Funding
Not applicable.
CRediT authorship contribution statement
Marcos Felipe Falcão Sobral: Conceptualization, Writing - review & editing, Methodology, Data curation. Gisleia Benini Duarte: Methodology, Formal analysis. Ana Iza Gomes da Penha Sobral: Writing - review & editing, Data curation. Marcelo Luiz Monteiro Marinho: Formal analysis. André de Souza Melo: Writing - review & editing.
Declaration of competing interest
The authors declare that they have no conflict of interest.
Acknowledgements
National Oceanic and Atmospheric Administration.
World Health Organization.
World Bank.
References
- Bao J., Wang Z., Yu C., Li X. The influence of temperature on mortality and its Lag effect: a study in four Chinese cities with different latitudes. BMC Public Health. 2016;16(1):375–383. doi: 10.1186/s12889-016-3031-z. [DOI] [PMC free article] [PubMed] [Google Scholar]
- Cai Q.C., Lu J., Xu Q.F., Guo Q., Xu D.Z., Sun Q.W., Jiang Q.W. Influence of meteorological factors and air pollution on the outbreak of severe acute respiratory syndrome. Public Health. 2007;121(4):258–265. doi: 10.1016/j.puhe.2006.09.023. [DOI] [PMC free article] [PubMed] [Google Scholar]
- Chan K.H., Peiris J.S., Lam S.Y., Poon L.L.M., Yuen K.Y., Seto W.H. The effects of temperature and relative humidity on the viability of the SARS coronavirus. Advances in Virology. 2011;2011 doi: 10.1155/2011/734690. [DOI] [PMC free article] [PubMed] [Google Scholar]
- Correia M., Ramos R.F., Bahten L.C.V. Os cirurgiões e a pandemia do COVID-19. Revista do Colégio Brasileiro de Cirurgiões. 2020;47:1–6. doi: 10.1590/0100-6991e-20202536. [DOI] [PubMed] [Google Scholar]
- Cui Y., Zhang Z.F., Froines J., Zhao J., Wang H., Yu S.Z., Detels R. Air pollution and case fatality of SARS in the People’s Republic of China: an ecologic study. Environ. Health. 2003;2(1):15. doi: 10.1186/1476-069X-2-15. [DOI] [PMC free article] [PubMed] [Google Scholar]
- Fehr A.R., Perlman S. Coronaviruses: an overview of their replication and pathogenesis. In: Maier H., Bickerton E., Britton P., editors. Coronaviruses. Methods in Molecular Biology. Vol. 1282. Humana Press; 2015. pp. 1–23. [DOI] [PMC free article] [PubMed] [Google Scholar]
- Gorbalenya A.E. 2020. Severe Acute Respiratory Syndrome-Related Coronavirus: The Species and its Viruses – A Statement of the Coronavirus Study Group; pp. 1–15. bioRxiv preprint. [DOI] [Google Scholar]
- Hajat S., Kosatky T. Heat-related mortality: a review and exploration of heterogeneity. J. Epidemiol. Community Health. 2010;64(9):753–760. doi: 10.1136/jech.2009.087999. [DOI] [PubMed] [Google Scholar]
- Jaakkola K., Saukkoriipi A., Jokelainen J., Juvonen R., Kauppila J., Vainio O., Ikäheimo T.M. Decline in temperature and humidity increases the occurrence of influenza in cold climate. Environ. Health. 2014;13(1):22. doi: 10.1186/1476-069X-13-22. [DOI] [PMC free article] [PubMed] [Google Scholar]
- Kudo E., Song E., Yockey L.J., Rakib T., Wong P.W., Homer R.J., Iwasaki A. Low ambient humidity impairs barrier function and innate resistance against influenza infection. Proc. Natl. Acad. Sci. 2019;116(22):10905–10910. doi: 10.1073/pnas.1902840116. [DOI] [PMC free article] [PubMed] [Google Scholar]
- Li M., Zhou M., Yang J., Yin P., Wang B., Liu Q. Temperature, temperature extremes, and cause-specific respiratory mortality in China: a multi-city time series analysis. Air Quality, Atmosphere & Health. 2019;12(5):539–548. doi: 10.1007/s11869-019-00670-3. [DOI] [Google Scholar]
- Lin K., Fong D.Y.T., Zhu B., Karlberg J. Environmental factors on the SARS epidemic: air temperature, passage of time and multiplicative effect of hospital infection. Epidemiology & Infection. 2006;134(2):223–230. doi: 10.1017/S0950268805005054. [DOI] [PMC free article] [PubMed] [Google Scholar]
- Lowen A.C., Steel J. Roles of humidity and temperature in shaping influenza seasonality. J. Virol. 2014;88(14):7692–7695. doi: 10.1128/JVI.03544-13. [DOI] [PMC free article] [PubMed] [Google Scholar]
- Ma Y., Zhao Y., Liu J., He X., Wang B., Fu S., Luo B. Effects of temperature variation and humidity on the death of COVID-19 in Wuhan, China. Sci. Total Environ. 2020:1–7. doi: 10.1016/j.scitotenv.2020.138226. (138226) [DOI] [PMC free article] [PubMed] [Google Scholar]
- Munster V.J., Koopmans M., van Doremalen N., van Riel D., de Wit E. A novel coronavirus emerging in China—key questions for impact assessment. N. Engl. J. Med. 2020;382(8):692–694. doi: 10.1056/NEJMp2000929. [DOI] [PubMed] [Google Scholar]
- Oliveiros B., Caramelo L., Ferreira N.C., Caramelo F. Role of temperature and humidity in the modulation of the doubling time of COVID-19 cases. medRxiv. 2020 doi: 10.1101/2020.03.05.20031872. [DOI] [Google Scholar]
- Park J.E. Effects of temperature, humidity, and diurnal temperature range on influenza incidence in a temperate region. Influenza Other Respir. Viruses. 2020;14(1):11–18. doi: 10.1111/irv.12682. [DOI] [PMC free article] [PubMed] [Google Scholar]
- Velavan T.P., Meyer C.G. The COVID-19 epidemic. Tropical Med. Int. Health. 2020;25(3):278–280. doi: 10.1111/tmi.13383. [DOI] [PMC free article] [PubMed] [Google Scholar]
- Wang M., Jiang A., Gong L., Luo L., Guo W., Li C.…Chen Y. Temperature significant change COVID-19 Transmission in 429 cities. medRxiv. 2020 doi: 10.1101/2020.02.22.20025791. [DOI] [Google Scholar]
- Wooldridge J.M. MIT press; Cambridge, MA: 2002. Econometric Analysis of Cross Section and Panel Data; p. 108. [Google Scholar]
- World Bank Population density (people per sq. km of land area) 2020. https://data.worldbank.org/indicator/EN.POP.DNST (accessed 26 March 2020)
Associated Data
This section collects any data citations, data availability statements, or supplementary materials included in this article.
Data Availability Statement
Climate Data: National Oceanic and Atmospheric Administration website.
COVID-19 Data: World Health Organization website.
Demographic Data: World Bank website.