

SUMMARY
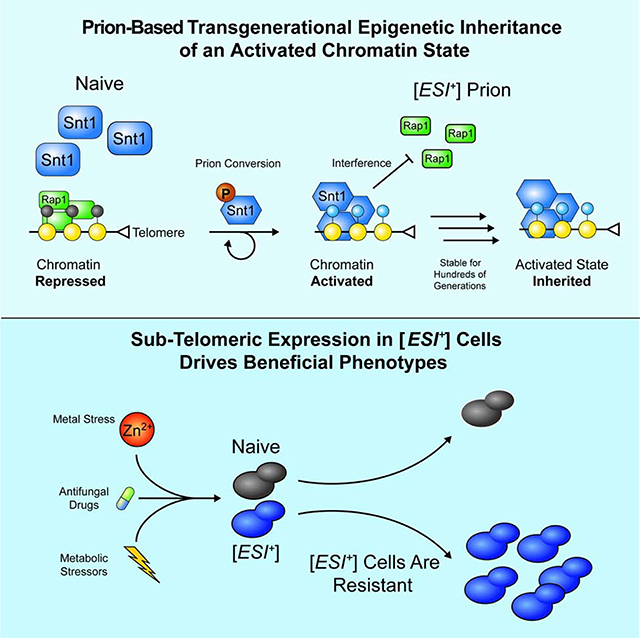
Covalent modifications to histones are essential for development, establishing distinct and functional chromatin domains from a common genetic sequence. Whereas repressed chromatin is robustly inherited, no mechanism has been described that facilitates inheritance of an activated domain. Here we report that the Set3C histone deacetylase scaffold Snt1 can act as a prion that drives the emergence, and transgenerational inheritance, of an activated chromatin state. This prion, which we term [ESI+] for expressed sub-telomeric information, is triggered by transient Snt1 phosphorylation upon cell cycle arrest. Once engaged, the prion reshapes the activity of Snt1, and the Set3C complex, recruiting RNA pol II and interfering with Rap1 binding to activate genes in otherwise repressed sub-telomeric domains. This transcriptional state confers broad resistance to environmental stress, including antifungal drugs. Together, our results establish a robust means by which a prion can facilitate inheritance of an activated chromatin state to provide adaptive benefit.
In brief
An epigenetic regulator functions as a prion to confer trangenerational inheritance of an active chromatin state.
Graphical Abstract
INTRODUCTION
Phenotypic diversification without genetic change is critical for development, cell type specification, and environmental responsiveness. This idea is encapsulated in the concept of epigenetics (Waddington, 1942): patterns of altered gene function that can be passed through cellular divisions in the absence of changes to genetic sequence (Holliday and Pugh, 1975; Nanney, 1958; Riggs, 1975, 1996). Such epigenetic memory is most closely associated with imprinted DNA methylation (Calarco et al., 2012; Dickies, 1962; Kazachenka et al., 2018; Padmanabhan et al., 2013; Radford et al., 2012), small noncoding RNAs (Carone et al., 2010; Rechavi et al., 2014; Rechavi et al., 2011; Sharma et al., 2016; Verdel et al., 2004; Yu et al., 2018b), and repressive covalent histone modifications (e.g. H3K9me2/3, H3K27me3) (Audergon et al., 2015; Coleman and Struhl, 2017; Gottschling et al., 1990; Jiang and Berger, 2017; Lachner et al., 2001; Laprell et al., 2017; Margueron et al., 2009; Pillus and Rine, 1989; Ragunathan et al., 2015; Wang and Moazed, 2017).
Of these mechanisms, those governing transmission of repressive histone marks through cellular division are the most completely understood. Following DNA replication, modified parental histones are dispersed between daughter strands (Petryk et al., 2018; Yu et al., 2018a). Marks on parental histones are then read and written to neighboring newly deposited histones on both the parent and nascent strand (Moazed, 2011). This read-write mechanism establishes silent, typically heterochromatic, domains that can be stable for dozens of cellular divisions (Gottschling et al., 1990; Grewal and Klar, 1996). By contrast, inheritance of activated chromatin states has only been achieved by deleting endogenous regulatory elements (Cavalli and Paro, 1998, 1999) or inhibiting silencing effector proteins (Ekwall et al., 1997; Pillus and Rine, 1989). In this way, activated states do not appear to be heritable via a read-write mechanism, and for this reason some have argued that they are not bona fide epigenetic states (Reinberg and Vales, 2018). It is unknown whether an alternative mechanism exists for the inheritance of activated chromatin.
A less well studied form of epigenetics arises from the self-templating conformations of prion proteins. First described as the cause of infectious spongiform encephalopathies (Prusiner, 1982), prions and prion-like proteins are now known to play diverse, physiological roles across life (Fioriti et al., 2015; Halfmann et al., 2012; Kruttner et al., 2012; Majumdar et al., 2012; Stephan et al., 2015; Yuan and Hochschild, 2017). Whereas chromatin-bound information segregates with chromosomes, prion conformers are transmitted independently, and are passed through both mitotic and meiotic divisions (Harvey et al., 2018). This property led to the discovery that prions can act as epigenetic elements (Cox, 1965; Patino et al., 1996; Wickner, 1994; Young and Cox, 1971). Dozens of prions have been identified including numerous regulators of chromatin-based epigenetics––histone modifiers and chromatin remodelers––many of which are conserved across Eukarya (Alberti et al., 2009; Chakrabortee et al., 2016a). Given the extraordinary stability of prion conformational conversion, this enrichment led us to investigate whether the intersection between chromatin and prion biology could stabilize the inheritance of active chromatin states encoded by histone modifications.
Here we report that one such protein, the Set3C histone deacetylase scaffold Snt1 (NCOR1 in humans), drives a mitotically and meiotically stable protein-based epigenetic element: a prion. We term this prion [ESI+] for expressed sub-telomeric information, where the brackets and plus sign signify non-Mendelian, cytoplasmic patterns of inheritance, and capitals and italics denote dominance in genetic crosses. We identify a mechanism for its regulation, demonstrating that phosphorylation of Snt1 in response to prolonged cell cycle arrest is sufficient for induction. Once engaged, [ESI+] pervasively activates transcription of otherwise repressed, sub-telomeric loci, driven by synergism between Set3C’s recruitment of RNA pol II and coincident exclusion of Repressor-Activator site binding Protein (Rap1). Finally, expressed information in [ESI+] cells confers resistance to multiple stresses, including antifungal drugs used clinically, providing strong adaptive value. Together, our results suggest that prion conformational switching is a robust means by which an active chromatin state might be established and transmitted from one generation to the next, expanding adaptive opportunities.
RESULTS
[ESI+] Is a Prion
Because they are driven by heritable changes in protein conformation rather than genetic sequence, prion-driven traits do not follow the rules of Mendelian genetics. Pioneering studies in yeast have established defining characteristics of fungal prions (Wickner et al., 2006): (1) overexpression of the causal protein increases the frequency of prion acquisition, (2) traits driven by the prion can be eliminated by transient perturbation of molecular chaperones, (3) have nonMendelian inheritance patterns, (4) can be transmitted via cytoplasm alone, and (5) require continuous presence of the causal protein. In addition to these genetic features, there are a number of biochemical characteristics: (6) an altered conformation of the protein in [PRION+] cells (Edskes et al., 1999; Patino et al., 1996), and (7) the capacity of this altered conformation to template natively folded protein of the same type (Glover et al., 1997). Finally, the strongest ‘sufficiency test’ for a prion is (8) transformation of naïve cells with aggregates generated from heterologously expressed and purified protein (Tanaka et al., 2004; Tanaka and Weissman, 2006).
We previously found that transient overexpression of SNT1, a subunit of the Set3C histone deacetylase complex, created a zinc-resistance trait stable over many hundreds of mitotic divisions (feature 1), but could be eliminated by transient chaperone inhibition (feature 2) (Chakrabortee et al., 2016a). Yet this phenotype (known as [ESI+]) differed somewhat from archetypal fungal prions. Snt1 does not harbor Q/N-rich domains often found in amyloid prions (Fig. S1A). Consistent with this, propagation of the state depended on Hsp90 (Chakrabortee et al., 2016a), rather than Hsp70 or Hsp104, and Snt1 did not form visible amyloid fibers (Fig. S1B).
To investigate whether [ESI+] was a prion, we examined its genetic behavior. First, we tested whether the zinc resistance trait was non-Mendelian. We crossed isogenic naïve and [ESI+] parents to naïve mating partners, induced meiosis, isolated haploid progeny, and scored their zinc resistance. All meiotic progeny inherited zinc resistance (feature 3; Fig. 1A–B, S1C), in contrast to the expectation of exactly 50% for a genetic mutant (p<0.008 by binomial test). We next asked whether this trait was transmissible through cytoplasm alone, using a karyogamy deficient kar1–1 mutant that prevents nuclear fusion after mating (Conde and Fink, 1976; Wickner et al., 2006). We performed a series of genetic crosses, introducing [ESI+] to kar1–1 cells (Fig. S1D), and then selected buds from these heterokaryons that had wild-type nuclei, but mixed cytoplasm. All ‘cytoductants’ that received [ESI+] cytoplasm acquired zinc resistance (Fig. S1E) but control recipients that received naïve cytoplasm did not (feature 4). Finally, we tested whether the conformation of Snt1 was altered in [ESI+] cells. Because of its low abundance (200–400 molecules per cell) we performed limited proteolysis on immunoprecipitated Snt1 from naïve and [ESI+] cells as a fiducial for conformational change. Whereas Snt1 from naïve cells was nearly entirely degraded by proteinase K over the course of an hour, we observed minimal degradation of Snt1 from [ESI+] cells (feature 6; Fig. 1C, S1F). We also extended this assay by seeding naïve lysates with small amounts of [ESI+] lysate in vitro (Fig. 1D). In these experiments, the proteolysis kinetics of the seeded myc-tagged Snt1 became nearly identical to [ESI+] type strains (Fig. 1E). Thus, the conformational change could be templated to natively folded protein (feature 7). Collectively these data establish that [ESI+] has many genetic and biochemical hallmarks of prion biology.
Figure 1. [ESI+] is a prion.

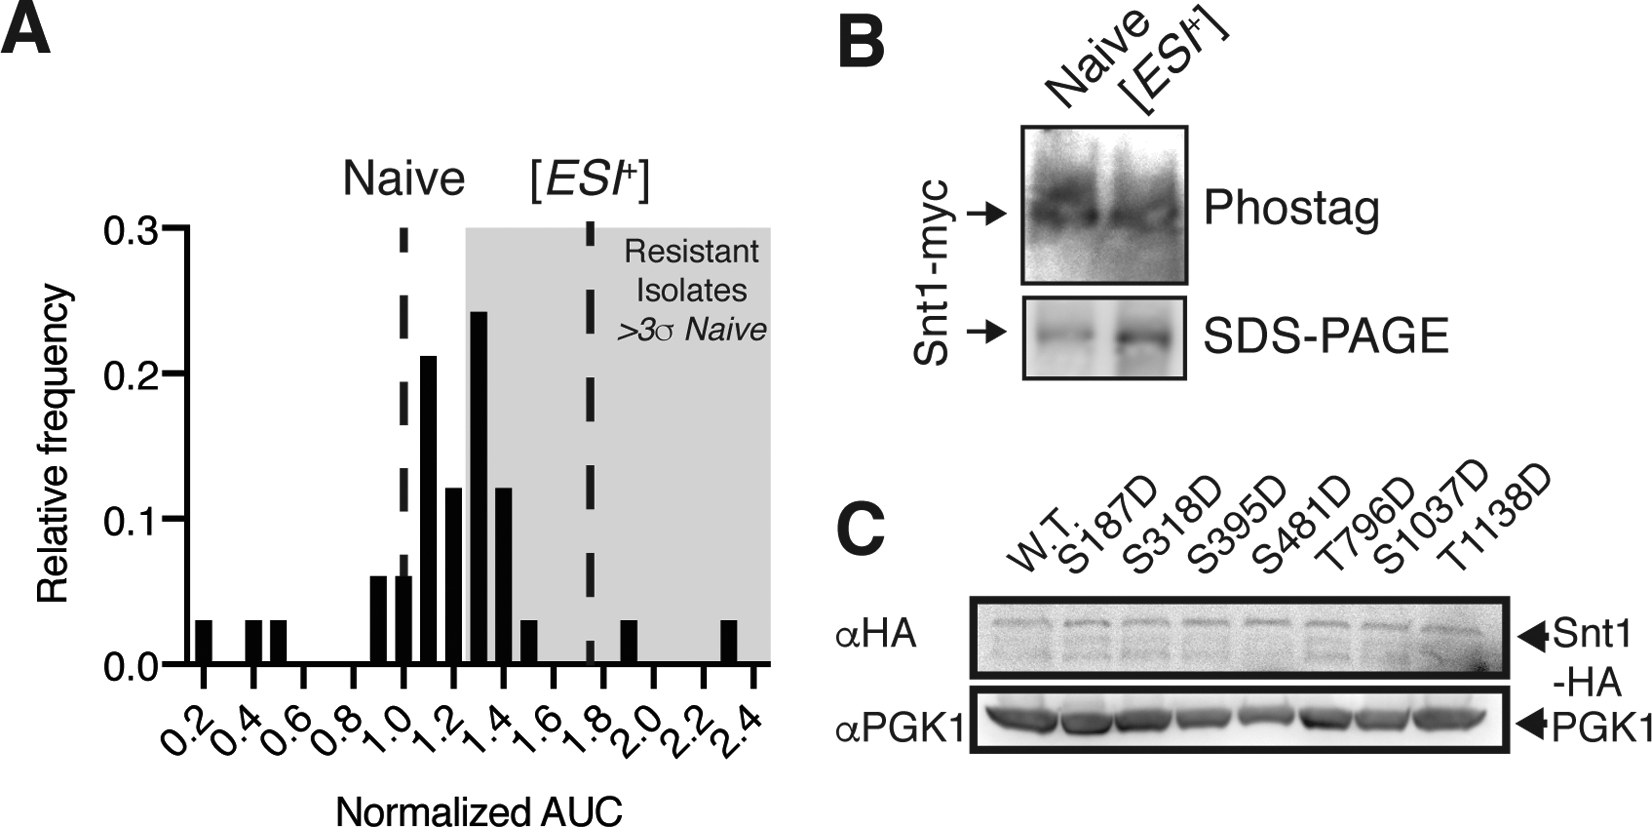
A, Growth in 7.5 mM ZnSO4 for naïve (n = 4), [ESI+] (n = 4), and [ESI+] meiotic progeny (n = 14; 7 separate meioses). Curves are bounded by SEM. B, Area under the curve (AUC) for growth in 7.5 mM ZnSO4 from (A). AUC is normalized to naïve. C, Representative limited proteolysis of immunoprecipitated endogenous Snt1-myc. D, Schematic for lysate seeding of naïve Snt1 with untagged [ESI+] lysate. E, Representative limited proteolysis of seeded naïve Snt1 lysates. F, Visible aggregates formed when eluting heterologously expressed Snt1 from a nickel affinity column. G, Coomasie (left) and immunoblot (anti-SNAP, right) of aggregated protein. H, Schematic of protein transformation experiments. I, Histogram of normalized AUC in 10 mM ZnSO4 of strains transformed with either Snt1 aggregates (n = 48, see H), or BSA (n = 24). Isolates more than three SD above the BSA control mean are shaded in grey. J, Growth in 10 mM ZnSO4 of naïve and [ESI+] strains, as well as Snt1 aggregate transformants from (K) and their progeny ‘cured’ by transient Hsp90 inhibition. Curves are mean ± SEM for four biological replicates. See also Figure S1.
The strongest evidence for prion-based inheritance is transformation. We thus examined whether Snt1 expressed in E. coli, and aggregated in vitro, could transform naïve cells to [ESI+]. We expressed Snt1 as a recombinant His-tagged fusion protein and then lysed the bacteria, digested all nucleic acids, and isolated Snt1 using nickel affinity chromatography. Snt1 eluted over an increasing gradient of imidazole and, following elution, proceeded to form visible aggregates within 1–2 hours (Fig. 1F). After washes with 4M guanidine hydrochloride, Snt1 remained aggregated (Fig. 1G).
Next, we asked whether these Snt1 aggregates could convert naïve yeast to [ESI+]. We prepared naïve cells for transformation by spheroplasting, and then introduced either Snt1 aggregates or bovine serum albumin (BSA), as a control (Fig. 1H). Co-transformation with a LEU2 carrier plasmid identified the small number of cells that uptook extracellular material. We plated transformations to single colonies on selective medium, and passaged colonies for >100 generations to dilute the original Snt1 aggregates. We then tested whether these colonies acquired [ESI+]-associated zinc resistance. Many did (9 of 48, or ~19% from Snt1 aggregate transformations; feature 8; Fig. 1I). No such behavior emerged in control colonies that were transformed with BSA (Fig. 1I).
We next investigated whether these protein transformants had other defining features of [ESI+]. First, we repeated Snt1 aggregate transformations in an snt1Δ recipient strain. We observed no zinc resistance, suggesting that constant presence of Snt1 is required for propagation of [ESI+] (feature 5; Fig. S1G). Second, we asked whether the zinc resistance of wild-type Snt1 aggregate transformants could be eliminated by transient Hsp90 inhibition, it can in [ESI+] type strains (Chakrabortee et al., 2016a). We passaged zinc-resistant protein transformants on medium containing a low dose of radicicol, a selective inhibitor of Hsp90 (Jarosz and Lindquist, 2010). We then restored Hsp90 function by passaging these cells in rich medium without the drug. This regimen eliminated zinc resistance of Snt1 protein transformants (Fig. 1J), just as it did in [ESI+] cells. Our observations establish that [ESI+] fulfills all defining features of prion proteins: it is both proteinaceous and infectious – a mitotically and meiotically heritable epigenetic state linked to an altered, self-templating conformation of Snt1.
Induction upon Cell Cycle Arrest
An argument for the adaptive value of prions is their ability to switch in response to environmental stimuli (Lancaster and Masel, 2009). However, aside from indirect stress-dependent changes in chaperone activity (Tyedmers et al., 2008), the molecular mechanisms regulating switching remain largely unclear. Like many prion proteins, Snt1 harbors extensive predicted intrinsically disordered regions in addition to its eponymous well-folded SANT domains and a domain of unknown function (Fig. 2A). Phosphorylation of disordered proteins can induce large conformational shifts (Bah et al., 2015), and Snt1 harbors numerous phosphorylation sites within its putative disordered regions (Fig. 2A), leading us to investigate whether phosphorylation could influence [ESI+].
Figure 2. Snt1 phosphorylation triggers [ESI+].

A, Snt1 domain architecture and known phosphorylation sites. Intrinsic disorder profile predicted using DISOPRED2. B, Immunoblot of phosphoprotein-impeding gel (‘phostag’; upper panel) and SDS-PAGE (lower panel) of nocodazole- or hydroxyurea-arrested cells. C, Normalized AUC for wild type or snt1Δ strains previously arrested with the indicated agent, propagated for >100 generations, and treated with 7.5 mM ZnSO4. Dashed line indicates AUC value for a concurrently treated [ESI+] type strain. D, Immunoblot of immunopurified Snt1–13xmyc subjected to limited proteolysis. Two protease-resistant and two protease-sensitive single colony isolates are presented. E, Schematic of phosphomimetic induction of [ESI+]. F, Normalized AUC in 7.5 mM ZnSO4 for phosphomimetic inductants using a galactose-inducible promoter in 2% raffinose (resulting in very low expression), for ~25 generations, followed by elimination of the plasmid. Dashed lines represent growth of type strains (naïve and [ESI+]). Error bars are SEM calculated from three independent inductions. See also Figure S2.
We took advantage of prior observations that prolonged G2/M cell cycle arrest via nocodazole induces Snt1 phosphorylation by Cdc28 (CDK1 in humans) (Holt et al., 2009). We confirmed this finding by phospho-protein impeding gel electrophoresis (‘phostag’) and immunoblot (Fig. 2B). After releasing nocodazole treated cells and passaging them for another ~100 generations in the absence of drug, we noted frequent emergence of stable zinc resistance (Fig. 2C). No such behavior occurred in untreated controls. To estimate the frequency of induction, we repeated this experiment, introducing single cell bottlenecks by plating to individual colonies. The majority of these colonies (>50%) acquired stable zinc resistance (Fig. S2A). To rule out general effects of cell cycle perturbation, we arrested naive cells in S-phase with hydroxyurea. This treatment did not impact Snt1 phosphorylation or zinc resistance (Fig. 2B–C). Thus, phosphorylation of Snt1 driven by prolonged G2/M arrest is linked to the emergence of a stable zinc resistance phenotype.
We next asked whether this phenotype was due to [ESI+]. First, we repeated the nocodazole induction in snt1Δ cells, and observed no increase in zinc resistance (Fig. 2C), establishing dependence on Snt1. Second, we subjected immunoprecipitated Snt1 derived from single colony nocodazole induced isolates to proteolysis (Fig. S2A). Among zinc resistant colonies we commonly observed delayed Snt1 degradation, closely matching [ESI+] type strains (Fig. 2D). Thus, nocodazole arrest can induce an altered, heritable Snt1 conformation resembling [ESI+]. We did not, however, observe Snt1 phosphorylation in [ESI+] type strains (Fig. S2B), suggesting that the modification is not required to maintain the prion.
As a final test of whether Snt1 phosphorylation could trigger [ESI+], we generated single phosphomimetic (S/T→D) variants at annotated phosphorylation sites within Snt1. We episomally expressed the mutant proteins for ~25 generations, eliminated the expression vector by counter-selection, and propagated them for another ~25 generations (Fig. 2E). This propagation diluted the cytoplasm by ~107-fold, minimizing the potential effect of any remaining phosphomimic protein. Transient ancestral exposure to very low levels of wild-type Snt1 or an empty vector control did not induce [ESI+]; Nor did a phosphomimetic mutation at the sole site within Snt1’s ordered domain (S481D; Fig. 2F). By contrast, transient ancestral expression of phosphomimetic variants at multiple sites within Snt1’s disordered regions gave rise to heritable zinc resistance (Fig. 2F). Induction of the trait was not due to differences in Snt1 abundance, as the variants were expressed similarly (Fig. S2C). Although other physiological circumstances may also promote [ESI+] induction, our results suggest that Snt1 phosphorylation linked to G2/M spindle checkpoint arrest by nocodazole can trigger the prion.
Activated Transcription in [ESI+] Cells
In addition to Snt1, Set3C is composed of Set3 (a catalytically inactive SET-domain containing protein) and Hos2 (a class I histone deacetylase), which represses genes primarily via H4 deacetylation (Kim and Buratowski, 2009; Kim et al., 2012) or activates them through RNA pol II recruitment (Wang et al., 2002). We first investigated global changes to histone acetylation in [ESI+] cells, observing markedly higher pan-acetyl-histone-H4 (H4ac) and modestly elevated pan-acetyl-histone-H3 (H3ac) signal (3.1-fold H4ac, 1.9-fold H3ac, p < 0.01 for both; Fig. S3A). To investigate the consequences, we performed mRNA-seq with spike-in controls, providing a linear range spanning more than five orders of magnitude, with no systematic biases between naïve and [ESI+] cells (Fig. S3B). Consistent with increased histone acetylation, we observed increases in the abundance of ~1,000 transcripts in [ESI+] cells (~15% of ORFs, Fig. 3A). Notably, this included many metal-stress-response genes (e.g. YCF1, SVF1, HAL9, FRE1), providing a logical explanation for zinc resistance in [ESI+] cells.
Figure 3. [ESI+] activates transcription.

A–D, Representative scatter plots for [ESI+], snt1Δ, set3Δ, and hos2Δ differential expression. 2-fold up- and down-regulation indicated by dashed lines. [ESI+] and naïve samples are representative of 5 biological replicates in two independent experiments. snt1Δ, set3Δ, and hos2Δ are representative of two biological replicates. E, Heatmaps of ChIP-seq signal for H4ac, RNAPII, and Snt1 in naïve and [ESI+] cells for 1 kb windows surrounding the transcription start site (TSS) of the top 500 [ESI+] up-regulated genes. Results are representative of two or more biological replicates and generated with Deeptools using default settings. See also Figure S3.
To investigate the mechanism underlying this large change in expression, we compared the transcription in [ESI+] to loss of Set3C function (Set3CΔ; snt1Δ, set3Δ, hos2Δ). There was extensive overlap between all three Set3C deletion strains and [ESI+] (Fig. S3C), confirming that they are functionally linked. However, as has been seen for other prions (Malovichko et al., 2019), the majority of the transcriptional changes were not explained by deletion of constituent proteins. Indeed, the transcriptional changes in Set3CΔ were more modest than those in [ESI+] cells, with 62, 204, and 360 transcripts being up-regulated in snt1Δ, set3Δ, and hos2Δ, respectively (Fig. 3B–D). Thus, changes in gene expression in [ESI+] cannot be explained by simple loss of Set3C repressive function.
Because Set3C has also previously been implicated in gene activation, we investigated whether transcript up-regulation in [ESI+] cells was due to activation by Snt1 and Set3C. Set3C is most closely associated with H4 acetylation (Kim and Buratowski, 2009), and recruits RNAPII to activate genes (Wang et al., 2002). We performed chromatin immunoprecipitation followed by high-throughput sequencing (ChIP-seq) for H4ac, RNAPII, and Snt1, examining the results at the transcription start sites (TSS) of genes upregulated in [ESI+] cells. Consistent with Set3Cdriven gene activation, increased transcript abundance was directly linked to elevated RNAPII and H4ac at TSSs (Fig. 3E). This was not because of a loss of Snt1 binding; we observed slightly increased Snt1 binding surrounding the +1 nucleosome of [ESI+] up-regulated TSSs (Fig. 3E). Further, activation was coincident with an apparent loss of deacetylase activity, as measured by elevated H4ac (Fig. 3E). This likely explains why the [ESI+] gene expression profile is most similar to hos2Δ (Fig. S3C), the principle histone deacetylase of Set3C.
Beyond simple gene regulation, Set3C functions in silencing antisense and alternative transcripts (Kim et al., 2012), as well as repressing meiotic transcripts (Pijnappel et al., 2001). We also investigated whether [ESI+] influenced these functions. Indeed, we observed RNAPII and H4ac at the transcription end site (TES) of up-regulated ORFs (Fig. S3D–E) or apparently alternative TSSs (Fig. 3E; S3F) in [ESI+] cells. [ESI+] up-regulated genes were likewise enriched for factors involved in meiosis (e.g., IME1 and SPO11; p < 10−29, Fisher’s exact test). These gene expression changes had a clear functional consequence: [ESI+] cells sporulated more efficiently than genetically identical naïve cells (Fig. S3G). Together with our other genomic observations, these data establish that transcriptional up-regulation in [ESI+] cells is linked to gene activation by Snt1 and Set3C.
[ESI+] Activates Sub-Telomeric Domains
Although many genes differentially expressed in [ESI+] cells were logically linked to known Set3C functions, hundreds of others were not. We searched for shared features that might suggest an explanation. Notably, transcripts up-regulated by [ESI+] were ~10-fold less abundant in naïve cells than the transcriptome-wide average (p < 10−4, Mann-Whitney test) and the degree of up-regulation was anticorrelated with abundance in naïve cells (ρ ≈ −0.641; Fig. 4A). Further, we noticed that many of transcripts were located within the large (~50 kb), repressive, Hda1-affected sub-telomeric (HAST) domains (Robyr et al., 2002) p < 10−16, KS test; Fig. 4B). Consistent with [ESI+]-dependent activation being a gain-of-function, Set3C deletion mutants did not show the same enrichment (Fig. 4B).
Figure 4. [ESI+] Activates Sub-telomeric Domains.

(A) Correlation between naive basal expression and log2-fold change in [ESI+] cells. Spearman’s rho noted.
(B) Ratio of transcripts upregulated versus. down-regulated transcripts in 1 kb bins as a function of distance from telomere by chromosome, for all strains sequenced. Data are the average of two biological replicates. The dashed line represents the expectation without spatial bias.
(C) Phenotypic reporter for sub-telomeric expression. Data are scored as the number of colonies on selective medium (SD-URA) versus total CFUs and are representative of four biological replicates. Error bars represent mean ± SEM. Significance calculated by 2-tail t test assuming unequal variance.
(D) ChIP-seq density plots for H4ac, in nave and [ESI+] cells expressing the ratio of increased to decreased histone acetylation in ~1 kb bins as a function of distance from the telomere. Data generated from the average coverage of 2 biological replicates for each ChIP and strain. Significance assessed with a Cuzick’s test for trend.
(E) ChIP-seq density plots for RNAPII, and H3ac in naive and [ESI+] cells expressing the ratio of increased to decreased histone acetylation in ~1 kb bins as a function of distance from the telomere. Data generated from the average coverage of 3 biological replicates for each ChIP and strain. Significance assessed with a Cuzick’s test for trend.
(F) ChIP-seq density plots for H3ac in naive and [ESI+] cells expressing the ratio of increased to decreased histone acetylation in ~1 kb bins as a function of distance from the telomere. Data generated from the average coverage of 3 biological replicates for each ChIP and strain. Significance assessed with a Cuzick’s test for trend.
See also Figure S3.
These domains are very weakly expressed, and thus susceptible to technical variation. We thus performed a phenotypic assay for sub-telomeric repression (Gottschling et al., 1990). In this assay, a URA3 selectable marker is integrated in a sub-telomeric domain subject to position effect variegation. Thus, with weaker the repression of sub-telomeres, a greater fraction of cells can grow on medium lacking uracil. [ESI+] cells had a nearly 2-fold increase in the fraction of Ura+ colonies (Fig. 4C), confirming that the prion activates otherwise repressed, sub-telomeric domains.
We next investigated whether de-repression of sub-telomeres was directly linked to changes in histone acetylation and RNAPII binding, examining the distribution of increased H4ac and RNAPII in [ESI+] cells. Mirroring our gene-level analyses, sub-telomeric de-repression was linked to both increased H4ac (p = 0.01097, Cuzick’s Test; Fig. 4D) and elevated RNAPII recruitment (p = 6.34 × 10⁻⁷, Cuzick’s Test; Fig. 4E) consistent with pervasive activation in the region via Set3C-dependent RNAPII recruitment (Kim et al., 2012; Wang et al., 2002). Notably, in keeping with Set3C’s preference for H4, we did not observe the same biased distribution for H3ac (p = 0.15, Cuzick’s Test; Fig. 4F). Thus, [ESI+] pervasively activates the expression of sub-telomeric genes.
Homothallic Mating Loci Are Also De-Repressed
Sub-telomeres in S. cerevisiae also harbor two specialized loci of heterochromatin that are more tightly silenced (Buhler and Gasser, 2009; Loo and Rine, 1994): the homothallic mating loci HMLα and HMRa. These loci contain additional copies of yeast mating type information and are located ~10 and 25 kb from the chromosome end, respectively. Sub-telomeres are silenced by a coordination of the SIR (Silent Information Regulator) complex directly adjacent to telomeric repeats (~4 kb from chromosome ends; (Buhler and Gasser, 2009; Strahl-Bolsinger et al., 1997; Thurtle and Rine, 2014), and by HDACs within the larger HAST domains (Robyr et al., 2002). At the homothallic mating loci, an additional layer of silencing is achieved through sequence-dependent recruitment of SIR to silencer elements (Loo and Rine, 1994).
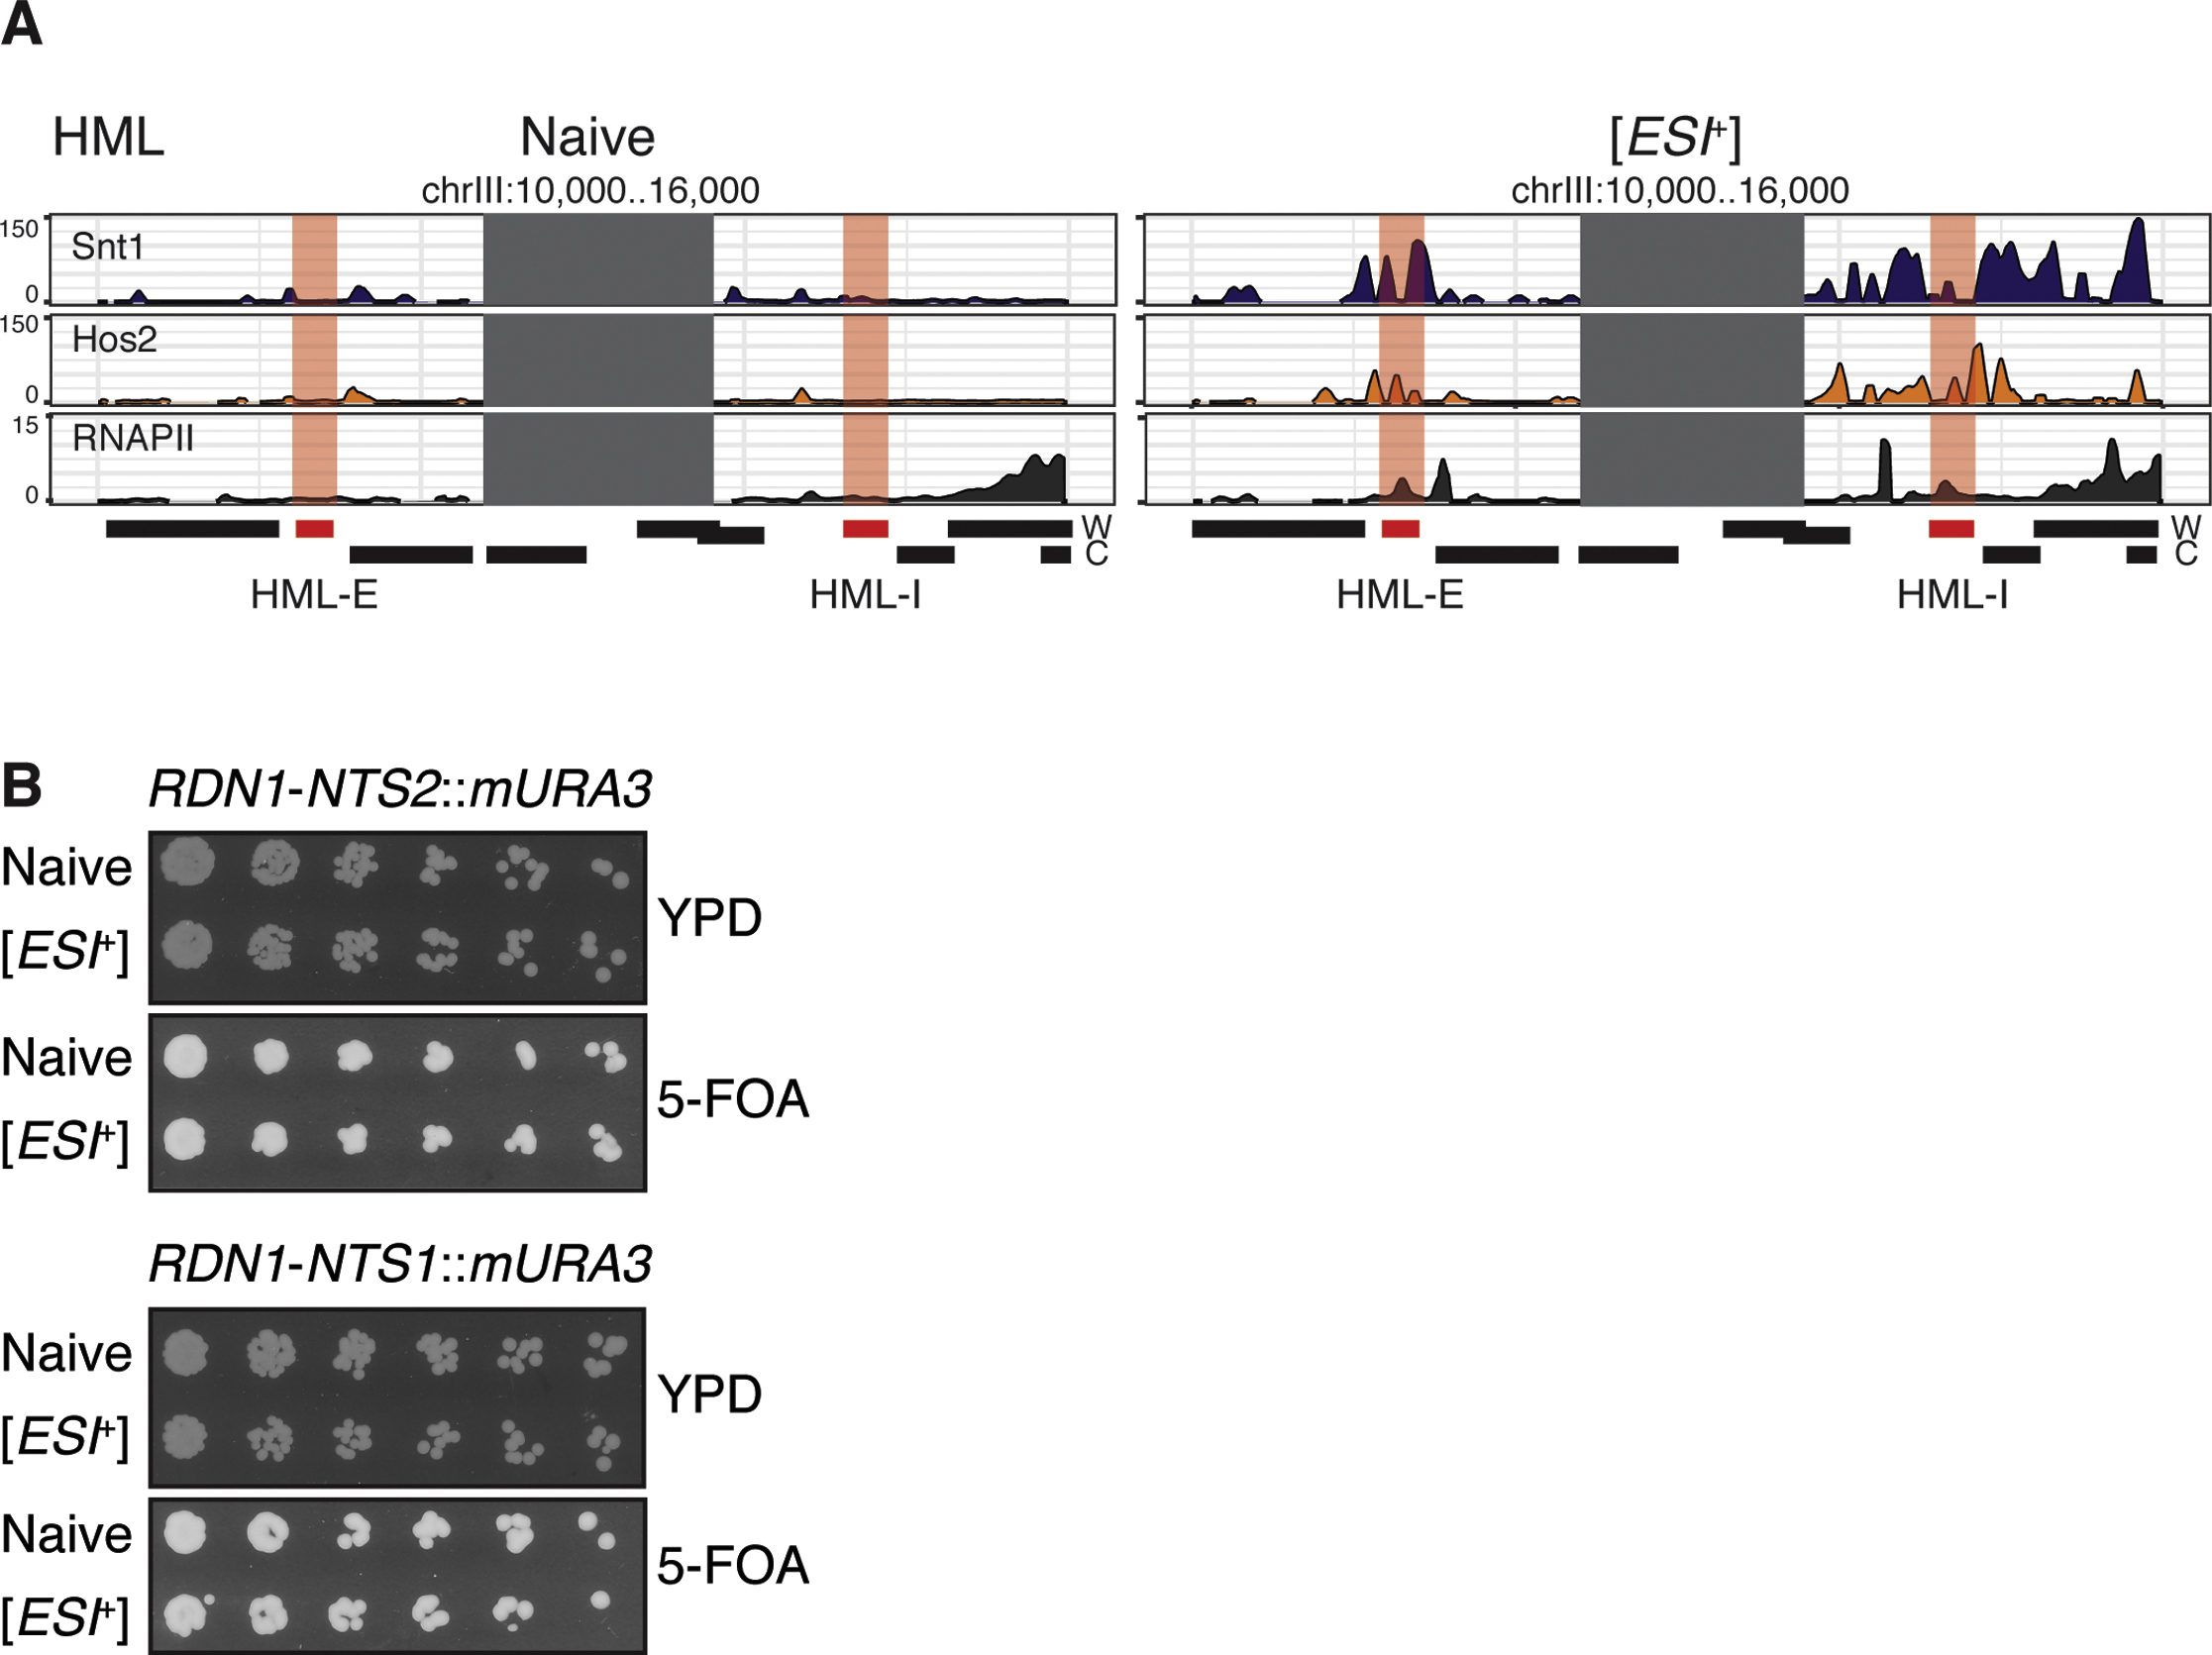
Given that HMLα/HMRa fall within the HAST domain where we observed activation by [ESI+], we wondered whether they might also be activated. In [ESI+] cells we observed increased transcript abundance by mRNA-seq for both HMLα and HMRa (Fig. 5A), and this was also driven by Set3C-dependent gene activation (Fig. S4A). As an orthogonal measure, we examined HMLα silencing in [ESI+] cells using a sensitive reporter (Dodson and Rine, 2015) where Cre is placed within the tightly silenced HMLα. Its transient expression converts a lox-flanked reporter locus from RFP to GFP expression (Fig. 5B), allowing de-repression to produce GFP-positive colony sectors. In this assay, [ESI+] colonies exhibited increased sectoring (p < 0.02; Fig. 5C–D), albeit weaker in magnitude than loss of SIR (e.g. sir1Δ, sir2Δ, Fig. 5C–D), suggesting that activation of this locus might be SIR independent. As an additional test, we used an established reporter (Huang et al., 2006) to examine expression of the ribosomal DNA locus, which is silenced exclusively by Sir2 (Guarente, 2000). Consistent a SIR-independent mechanism, we observed no difference in the silencing of the rDNA locus in [ESI+] cells (Fig. S4B).
Figure 5. HM Loci are collaterally de-repressed in [ESI+] cells.

A, HMLα and HMRa are transcribed in [ESI+] cells. Grey box represents area redundant with the MAT locus, which cannot be mapped with confidence. Data are the average of two biological replicates. B, Schematic of CRASH assay. C, Representative images of sectored colonies. More than 10 biological replicates were collected for each strain. D, Quantification of wild-type naïve and [ESI+] CRASH colonies for three biological replicates. p is from wt-test assuming unequal variance. E, Quantitative mating assay. Mating fraction was assessed by the number of colony forming units on diploid-selective medium vs. growth of the queried strain alone on non-selective medium. Data are from more than ≥10 biological replicates. Significance assessed by a t-test assuming unequal variance. See also Figure S4.
A hallmark of de-repressed heterochromatin in budding yeast is decreased mating efficiency due to expression of inappropriate mating pheromones. Consistent with partial loss of HML/R silencing, [ESI+] cells mated less efficiently than naïve (~2-fold; Fig. 5E). Curing [ESI+] by transient Hsp90 inhibition restored normal mating efficiency (Fig. 5E). [ESI+] thus reduces heterochromatic repression at the homothallic mating loci and sub-telomeres alike, leading to a partial loss of mating independently of SIR.
Set3C Interferes with Rap1 Binding to Drive Sub-Telomeric Expression
Given Set3C’s role in gene activation (Wang et al., 2002), we tested whether localization of Set3C components to sub-telomeres could explain enrichment for [ESI+]’s activation of them. In naïve cells, Snt1 and the Set3C catalytic subunit Hos2 weakly bound sub-telomeres (Fig. 6A–C; Fig. S5A–D), consistent with reports that Set3C indirectly affects sub-telomeric loci (Kim and Buratowski, 2009; Pijnappel et al., 2001). By contrast, in [ESI+] cells, sub-telomeric binding of both Snt1 and Hos2 increased substantially (Fig. 6A–C). This coincided with increased H4ac and RNAPII occupancy (Fig. 6A). Thus, [ESI+] coordinates Set3C subunits to activate gene expression. Enhanced binding was not due to increased expression of Set3C components; neither Snt1 nor Hos2 were differentially expressed in [ESI+] cells (padj > 0.2 and 0.8, respectively).
Figure 6. [ESI+] interferes with Rap1 silencing in sub-telomeres.

A, Example ChIP tracks of chrXIII TELR for Snt1, Hos2, Rap1, H4ac, H3ac, and RNAPII in naïve and [ESI+] cells. Green shaded box indicates Rap1-bound telomeric T(G)1–3 repeats. B–D, Quantification of the average ChIP-seq coverage normalized to input for Snt1, Hos2, and Rap1 in naïve and [ESI+] cells within the sub-telomeres (defined as the 25 kb from the chromosome end on either arm) for each chromosome. SE calculated from 2 biological replicates. E, Growth curves in 7.5 mM ZnSO4 for naïve and [ESI+] cells with and without Rap1 depletion with the Rap1-AA allele. Data are from three biological replicates. See also Figure S5.
However, increased Set3C binding was not restricted to sub-telomeric HAST domains (Fig. S5A–D), but instead occurred genome-wide. We thus searched for potential interactions that could explain the sub-telomeric enrichment among genes activated by [ESI+]. We focused on Repressor/Activator site binding Protein 1 (Rap1) for several reasons. First, synthetic lethal genetic interactions have been reported between RAP1 and both SNT1 and HOS2 (Usaj et al., 2017). Second, Rap1, which is conserved from yeast to mammals, has numerous context-dependent roles in activating and repressing transcription that mirror the specificity of [ESI+] (Shore, 1994; Shore and Nasmyth, 1987): it contributes to silencing sub-telomeres and HMLα/HMRa by supplementing Sir1-dependent recruitment of SIR, but has no effect on repression of the heterochromatic ribosomal DNA array (Kennedy et al., 1994). Third, transcripts up-regulated upon Rap1 depletion (Candelli et al., 2018; Kubik et al., 2015) overlap significantly with those up-regulated in [ESI+] cells (24% of up-regulated transcripts, p < 0.00015, hypergeometric test). Finally, even though Rap1 has activating and repressing functions genome-wide, Rap1 depletion leads to concentrated up-regulation in sub-telomeres in a ~50 kb domain adjacent to chromosome ends, just as we observed in [ESI+] cells (Fig. S5E).
To investigate the potential relationship between Rap1 and [ESI+], we performed ChIP-seq against Rap1. In naïve cells, Rap1 pervasively bound both telomeric repeats and sub-telomeres (Fig. 6A&D), consistent with its role in controlling transcription in the region. In [ESI+] cells, by contrast, Rap1 binding strongly decreased in the sub-telomeric regions where we observed gene activation and increased Set3C binding (Fig. 6A&D). However, its essential function in binding to telomeric repeats was unaffected (Fig. 6A; S5E–I). This implies that [ESI+] separates the function of these two binding contexts, preserving Rap1’s essential role in maintaining genome stability (Palladino et al., 1993; Shore, 1994).
Rap1’s activation functions throughout the genome were also reduced by [ESI+]. Transcripts downregulated in Rap1 hypomorphs overlapped strongly with those in [ESI+] cells (60.6%, p < 10−90, hypergeometric test). In genes that are Rap1-activated via upstream activating sequences (UAS) (Brindle et al., 1990; Shore and Nasmyth, 1987) binding was lost in [ESI+] cells, and expression of the downstream ORFs was reduced (Fig. S5J–L). Importantly, RAP1 was not differentially expressed in [ESI+] cells (log2 fold change = 0.79, padj = 0.067). Further, de-repression is highly unlikely to be linked to loss of SIR, as the domain of de-repression and loss of Rap1 binding extended far beyond SIR bound domains (~25 kb vs ~4 kb from chromosome ends for SIR) (Strahl-Bolsinger et al., 1997; Thurtle and Rine, 2014). These data support a model where Set3C’s increased binding to chromatin interferes with Rap1 binding and transcriptional function.
We next investigated epistatic interactions between Rap1 and the prion. Although Rap1 overexpression was toxic, we were able to reduce Rap1 levels using two approaches. First, we used an inducible Rap1 ‘Anchor Away’ hypomorph (Kubik et al., 2015). With normal levels of Rap1, [ESI+] cells grew much better than naive controls in the presence of zinc (Fig. 6E). By contrast, when we mildly reduced Rap1 levels, we saw that naïve cells phenocopied [ESI+] and also grew well in zinc (Fig. 6E). When we performed the same perturbation in [ESI+] cells, their growth in zinc was unaffected (Fig. 6E), suggesting that Rap1 was already inhibited in them. As an orthogonal measure, we performed an analogous experiment using CRISPRi, selecting a guide that reduced Rap1 levels (Fig. S5M), but did not significantly impact growth. The outcome was essentially identical; reduction of Rap1 levels phenocopied [ESI+] (Fig. S5N). Together, our data suggest that Set3C interferes with Rap1 binding in [ESI+] cells.
Sub-Telomeric Expression Facilitates General Stress Adaptation
Finally, we wondered whether [ESI+] might confer an adaptive advantage. The sub-telomeres are one of the most rapidly evolving and genetically diverse regions of the S. cerevisiae genome (Peter et al., 2018), harboring numerous stress response elements (Brown et al., 2010). Our mRNA-seq dataset included a number of differentially expressed genes that have been associated with resistance to multiple stresses, including antifungal drugs used clinically (Hoepfner et al., 2014; Vandenbosch et al., 2013), and natural products such as rapamycin (Hoke et al., 2008; Parsons et al., 2004; Xie et al., 2005).
We examined the response of [ESI+] cells to these conditions. [ESI+] cells grew robustly relative to their isogenic naïve counterparts in multiple stressors, including first line triazole antifungals (fluconazole and clotrimazole) (Fig. 7A–C) and rapamycin (Fig. 7D). Two lines of evidence suggest that these phenotypes are directly linked to [ESI+]. First, resistance to fluconazole was cured by transient Hsp90 inhibition(Fig. 7A–B). Second, many Snt1 aggregate transformants were also resistant to fluconazole (Fig. 7E). [ESI+]-associated resistance to these pharmacological agents are unlikely to be explained by simple up-regulation of ERG11, the target of azole drugs, or TOR1, the target of rapamycin (neither were substantially up-regulated in [ESI+] cells; log2 fold change 0.33 & 0.66; padj > 0.75 & 0.03, respectively). Rather, our data suggest that resistance is likely derived from the large number of stress responsive genes located in sub-telomeric domains and up-regulated by [ESI+] (e.g. YMR326C, YNL324W, YOR345C, YOR379C, YOL152W, YOR351C, YAL067C, and YCL074W). Regardless, these data establish that the heritably altered gene expression of [ESI+] cells gives rise to multiple adaptive traits.
Figure 7. [ESI+] confers stress resistance.

A, Growth of naïve, [ESI+], and cells in which [ESI+] had been eliminated by transient Hsp90 inhibition (‘Cured’) in 32 μg/ml Fluconazole. Curves are the mean ± standard error for 4 biological replicates. B, Quantified area under the curve (AUC) for the strains in (A). C, Growth of naïve and [ESI+] cells in 5 μM Clotrimazole. Curves are the mean ± standard error for 4 biological replicates. D, Growth of naïve and [ESI+] cells in 0.5 μM Rapamycin; mean ± SE for 3 biological replicates. Significance assessed by KS-test between naïve and [ESI+] curves. E, Histogram of AUC for protein transformants from (n = 48) in 32 μg/ml Fluconazole. Isolates more than 2 standard deviations above the mean BSA transformants (n = 24) are highlighted with shading. F, Proposed model for the mechanism of [ESI+]. Open triangles signify telomeres.
DISCUSSION
Our results stablish that a protein-based epigenetic element—the [ESI+] prion—can act to drive the transgenerational inheritance of an activated chromatin state (Fig. 7F). Whereas in naïve cells Set3C has a mix of activating and repressing functions, in the prion state it pervasively binds the genome, activating otherwise repressed sub-telomeric genes via interference with Rap1 function and RNA pol II recruitment. Expression of these otherwise repressed domains reveals expression of transcripts that drives a transcriptional program that that is often adaptive, fueling resistance to antifungal drugs and other stressors.
Inheritance of Activated Chromatin
Establishment of distinct functional domains of chromatin is essential for development, cell type specification, and response to environmental inputs. Whereas silent heterochromatin can be transmitted across cellular division, it has been argued that activated chromatin states cannot (Reinberg and Vales, 2018). The crux of this argument is that, unlike canonical silent histone marks (e.g. H3K9me2/3, H3K27me3), active marks such as histone acetylation do not have readers that can nucleate their re-establishment after genome duplication. Our data suggest that active chromatin can be inherited, but by an entirely different mechanism. Rather than a read-write paradigm, feedback encoded in a self-templating, regulated conformational switch of the Set3C chromatin modifying complex can be transmitted across cell divisions, establishing an activated domain in each subsequent generation. Notably, we and others have reported that a number of other chromatin-associated proteins also have prion-like properties (Chakrabortee et al., 2016a; Du et al., 2008), suggesting that this robust feedback mechanism may be broadly employed to stabilize epigenetic states across generations.
Prion Switching and Environmental Adaptation
Environmental stimuli can bolster prion gain and loss (Holmes et al., 2013; Jarosz et al., 2014a; Tapia and Koshland, 2014). Yet aside from general changes to protein homeostasis, the molecular mechanisms by which this might be achieved have remained largely enigmatic (Harvey et al., 2018). Here we show that a specific molecular event––phosphorylation of Snt1 within its intrinsically disordered domains upon prolonged G2/M cell cycle arrest—causes cells to acquire [ESI+]. However, constitutive phosphorylation is not required for [ESI+] to persist once this modification has faded from the population. Our results imply that phosphorylation may bias the conformational ensemble of Snt1 toward a self-templating fold proficient for seeding. Once this conformation is established, self-templating is sufficient to continue propagating [ESI+]. Although the structural basis for this observation remains as an exciting avenue of future investigation, these results provide a robust molecular means by which prions might be engaged by transient stimuli.
Development requires the establishment of discrete cell states. In this arena, the idea of bistability––two states separated by cooperativity and hysteresis––has proved a powerful concept (Xiong and Ferrell, 2003). Bistability is an all-or-nothing response, where once a threshold of activity is achieved, rapid and complete conversion to an alternate state occurs. The autonomous feedback inherent to prion-based conformational switching furnishes a robust means for achieving this behavior (Harvey et al., 2018). Given the pervasive role of phosphorylation within disordered sequences in signaling, and the link between Snt1 and Cdk1, our results hint that prion-based conformational conversion could be far more integral to normal biology than previously appreciated.
Our data provide a striking example of how prion-based phenotypic bistability can be adaptive in fluctuating environments. [ESI+] allows cells to record a past cell cycle insult, mounting a transcriptional response that makes them better able to survive in stressful conditions precisely when they are most ill-suited to their environment. Further, if all else fails, they can more rapidly differentiate into a stress resistant spore. The ability to disengage the prion, via modest changes in Hsp90 chaperone activity, is likewise critical as, in haploids, [ESI+] renders cells less able to mate due to collateral expression of the homothallic mating loci.
Prions allow cells to rewire their metabolism (Jarosz et al., 2014a; Jarosz et al., 2014b), and even alter the way they translate proteins (True et al., 2004; True and Lindquist, 2000). Here we show that the scope of prion conformational conversion is greater still, heritably altering chromatin state, and consequently transcription, one of the earliest steps of decoding the genome. Given that the chromatin domains most strongly affected by [ESI+] are among the most polymorphic in the genome (Peter et al., 2018), our results provide a strong argument for the power of this protein-based form of epigenetics to spark heritable diversification of phenotypic landscapes.
Prions and Distinct Activity States
It has been proposed that prion conformational conversion might be a mechanism by which distinct activity states of proteins or complexes can be established from the same assembly of peptides (Chakravarty et al., 2019; Jarosz and Khurana, 2017). In the context of chromatin, histone deacetylase complexes, including Set3C, often play dual roles as either activators or repressors (Nusinzon and Horvath, 2005) (Kim and Buratowski, 2009; Kim et al., 2012; Pijnappel et al., 2001; Wang et al., 2002). Our results suggest that [ESI+] can disambiguate these opposing functions. Whereas in naïve cells Set3C has a mixture of activities during times of environmental fluctuation (Kim et al., 2012), in [ESI+] cells a new function in activating sub-telomeric HAST domains emerges that is stable over long biological timescales. Given the ubiquity of seemingly contradictory transcriptional roles, and prion-like domains, in chromatin-associated proteins (Alberti et al., 2009; Chakrabortee et al., 2016a), it seems possible that self-templating conformational conversion may commonly tune the functions of such proteins and complexes.
A growing body of work suggests that prion-like conformational conversion may be common both within proteomes (Alberti et al., 2009; Chakrabortee et al., 2016a) and throughout life (Chakrabortee et al., 2016b; Fioriti et al., 2015; Halfmann et al., 2012; Kruttner et al., 2012; Majumdar et al., 2012; Stephan et al., 2015; Yuan and Hochschild, 2017). We and others have found that prion proteins in the S. cerevisiae proteome are highly enriched in factors important for gene control: chromatin modifiers, transcription factors, and RNA binding proteins. Further, the orthologs of many fungal prions are also predicted to be disordered across eukaryotes, including the human Snt1 ortholog NCOR1, which is part of the NCOR-SMRT histone deacetylase (Yang and Seto, 2008). Many retain self-templating properties (Chakrabortee et al., 2016a). From this vantage point and given the strong inducibility and stress resistance of [ESI+], we anticipate that adaptive protein self-assembly may be commonly integrated into networks of chromatin-templated processes.
STAR METHODS
LEAD CONTACT AND MATERIALS AVAILABILITY
Further information and requests for resources and reagents should be directed to and will be fulfilled by the Lead Contact, Daniel Jarosz (danjarosz.aa@gmail.com).
All unique/stable reagents generated in this study are available from the Lead Contact with a completed Materials Transfer Agreement.
EXPERIMENTAL MODEL AND SUBJECT DETAILS
All experiments were performed in Saccharomyces cerevisiae. The vast majority of experiments were performed in the BY4741 background acquired from GE Dharmacon. For select experiments using reporter strains, W303 or S288C were used, as noted in the Key Resources table. Deletion and GFP fusion strains were obtained from libraries deposited in GE Dharmacon and were verified by PCR and immunoblot of the modified locus. All yeast strains were stored long-term in glycerol stocks at −80 °C, and all passaging was performed predonminantly on either YPD agar or broth at 30 °C. For experiments requiring episomal expression, CSM drop-out media (agar or broth) was used for selection and maintenance. For heterologous protein expression, Escherichia coli LOBSTR-BL21(DE3)-RIL was used. Culturing of these strains was performed in LB media supplemented with chloramphenicol and ampicillin at 37 °C.
METHOD DETAILS
Manipulation of Strains
Yeast transformation was performed by either electroporation or heat shock using standard protocols (Guthrie and Fink, 1991). For generation of myc-tagged strains, one-step PCR amplification was performed to generate a 13xmyc-kanMX6 product with flanking homology, which was then introduced to the appropriate strain and locus by homologous recombination of the linear PCR product via standard heat shock transformation (Bahler et al., 1998). For curing of [ESI+] by transient Hsp90 inhibition, this was done similarly to as previously described (Chakrabortee et al., 2016a). Briefly, strains were passaged through 2–3 single-cell bottle-necks on YPD agar containing 5 μM radicicol. Hsp90 function was then restored by passaging once on YPD prior to phenotyping.
Site-Directed Mutagenesis and Molecular Cloning
Site directed mutagenesis was performed using the QuikChange Lightning kit (Agilent) on a clone of Snt1 in the Gateway-compatible pDONR221 backbone. After sequence verification, expression clones were generated in Advanced Gateway Library plasmids (Alberti et al., 2007) using standard Gateway cloning methods. All other cloning was performed by Gibson assembly (Gibson et al., 2009) using standard protocols.
Yeast Growth and Sporulation Assays
Growth curves were generated by continuously monitoring OD600 of cultures grown under the indicated stress conditions. For these experiments, yeast culture was performed in either 96- or 384-well plates, at 30 °C with shaking, on a Biotek Eon plate reader. To minimize desiccation, all assays were performed in Nunc Edge plates (Thermo Fisher Scientific) with humidification. Growth parameters were calculated in R using the Growthcurver package (https://cran.r-project.org/web/packages/growthcurver/vignettes/Growthcurver-vignette.html).
After diploids were generated by mating and auxotrophic selection, sporulation was induced by growing yeast to saturation at 30°C in pre-sporulation media (0.8% yeast extract, 0.3% Bacto-peptone, 10% dextrose, 100 mg/L adenine sulfate). Cultures were washed briefly in sterile water and resuspended in one volume enriched sporulation medium (10 g/L potassium acetate, 1 g/L yeast extract, 0.5 g/L dextrose, 0.1 g/L supplement). The supplement consisted of a mixture of 1:1:5 (by mass) of uracil, histidine, and leucine. Sporulation was performed at 25°C for 2 days, and then at 30°C for 3 days (5 days in total). Cultures were then analyzed morphologically to determine the fraction of tetrads as a fraction of the total cell population.
Heterologous Protein Expression
A gateway compatible plasmid was designed for protein expression such that any open reading frame of choice could be N-terminally linked to a His10-Smt3 tag and C-terminally to a SNAP tag. Full-length Snt1 was cloned into this expression plasmid and subsequently transformed into E. coli LOBSTR-BL21(DE3)-RIL cells. A 6-liter culture expressing Snt1 was grown at 37°C in Luria-Bertani medium containing 100 μg/ml ampicillin and 25 μg/ml chloramphenicol until the OD600 reached ~0.8. The culture was then adjusted to 1 mM IPTG and incubated for 5 h at 37°C with continuous shaking. The cultures were then collected by centrifugation and resuspended in 2 ml of E buffer (Logie and Peterson, 1999; Pijnappel et al., 2001) (20 mM HEPES (pH 8.0), 350 mM NaCl, 10% glycerol, 0.1% Tween 20, and 1× Roche Complete EDTA-free protease inhibitor). Each culture was then frozen in small pellets (~1 mm diameter) by extrusion into liquid nitrogen. Cryogenic lysis was performed in a Retsch CryoMill planetary ball mill (Verder Scientific, Haan, Germany). Briefly, after all grinding jars and components were cooled in liquid nitrogen, lysis was performed using six cycles of 3 minutes at 15 Hz, with 2 min of additional cooling in liquid nitrogen between cycles. The resultant lysates were then diluted by the addition of 15 ml of binding buffer per liter of starting cultures, and then thawed on ice. While thawing, benzonase (Sigma Aldrich, E1014–25KU; 1 μl) was added to completely digest all nucleic acids. Lysate was clarified by centrifugation for 30 min at 30,000 × g at 4 °C. The soluble extract was mixed for 1 h with 12 ml of a 50% slurry of Ni-NTA resin (Qiagen) that had been equilibrated in buffer E. The resin was recovered by gentle centrifugation and then washed three times with 12 ml of buffer E. The column was washed serially with 12 ml of buffer E with 25 and 50 mM imidazole, and then bound proteins were eluted step-wise in 12 ml aliquots of 100, 200, 300, 400, and 500 mM imidazole in buffer E. The elution profile was monitored by SDS-PAGE. The 200 mM imidazole eluate fractions rapidly formed visible aggregates, which we subsequently purified by washing overnight with E buffer containing 4 M urea. The subsequent aggregate, which was gel-like, was confirmed to contain the protein of interest (His10-Smt3-Snt1-SNAP) by both immunoblot against the SNAP tag, as well as mass spectrometry.
Protein Transformation
Protein transformations were performed as previously reported (Chakravarty et al., 2019). Mid-exponential cultures of naïve BY4741 and snt1Δ strains were washed with sterile water and 1 M sorbitol. The cell pellets were finally resuspended in SCE buffer (1M sorbitol, 10 mM EDTA, 10 mM DTT, 100 mM Na-Citrate pH 5.8). This resuspensate was then adjusted to 0.55 – 1.83 U/ml of Zymolyase®−100T (amount depended on genetic background) and incubated at 37°C for 10–15 min to make spheroplasts. These spheroplasts were pelleted by a gentle spin, washed with 1M sorbitol, and resuspended in STC buffer (1 M sorbitol, 10 mM CaCl2, 10 mM Tris pH 7.5) by a gentle tap on the culture tube walls. All subsequent steps involving liquid transfer of these spheroplasts were done with 1 ml pipette tips that had been blunted by cutting with a sterile razor blade. These spheroplasts were incubated with salmon sperm DNA, carrier plasmid with a LEU2 marker (pAG415-GPD-ccdB, (Alberti et al., 2007), and Snt1-SNAP protein or BSA (at 1 μM) at room temperature for 30 minutes. Fusion was induced in these spheroplasts by adding 9 volumes of PEG buffer (20% (w/v) PEG 8000, 10 mM CaCl2, 10 mM Tris, pH 7.5) and incubating at room temperature for 30–60 minutes. These reaction conditions concomitantly generated Snt1 condensates from full-length protein. These spheroplasts were collected and finally resuspended in 250 μl of SOS buffer (1M sorbitol, 7 mM CaCl2, 0.25% yeast extract, 0.5% bactopeptone) by pipetting with cut pipette tips. This mixture was incubated at 30°C for 3 h after which these cells were plated on a SD-Leu solid media that had been supplemented with 1.2 M sorbitol. Following plating, these cells were overlaid with a soft agar (0.8% agar) of an otherwise identical composition and the plates were incubated at 30°C for 5 days.
Quantitative Mating Assay
Mating frequencies for naïve and [ESI+] cells were measured essentially as described by Guthrie and Fink (Guthrie and Fink, 1991). Briefly, query strains were exposed to a vast excess of cells of the opposite mating type, and then incubated at 30 °C for ~5 hrs. Cells were then plated onto diploid-selective growth medium and then colony forming units were quantified and normalized to the number of colonies that developed from identical cultures that were not subjected to mating.
Immunoblotting
SDS-PAGE separation was performed on commercially available Tris/Glycine (Bio-Rad) or MOPS (GenScript) systems using standard methods. For phosphoprotein-impeding electrophoresis (‘Phostag’, Wako Chemicals), separations were performed on commercially available polyacrylamide gels containing Zn2+ that coordinate phosphorylated residues to slow their migration through the matrix. After separation, metal ions were stripped from the gel by washing three times for 10 min in 10 mM EDTA, pH 8. Immunoblotting was performed by transfer to a 0.2 μm PVDF membrane using a Bio-Rad Transblot Turbo. Membranes were blocked in 5% non-fat dry milk dissolved in TBST. Antibodies, described in the text or below, were detected using enhanced chemiluminescence following incubation with either anti-rabbit or anti-mouse HRP conjugates (Bio-Rad catalogue no. 1706515 and 1706516, respectively), which were diluted 1:3,000 in blocking buffer. Anti-PGK1 (Invitrogen catalogue no. 459250) was used as a loading control in assays of whole cell lysates.
Histone Isolation and Analysis
Histones were isolated from acid-extracted nuclei as described previously (Edmondson et al., 1996). Briefly, cultures were grown to saturation in YPD. Cells were collected by centrifugation, washed briefly in sterile water, resuspended in buffer (0.1 mM Tris pH 9.4, 10 mM DTT), and incubated at 30°C with shaking for 15 min. Cells were then washed once with S1 buffer (1 M sorbitol, 20 mM HEPES, pH 7.4) and resuspended in S1 buffer, and 1/25th volume of 10 mg/ml Zymolyase 100T (Sunrise Science Products) in S1 buffer was added. Cultures were then incubated for 30 min at 30 °C. An equal volume of ice-cold S2 buffer (1 M Sorbitol, 20 mM PIPES pH 6.8, 1 mM MgCl2) was added, and the cells were collected by centrifugation. Cells were then washed three times in 1 ml A buffer (10 mM Tris pH 8.0, 0.5% NP-40, 75 mM NaCl, 1× Roche EDTA-free protease inhibitor cocktail), with incubation on ice for 15 min for the first two washes and 5 min for the last. Cells were then washed once in B buffer (40 mM HEPES pH 8.0, 0.4 M NaCl, and Roche EDTA-free protease inhibitor cocktail), incubated on ice for 10 min, collected by centrifugation, and washed once more briefly with buffer B. Finally, cells were collected by centrifugation, resuspended in 1 ml 0.4 N H2SO4, and incubated on ice for 30 min with periodic vortexing. Cell debris was cleared by centrifugation at 20,000 × g for 10 min at 4°C, and the resultant supernatant was transferred to a fresh tube and TCA precipitated. Samples were then analyzed by SDS-PAGE followed by immunoblotting. Antibodies used were as follows: anti-H3 (1:5,000; Abcam 1791); anti-H4 (1:1,000; Abcam 10158); anti-H3 pan-acetyl (1:1,000; Upstate 06–599); anti-H4 pan-acetyl (1:1,000; Upstate 06–866). All antibodies were previously validated elsewhere (Kim and Buratowski, 2009).
Total RNA Isolation, Reverse Transcription, and RNA-seq
Total RNA was extracted from diploid yeast strains grown to mid-exponential phase (OD600 ~0.5) using a standard hot acid phenol protocol followed by chloroform extraction and ethanol precipitation. Afterwards, RNA was resuspended in DEPC-treated water and quantified on a NanoDrop spectrophotometer. Further quality control and ribosomal RNA evaluation was performed by analysis on an Agilent Bioanalyzer 2100 Nano RNA assay at the Protein and Nucleic Acid Facility (Stanford). For library generation, ERCC spike-in controls (Invitrogen) were added, and total RNA was reverse-transcribed by on-bead polyA-tail priming with Superscript IV (Invitrogen), and then fragmented on a Covaris E220 to a size range of 200–400 bp. Fragmented cDNA was end-repaired and A-tailed, and dual-index sequencing adaptors were ligated using the NEBNext Ultra II DNA Library Prep Kit.
Prepared libraries were sequenced on the Illumina HiSeq 4000 platform at the Stanford Functional Genomics Facility using paired-end reads. Quality control of the data was performed using FastQC (Babraham Institute). Transcript-level quantification against the Saccharomyces cerevisiae strain 288C reference genome assembly R64 available from ENSEMBL was performed using Kallisto (Bray et al., 2016). Differential expression analysis was performed using DESeq2 (Love et al., 2014) in R, in which all subsequent data manipulations were performed. Significantly differentially regulated transcripts were called using the multiple-hypothesis corrected p value calculated using DESeq2’s default settings, Benjamini-Hochberg, which approximates the false discovery rate (FDR). Overlap between differential expression of datasets generated by this study and by others was performed using a hypergeometric test. All other analyses were performed with sequencing-depth-normalized coverage maps generated by aligning reads to the same reference genome using Bowtie2 (Langmead and Salzberg, 2012). Genome-wide per-basepair coverage was calculated using BEDtools (Quinlan and Hall, 2010). The density of up-regulation was calculated by creating ~1 kb bins across all chromosomes, and then calculating the ratio of increased to decreased counts.
Chromatin Immunoprecipitation followed by Sequencing
Chromatin isolation was performed using a protocol adapted from Kuras and Struhl (Kuras and Struhl, 1999). One-half liter of diploid cells were grown to mid-exponential phase per ChIP to be performed, and then fixed with 1% formaldehyde for 1 hr before collection by centrifugation. Cells were resuspended in FA lysis buffer (50 mM HEPES-KOH, pH 7.5, 150 mM NaCl, 1 mM EDTA, 0.1% sodium deoxycholate, 1% triton X-100, 1X Roche Complete Protease Inhibitors) with 0.5% SDS added, and then lysed using acid-washed glass beads for 15 min at 50 Hz. Chromatin was then precipitated by ultracentrifugation at 237,000 × g for 30 min, then resuspended in 1 ml FA lysis buffer with 0.1% SDS. Chromatin suspension was then fragmented to predominant final DNA length of ~150–200 bp in a Covaris E220 ultrasonicator, and then clarified by centrifugation at 20,000 × g for 30 min. 10% of the resultant chromatin preparations was reserved as input controls.
Pan-acetyl H3 (H3ac), pan-acetyl H4 (H4ac), and RNA Pol II ChIPs were performed using antibody-coupled Protein G Dynabeads (antibodies used, respectively: Upstate 06–599, Upstate 06–866, and Active Motif 39097). After precipitation overnight in FA buffer containing 0.1% SDS and 275 mM NaCl, H3ac and H4ac precipitations were washed once with FA buffer containing 0.1% SDS and 500 mM NaCl, once with buffer containing 0.1% SDS and 750 mM NaCl, once with wash buffer (10 mM Tris-HCl, pH 8.0, 0.25 M LiCl, 1 mM EDTA, 0.5% NP-40, 0.5% sodium deoxycholate), and once with TE before being eluted in TE with 1% SDS at 65 °C. Snt1-myc, Rap1-myc, and Hos2-myc precipitations were all performed with c-Myc affinity agarose (Sigma-Aldrich A7470) blocked with 2% BSA. After precipitation overnight in FA buffer with 0.1% SDS and 275 mM NaCl, all were washed once with FA buffer with 0.1% SDS and 275 mM NaCl, once with the same buffer but with 500 mM NaCl, one with wash buffer, and once with TE before being eluted in TE with 1% SDS at 65 °C.
After elution, proteinase K was added (final concentration 0.2 mg/ml) and incubated at 37 °C for 2 hrs before crosslink reversal at 65 °C overnight. Precipitants were then cleaned using a standard phenol:chloroform:isoamyl alcohol extraction followed by isopropanol precipitation overnight. DNA was then resuspended in DEPC-treated water, and then the concentration was measured by Qubit spectrophotometer. Libraries for sequencing were then generated using the NEBNext Ultra II DNA Library Prep Kit, and sequencing was performed on the Illumina HiSeq 4000 platform at the Stanford Functional Genomics Facility.
Quality control of ChIP-seq libraries was performed using FastQC (Babraham Institute), as with RNA-seq libraries. Reads were then aligned to the Saccharomyces cerevisiae strain 288C reference genome assembly R64 available from ENSEMBL using Bowtie2 (Langmead and Salzberg, 2012), and genome-wide per-basepair coverage was calculated using BEDtools (Quinlan and Hall, 2010). Coverage calculations were then normalized for sequencing depth, and then ChIP libraries were normalized by per-basepair coverage of parallelly sequenced input chromatin libraries. Chromosome-wide binding density as a function of distance from telomeres was calculated as the ratio of ChIP-enriched (log2 ChIP/Input > 0) to ChIP-depleted (log2 ChIP/Input < 0) across ~1 kb bins. For differential binding densities, a similar calculation was performed on differential coverage tracks (log2 [ESI+] – log2 Naïve).
Cre-Reported Altered States of Heterochromatin (CRASH) assay
The Cre-Reported Altered States of Heterochromatin (CRASH) assay was conducted essentially as described by Dodson and Rine (Dodson and Rine, 2015). Naïve and [ESI+] CRASH haploids were grown in medium lacking tryptophan and supplemented with G418 (200 mg/L). The OD600 of each culture was measured, and ~20 cells of each strain were spread onto thin SD-Trp, 1% agar plates. Each plate was imaged with a Leica M205 FA.
Immunoprecipitations
Immunoprecipitation of Snt1 was performed on diploid cells harboring a genomically-integrated fusion of a C-terminal 13xmyc-kanMX6 tag at one allele of the appropriate locus,. Ability of the tagged version to hold both naïve and [ESI+] conformers was confirmed by growth assay. For each immunoblot, 1 L of mid-exponentially grown cells (OD600 ~0.5) were grown in either rich (YPD) or selective (synthetic complete drop-out medium). The cultures were then collected by centrifugation and resuspended in 500 μl of binding buffer (Logie and Peterson, 1999; Pijnappel et al., 2001) (20 mM HEPES (pH 8.0), 350 mM NaCl, 10% glycerol, 0.1% Tween 20, and 1× Roche Complete EDTA-free protease inhibitor). Each culture was then frozen in small pellets (~1 mm diameter) by extrusion into liquid nitrogen. Cryogenic lysis was performed in a Retsch CryoMill planetary ball mill (Verder Scientific, Haan, Germany). Briefly, after all grinding jars and components were cooled in liquid nitrogen, lysis was performed using six cycles of 3 minutes at 15 Hz, with 2 min of additional cooling in liquid nitrogen between cycles. The resultant lysates were then diluted by the addition of 4.5 ml of binding buffer per liter of starting cultures, and then thawed on ice. Lysates were then clarified by ultracentrifugation at 200,000 × g for 45 min at 4°C.
c-Myc agarose affinity gel (40 μl per liter of starting culture; Sigma-Aldrich A7470) was blocked prior to use, and then added to clarified lysates, which were incubated for 2 hr with rotation at 4°C. Beads were collected by gentle centrifugation and washed four times with binding buffer, and then precipitates were eluted by boiling in loading dye and analyzed by SDS-PAGE/immunoblotting. Blots were probed with either anti-c-Myc (Abcam ab32) at 1:1,000 dilutions.
Limited Proteolysis
Limited proteolysis was performed on immunoprecipitated protein from native lysates. Lysis was performed as described in the previous section. For seeding experiments, 5% by mass of unlabeled [ESI+] lysate was added to similarly prepared naïve lysates derived from Snt1–13xmyc strains, and then incubated overnight at 4°C with rotation. Total lysate from both naïve and [ESI+] cells (20 mg/sample) was immunoprecipitated for 2 hr at 4 °C on c-Myc agarose affinity gel (40 μl) previously blocked with 2% BSA in E buffer at 4 °C for 2 hrs. The affinity gel was then washed four times with proteinase K buffer (20 mM Tris pH 8.5, 1 mM DTT), and the beads were resuspended in 40 μl of proteinase K buffer and divided into 10 μl aliquots; 10 μl of proteinase K buffer supplemented with 50 pg of proteinase K was added directly to each aliquot of bead slurry. Reactions were carried out at 37 °C and quenched by the addition of 20 μl of 5× SDS loading dye followed by boiling at 95°C. Analysis was then performed by SDS PAGE followed by immunoblotting as described in the previous section.
CRISPRi Knockdowns
All CRISPRi knockdowns were performed using a one-vector system in which Mxi1 is used to silence dCas9-targeted transcripts (Smith et al., 2016). Guide sequences for Rap1 were designed using the Yeast CRISPRi database (http://lp2.github.io/yeast-crispri/). We tested several guides of varying strength, the majority of which were extremely toxic to the cells. Thus, we settled on a modestly-acting guide that gave a down-regulation of >50% as verified by imaging of Rap1-GFP strains. For shuffle control, the sequence 5′- TAATTTTCGGACACGACTTA-3′ was used, whereas 5′-GGGTGTTGAAGAAATGATTG-3′ was used for Rap1-targeting. Complete CRISPRi constructs were generated via Gibson assembly of single-stranded DNA oligos PCR-amplified with universal adaptors into NotI-digested empty vector. Knockdown of ORFs was induced via addition of anhydrotetracycline (ATc; final concentration 250 ng/ml) to strains grown in CSM-Ura liquid medium.
QUANTIFICATION AND STATISTICAL ANALYSIS
Throughout the manuscript, n generally refers to the number of clonal isolates for a specific strain and condition, unless otherwise noted in the appropriate figure legend (i.e. where a replicate refers to separate induction events, rather than just clonal isolates). For all figures, replicates are noted in the legend, and where possible and appropriate, all points for all replicates are plotted. Unless otherwise stated in the appropriate figure legends, all t-tests were 2-tailed, unpaired, and assuming equal variance and calculated using GraphPad Prism v. 7. All other statistical tests were performed in R, and are noted in the appropriate figure legend. Generally, the average was calculated as the mean, and expressed with the standard error, unless otherwise noted in figure legends. For growth curve quantifications, the empirical area under the curve (AUC) metric was used, and was normalized to naïve, wild-type strains grown concurrently to standardize experiments. For all claims of statistical significance, a critical threshold of 0.05 was used for unadjusted p-values. For mRNA-seq, the threshold was set to the DESeq2 default of 0.1 Benjamini-Hochberg adjusted p-value. For disorder propensity calculations, DISOPRED2 (Ward et al., 2004) was used. No statistical methods were used to determine sample size, and no data were excluded.
DATA AND CODE AVAILABILITY
All mRNA-seq data are deposited under accession numbers GSE117624 and GSE128672 in the Gene Expression Omnibus (GEO). ChIP-seq data are deposited in the Sequence Read Archive (SRA) under accession number PRJNA528459. All other source data are available upon request to the Lead Contact.
Supplementary Material
Figure S4
Related to Figure 5
A, Example ChIP-seq tracks for Snt1, Hos2, Rap1, and RNAPII in naïve and [ESI+] cells for the HML locus. ALPHA1 and ALPHA2 are greyed due to redundancy with the MAT locus that prevents accurate mapping. Salmon bars highlight the HML-E and HML-I silencer elements. Data are representative of 2–3 biological replicates. B, Phenotypic assay for rDNA expression for two different reporters from Huang, et al. 2006. Spotting performed with 5-fold dilutions from left to right and are representative of four biological replicates.
Figure S5
Related to Figure 6
A and C, Representative ChIP tracks for Snt1 (A) and Hos2 (C) in naïve and [ESI+] cells for chrIV:600,000..625,000. ORFs are cartooned below with Watson (W) and Crick (C) strands designated. B and D, Average ChIP-seq coverage normalized to input for non-sub-telomeric (distances greater than 25 kb from chromosome ends) regions in naïve and [ESI+] cells. Standard error bars are from 2–3 biological replicates, and all chromosomes are represented individually. E, Differential transcriptional density (ratio of up-regulation to down-regulation) of transcription in Rap1-AA cells upon addition of Rapamycin in ~1 kb bins as a function of distance from telomeres. Data are from Candelli, et al. 2018. F–H, Example ChIP tracks for Rap1 in naïve and [ESI+] cells at telomeric T(G)1–3 repeats, which are specifically indicated with arrows. Colored bars below highlight X and Y’ elements. Data are representative of two biological replicates. I, ChIP density plot quantifying the maintenance of telomeric Rap1 binding in [ESI+] cells. A value of 1 (indicated by dashed line) indicates no difference in the degree of binding in a particular bin between naïve and [ESI+] cells. Arrow and red shading are added to emphasize the telomeric binding of Rap1. Data are the average of all telomeres and biological replicates. J–L, (Left), Rap1 ChIP-seq tracks in naïve and [ESI+] cells for the TEF2, ENO1, and ENO2 loci, which have defined Rap1-dependent UAS binding, and ensuing transcription activation. Data are representative of 2 biological replicates. (Right), Mean reads per million (RPM) from mRNA-seq from 2 biological replicates for TEF2, ENO1, and ENO2 in naïve and [ESI+] cells. padj for differential expression is a Benjamini-Hochberg corrected value from a binomial test generated with the default setting of DESeq2. M, CRISPRi reduces Rap1 protein levels. Cells were grown in complete synthetic media with 2% dextrose and lacking uracil and with ATC. Micrographs are representative of three biological replicates, and are quantified in a histogram below. Scale bar is 5 μm. N, Normalized area under the curve (AUC) in 10 mM ZnSO4 in complete synthetic media lacking uracil for naïve and [ESI+] strains in which Rap1 was knocked down (KD) via CRISPRi in the presence of anhydrotetracycline (ATC, indicated by ‘+ Rap1 KD’). At least three biological replicates are presented for each.
Figure S2
Related to Figure 2
A, Histogram of normalized area under the curve (AUC) in 7.5 mM ZnSO4 of haploid single-cell isolates (33) from passaged nocodazole inductions. Mean growth of type strains for naïve and [ESI+] (both three biological replicates) are indicated by dashed lines. Shaded area represents isolates exhibiting elevated zinc resistance, defined as growth rates falling more than 3 standard deviations greater than the naïve mean. All growth rates are normalized to naïve type strains. B, anti-c-Myc immunoblot of naïve and [ESI+] type strains separated on either a phosphoprotein-impeding gel (top, ‘phostag’) or standard SDS-PAGE. Three biological replicates were performed with similar results. C, Immunoblot of naïve diploid cells episomally expressing the indicated Snt1 variant under the control of a galactose-inducible promoter in media containing 2% raffinose. PGK1 was used as a loading control.
Figure S1
Related to Figure 1
A, Predicted prion-like score for Snt1 by PLAAC (Alberti et al. 2009), with a score of 1 corresponding to high prion-like (PrD) character, and 0 low prion-like character. B, Fluorescence microscopy of mid-logarithmically growing naïve and [ESI+] cells harboring an endogenous Snt1-GFP fusion. Representative of more than three biological replicates. Scale bar, 5 μm. C, Growth of naïve (n = 4), [ESI+] (n = 4), and [ESI+] meiotic progeny (n = 14) at a high concentration (10 mM) ZnSO4. D, Schematic describing the crossing strategy for cytoduction experiments presented in (E). E, growth in 5 mM Zn for zinc-sensitive SK1 background yeast cytoduced with either naïve or [ESI+] cytoplasm (n = 3). F, Quantification of limited proteolysis kinetics to accompany Fig. 1G. Trajectories are the ratio of full-length Snt1 in naïve cells to that in [ESI+] cells at that timepoint. Each replicate’s points are connected with lines, and the data are fit with a linear function. The statistical significance is assessed by an F-test. G, Normalized AUC in 10 mM ZnSO4 for control protein transformations of Snt1 aggregates (n = 24; Fig. 1H) into snt1Δ cells compared to the parent strain (n = 4).
Figure S3
A, Immunoblot of acid extracted histones from isogenic haploid naïve and [ESI+] cells. Blots are representative of three biological replicates, which are quantified by densitometry alongside. B, Representative standard curves for spike in controls used in mRNA-seq. C, Pairwise transcriptional overlaps between [ESI+] and Set3C deletions, with overlapping genes in grey. Transcripts are defined as being differentially regulated by a Benjamini-Hotchberg adjusted p value less than 0.1. The significant of the overlap for [ESI+] is, by hypergeometric test: for up-regulated transcripts, [ESI+] vs. snt1Δ, p < 1.66 × 10⁻⁵, [ESI+] vs. hos2Δ, p < 3.05 × 10−129; [ESI+] vs. set3Δ, p < 6.84 × 10−48; and for down-regulation are as follows: [ESI+] vs. snt1Δ, p < 1.25 × 10⁻⁵, [ESI+] vs. hos2Δ, p < 7.36 × 10−258, [ESI+] vs. set3Δ, p < 1.98 × 10−110. D, Heatmap of the 3’ transcription end sites (TES) for the top 500 [ESI+] up-regulated genes for H4ac, RNAPII, and Snt1 ChIP-seq. Data are representative of at least two biological replicates. E and F, Example ChIP tracks for Snt1 and RNAPII at (E) the SSP2 locus and (F) the SPO14 locus in naïve and [ESI+] cells. Arrows indicate RNAPII accumulation at the 3’ of SSP2 and an alternative transcription start site (TSS) of SPO14. G, Quantification of sporulation at 5 days by morphological analysis. Three biological replicates were included in the analysis, and at least 300 cells were counted for each replicate, and the experiment was performed three times with similar results. All error bars are the standard error measurement.
[ESI+] is a prion conformer of the Set3C histone deacetylase scaffold Snt1.
[ESI+] heritably activates transcription at otherwise repressed loci.
Activated loci are enriched for sub-telomeres via interference with Rap1 by [ESI+].
Sub-telomeric expression confers a generally adaptive transcriptional state.
Acknowledgments
We thank G. Crabtree, J. Kirkland, F.Berger, and members of the Jarosz laboratory for critical reading of the manuscript and helpful discussions. This work was supported by grants to DFJ from the NSF (MCB1453762), NIH (DP2GM119140), the Vallee Foundation, and the David and Lucile Packard Foundation (2015-63121). ZHH was funded through NIH T32GM113854, and RAF is funded by a NSF GRFP. AKC was supported as a Howard Hughes Medical Institute fellow of the Damon Runyon Cancer Research Foundation (DRG2221-15) and by an NIH Pathway to independence award (1K99GM128180). Sequencing was performed on an Illumina HiSeq 4000 purchased with funds from NIH (S10OD018220).
Footnotes
Declaration of Interests: The authors declare no competing interests.
Publisher's Disclaimer: This is a PDF file of an unedited manuscript that has been accepted for publication. As a service to our customers we are providing this early version of the manuscript. The manuscript will undergo copyediting, typesetting, and review of the resulting proof before it is published in its final form. Please note that during the production process errors may be discovered which could affect the content, and all legal disclaimers that apply to the journal pertain.
REFERENCES
- Alberti S, Gitler AD, and Lindquist S (2007). A suite of Gateway cloning vectors for high-throughput genetic analysis in Saccharomyces cerevisiae. Yeast (Chichester, England) 24, 913–919. [DOI] [PMC free article] [PubMed] [Google Scholar]
- Alberti S, Halfmann R, King O, Kapila A, and Lindquist S (2009). A systematic survey identifies prions and illuminates sequence features of prionogenic proteins. Cell 137, 146–158. [DOI] [PMC free article] [PubMed] [Google Scholar]
- Audergon PN, Catania S, Kagansky A, Tong P, Shukla M, Pidoux AL, and Allshire RC (2015). Epigenetics. Restricted epigenetic inheritance of H3K9 methylation. Science 348, 132–135. [DOI] [PMC free article] [PubMed] [Google Scholar]
- Bah A, Vernon RM, Siddiqui Z, Krzeminski M, Muhandiram R, Zhao C, Sonenberg N, Kay LE, and Forman-Kay JD (2015). Folding of an intrinsically disordered protein by phosphorylation as a regulatory switch. Nature 519, 106–109. [DOI] [PubMed] [Google Scholar]
- Bahler J, Wu JQ, Longtine MS, Shah NG, McKenzie A 3rd, Steever AB, Wach A, Philippsen P, and Pringle JR (1998). Heterologous modules for efficient and versatile PCR-based gene targeting in Schizosaccharomyces pombe. Yeast (Chichester, England) 14, 943–951. [DOI] [PubMed] [Google Scholar]
- Bray NL, Pimentel H, Melsted P, and Pachter L (2016). Near-optimal probabilistic RNA-seq quantification. Nat Biotechnol 34, 525. [DOI] [PubMed] [Google Scholar]
- Brindle PK, Holland JP, Willett CE, Innis MA, and Holland MJ (1990). Multiple factors bind the upstream activation sites of the yeast enolase genes ENO1 and ENO2: ABFI protein, like repressor activator protein RAP1, binds cis-acting sequences which modulate repression or activation of transcription. [DOI] [PMC free article] [PubMed] [Google Scholar]
- Brown CA, Murray AW, and Verstrepen KJ (2010). Rapid expansion and functional divergence of subtelomeric gene families in yeasts. Current biology : CB 20, 895–903. [DOI] [PMC free article] [PubMed] [Google Scholar]
- Buhler M, and Gasser SM (2009). Silent chromatin at the middle and ends: lessons from yeasts. EMBO J 28, 2149–2161. [DOI] [PMC free article] [PubMed] [Google Scholar]
- Calarco JP, Borges F, Donoghue MT, Van Ex F, Jullien PE, Lopes T, Gardner R, Berger F, Feijo JA, Becker JD, et al. (2012). Reprogramming of DNA methylation in pollen guides epigenetic inheritance via small RNA. Cell 151, 194–205. [DOI] [PMC free article] [PubMed] [Google Scholar]
- Candelli T, Challal D, Briand JB, Boulay J, Porrua O, Colin J, and Libri D (2018). High-resolution transcription maps reveal the widespread impact of roadblock termination in yeast. Embo j 37. [DOI] [PMC free article] [PubMed] [Google Scholar]
- Carone BR, Fauquier L, Habib N, Shea JM, Hart CE, Li R, Bock C, Li C, Gu H, Zamore PD, et al. (2010). Paternally induced transgenerational environmental reprogramming of metabolic gene expression in mammals. Cell 143, 1084–1096. [DOI] [PMC free article] [PubMed] [Google Scholar]
- Cavalli G, and Paro R (1998). The Drosophila Fab-7 chromosomal element conveys epigenetic inheritance during mitosis and meiosis. Cell 93, 505–518. [DOI] [PubMed] [Google Scholar]
- Cavalli G, and Paro R (1999). Epigenetic inheritance of active chromatin after removal of the main transactivator. Science 286, 955–958. [DOI] [PubMed] [Google Scholar]
- Chakrabortee S, Byers JS, Jones S, Garcia DM, Bhullar B, Chang A, She R, Lee L, Fremin B, Lindquist S, et al. (2016a). Intrinsically Disordered Proteins Drive Emergence and Inheritance of Biological Traits. Cell 167, 369–381 e312. [DOI] [PMC free article] [PubMed] [Google Scholar]
- Chakrabortee S, Kayatekin C, Newby GA, Mendillo ML, Lancaster A, and Lindquist S (2016b). Luminidependens (LD) is an Arabidopsis protein with prion behavior. Proc Natl Acad Sci U S A 113, 6065–6070. [DOI] [PMC free article] [PubMed] [Google Scholar]
- Chakravarty AK, Smejkal T, Itakura AK, Garcia DM, and Jarosz DF (2019). A Non-amyloid Prion Particle that Activates a Heritable Gene Expression Program. Molecular cell 0. [DOI] [PMC free article] [PubMed] [Google Scholar]
- Coleman RT, and Struhl G (2017). Causal role for inheritance of H3K27me3 in maintaining the OFF state of a Drosophila HOX gene. Science 356. [DOI] [PMC free article] [PubMed] [Google Scholar]
- Conde J, and Fink GR (1976). A mutant of Saccharomyces cerevisiae defective for nuclear fusion. Proc Natl Acad Sci U S A 73, 3651–3655. [DOI] [PMC free article] [PubMed] [Google Scholar]
- Cox BS (1965). Ψ, A cytoplasmic suppressor of super-suppressor in yeast. Heredity 20, 505–521. [Google Scholar]
- Dickies MM (1962). A new viable yellow mutation in the house mouse. The Journal of heredity 53, 84–86. [DOI] [PubMed] [Google Scholar]
- Dodson AE, and Rine J (2015). Heritable capture of heterochromatin dynamics in Saccharomyces cerevisiae. Elife 4, e05007. [DOI] [PMC free article] [PubMed] [Google Scholar]
- Du Z, Park KW, Yu H, Fan Q, and Li L (2008). Newly identified prion linked to the chromatin-remodeling factor Swi1 in Saccharomyces cerevisiae. Nat Genet 40, 460–465. [DOI] [PMC free article] [PubMed] [Google Scholar]
- Edmondson DG, Smith MM, and Roth SY (1996). Repression domain of the yeast global repressor Tup1 interacts directly with histones H3 and H4. Genes Dev 10, 1247–1259. [DOI] [PubMed] [Google Scholar]
- Edskes HK, Gray VT, and Wickner RB (1999). The [URE3] prion is an aggregated form of Ure2p that can be cured by overexpression of Ure2p fragments. Proc Natl Acad Sci U S A 96, 1498–1503. [DOI] [PMC free article] [PubMed] [Google Scholar]
- Ekwall K, Olsson T, Turner BM, Cranston G, and Allshire RC (1997). Transient inhibition of histone deacetylation alters the structural and functional imprint at fission yeast centromeres. Cell 91, 1021–1032. [DOI] [PubMed] [Google Scholar]
- Fioriti L, Myers C, Huang YY, Li X, Stephan JS, Trifilieff P, Colnaghi L, Kosmidis S, Drisaldi B, Pavlopoulos E, et al. (2015). The Persistence of Hippocampal-Based Memory Requires Protein Synthesis Mediated by the Prion-like Protein CPEB3. Neuron 86, 1433–1448. [DOI] [PubMed] [Google Scholar]
- Gibson DG, Young L, Chuang R-Y, Venter JC III, C.A.H., and Smith HO (2009). Enzymatic assembly of DNA molecules up to several hundred kilobases. Nat Methods 6, 343. [DOI] [PubMed] [Google Scholar]
- Glover JR, Kowal AS, Schirmer EC, Patino MM, Liu JJ, and Lindquist S (1997). Self-seeded fibers formed by Sup35, the protein determinant of [PSI+], a heritable prion-like factor of S. cerevisiae. Cell 89, 811–819. [DOI] [PubMed] [Google Scholar]
- Gottschling DE, Aparicio OM, Billington BL, and Zakian VA (1990). Position effect at S. cerevisiae telomeres: Reversible repression of Pol II transcription. Cell 63, 751–762. [DOI] [PubMed] [Google Scholar]
- Grewal SI, and Klar AJ (1996). Chromosomal inheritance of epigenetic states in fission yeast during mitosis and meiosis. Cell 86, 95–101. [DOI] [PubMed] [Google Scholar]
- Guarente L (2000). Sir2 links chromatin silencing, metabolism, and aging. Genes Dev 14, 1021–1026. [PubMed] [Google Scholar]
- Guthrie C, and Fink G (1991). Guide to Yeast Genetics. Methods Enzymol 194, 3–933. [PubMed] [Google Scholar]
- Halfmann R, Jarosz DF, Jones SK, Chang A, Lancaster AK, and Lindquist S (2012). Prions are a common mechanism for phenotypic inheritance in wild yeasts. Nature 482, 363–368. [DOI] [PMC free article] [PubMed] [Google Scholar]
- Harvey ZH, Chen Y, and Jarosz DF (2018). Protein-Based Inheritance: Epigenetics beyond the Chromosome. Molecular cell 69, 195–202. [DOI] [PMC free article] [PubMed] [Google Scholar]
- Hoepfner D, Helliwell SB, Sadlish H, Schuierer S, Filipuzzi I, Brachat S, Bhullar B, Plikat U, Abraham Y, Altorfer M, et al. (2014). High-resolution chemical dissection of a model eukaryote reveals targets, pathways and gene functions. Microbiological Research 169, 107–120. [DOI] [PubMed] [Google Scholar]
- Hoke SM, Guzzo J, Andrews B, and Brandl CJ (2008). Systematic genetic array analysis links the Saccharomyces cerevisiae SAGA/SLIK and NuA4 component Tra1 to multiple cellular processes. BMC Genet 9, 46. [DOI] [PMC free article] [PubMed] [Google Scholar]
- Holliday R, and Pugh JE (1975). DNA modification mechanisms and gene activity during development. Science 187, 226–232. [PubMed] [Google Scholar]
- Holmes DL, Lancaster AK, Lindquist S, and Halfmann R (2013). Heritable remodeling of yeast multicellularity by an environmentally responsive prion. Cell 153, 153–165. [DOI] [PMC free article] [PubMed] [Google Scholar]
- Holt LJ, Tuch BB, Villen J, Johnson AD, Gygi SP, and Morgan DO (2009). Global analysis of Cdk1 substrate phosphorylation sites provides insights into evolution. Science 325, 1682–1686. [DOI] [PMC free article] [PubMed] [Google Scholar]
- Huang J, Brito IL, Villen J, Gygi SP, Amon A, and Moazed D (2006). Inhibition of homologous recombination by a cohesin-associated clamp complex recruited to the rDNA recombination enhancer. Genes Dev 20, 2887–2901. [DOI] [PMC free article] [PubMed] [Google Scholar]
- Jarosz DF, Brown JCS, Walker GA, Datta MS, Ung WL, Lancaster AK, Rotem A, Chang A, Newby GA, Weitz DA, et al. (2014a). Cross-kingdom chemical communication drives a heritable, mutually beneficial prion-based transformation of metabolism. Cell 158, 1083–1093. [DOI] [PMC free article] [PubMed] [Google Scholar]
- Jarosz DF, and Khurana V (2017). Specification of Physiologic and Disease States by Distinct Proteins and Protein Conformations. Cell 171, 1001–1014. [DOI] [PubMed] [Google Scholar]
- Jarosz DF, Lancaster AK, Brown JCS, and Lindquist S (2014b). An evolutionarily conserved prion-like element converts wild fungi from metabolic specialists to generalists. Cell 158, 1072–1082. [DOI] [PMC free article] [PubMed] [Google Scholar]
- Jarosz DF, and Lindquist S (2010). Hsp90 and environmental stress transform the adaptive value of natural genetic variation. Science 330, 1820–1824. [DOI] [PMC free article] [PubMed] [Google Scholar]
- Jiang D, and Berger F (2017). DNA replication-coupled histone modification maintains Polycomb gene silencing in plants. Science 357, 1146–1149. [DOI] [PubMed] [Google Scholar]
- Kazachenka A, Bertozzi TM, Sjoberg-Herrera MK, Walker N, Gardner J, Gunning R, Pahita E, Adams S, Adams D, and Ferguson-Smith AC (2018). Identification, Characterization, and Heritability of Murine Metastable Epialleles: Implications for Non-genetic Inheritance. Cell 175, 1717. [DOI] [PMC free article] [PubMed] [Google Scholar]
- Kennedy BK, Austriaco NR Jr., and Guarente L (1994). Daughter cells of Saccharomyces cerevisiae from old mothers display a reduced life span. J Cell Biol 127, 1985–1993. [DOI] [PMC free article] [PubMed] [Google Scholar]
- Kim T, and Buratowski S (2009). Dimethylation of H3K4 by Set1 recruits the Set3 histone deacetylase complex to 5’ transcribed regions. Cell 137, 259–272. [DOI] [PMC free article] [PubMed] [Google Scholar]
- Kim T, Xu Z, Clauder-Munster S, Steinmetz LM, and Buratowski S (2012). Set3 HDAC mediates effects of overlapping noncoding transcription on gene induction kinetics. Cell 150, 1158–1169. [DOI] [PMC free article] [PubMed] [Google Scholar]
- Kruttner S, Stepien B, Noordermeer JN, Mommaas MA, Mechtler K, Dickson BJ, and Keleman K (2012). Drosophila CPEB Orb2A mediates memory independent of Its RNA-binding domain. Neuron 76, 383–395. [DOI] [PMC free article] [PubMed] [Google Scholar]
- Kubik S, Bruzzone MJ, Jacquet P, Falcone JL, Rougemont J, and Shore D (2015). Nucleosome Stability Distinguishes Two Different Promoter Types at All Protein-Coding Genes in Yeast. Molecular cell 60, 422–434. [DOI] [PubMed] [Google Scholar]
- Kuras L, and Struhl K (1999). Binding of TBP to promoters. Nature 399, 609. [DOI] [PubMed] [Google Scholar]
- Lachner M, O’Carroll D, Rea S, Mechtler K, and Jenuwein T (2001). Methylation of histone H3 lysine 9 creates a binding site for HP1 proteins. Nature 410, 116–120. [DOI] [PubMed] [Google Scholar]
- Lancaster AK, and Masel J (2009). The evolution of reversible switches in the presence of irreversible mimics. Evolution 63, 2350–2362. [DOI] [PMC free article] [PubMed] [Google Scholar]
- Langmead B, and Salzberg SL (2012). Fast gapped-read alignment with Bowtie 2. Nat Methods 9, 357. [DOI] [PMC free article] [PubMed] [Google Scholar]
- Laprell F, Finkl K, and Muller J (2017). Propagation of Polycomb-repressed chromatin requires sequence-specific recruitment to DNA. Science 356, 85–88. [DOI] [PubMed] [Google Scholar]
- Logie C, and Peterson CL (1999). Purification and biochemical properties of yeast SWI/SNF complex. Methods Enzymol 304, 726–741. [DOI] [PubMed] [Google Scholar]
- Loo S, and Rine J (1994). Silencers and domains of generalized repression. Science 264, 1768–1771. [DOI] [PubMed] [Google Scholar]
- Love MI, Huber W, and Anders S (2014). Moderated estimation of fold change and dispersion for RNA-seq data with DESeq2. Genome biology 15, 550. [DOI] [PMC free article] [PubMed] [Google Scholar]
- Majumdar A, Cesario WC, White-Grindley E, Jiang H, Ren F, Khan MR, Li L, Choi EM, Kannan K, Guo F, et al. (2012). Critical role of amyloid-like oligomers of Drosophila Orb2 in the persistence of memory. Cell 148, 515–529. [DOI] [PubMed] [Google Scholar]
- Malovichko YV, Antonets KS, Maslova AR, Andreeva EA, Inge-Vechtomov SG, and Nizhnikov AA (2019). RNA Sequencing Reveals Specific TranscriptomicSignatures Distinguishing Effects of the [SWI(+)] Prion and SWI1 Deletion in Yeast Saccharomyces cerevisiae. Genes (Basel) 10, 212. [DOI] [PMC free article] [PubMed] [Google Scholar]
- Margueron R, Justin N, Ohno K, Sharpe ML, Son J, Drury WJ 3rd, Voigt P, Martin SR, Taylor WR, De Marco V, et al. (2009). Role of the polycomb protein EED in the propagation of repressive histone marks. Nature 461, 762–767. [DOI] [PMC free article] [PubMed] [Google Scholar]
- Moazed D (2011). Mechanisms for the inheritance of chromatin states. Cell 146, 510–518. [DOI] [PMC free article] [PubMed] [Google Scholar]
- Nanney DL (1958). Epigenetic control systems. Proc Natl Acad Sci U S A 44, 712–717. [DOI] [PMC free article] [PubMed] [Google Scholar]
- Nusinzon I, and Horvath CM (2005). Histone deacetylases as transcriptional activators? Role reversal in inducible gene regulation. Sci STKE 2005, re11. [DOI] [PubMed] [Google Scholar]
- Padmanabhan N, Jia D, Geary-Joo C, Wu X, Ferguson-Smith AC, Fung E, Bieda MC, Snyder FF, Gravel RA, Cross JC, et al. (2013). Mutation in folate metabolism causes epigenetic instability and transgenerational effects on development. Cell 155, 81–93. [DOI] [PMC free article] [PubMed] [Google Scholar]
- Palladino F, Laroche T, Gilson E, Axelrod A, Pillus L, and Gasser SM (1993). SIR3 and SIR4 proteins are required for the positioning and integrity of yeast telomeres. Cell 75, 543–555. [DOI] [PubMed] [Google Scholar]
- Parsons AB, Brost RL, Ding H, Li Z, Zhang C, Sheikh B, Brown GW, Kane PM, Hughes TR, and Boone C (2004). Integration of chemical-genetic and genetic interaction data links bioactive compounds to cellular target pathways. Nat Biotechnol 22, 62–69. [DOI] [PubMed] [Google Scholar]
- Patino MM, Liu JJ, Glover JR, and Lindquist S (1996). Support for the prion hypothesis for inheritance of a phenotypic trait in yeast. Science 273, 622–626. [DOI] [PubMed] [Google Scholar]
- Peter J, De Chiara M, Friedrich A, Yue JX, Pflieger D, Bergstrom A, Sigwalt A, Barre B, Freel K, Llored A, et al. (2018). Genome evolution across 1,011 Saccharomyces cerevisiae isolates. Nature 556, 339–344. [DOI] [PMC free article] [PubMed] [Google Scholar]
- Petryk N, Dalby M, Wenger A, Stromme CB, Strandsby A, Andersson R, and Groth A (2018). MCM2 promotes symmetric inheritance of modified histones during DNA replication. Science 361, 1389–1392. [DOI] [PubMed] [Google Scholar]
- Pijnappel WW, Schaft D, Roguev A, Shevchenko A, Tekotte H, Wilm M, Rigaut G, Seraphin B, Aasland R, and Stewart AF (2001). The S. cerevisiae SET3 complex includes two histone deacetylases, Hos2 and Hst1, and is a meiotic-specific repressor of the sporulation gene program. Genes Dev 15, 2991–3004. [DOI] [PMC free article] [PubMed] [Google Scholar]
- Pillus L, and Rine J (1989). Epigenetic inheritance of transcriptional states in S. cerevisiae. Cell 59, 637–647. [DOI] [PubMed] [Google Scholar]
- Prusiner SB (1982). Novel proteinaceous infectious particles cause scrapie. Science 216, 136–144. [DOI] [PubMed] [Google Scholar]
- Quinlan AR, and Hall IM (2010). BEDTools: a flexible suite of utilities for comparing genomic features. Bioinformatics 26, 841–842. [DOI] [PMC free article] [PubMed] [Google Scholar]
- Radford EJ, Isganaitis E, Jimenez-Chillaron J, Schroeder J, Molla M, Andrews S, Didier N, Charalambous M, McEwen K, Marazzi G, et al. (2012). An unbiased assessment of the role of imprinted genes in an intergenerational model of developmental programming. PLoS Genet 8, e1002605. [DOI] [PMC free article] [PubMed] [Google Scholar]
- Ragunathan K, Jih G, and Moazed D (2015). Epigenetics. Epigenetic inheritance uncoupled from sequence-specific recruitment. Science 348, 1258699. [DOI] [PMC free article] [PubMed] [Google Scholar]
- Rechavi O, Houri-Ze’evi L, Anava S, Goh WSS, Kerk SY, Hannon GJ, and Hobert O (2014). Starvation-induced transgenerational inheritance of small RNAs in C. elegans. Cell 158, 277–287. [DOI] [PMC free article] [PubMed] [Google Scholar]
- Rechavi O, Minevich G, and Hobert O (2011). Transgenerational inheritance of an acquired small RNA-based antiviral response in C. elegans. Cell 147, 1248–1256. [DOI] [PMC free article] [PubMed] [Google Scholar]
- Reinberg D, and Vales LD (2018). Chromatin domains rich in inheritance. Science 361, 33–34. [DOI] [PubMed] [Google Scholar]
- Riggs AD (1975). X inactivation, differentiation, and DNA methylation. Cell Genet 14, 9–25. [DOI] [PubMed] [Google Scholar]
- Riggs AD (1996). Epigenetic Mechanisms of Gene Regulation (Cold Spring Harbor Laboratory Press; ). [Google Scholar]
- Robyr D, Suka Y, Xenarios I, Kurdistani SK, Wang A, Suka N, and Grunstein M (2002). Microarray deacetylation maps determine genome-wide functions for yeast histone deacetylases. Cell 109, 437–446. [DOI] [PubMed] [Google Scholar]
- Sharma U, Conine CC, Shea JM, Boskovic A, Derr AG, Bing XY, Belleannee C, Kucukural A, Serra RW, Sun F, et al. (2016). Biogenesis and function of tRNA fragments during sperm maturation and fertilization in mammals. Science 351, 391–396. [DOI] [PMC free article] [PubMed] [Google Scholar]
- Shore D (1994). RAP1: a protean regulator in yeast. Trends Genet 10, 408–412. [DOI] [PubMed] [Google Scholar]
- Shore D, and Nasmyth K (1987). Purification and Cloning of a DNA-Binding Protein from Yeast That Binds to Both Silencer and Activator Elements. Cell 51, 721–732. [DOI] [PubMed] [Google Scholar]
- Smith JD, Suresh S, Schlecht U, Wu M, Wagih O, Peltz G, Davis RW, Steinmetz LM, Parts L, and St Onge RP (2016). Quantitative CRISPR interference screens in yeast identify chemical-genetic interactions and new rules for guide RNA design. Genome biology 17, 45. [DOI] [PMC free article] [PubMed] [Google Scholar]
- Stephan JS, Fioriti L, Lamba N, Colnaghi L, Karl K, Derkatch IL, and Kandel ER (2015). The CPEB3 Protein Is a Functional Prion that Interacts with the Actin Cytoskeleton. Cell Rep 11, 1772–1785. [DOI] [PubMed] [Google Scholar]
- Strahl-Bolsinger S, Hecht A, Luo K, and Grunstein M (1997). SIR2 and SIR4 interactions differ in core and extended telomeric heterochromatin in yeast. Genes Dev 11, 83–93. [DOI] [PubMed] [Google Scholar]
- Tanaka M, Chien P, Naber N, and Weissman JS (2004). Conformational variations in an infectious protein determine prion strain differences. Nature 428, 323–328. [DOI] [PubMed] [Google Scholar]
- Tanaka M, and Weissman JS (2006). An efficient protein transformation protocol for introducing prions into yeast. Methods Enzymol 412, 185–200. [DOI] [PubMed] [Google Scholar]
- Tapia H, and Koshland DE (2014). Trehalose is a versatile and long-lived chaperone for desiccation tolerance. Current biology : CB 24, 2758–2766. [DOI] [PubMed] [Google Scholar]
- Thurtle DM, and Rine J (2014). The molecular topography of silenced chromatin in Saccharomyces cerevisiae. Genes Dev 28, 245–258. [DOI] [PMC free article] [PubMed] [Google Scholar]
- True HL, Berlin I, and Lindquist SL (2004). Epigenetic regulation of translation reveals hidden genetic variation to produce complex traits. Nature 431, 184–187. [DOI] [PubMed] [Google Scholar]
- True HL, and Lindquist SL (2000). A yeast prion provides a mechanism for genetic variation and phenotypic diversity. Nature 407, 477–483. [DOI] [PubMed] [Google Scholar]
- Tyedmers J, Madariaga ML, and Lindquist S (2008). Prion switching in response to environmental stress. PLoS Biol 6, e294. [DOI] [PMC free article] [PubMed] [Google Scholar]
- Usaj M, Tan Y, Wang W, VanderSluis B, Zou A, Myers CL, Costanzo M, Andrews B, and Boone C (2017). TheCellMap.org: A Web-Accessible Database for Visualizing and Mining the Global Yeast Genetic Interaction Network. G3 (Bethesda) 7, 1539–1549. [DOI] [PMC free article] [PubMed] [Google Scholar]
- Vandenbosch D, De Canck E, Dhondt I, Rigole P, Nelis HJ, and Coenye T (2013). Genomewide screening for genes involved in biofilm formation and miconazole susceptibility in Saccharomyces cerevisiae. FEMS Yeast Res 13, 720–730. [DOI] [PubMed] [Google Scholar]
- Verdel A, Jia S, Gerber S, Sugiyama T, Gygi S, Grewal SI, and Moazed D (2004). RNAi-mediated targeting of heterochromatin by the RITS complex. Science 303, 672–676. [DOI] [PMC free article] [PubMed] [Google Scholar]
- Waddington CH (1942). The Epigenotype. Endeavour, 18–20. [Google Scholar]
- Wang A, Kurdistani SK, and Grunstein M (2002). Requirement of Hos2 histone deacetylase for gene activity in yeast. Science 298, 1412–1414. [DOI] [PubMed] [Google Scholar]
- Wang X, and Moazed D (2017). DNA sequence-dependent epigenetic inheritance of gene silencing and histone H3K9 methylation. Science 356, 88–91. [DOI] [PMC free article] [PubMed] [Google Scholar]
- Ward JJ, Sodhi JS, McGuffin LJ, Buxton BF, and Jones DT (2004). Prediction and functional analysis of native disorder in proteins from the three kingdoms of life. J Mol Biol 337, 635–645. [DOI] [PubMed] [Google Scholar]
- Wickner RB (1994). [URE3] as an altered URE2 protein: evidence for a prion analog in Saccharomyces cerevisiae. Science 264, 566–569. [DOI] [PubMed] [Google Scholar]
- Wickner RB, Edskes HK, and Shewmaker F (2006). How to find a prion: [URE3], [PSI+] and [beta]. Methods 39, 3–8. [DOI] [PubMed] [Google Scholar]
- Xie MW, Jin F, Hwang H, Hwang S, Anand V, Duncan MC, and Huang J (2005). Insights into TOR function and rapamycin response: chemical genomic profiling by using a high-density cell array method. Proc Natl Acad Sci U S A 102, 7215–7220. [DOI] [PMC free article] [PubMed] [Google Scholar]
- Xiong W, and Ferrell JE Jr. (2003). A positive-feedback-based bistable ‘memory module’ that governs a cell fate decision. Nature 426, 460–465. [DOI] [PubMed] [Google Scholar]
- Yang XJ, and Seto E (2008). The Rpd3/Hda1 family of lysine deacetylases: from bacteria and yeast to mice and men. Nat Rev Mol Cell Biol 9, 206–218. [DOI] [PMC free article] [PubMed] [Google Scholar]
- Young CSH, and Cox BS (1971). Extrachromosomal elements in a super-suppression system of yeast I. A nuclear gene controlling the inheritance of the extrachromosomal elements. Heredity 26, 413–422. [Google Scholar]
- Yu C, Gan H, Serra-Cardona A, Zhang L, Gan S, Sharma S, Johansson E, Chabes A, Xu RM, and Zhang Z (2018a). A mechanism for preventing asymmetric histone segregation onto replicating DNA strands. Science 361, 1386–1389. [DOI] [PMC free article] [PubMed] [Google Scholar]
- Yu R, Wang X, and Moazed D (2018b). Epigenetic inheritance mediated by coupling of RNAi and histone H3K9 methylation. Nature, 615–619. [DOI] [PMC free article] [PubMed] [Google Scholar]
- Yuan AH, and Hochschild A (2017). A bacterial global regulator forms a prion. Science 355, 198–201. [DOI] [PMC free article] [PubMed] [Google Scholar]
Associated Data
This section collects any data citations, data availability statements, or supplementary materials included in this article.
Supplementary Materials
Figure S4
Related to Figure 5
A, Example ChIP-seq tracks for Snt1, Hos2, Rap1, and RNAPII in naïve and [ESI+] cells for the HML locus. ALPHA1 and ALPHA2 are greyed due to redundancy with the MAT locus that prevents accurate mapping. Salmon bars highlight the HML-E and HML-I silencer elements. Data are representative of 2–3 biological replicates. B, Phenotypic assay for rDNA expression for two different reporters from Huang, et al. 2006. Spotting performed with 5-fold dilutions from left to right and are representative of four biological replicates.
Figure S5
Related to Figure 6
A and C, Representative ChIP tracks for Snt1 (A) and Hos2 (C) in naïve and [ESI+] cells for chrIV:600,000..625,000. ORFs are cartooned below with Watson (W) and Crick (C) strands designated. B and D, Average ChIP-seq coverage normalized to input for non-sub-telomeric (distances greater than 25 kb from chromosome ends) regions in naïve and [ESI+] cells. Standard error bars are from 2–3 biological replicates, and all chromosomes are represented individually. E, Differential transcriptional density (ratio of up-regulation to down-regulation) of transcription in Rap1-AA cells upon addition of Rapamycin in ~1 kb bins as a function of distance from telomeres. Data are from Candelli, et al. 2018. F–H, Example ChIP tracks for Rap1 in naïve and [ESI+] cells at telomeric T(G)1–3 repeats, which are specifically indicated with arrows. Colored bars below highlight X and Y’ elements. Data are representative of two biological replicates. I, ChIP density plot quantifying the maintenance of telomeric Rap1 binding in [ESI+] cells. A value of 1 (indicated by dashed line) indicates no difference in the degree of binding in a particular bin between naïve and [ESI+] cells. Arrow and red shading are added to emphasize the telomeric binding of Rap1. Data are the average of all telomeres and biological replicates. J–L, (Left), Rap1 ChIP-seq tracks in naïve and [ESI+] cells for the TEF2, ENO1, and ENO2 loci, which have defined Rap1-dependent UAS binding, and ensuing transcription activation. Data are representative of 2 biological replicates. (Right), Mean reads per million (RPM) from mRNA-seq from 2 biological replicates for TEF2, ENO1, and ENO2 in naïve and [ESI+] cells. padj for differential expression is a Benjamini-Hochberg corrected value from a binomial test generated with the default setting of DESeq2. M, CRISPRi reduces Rap1 protein levels. Cells were grown in complete synthetic media with 2% dextrose and lacking uracil and with ATC. Micrographs are representative of three biological replicates, and are quantified in a histogram below. Scale bar is 5 μm. N, Normalized area under the curve (AUC) in 10 mM ZnSO4 in complete synthetic media lacking uracil for naïve and [ESI+] strains in which Rap1 was knocked down (KD) via CRISPRi in the presence of anhydrotetracycline (ATC, indicated by ‘+ Rap1 KD’). At least three biological replicates are presented for each.
Figure S2
Related to Figure 2
A, Histogram of normalized area under the curve (AUC) in 7.5 mM ZnSO4 of haploid single-cell isolates (33) from passaged nocodazole inductions. Mean growth of type strains for naïve and [ESI+] (both three biological replicates) are indicated by dashed lines. Shaded area represents isolates exhibiting elevated zinc resistance, defined as growth rates falling more than 3 standard deviations greater than the naïve mean. All growth rates are normalized to naïve type strains. B, anti-c-Myc immunoblot of naïve and [ESI+] type strains separated on either a phosphoprotein-impeding gel (top, ‘phostag’) or standard SDS-PAGE. Three biological replicates were performed with similar results. C, Immunoblot of naïve diploid cells episomally expressing the indicated Snt1 variant under the control of a galactose-inducible promoter in media containing 2% raffinose. PGK1 was used as a loading control.
Figure S1
Related to Figure 1
A, Predicted prion-like score for Snt1 by PLAAC (Alberti et al. 2009), with a score of 1 corresponding to high prion-like (PrD) character, and 0 low prion-like character. B, Fluorescence microscopy of mid-logarithmically growing naïve and [ESI+] cells harboring an endogenous Snt1-GFP fusion. Representative of more than three biological replicates. Scale bar, 5 μm. C, Growth of naïve (n = 4), [ESI+] (n = 4), and [ESI+] meiotic progeny (n = 14) at a high concentration (10 mM) ZnSO4. D, Schematic describing the crossing strategy for cytoduction experiments presented in (E). E, growth in 5 mM Zn for zinc-sensitive SK1 background yeast cytoduced with either naïve or [ESI+] cytoplasm (n = 3). F, Quantification of limited proteolysis kinetics to accompany Fig. 1G. Trajectories are the ratio of full-length Snt1 in naïve cells to that in [ESI+] cells at that timepoint. Each replicate’s points are connected with lines, and the data are fit with a linear function. The statistical significance is assessed by an F-test. G, Normalized AUC in 10 mM ZnSO4 for control protein transformations of Snt1 aggregates (n = 24; Fig. 1H) into snt1Δ cells compared to the parent strain (n = 4).
Figure S3
A, Immunoblot of acid extracted histones from isogenic haploid naïve and [ESI+] cells. Blots are representative of three biological replicates, which are quantified by densitometry alongside. B, Representative standard curves for spike in controls used in mRNA-seq. C, Pairwise transcriptional overlaps between [ESI+] and Set3C deletions, with overlapping genes in grey. Transcripts are defined as being differentially regulated by a Benjamini-Hotchberg adjusted p value less than 0.1. The significant of the overlap for [ESI+] is, by hypergeometric test: for up-regulated transcripts, [ESI+] vs. snt1Δ, p < 1.66 × 10⁻⁵, [ESI+] vs. hos2Δ, p < 3.05 × 10−129; [ESI+] vs. set3Δ, p < 6.84 × 10−48; and for down-regulation are as follows: [ESI+] vs. snt1Δ, p < 1.25 × 10⁻⁵, [ESI+] vs. hos2Δ, p < 7.36 × 10−258, [ESI+] vs. set3Δ, p < 1.98 × 10−110. D, Heatmap of the 3’ transcription end sites (TES) for the top 500 [ESI+] up-regulated genes for H4ac, RNAPII, and Snt1 ChIP-seq. Data are representative of at least two biological replicates. E and F, Example ChIP tracks for Snt1 and RNAPII at (E) the SSP2 locus and (F) the SPO14 locus in naïve and [ESI+] cells. Arrows indicate RNAPII accumulation at the 3’ of SSP2 and an alternative transcription start site (TSS) of SPO14. G, Quantification of sporulation at 5 days by morphological analysis. Three biological replicates were included in the analysis, and at least 300 cells were counted for each replicate, and the experiment was performed three times with similar results. All error bars are the standard error measurement.
Data Availability Statement
All mRNA-seq data are deposited under accession numbers GSE117624 and GSE128672 in the Gene Expression Omnibus (GEO). ChIP-seq data are deposited in the Sequence Read Archive (SRA) under accession number PRJNA528459. All other source data are available upon request to the Lead Contact.