

SUMMARY
The function of the CCCTC-binding factor (CTCF) in the organization of the genome has become an important area of investigation, but the mechanisms by which CTCF dynamically contributes to genome organization are not clear. We previously discovered that CTCF binds to large numbers of endogenous RNAs, promoting its self-association. In this regard, we now report two independent features that disrupt CTCF association with chromatin: inhibition of transcription and disruption of CTCF-RNA interactions through mutations of 2 of its 11 zinc fingers that are not required for CTCF binding to its cognate DNA site: zinc finger 1 (ZF1) or zinc finger 10 (ZF10). These mutations alter gene expression profiles as CTCF mutants lose their ability to form chromatin loops and thus the ability to insulate chromatin domains and to mediate CTCF long-range genomic interactions. Our results point to the importance of CTCF-mediated RNA interactions as a structural component of genome organization.
Graphical Abstract
In Brief
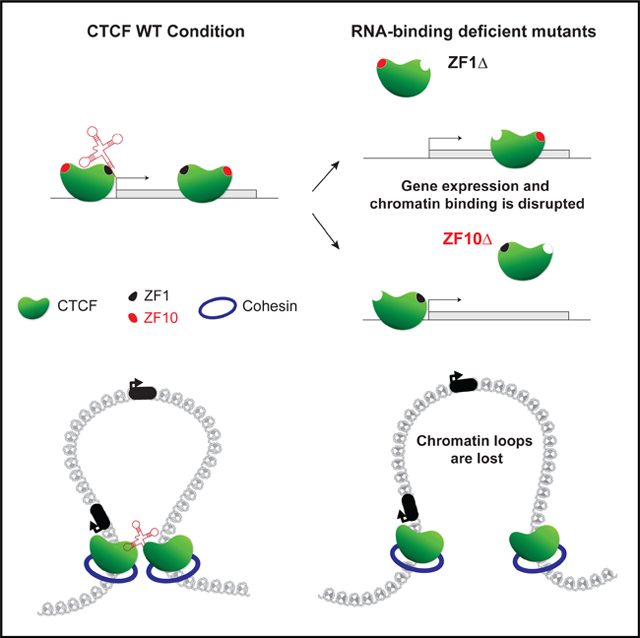
RNA binding promotes CTCF-dependent chromatin loops. Saldaña-Meyer et al. show that mutation of the RNA-binding regions in CTCF (ZF1 and ZF10) disrupts gene expression, chromatin binding, and the formation of chromatin loops.
INTRODUCTION
Spatial and temporal control of gene expression is crucial for the development of multicellular organisms. Improper gene expression leads to developmental abnormalities and diseases such as cancer. In addition to the “linear” genetic information, the three-dimensional (3D) spatial organization of the eukaryotic genome within the nucleus contributes to genome function (Bonev and Cavalli, 2016; Merkenschlager and Nora, 2016).
The 3D genome is hierarchically organized: from nuclear compartments, to large insulated chromatin domains, to short-range cis-interactions. These chromatin domains are designated throughout the literature as topological associated domains (TADs), topologically constrained domains, physical domains, insulated neighborhoods, contact domains, or loop domains depending on their characteristics, size, and the algorithms used to identify them (Lieberman-Aiden et al., 2009; Dixon et al., 2012; Dowen et al., 2014; Nora et al., 2017; Rao et al., 2017). To avoid confusion, we simply call them chromatin-interacting domains. These domains are formed and delimited primarily by the interaction of CTCF with the cohesin complex, and proteins such as YY1, the Mediator complex, and others yet to be discovered. CTCF and the cohesin complex are pivotal to 3D structure formation (Rowley and Corces, 2018). The depletion of either factor has drastic effects on chromatin structure, with chromatin-interacting domains essentially disappearing (Nora et al., 2017; Rao et al., 2017). The most widely accepted explanation of how chromatin organizes 3D structure is through the loop extrusion model (Fudenberg et al., 2017). This model proposes that cohesin rings create loops by actively extruding DNA until the cohesin complex contacts two CTCF-binding sites in convergent orientation to serve as anchors. This simplifies the underlying mechanism of chromatin organization, but many questions remain unanswered as to how these domains are regulated temporally and in a cell type-specific manner and the repertoire of factors that participate in this process.
Although most chromatin domain boundaries are enriched by CTCF and cohesin, the majority of CTCF-bound sites are found elsewhere in the genome (Merkenschlager and Nora, 2016). Furthermore, CTCF and cohesin binding sites are significantly conserved among cell types, yet many of them, as well as many chromatin-interacting domains, display cell type-specific patterns and changes during differentiation as a result of stage-specific transcription factors (Narendra et al., 2016; Pękowska et al., 2018; Stadhouders et al., 2018).
Together with CTCF, YY1, cohesin, and Mediator complexes are also implicated in defining chromatin architecture at different topological ranges and all of these proteins bind RNA (Lai et al., 2013; Li et al., 2013; Phillips-Cremins et al., 2013; Saldaña-Meyer et al., 2014; Sigova et al., 2015). A growing number of examples demonstrate that RNA can recruit and either stabilize or destabilize protein binding to chromatin, as in the case of the PRC2 complex or YY1, respectively (Beltran et al., 2016; Kaneko et al., 2014a, 2014b; Sigova et al., 2015; Xiao et al., 2019). Furthermore, both CTCF and YY1 can form dimers and oligo-mers in an RNA-dependent manner, which may account for the regulation of far cis-interactions on chromatin (Saldaña-Meyer et al., 2014; Weintraub et al., 2017).
Here, we sought to identify the functional relevance of CTCF-RNA interactions using two strategies: (1) inhibiting transcription and (2) rescuing the loss of wild-type endogenous CTCF through the expression of RNA binding-deficient mutants. We concentrated on three distinct levels of regulation: (1) gene expression using single-cell RNA sequencing (RNA-seq) and bulk RNA-seq; (2) chromatin binding via ChIP-seq; and (3) chromatin structure via 5C and Hi-C. We demonstrate that decreased RNA binding to CTCF disturbs its stability on chromatin with direct and likely indirect effects on gene expression and 3D chromatin organization.
RESULTS
Transcriptional Inhibition Disrupts CTCF Binding to Chromatin
To unbiasedly test if RNA binding is integral to CTCF activity genome-wide, we first performed chromatin immunoprecipitation followed by deep sequencing (ChIP-seq) after transcriptional inhibition (TI) by treating mouse embryonic stem cells (mESCs) with both DRB and triptolide. This treatment, which in-hibits initiation and elongation of transcription and promotes degradation of RNAP II (Bensaude, 2011), had no impact on CTCF protein levels (Figure S1A). Nonetheless, we detected an overall modest decrease in CTCF association with chromatin genome-wide (Figure 1A). Similar results were observed after depleting RNA by incubation with RNase A (Figure S1B). Because CTCF is widely present throughout the genome within both intragenic and intergenic regions (Bonev and Cavalli, 2016), we next focused on the specific genomic distribution between individual CTCF-binding sites in the control versus those sites whose binding was significantly decreased after TI and RNase A treatment (Table S1). We found that CTCF-binding sites within transcription start sites (TSSs) and promoters were the most significantly affected (Figures 1B, 1C, S1B, and S1C). To quantify the affinity of those affected sites, we used DeepBind, a deep-learning algorithm that has been trained on numerous ChIP-seq datasets and can be used to score the affinity of any given sequence for the CTCF motif. Remarkably, sites perturbed by TI were those with motifs with significantly lower affinity compared with a random sample of stable CTCF-bound regions (p < 0.0001, Mann-Whitney test; Figure 1D).
Figure 1. Transcriptional Inhibition Disrupts CTCF Binding Predominantly in TSS.

Transcription was inhibited in mESCs for 4 h with co-incubation of DRB and triptolide. Cells incubated with DMSO served as control.
(A) Shows CTCF ChIP-seq heatmaps centered and rank-ordered on CTCF-binding sites. Corresponding average density profiles are plotted at the top of the heatmaps to illustrate differences between DMSO and 4 h of TI.
B) A subset of peaks exhibit dramatically reduced CTCF enrichment after 4 h of TI. Overlapping peaks for TSS are highlighted in blue.
(C) Average density profiles for the same ChIP-seq as (A) but centered on TSS.
(D) Boxplot showing the motif affinity scores for CTCF-binding sites lost after transcriptional inhibition versus a random set of CTCF-binding sites in the control (Mann-Whitney test, p < 0.0001).
(E) Representative example of a CTCF peak with decreased binding to the TSS of the Slain2 gene. ChIP-seq tracks for DMSO (gray) and 4 h of TI (red) are overlapped for comparison.
(F) 5C heatmap depicting the interaction frequency between restriction fragments across a 4 Mb region surrounding the HoxA cluster (data were binned in 15 kb windows; step size 5 kb; the median is shown). Comparative 5C heatmap shows increased (red) and decreased (blue) interactions after TI. Overlapped ChIP-seq tracks above illustrate decreased binding of CTCF. Darker colors represent increasing interaction frequency.
(G) Zoom into a chromatin domain delimited by CTCF sites (top). Overlapped ChIP-seq tracks for DMSO (gray) and 4 h of TI (red) illustrate no change in CTCF binding for the loop enclosed in a rectangle (bottom).
Regarding chromatin structure, 5C experiments targeting a 4 Mb region showed that throughout this region (chr6: 49,943592–54,370,091), CTCF binding was decreased together with a general increase in chromatin interactions (Figures 1F and S1D). Remarkably, the chromatin loop whose right anchor re-sides at the HoxA cluster boundary was disrupted (Figures 1G and S1E), without the loss of CTCF binding in the boundary, as illustrated by the overlapping ChIP-seq tracks (Figure 1G, bottom). These results favor the hypothesis that the role of CTCF in 3D chromatin structure is subject to at least two levels of regulation: (1) direct binding to chromatin and (2) regulation of CTCF-CTCF interactions in complex with RNA molecules to form chromatin loops at sites surrounding the HoxA cluster and probably others throughout the genome.
High-Resolution Mapping of RNA-Binding Regions (RBRs) in CTCF
The observations above are suggestive but cannot distinguish between a direct disruption of CTCF-RNA interactions or the various possible indirect effects of inhibiting transcription. To directly test the former case, we first defined putative RNA bind-ing-deficient mutants. We focused on two regions detected by RBR-ID (He et al., 2016): one overlapping part of zinc finger 1 (ZF1) (aa 264–275; KTFQCELCSYTCPR) and another within ZF10 (aa 536–544; QLLDMHFKR), the latter having been identified previously through biochemical mapping of CTCF (Saldaña-Meyer et al., 2014) (Figure 2A; Table S2). Henceforward, the deletion of these 14 and 9 amino acids from ZF1 and ZF10, respectively, will be denoted as ZF1Δ and ZF10Δ.
Figure 2. Deletions in ZF1 and ZF10 Independently Abolish CTCF Binding to RNA.

(A) Schematic representation of known domains of WT CTCF with its 11 zinc fingers being numbered (top); smoothed residue-level RBR-ID score (He et al., 2016), plotted along the primary sequence (bottom).
(B) FACS analysis highlighting percentage of GFP+ or mCherry+ CTCF-AID-GFP mESCs with or without rescue of CTCF: WT, ZF1Δ, or ZF10Δ.
(C) Immunoprecipitation of all rescue cell lines indicated and immunoblots for CTCF and Rad21.
(D) Representative image of GFP-CTCF incubated with each rescue, immunoprecipitated with a GFP antibody and blotted against CTCF (left); bar graph quantification of each rescue protein relative to the GFP-CTCF (n = 5) (right).
(E) PAR-CLIP of stably expressed WT and mutant CTCF in mESCs. Autoradiography for 32P-labeled RNA (top) and control western blot (middle and bottom).
(F) Schematic representation of ZF1 and ZF10 of CTCF; mutations found in breast and endometrial cancer that alter zinc binding are shown in black; mutations that do not alter zinc binding are in blue, and RBR-ID deletions are in brackets.
Given that homozygous deletion of CTCF is embryonically lethal (Kemp et al., 2014; Moore et al., 2012), we induced the rapid degradation of endogenously tagged CTCF-GFP using the auxin-inducible degron (AID) system as previously described (Nora et al., 2017) and rescued the cells with either wild-type (WT) or RNA binding-deficient CTCF mutants; degradation of CTCF without rescue was lethal after 2–4 days (Nora et al., 2017). To bypass this issue, we transduced cells with lentivirus containing a vector encoding an internal ribosomal entry site (IRES) that allows a WT or mutant version of CTCF and the red fluorescent protein mCherry to be simultaneously expressed from a single mRNA transcript. We then sorted the successfully infected cells (mCherry positive and GFP negative; Figure 2B) to obtain a pooled population of steady-state rescues after degradation of the endogenous CTCF protein via AID (Figures 2B and S2A).
Although both ZF1Δ and ZF10Δ mutants rescued the lethality of endogenous CTCF depletion and had comparable levels of expression (Figures 2C and S2B), the cells exhibited a significantly slower proliferation rate relative to the WT rescue but presented no drastic changes in their cell cycle (Figures S2C–S2E). These results suggested that an important biological role of CTCF involves ZF1 and ZF10. Our previous report on CTCF-RNA interactions shows that an internal deletion (aa 574–614) within the RBR-ZF10 (aa 520–727) displays significant defects in self-association but no defects in binding to the cohesin complex (Saldaña-Meyer et al., 2014). ZF1ΔΔ also retained its ability to interact with the cohesin complex, with apparently the same efficiency as that of ZF10Δ and WT CTCF (Figure 2C). We then performed the rescues in the absence of auxin and probed for the capacity of endogenous CTCF to co-precipitate the rescue proteins using an antibody against GFP (endogenous CTCF was readily distinguishable from the rescues given the molecular weight differences). Both mutants displayed defects in interaction with endogenous CTCF, reflecting a defect in self-associa-tion ( 60%) compared with the WT rescue (Figure 2D).
To directly test the RNA-binding capacity of these mutants, we used photoactivatable ribonucleoside-enhanced cross-linking and immunoprecipitation (PAR-CLIP). The WT rescue showed robust binding to RNA molecules, whereas both ZF1Δ and ZF10Δ mutants displayed drastic reductions in binding, as evidenced by a significantly decreased signal in radiolabeled RNA compared with the WT rescue (Figure 2E). Notably, naturally occurring mutations in endometrial and breast cancer within ZF1 (H284N) and ZF10 (C528S) target the histidine or cysteine residues that are essential for zinc binding in C2H2 type ZFs (Kemp et al., 2014) (Figure 2F). Surprisingly, point mutations within ZF1 (H284N) or ZF10 (C528S) had no detectable defect on RNA binding (Figures 2E and 2F). These results suggest that CTCF binding to RNA is not just a consequence of simple RNA affinity to its ZFs but instead requires a structural conformation or binding of other components that are disrupted indepen-dently by deletion of the respective RBRs in ZF1 and ZF10.
Deletion of RBRs in CTCF Disturbs Gene Expression
To test if the presence of RNA binding-defective mutants had any effect on gene expression, we subjected the rescue cell lines to single-cell RNA-seq (scRNA-seq). Principal-component analysis (PCA) showed similarities between the different rescues but also underscored the clear distinction between each population of cells (Figure 3A; Table S3). Further analysis on the differential expression represented as heatmaps showed that downregulated genes are similar in both mutant rescues, but distinct clusters of genes are upregulated for ZF1Δ and ZF10Δ (Figures 3B and S3A).
Figure 3. Gene Expression Defects Are Partially Preserved between RBR Deletions.

(A) Principal-component analysis (PCA)-based representation of single-cell RNA-seq data for rescue cell lines from WT (gray), ZF1Δ (black), and ZF10Δ (red). Each dot represents a single cell, and dots are arranged on the basis of PCA. The final number of cells sequenced per condition is noted in parentheses.
(B) Heatmaps depicting differentially expressed genes from scRNA-seq.
(C) Venn diagrams showing the overlap between differentially expressed genes for the different conditions and levels of significance.
(D) Bar graph illustrating the percentage of genes that have at least one CTCF-binding site for CTCF in the promoter region or gene body.
(E) Boxplot showing the motif affinity scores for CTCF-binding sites within DEG represented in (B) compared with a random sample of genes (Mann-Whitney test, p < 0.0001).
scRNA-seq allows us to monitor the variability and consistency of the phenotypes we observe at the single-cell level, but it is not regularly used to test differential expression, because of the lower sequencing depth per cell (Rizzetto et al., 2017). Given these limitations, we also performed regular bulk RNA-seq and compared the two approaches. The differentially expressed genes (DEGs) for ZF1Δ and ZF10Δ rescue cell lines showed good overlap (687 genes, false discovery rate [FDR] < 0.05) even at different thresholds of significance (215 genes, FDR < 0.001) between bulk and scRNA-seq (232 genes) (Figure 3C). Comparing all DEGs from both RNA binding-deficient mutants with all DEGs from cells depleted of CTCF for 24 and 48 h provided similar overlaps (824 genes, FDR < 0.05) (Figure 3C; Table S4). Remarkably, all these different DEGs displayed a distinctive similarity with promoters and/or gene bodies containing CTCF-binding sites, a feature that is significantly lower for randomly picked genes (Figure 3D). Furthermore, using DeepBind to examine the motif affinity of CTCF sites at TSSs and intragenic regions of DEGs, we observed a significantly lower score compared with control sites (Mann-Whitney test, p < 0.001; Figure 3E). Considering the binding profile of CTCF on the TSSs of DEG, we can distinguish at least two groups: one that has CTCF binding enriched at or near TSSs and one without it in the WT situation (Figure S3B). It was previously shown that after 24 h of CTCF depletion, downregulated genes are enriched for CTCF-binding sites at TSSs (Nora et al., 2017), yet our results suggest no distinction between down- and upregulated genes.
These data indicate that although both ZF1Δ and ZF10Δ have similar deficiencies in RNA binding (and self-association), yet retain efficient interaction with the cohesin complex (Figure 2), they appear to engender distinct gene expression profiles that partially but do not completely overlap with each other and with acute depletion of CTCF.
Deletion of RBRs in CTCF Disturbs Its Chromatin Binding
Next, we focused on the genome-wide binding of the mutant rescues. Findings from ChIP-seq experiments reflect those presented above for TI and RNase A digestion (Figures 1 and S1). To identify specific differences between rescues, we used the R package DiffBind, which incorporates statistical analyses developed for RNA-seq (DESeq2) that have been modified to analyze ChIP-seq data. We observed that most binding sites were unchanged between conditions (Figure S4A; Table S5). Importantly, we found 2,528 differentially bound sites in ZF1Δ and 2,823 in ZF10Δ, of which only 174 were shared (FDR = 0.05, log2 fold change > 1) (Figures 4A, S4A, and S4B). Furthermore, this differential binding seems to be mediated by a change in enrichment from an adenine to a guanine in the eighth position of the CTCF consensus sequence in ZF1Δ, but not for ZF10Δ (Figure 4B). This base is part of a triplet that ZF6 binds, suggesting that the binding site change is not a direct effect of the mutation (Hashimoto et al., 2017). Notably, we found that the CTCF-binding sites lost in the ZF1Δ rescue were located primarily at promoters, whereas ZF10Δ mutations were located mainly in intronic and intergenic regions. However, both binding sites correlated with a lower motif affinity compared with control sites (Mann-Whitney test, p < 0.0001; Figures 4C, 4D, and S4C).
Figure 4. Deletion of RBRs in CTCF Disturb Its Chromatin Binding.

(A) CTCF ChIP-seq for WT (gray), ZF1Δ (black), and ZF10Δ (red) rescue cell lines. Heatmaps were generated by centering and rank-ordering on CTCF-binding sites. Those lost for ZF1Δ (top) or ZF10Δ (bottom) are shown.
(B) De novo motif discovery was called for binding sites in (A), and a black box encloses the eighth position in which A to G was specifically preferred by ZF1Δ.
(C) Boxplot showing the motif affinity scores for CTCF-binding sites in (A) compared with unchanged sites (Mann-Whitney test, p < 0.0001).
(D) Bar graph representing the top three genomic regions for CTCF sites in (A).
(E and F) Mean expression levels for differentially expressed gene Cdkn2a (E) and corresponding ChIP-seq tracks (F) under each condition.
By integrating ChIP-seq and RNA-seq results, we can appreciate that the decrease in promoter binding can directly correlate with the change in gene expression, especially for ZF1Δ, which exhibited a more drastic decrease in CTCF binding. In some instances, ZF10Δ also resulted in reduced binding to promoters, as in the case of the Cdkn2a gene (Figures 4E, 4F, and S3B). Taken together, these results suggest that although many similarities exist between ZF1Δ and ZF10Δ, the preference for specific sequences in the genome can partially account for their different phenotypes. This and the other differences observed are likely a result of the deletions disrupting RNA-dependent interactions with other proteins.
Deletion of RBRs in CTCF Disturbs 3D Chromatin Structure
To study 3D chromatin conformation, we performed Hi-C and generated approximately 6 billion Hi-C contacts from each rescue cell line (2.0 billion per condition) (Figures S5A and S5B). First, we focused on chromatin loops that are evident in Hi-C maps by the appearance of a higher frequency spot at the corner of a chromatin-interacting domain (a region that interacts more frequently than expected), indicative of a CTCF-CTCF-mediated chromatin loop.
To quantify the differences between mutants, we used the aggregate peak analysis (APA) method (Durand et al., 2016), which superimposes the signals from all loops (peak pixels), giving a combined signal for each condition. The genome-wide APA signal was strong for the WT rescue (2.38), while it was decreased for both ZF1Δ (1.18) and ZF10Δ (1.93) (Figures 5A and 5B). These decreases directly correlated with a lower number of annotated loops for the mutants (Figure 5C). For the WT rescue cells, we annotated 9,578 loops. Strikingly, loops mostly disappeared in the ZF1Δ rescue, whose binding sites are specifically lost at promoters, with a loss of 70% of loops (Figure 5C) that was obviously evident by visual examination. For ZF10Δ, for which the affected binding sites are located primarily within intergenic regions, we annotated 7,668 loops, and although most loops were intact as determined by visual examination, the pixel intensity was reduced compared with WT loops (Figures 5A–5C). By integrating ChIP-seq and Hi-C maps, we observed at least two general types of loops exhibiting either (1) the loss of CTCF binding on at least one anchor (Figures 5D and S5C) or loop disruption without the loss of CTCF binding at either anchor (Figures 5E and S5D).
Figure 5. RBR Mutants Disturb Chromatin Loops.

(A) Aggregate peak analysis (APA) was used to measure the aggregate strength of chromatin loops annotated by HICCUPS on the WT rescue. Loop strength is indicated by the extent of focal enrichment at the center of the plot. APA scores are shown on the bottom left.
(B) Bar graph representing APA scores between rescue conditions.
(C) Bar graph representing the number of chromatin loops annotated by HICCUPS for each individual condition.
(D) Representative contact matrix (at 5 kb resolution) shows that the chromatin loop in the WT rescue (left) disappears in the ZF1Δ (middle) or loses strength in ZF10Δ (right), while CTCF binding is lost at one of the anchors.
(E) Same as (D), but in this example CTCF remains bound under all conditions.
Using Arrowhead to annotate chromatin-interacting domains, we observed a modest reduction in the two mutants, with ZF1Δ being the most affected, having fewer but larger domains; similar results were obtained using Hicratio. We annotated 6,501 and 3,311 chromatin-interacting domains for WT, 5,310 and 3,054 for ZF1Δ, and 5,749 and 3,118 for ZF10Δ using Arrowhead and Hicratio, respectively (Figure S5F; Table S6). Chromatin-interacting domains were also called using Crane insulation scores (Crane et al., 2015) at 40 kb bin resolution with an insulating window of 103 or 500 kb, both of which identified similar numbers of chromatin domains (Figure S5F).
Next, we tested if there were any changes in the interaction frequency within conserved chromatin-interacting domains. We classified these domains in terms of decreased, increased, or stable activity (FDR < 0.1). Regardless of the algorithm used to call chromatin-interacting domains, we observed that compared with the WT rescue, both mutants had a predominantly increased interaction frequency in domains with altered activity (Figure 6A; Figure S5E), a trend that reflected the 5C results from TI and RNase A conditions (Figures 1F, 1G, S1D, and S1E).
Figure 6. RBR Mutants Disturb Chromatin Loops.

(A) Intra-domain interaction changes in WT versus ZF1Δ and WT versus ZF10Δ for common domains. CTCF mutant rescues are associated with gain (red) and loss (blue) of intra-domain interactions.
(B) Boxplots representing the correlation between DEG and chromatin domains whose interactions are increased. Only downregulated genes for ZF1Δ are significantly correlated with increased intra-domain interactions, while all others are not significantly correlated.
(C) Representative contact matrix (at 5 kb resolution) show that the chromatin loop anchor on the left overlaps with the promoter of the Syne2 gene. In the WT rescue (left), the loop disappears in the ZF1Δ (middle) and is stable in ZF10Δ (right), while CTCF binding is lost only at the promoter and anchor for ZF1Δ. Syne2 is upregulated only under the ZF1Δ condition.
(D) Graphical representation of a chromatin loop formed by two CTCF proteins (green) and cohesin rings (blue), stabilized by an RNA in the WT condition (left diagram). Two outcomes are observed for the RNA binding-deficient mutants (ZF1Δ and ZF10Δ): (1) the loop is lost and a CTCF protein loses its binding to chromatin (top, right diagram), or (2) both CTCF proteins remain bound to chromatin yet the chromatin loop is still lost (bottom, right diagram).
Importantly, about 60% of ZF1Δ sites with decreased binding were located in gene promoters. An obvious assumption would be that CTCF is functioning as a transcription factor in these cases. Nonetheless, ZF1Δ presented the most striking pheno-type of chromatin loop disruption. Thus, we analyzed the frequency at which TSSs are found within chromatin loop anchors. By overlapping all TSSs with the 9,578 annotated loops for the WT rescue, we found that 14% of loop anchors overlapped with a TSS, and of those, the majority were delimited by CTCF binding on each side of a chromatin-interacting domain called by Arrowhead (Figure S5G), a significantly higher enrichment than the 3% overlap seen in the random control. These results suggested that CTCF can function as both a transcription factor and an insulator at the same time. Indeed, such is the case for some DEGs for ZF1Δ or ZF10Δ that are contained within a chromatin-interacting domain that is disrupted along with loss of CTCF in their promoter region, which also serves as an anchor for a chromatin loop (Figure 6C).
Next, we attempted to correlate gene expression with the increased activity within chromatin-interacting domains. To do this, we assigned a DEG (FDR < 0.05, log2 fold change > 1) to a common chromatin-interacting domain when its promoter overlapped with the domain. We assessed statistical significance for downregulated or upregulated DEG for each mutant. Only the downregulated genes for ZF1Δ showed a significant correlation with increased interactions within a chromatin-interacting domain (Figure 6B).
Finally, we focused on genomic compartmentalization using PCA and hierarchical clustering, which reveals spatial segregation into A “active” and B “inactive” chromatin compartments. Neither RNA binding-defi-cient mutant rescue showed changes in the plaid pattern, as defined by the eigenvectors of the Hi-C correlation map, or in compartment domains, compared with the WT control (Figure S6). This finding is consistent with previous observations revealing that genomic compartmentalization relies on mechanisms independent of CTCF and cohesin (Nora et al., 2017; Rao et al., 2017).
The results above indicate that the formation of chromatin loops requires CTCF to properly interact with RNA, and mutations in its RBRs disturb their formation with direct and indirect effects on gene expression and chromatin organization (Figure 6D).
DISCUSSION
We previously demonstrated the ability of CTCF to bind large numbers of RNAs (Saldaña-Meyer et al., 2014), findings that were subsequently corroborated by others (Kung et al., 2015). In this study, we were able to dissect a fundamental and general role for RNA binding to CTCF. Importantly, we describe a clear co-dependency of CTCF-RNA interaction and chromatin binding that affects both 3D chromatin structure and transcription.
Some examples exist of individual RNAs that have important and specific functions, and we expect that more will surface in the future, especially for different cell types or during specific stages of development and differentiation. Regardless, we favor the view that most RNA molecules, not only non-coding (nc) RNAs, have a structural and stabilizing role inside the nucleus, as well as the potential to mediate or increase protein-protein interactions without showing any obvious sequence specificity.
The concept of RNA as a structural component of the nucleus originated in 1989, when the Sheldon Penman group reported that the nuclear matrix fibers collapse and aggregate after treatment with RNase A or actinomycin D in detergent-extracted cells. They proposed that RNA is a structural component of the nuclear matrix, which in turn might organize the higher order structure of chromatin (Nickerson et al., 1989). More recently, Hall et al. (2014) showed that RNAs transcribed from repetitive LINE1 elements stably associate with interphase chromosomes and are stable under TI. Furthermore, the loss of these nuclear RNAs from euchromatin disrupts proper chromatin condensation, underscoring the putative structural role for transposons including LINEs and other repetitive sequences that together constitute more than half of the human genome (de Koning et al., 2011; Hall et al., 2014).
CTCF is highly conserved across species (Heger et al., 2012; Vietri Rudan et al., 2015), and the presence of its 11 ZFs suggests that it can bind DNA in multiple ways (Filippova et al., 1996; Nakahashi et al., 2013). The 20 bp DNA core motif (Holohan et al., 2007; Kim et al., 2007; Schmidt et al., 2010; Xie et al., 2007) was suggested to be engaged by ZFs 4–7 in vivo (Nakahashi et al., 2013). This motif is present in most of the known CTCF-binding sites identified by ChIP-seq, and the nonspecific engagement of ZFs other than 4–7 with the flanking DNA sequence was proposed to stabilize CTCF binding (Nakahashi et al., 2013). Recently, the crystal structure of overlapping stretches of CTCF’s ZFs bound to the core motif was resolved, showing that ZFs 3–7 engage the major groove of the core DNA motif. Importantly, it also revealed the lack of a specific function in DNA recognition and binding for ZF1, ZF10, and ZF11 (Hashimoto et al., 2017). Furthermore, mutating the histidine of ZF1 was previously shown to modestly affect the binding of CTCF to chromatin (Nakahashi et al., 2013). Our results show that a comparable point mutation did not affect RNA binding, but a deletion within ZF1 had a significant decrease in both RNA and chromatin binding (Figures 2, 3, and 4). Last, point mutations in ZF1 or ZF10 that do and do not affect the binding of ZFs to DNA are found in cancer (Figure 2F) (Kemp et al., 2014). In the context of this study, together these data suggest that the main property of ZF1 and ZF10 is binding to RNA rather than DNA.
Thus far, CTCF binding to DNA seems unaffected by other factors, as the knockdown of most of its binding partners is ineffectual. One exception is the general transcription factor II-I (TFII-I), which seems to stabilize CTCF binding at promoter regions (Penã-Hernández et al., 2015). In the context of our observations under TI (Figure 1), the knockdown of TFII-I most likely affects the transcription of its target genes, and hence the decrease in CTCF binding might be an indirect effect of disrupting transcription. Here, we showed that the CTCF-binding sites affected are those whose sequence diverged from the core DNA-binding motif (Figures 1D, 3E, and 4C), suggesting that this difference can have important roles in regulatory mechanisms, with RNA binding at its core.
CTCF was originally described as a TF, and there are several examples showing that CTCF binding to gene promoters is necessary for proper transcription of tumor suppressor genes, such as BRCA1, RB, TP53, and p16INK4a (Butcher and Rodenhiser, 2007; De La Rosa-Velázquez et al., 2007; Soto-Reyes and Recillas-Targa, 2010; Witcher and Emerson, 2009). Yet because CTCF was described as having a role as an architectural protein, little attention has been afforded to its role as a TF. Most arguments against CTCF being important for gene expression rest on the relatively small number ( 200–400) of genes that are affected upon its knockdown or even its acute depletion using an AID (Nora et al., 2017; Zuin et al., 2014). In this context, our ZF1Δ and ZF10Δ rescue cell lines also exhibited a modest number of DEGs, although this varied depending on the threshold applied: 1,000 genes (FDR < 0.05) to 400 genes (FDR < 0.001).
Additionally, when analyzing the relative occupancy of CTCF as measured by ChIP-seq, promoter regions have significantly less occupancy compared with its overall binding sites (Figures 1A–1C) (Weintraub et al., 2017). CTCF-binding sites with low occupancy that diverge from the core DNA motif were associated with regulated binding during mESC differentiation (Plasschaert et al., 2014). In our study, we noticed that CTCF-binding sites within DEGs share these same characteristics, and chromatin binding is destabilized in both ZF1Δ and ZF10Δ rescue cell lines compared with WT (Figures 4D and 4E).
It is our view that CTCF has a significant role in regulating gene expression on the basis of the following observations: (1) Hemi-zygous mice for CTCF succumb to cancer in 80% of animals tested, highlighting that chronically lower levels of CTCF have clear dramatic effects on the biology of the cell and seem to be a hallmark of carcinogenesis (Kemp et al., 2014). (2) DEGs have significantly more CTCF-binding sites in their promoters and gene bodies (Figure 4B). (3) CTCF orientation at promoters is in the same direction as transcription and these form loops with internal CTCF-binding sites close to exons. These loops are prevalent and significant for alternative splicing (Ruiz-Velasco et al., 2017). We also found that a significant number of TSSs overlap with anchor sites delimiting chromatin-interacting domains, suggesting that CTCF can function as both a TF and an insulator at the same time (Figure S5G). (4) Differences between cell-type specificity of CTCF binding fit with the transcription trapping hypothesis: RNA contributes to the maintenance and recognition of its binding site for certain TFs such that “transcription of regulatory elements produce a positive-feedback loop that contributes to the stability of gene expression programs” (Sigova et al., 2015). All these features together underscore the relevance of CTCF as a TF and the interplay between transcription and chromatin organization.
In this study, we provide new insight into the relevance of CTCF-RNA interactions. We demonstrate that chromatin looping requires not only CTCF binding to chromatin but also to RNA. The reduced looping capability observed in RNA binding-deficient mutants causes an overall increase in interactions, highlighting the need for RNA molecules to stabilize the appropriate connections. Specifically, both ZF1Δ and ZF10Δ show an increase in interactions within chromatin-interacting domains (Figure 6A). These results suggest that altered cis-interactions and chromatin loops that are formed throughout the genome alter cell proliferation (Figure S2B). Furthermore, gene expres-sion alterations are enriched at boundary regions (Figure S6E), possibly through new or disrupted promoter-enhancer contacts or aberrant inter-domain interactions, suggesting that these are important regulatory regions.
We previously hypothesized that RNA molecules would stabilize CTCF-CTCF loops in vivo after describing that CTCF self-association was RNA dependent in vitro (Saldaña-Meyer et al., 2014). In our previous study, we termed the RBR (aa 520–727) as the region of CTCF from ZF10 to the end of the C terminus and a deletion within that RBR (aa 574–614) was found to be necessary for CTCF self-association and affected RNA binding in vitro (Saldaña-Meyer et al., 2014). Unexpectedly and in contrast to in vitro results, PAR-CLIP on full-length CTCF with the internal deletion resulted in only a modest reduction in RNA binding, compelling us to pursue further mapping of RBRs that are now presented in this study. In parallel to this study, Hansen et al. (2019) (in this issue of Molecular Cell) showed that the internal deletion in the RBR had significant defects on self-associa-tion and clustering but the RNA-binding defect is more modest than the ZF1Δ and ZF10Δ mutants. Regardless, half of the chromatin loops were disrupted in this mutant (Hansen et al., 2019). Together, these two studies suggest that there are several regions within CTCF than can associate with RNA and likely with other factors, which together contribute to the stability of CTCF binding to chromatin and to the formation of chromatin loops.
Many questions remain to be explored if transcription is considered to be a main factor contributing to the regulation of chromatin-interacting domains in a temporal and cell type-specific manner. Perhaps other RNA-binding proteins can account for specific structural roles. Many chromatin-interacting domains are gene poor, or the genes they contain are largely silenced. In these cases, the contribution of nascent RNA as a structural component appears untenable. Yet it is possible that abundant long-lived transcripts such as those from repetitive regions (Hall et al., 2014) could have a general function in chromatin organization of these repressed regions. On the basis of the large number of RNA interactors that are pulled down with CTCF (Kung et al., 2015; Saldaña-Meyer et al., 2014), we envision that these interactions might be highly redundant. Of note, experiments performed to date have examined interactions between bulk RNA and CTCF and, importantly, have yet to be designed to detect potential specificity of the interacting RNA in the context of distinct CTCF DNA-binding sites. Determining exactly how CTCF interacts in complex with DNA and RNA as well as with its protein partners will be an exciting new research avenue. Advances in technical approaches will be needed to improve our understanding of these highly complex regulatory mechanisms.
STAR★METHODS
LEAD CONTACT AND MATERIALS AVAILABILITY
Further information and requests for resources and reagents should be directed to and will be fulfilled by the Lead Contact, Danny Reinberg (Danny.Reinberg@nyulangone.org).
EXPERIMENTAL MODEL AND SUBJECT DETAILS
Mouse ESC culture
E14Tga2 (ATCC, CRL-1821) mESCs were grown in standard medium supplemented with LIF, 1 μM MEK1/2 inhibitor (PD0325901, Stemgent) and 3 μM GSK3 inhibitor (CHIR99021, Stemgent); rescue cell lines were also grown with 500mM of indole-3-acetic acid (IAA, chemical analog of auxin) in the medium as in Nora et al. (2017).
METHOD DETAILS
Transcriptional inhibition
mESCs were incubated with a combination of transcriptional inhibitors (Triptolide 1 mM and DRB 100mM) for 1 or 4 hours. After treatment cells were immediately harvested for immunoblot, ChIP and 5C experiments.
RNase A treatment
The treatment was performed as in Beltran et al. (2016). Briefly, mESCs nuclei were permeabilized with 0.05% Tween-20 in PBS for 10 min at 4C, washed once and resuspended in PBS and finally incubated with RNase A (1 mg/ml) or a mock reaction for 30 minutes. After treatment cells were immediately harvested for ChIP and 5C experiments.
Rescue cell line generation
HEK293T to cells were grown to 90% confluency, split 1:4 and grown for one day. Cell were then transfected with pLVX-EF1a-IRES-mCherry encoding CTCF WT, ZF1Δ, ZF10Δ, H284N or C528S along with their respective packaging vectors. After 4 hours of transfection the medium was changed to complete DMEM and finally to ESC culture medium after 32–40hr of transfection. Then, the viral supernatant was harvested, filtered through 0.45um syringe filter and added polybrene to 8mg/ml. Added the mix to cells and spin infect (500 g X 60min). Change medium the next day. Sorted for mCherry positive cells after 2 days of infection for each condition.
Cell isolation and flow cytometry
Single-cell suspensions were prepared passing through 40-mm cell strainers (BD Biosciences) and sorted for mCherry+ mESCs using SY3200 cell sorter. For cell cycle analysis, Click-It Edu AlexaFluor 488 Flow Cytometry Assay (Invitrogen) was used following manufacturing protocol and counterstaining with Propidium Iodide. Stained cells were assayed with BD LSRII flow cytometer and all results were analyzed using FlowJo software.
PAR-CLIP
PAR-CLIP was performed as in Saldaña-Meyer et al. (2014) with some modifications. Briefly, cells were grown under standard conditions and pulsed with 400 mM 4-SU (Sigma) for 2 h. After washing the plates with PBS, cells were cross-linked with 400 mJ/cm2 UVA (312 nm) using a Stratalinker UV cross-linker (Stratagene). Whole nuclear lysates (WNLs) were obtained by fractionation and nuclei were then incubated for 10 min at 37 C in an appropriate volume of CLIP buffer (20 mM HEPES at pH 7.4, 5 mM EDTA, 150 mM NaCl, 2% EMPIGEN) supplemented with protease inhibitors, 20 U/mL Turbo DNase (Life technologies), and 200 U/mL murine RNase inhibitor (New England Biolabs). After clearing the lysate by centrifugation, immunoprecipitations were carried out using 200 mg of WNLs, CTCF antibody, in the same CLIP buffer for 4h at 4 C and then added protein G-coupled Dynabeads (Life Technologies) for an additional hour. Contaminating DNA was removed by treating the beads with Turbo DNase (2 U in 20 mL). Cross-linked RNA was labeled by successive incubation with 5 U of Antarctic phosphatase (New England Biolabs) and 5 U of T4 PNK (New England Biolabs) in the presence of 10 mCi [32P] ATP (PerkinElmer). Labeled material was resolved on 8% Bis-Tris gels, transferred to nitrocellulose membranes, and visualized by autoradiography. The same membrane was then blocked with TBS-T and 5% milk and blotted for CTCF and Lamin-B.
ChIP-seq
ChIP-seq experiments were performed as described previously (Gao et al., 2012). Briefly, cells were fixed with 1% Formaldehyde. Nuclei were isolated using buffers in the following order: LB1 (50 mM HEPES, pH 7.5 at 4C, 140 mM NaCl, 1 mM EDTA, 10% Glycerol, 0.5% NP40, 0.25% Triton X; 10 min at 4C), LB2 (10 mM Tris, pH 8 at 4C, 200 mM NaCl, 1 mM EDTA, 0.5 mM EGTA; 10 min at RT), and LB3 (10 mM Tris, pH 7.5 at 4C, 1 mM EDTA, 0.5 mM EGTA, and 0.5% N-Lauroylsarcosine sodium salt). Chromatin was fragmented to an average size of 250 bp using a Diagenode Bioruptor. Chromatin immunoprecipitation was performed with CTCF or K27ac anti-bodies. ChIP-seq libraries were prepared using the Kapa Library Prep Kit.
Bulk RNA-seq
Total RNA from ESCs was isolated with TRIzol (Life Technologies). Stranded libraries were then prepared with 2 mg of total RNA as starting material using TruSeq Stranded mRNA kits following the manufacturer’s instructions.
Single-cell RNA-seq library preparation
Single-cell RNA-seq libraries were prepared using the Chromium Controller (10X Genomics). Briefly, single cells in 0.04% BSA in PBS were separated into droplets and then reverse transcription and library construction was performed according to the 10X Chromium Single Cell 30 Reagent Kit User Guide and sequenced on an Illumina Novaseq 6000.
Single-cell RNaseq analysis was performed for three 10X libraries (WT, ZF1Δ and ZF10Δ rescues) and sequenced on a paired-end 26/98 Illumina NovaSeq 6000 S2 run. Per-read per-sample FASTQ files were generated using the bcl2fastq Conversion software (v2.20) to convert BCL base call files outputted by the sequencing instrument into the FASTQ format. The 10X Genomics analysis software, Cell Ranger (v2.1.0), specifically the “cellranger count” pipeline, was used to align reads from the generated FASTQ files to the mouse reference genome mm10, generate gene-barcode expression matrices, and perform clustering and differential gene expression analysis. The outputs of the three conditions (WT, ZF1Δ and ZF10Δ) from the “cellranger count” pipeline were aggregated using the “cellranger aggr” pipeline of Cell Ranger, normalizing the combined output to the same sequencing depth and recomputing the gene-barcode matrices and expression analysis accordingly for the aggregated data.
Hi-C library preparation
Hi-C libraries were constructed using the Arima kit following the manufacturer’s instructions. Briefly, cells were crosslinked with 2% formaldehyde to obtain 1–5 μg of DNA per Arima-HiC reaction. Importantly, the crosslinked cell pellet for each Arima-HiC reaction should not occupy more than 20 μL of volume in the sample tube and be devoid of any residual liquid. The Arima kit uses an enzyme cocktail that cuts at the following motifs, where ‘^’ is the cut site on the + strand: ĜATC, GÂNTC (N can be either of the 4 genomic bases). Because a digested end produced by one enzyme can be ligated to a digested end produced by the other enzyme, there are 4 possible ligation junction signatures in the chimeric reads: GATC-GATC, GANT-GATC, GANT-ANTC, GATC-ANTC. All enzymatic reactions were made in PCR tubes and incubation was performed using a thermocycler. Libraries were prepared using the Kapa Library Prep Kit with a modified protocol provided by Arima.
Definition of regulatory regions
Enhancers
For Figures S1C and S3B. Typical-enhancer coordinates were downloaded from Whyte et al. (2013)
5C Library Preparation
5C was performed as in Narendra et al. (2016). Briefly, 5C primers were annealed at 48 C for 16hrs atop the 3C libraries from each sample. 1fmol of each primer was used in the annealing reaction with 1 μg of 3C template and 1 μg of salmon sperm DNA. 16 separate annealing reactions were performed per sample, along with control reactions with individual components removed. Forward and reverse primers that annealed to adjacent regions of the 3C template were ligated with 10U of Taq ligase for 60’ at 48 C. Successfully ligated forward-reverse primer pairs were then amplified in 6 separate PCR reactions per annealing reaction, using primers specific to the T7 and T3 overhangs. PCR reactions from the equivalent initial sample were then pooled, purified, and run on a gel to ensure the control reactions did not show an amplification product. Libraries were then generated from the purified PCR product to allow for deep sequencing.
QUANTIFICATION AND STATISTICAL ANALYSIS
Bulk RNA-seq Analysis
Raw sequencing files were aligned against the mouse reference genome (GRCm38/mm10) using tophat 2.1.1 and differentially expressed genes were called using DESeq2 with adjusted p values 0.05 and 0.001.
Single-cell RNA-seq Analysis
Sequencing data was demultiplexed using the 10X Genomics Cell Ranger software (version 2.0.0) and aligned to the mm10 transcrip-tome. Unique molecular identifiers were collapsed into a gene-barcode matrix representing the counts of molecules per cell as determined and filtered by Cell Ranger using default parameters. Normalized expression values were generated using Cell Ranger using the default parameters.
ChIP-seq Analysis
Raw sequencing files were aligned against the mouse reference genome (GRCm38/mm10) using Bowtie2 (version 2.3.4.1) (parameters: -N 1 -k 1 -q -x). Ambiguous reads were filtered to use uniquely mapped reads in the downstream analysis. PCR duplicates were removed using Picard-tools (version 1.88). MACS version 2.0.10 was used to call narrow peaks (parameters: -g 1.87e9–qvalue 0.01). To create heatmaps we used deepTools (version 2.4.1) (Ramírez et al., 2016). We first ran bamCoverage (–binSize 50–extendReads 200 -of bigwig) and normalized read numbers to RPKM or to the spike-in Drosophila DNA (–scaleFactor sf), obtaining read coverage per 50-bp bins across the whole genome (bigWig files). We then used the bigWig files to compute read numbers centered on CTCF peaks called by MACS, on TSSs or enhancers (computeMatrix reference-point–sortRegions descend–sortUsing mean–averageTypeBins mean). Finally, heatmaps were created with plotHeatmap (–colorMap = ‘Blues’–sortRegions = no).
We used the DiffBind package to identify CTCF sites with significant increase or decrease in binding affinity (Parameters: summits = 250, FDR < 0.01, log2FoldChange > 1).
De Novo Motif Discovery
De novo motif discovery was carried out using the Homer pipeline (Heinz et al., 2010) using coordinates for peaks lost in ZF1Δ and ZF10Δ conditions (findMotifsGenome.pl -size 200).
Motif Analysis
To quantify the affinity of each CTCF motif instance identified from our ChIP-seq data we used DeepBind (Alipanahi et al., 2015), a deep learning algorithm that has been trained on large amounts of ChIP-seq data and can be used to score the affinity of any given sequence for the CTCF motif. 500 bp DNA sequences were used to score their motif affinity with DeepBind v0.11, using motif D00328.018 (CTCF).
Hi-C data processing and quality control
Processing
HiC-Bench (Lazaris et al., 2017) was used to align and filter the Hi-C data, identify chromatin-interacting domains, and generate Hi-C heatmaps. To generate Hi-C filtered contact matrices, the Hi-C reads were aligned against the mouse reference genome (GRCm38/mm10) by bowtie2 (Langmead and Salzberg, 2012) (version 2.3.1). Mapped read pairs were filtered by the GenomicTools (Tsirigos et al., 2012) tools-hic filter command integrated in HiC-bench for known artifacts of the Hi-C protocol. The filtered reads include multi-mapped reads (‘multihit’), read-pairs with only one mappable read (‘single sided’), duplicated read-pairs (‘ds.duplicate’), low mapping quality reads (MAPQ < 20), read-pairs resulting from self-ligated fragments, and short-range interactions resulting from read-pairs aligning within 25kb (‘ds.filtered’). For the downstream analyses, all the accepted intra-chromosomal read-pairs (‘ds.accepted intra’) were used.
The Hi-C filtered contact matrices were corrected using the ICE “correction” algorithm (Imakaev et al., 2012) built into HiC-bench. Chromatin-interacting domains were annotated in all conditions using Arrowhead at 10kb resolutions using default parameters (Durand et al., 2016). We also assessed chromatin loops with aggregate peak analysis (APA). We analyzed the data at 10kb resolution (-r 10000 -x 42 -k KR). HiC heatmaps for regions of interest were generated in juicer.
Chromatin domains and boundaries were called using Crane (Crane et al., 2015) at 40 kb bin resolution with an insulating window of 103 kb and 500kb. We also called domains using the Hicratio algorithm (Lazaris et al., 2017) at 40kb resolution.
Quality Control
Quality assessment analysis shows that the total numbers of reads per biological replicate for each condition ranged from 600 million reads to 1.1 billion. The percentage of reads aligned was always over 98% in all samples. The proportion of accepted reads (‘ds-accepted-intra’ and ‘ds-accepted-inter’) was 40%, which in all cases was sufficient to annotate chromatin loops with HICCUPS.
Downstream Analysis
The data was aligned against the mm10 reference genome. All contact matrices used for further analysis were KR-normalized. Chromatin loops were annotated for all conditions using HiCCUPS (Durand et al., 2016). Loops were called at 5kb and 10kb resolutions and merged using default parameters.
Compartments
Compartment analysis was carried out using the Homer pipeline (Heinz et al., 2010) (v4.6). Homer performs a principal component analysis of the normalized interaction matrices and uses the PCA1 component to predict regions of active (A compartments) and inactive chromatin (B compartments). Homer works under the assumption that gene-rich regions with active chromatin marks have similar PC1 values, while gene deserts show differing PC1 values. HiC filtered matrices were given as input to Homer together with H2K27ac peaks for compartment prediction. H2K27ac was used by Homer as prior information of active regions.
To determine if significantly altered compartments were present in the mutants, we used Homer’s getHiCcorrDiff.pl pipeline to correlate the interaction profile of each locus in the mutants to the interaction profile of that same locus in the wild-type condition. As a result, no significant altered compartment region was identified. We generated density plots to compare the cis-eigenvector 1 values of the mutants and the wild-type by using 50kb genomic bins. Pearson correlation coefficients were also calculated (‘Cor’ function in R).
Intra-domain interactions
We used the ‘domains-diff’ pipeline present in HiC-Bench to assess statistically significant intra-domain interactions.
First, the domains-diff pipeline identifies overlapped or positionally consistent domain (common chromatin-interacting domains). This approach establishes a minimum domain length parameter (default: 10 bins) and extends either side of the domain by 3 bins (+/120 kb in 40kb resolution). chromatin-interacting domains across two samples are considered positionally consistent if their boundaries are as close as 3 bins. The boundaries of the common chromatin-interacting domains are then set to those which yield the largest domain. The set of common domains between any two samples s1 and s2 is denoted as T. In the next step, a paired two-sided t test is performed on each single interaction bin within each common domain between the two samples. It calculates the difference between the average scores of all interaction intensities within such domains. A multiple testing correction by calcu-lating the false-discovery rate per common domain (using the R function p.adjust with method = “fdr”) is also calculated.
for each t ∈ T, and It being all intra-domain interactions for domains t.
We classified the common domains in terms of increased, decreased or stable intra-domain interactions by using FDR < 0.1 and absolute domain interactions change > 0.15. A minimum common domains length of 240 kb was considered in the intra-domain interactions differential analysis (6 bins).
Gene expression analysis in Common domains
To assess the correlation of RNA expression with the intra-domain activity status of the common domains in the ZF1 and ZF10 mutants, we assigned a differentially expressed gene (FDR < 0.05) to a common domain when its promoter overlapped with a common domain (overlap > 1 bp). Then, the mean fold change of the RNA expression inside each common domain was computed for upregulated and downregulated DEGs, separately, and compared between the common domain groups (increased-activity, decreased-activity, stable-activity). Statistical significance was assessed by performing a wilcoxon test (unpaired) and boxplots were generated in R.
Annotation of the differential CTCF sites
We used the ChIPSeeker library to annotate the differential CTCF sites obtained in the DiffBind analysis. Annotation packages: ‘TxDb.Mmusculus.UCSC.mm10.knownGene’ and ‘org.Mm.eg.db’ (Bioconductor).
To annotate the CTCF differential sites in domains or boundaries we used the domains and boundaries obtained using Crane (w = 500kb). A CTCF site was assigned to a boundary if the complete CTCF peak was found within the boundary coordinates.
Supplementary Material
KEY RESOURCES TABLE
| REAGENT or RESOURCE | SOURCE | IDENTIFIER |
|---|---|---|
| Antibodies | ||
| Anti-CTCF (IP, ChIP) | Abcam Cat# ab70303 | RRID:AB_1209546 |
| Anti-CTCF (WB) | Millipore # 07-729 | RRID:AB_441965 |
| Anti-Lamin B | Abcam Cat# ab16048 | RRID:AB_10107828 |
| Anti-Gapdh | Abcam Cat# ab8245 | RRID:AB_2107448 |
| Anti-YY1 | Santa Cruz # sc-7341 X | RRID:AB_2257497 |
| Chemicals, Peptides, and Recombinant Proteins | ||
| Triptolide | Sigma-Aldrich Cat# T3652 | N/A |
| DRB | Sigma-Aldrich Cat# D1916 | N/A |
| Indole-3-acetic acid sodium salt (auxin analog) | Sigma-Aldrich Cat# I5148-2G | N/A |
| CHIR99021 | Stemgent | N/A |
| PD0325901 | Stemgent | N/A |
| Critical Commercial Assays | ||
| TruSeq Stranded mRNA Kit | illumina | N/A |
| Kapa Library Prep Kit | Roche | N/A |
| Arima Hi-C Kit | Arima | N/A |
| Deposited Data | ||
| Hi-C, 5C, RNA-Seq, scRNA-Seq and ChIP-Seq data | This paper | GSE125595 |
| Unprocessed gel images for Figures 2, S1 and S2 | This paper | https://doi.org/10.17632/xbrf8x7k22.1 |
| Experimental Models: Cell Lines | ||
| mESC e14 CTCF-GFP-Tir1-TIGER | Nora et al., 2017 | N/A |
| mESC e14 CTCF-GFP-Tir1-TIGER-WT-Rescue | This paper | N/A |
| mESC e14 CTCF-GFP-Tir1-TIGER-ZF1Δ-Rescue | This paper | N/A |
| mESC e14 CTCF-GFP-Tir1-TIGER-ZF10Δ-Rescue | This paper | N/A |
| mESC e14 CTCF-GFP-Tir1-TIGER-ZF1-H284N-Rescue | This paper | N/A |
| mESC e14 CTCF-GFP-Tir1-TIGER-ZF10-H528S-Rescue | This paper | N/A |
| Recombinant DNA | ||
| pLVX-EF1a-IRES-mCherry Vector (pLVX) | Clontech | Cat# 631987 |
| Oligonucleotides | ||
| See Table S2 | This paper | N/A |
| Software and Algorithms | ||
| RStudio | RStudio | RRID:SCR_000432 |
| Samtools | Li et al., 2009 | RRID:SCR_002105 |
| Integrative Genomics Viewer | Robinson et al., 2011; Thorvaldsdóttir et al., 2013 | RRID:SCR_011793 |
| Bowtie2 | Langmead and Salzberg, 2012 | RRID:SCR_005476 |
| deepTools | Ramírez et al., 2016 | RRID:SCR_016366 |
| MACS | Zhang et al., 2008; https://github.com/taoliu/MACS/ | RRID:SCR_013291 |
| HiC-Pro | Servant et al., 2015 | https://github.com/nservant/HiC-Pro |
| DESeq2 | https://www.bioconductor.org | RRID:SCR_015687 |
| HiC-Bench | Lazaris et al., 2017 | https://github.com/NYU-BFX/hic-bench |
| Juicer 1.5 | Durand et al., 2016; https://github.com/aidenlab/juicer/wiki | RRID:SCR_017226 |
| tophat 2.1.1 | Trapnell et al., 2012; https://github.com/cole-trapnell-lab/cufflinks | RRID:SCR_013035 |
| Homer 4.10 | Heinz et al., 2010; http://homer.ucsd.edu/homer/ | RRID:SCR_010881 |
| DiffBind | Stark and Brown, 2011; http://bioconductor.org/packages/DiffBind/ | RRID:SCR_012918 |
| ChIPseeker | Yu et al., 2015 | http://bioconductor.org/packages/ChIPseeker/ |
| DeepBind | Alipanahi et al., 2015 | http://tools.genes.toronto.edu/deepbind/ |
Highlights.
Transcriptional inhibition disrupts CTCF binding to chromatin
RNA-binding regions (RBRs) in CTCF are found within ZF1 and ZF10
Gene expression and chromatin binding are disrupted by RBR mutants
Chromatin loops are markedly decreased in ZF1Δ and ZF10Δ mutant rescues
ACKNOWLEDGMENTS
We thank Dr. L. Vales for comments on the manuscript; Dr. Roberto Bonasio for sharing unpublished results for RBR-ID; Drs. Esteban Mazzoni and Pedro Lee for continuing discussions; Drs. Robert Tjian and Anders Hansen for early access to their manuscript; Dr. Angelica Menchaca at RNA Life Sciences Consulting for help with figure curation; the New York University Langone Medical Center (NYULMC) Genome Technology Center; the NYULMC Cytometry and Cell Sorting Core for help with fluorescence-activated cell sorting (FACS); Programa de Apoyo a Proyectos de Investigación e Innovación Tecnológica (PAPIIT; IA201817 and IN207319) for financial support to M.F.-M; and Laboratorio Nacional de Ciencias de la Sostenibilidad (LANCIS, UNAM) and Ing. Rodrigo García Herrera for access and technical support with the computer cluster. The NYULMC Genome Technology Center and the NYUMC Cytometry and Cell Sorting Core are partially supported by the Cancer Center Support Grant P30CA016087 at the Laura and Isaac Perlmutter Cancer Center. This work used computing resources at the High-Performance Computing Facility of the Center for Health Informatics and Bioinformatics at the NYULMC. K.J.-L. was supported by (CVU 631104) and R.S.-M. (CVU 224211) received a postdoctoral award from CONACYT. This work was supported by grants from the NIH (R01NS100897 and R01CA199652 to D.R. and 1R35GM122515 and 1R01-CA222131 to J.S.) and the Howard Hughes Medical Institute (to D.R.).
Footnotes
DATA AND CODE AVAILABILITY
Data can be found at GEO with accession GEO: GSE125595. Original gel images were uploaded to Mendeley Data: https://doi.org/10.17632/xbrf8x7k22.1
DECLARATION OF INTERESTS
D.R. is a co-founder of Constellation Pharmaceuticals and Fulcrum Therapeutics. R.S.-M. is a co-founder of RNA Life Sciences Consulting. All other authors declare no competing interests.
SUPPLEMENTAL INFORMATION
Supplemental Information can be found online at https://doi.org/10.1016/j.molcel.2019.08.015.
REFERENCES
- Alipanahi B, Delong A, Weirauch MT, and Frey BJ (2015). Predicting the sequence specificities of DNA- and RNA-binding proteins by deep learning. Nat. Biotechnol 33, 831–838. [DOI] [PubMed] [Google Scholar]
- Beltran M, Yates CM, Skalska L, Dawson M, Reis FP, Viiri K, Fisher CL, Sibley CR, Foster BM, Bartke T, et al. (2016). The interaction of PRC2 with RNA or chromatin is mutually antagonistic. Genome Res. 26, 896–907. [DOI] [PMC free article] [PubMed] [Google Scholar]
- Bensaude O. (2011). Inhibiting eukaryotic transcription: which compound to choose? How to evaluate its activity? Transcription 2, 103–108. [DOI] [PMC free article] [PubMed] [Google Scholar]
- Bonev B, and Cavalli G. (2016). Organization and function of the 3D genome. Nat. Rev. Genet 17, 661–678. [DOI] [PubMed] [Google Scholar]
- Butcher DT, and Rodenhiser DI (2007). Epigenetic inactivation of BRCA1 is associated with aberrant expression of CTCF and DNA methyltransferase (DNMT3B) in some sporadic breast tumours. Eur. J. Cancer 43, 210–219. [DOI] [PubMed] [Google Scholar]
- Crane E, Bian Q, McCord RP, Lajoie BR, Wheeler BS, Ralston EJ, Uzawa S, Dekker J, and Meyer BJ (2015). Condensin-driven remodelling of X chromosome topology during dosage compensation. Nature 523, 240–244. [DOI] [PMC free article] [PubMed] [Google Scholar]
- de Koning APJ, Gu W, Castoe TA, Batzer MA, and Pollock DD (2011). Repetitive elements may comprise over two-thirds of the human genome. PLoS Genet. 7, e1002384. [DOI] [PMC free article] [PubMed] [Google Scholar]
- De La Rosa-Velázquez IA, Rincón-Arano H, Benítez-Bribiesca L, and Recillas-Targa F. (2007). Epigenetic regulation of the human retinoblastoma tumor suppressor gene promoter by CTCF. Cancer Res. 67, 2577–2585. [DOI] [PubMed] [Google Scholar]
- Dixon JR, Selvaraj S, Yue F, Kim A, Li Y, Shen Y, Hu M, Liu JS, and Ren B. (2012). Topological domains in mammalian genomes identified by analysis of chromatin interactions. Nature 485, 376–380. [DOI] [PMC free article] [PubMed] [Google Scholar]
- Dowen JM, Fan ZP, Hnisz D, Ren G, Abraham BJ, Zhang LN, Weintraub AS, Schujiers J, Lee TI, Zhao K, and Young RA (2014). Control of cell identity genes occurs in insulated neighborhoods in mammalian chromosomes. Cell 159, 374–387. [DOI] [PMC free article] [PubMed] [Google Scholar]
- Durand NC, Shamim MS, Machol I, Rao SSP, Huntley MH, Lander ES, and Aiden EL (2016). Juicer provides a one-click system for analyzing loop-resolution Hi-C experiments. Cell Syst. 3, 95–98. [DOI] [PMC free article] [PubMed] [Google Scholar]
- Filippova GN, Fagerlie S, Klenova EM, Myers C, Dehner Y, Goodwin G, Neiman PE, Collins SJ, and Lobanenkov VV (1996). An exceptionally conserved transcriptional repressor, CTCF, employs different combinations of zinc fingers to bind diverged promoter sequences of avian and mammalian c-myc oncogenes. Mol. Cell. Biol 16, 2802–2813. [DOI] [PMC free article] [PubMed] [Google Scholar]
- Fudenberg G, Abdennur N, Imakaev M, Goloborodko A, and Mirny LA (2017). Emerging evidence of chromosome folding by loop extrusion. Cold Spring Harb. Symp. Quant. Biol 82, 45–55. [DOI] [PMC free article] [PubMed] [Google Scholar]
- Gao Z, Zhang J, Bonasio R, Strino F, Sawai A, Parisi F, Kluger Y, and Reinberg D. (2012). PCGF homologs, CBX proteins, and RYBP define functionally distinct PRC1 family complexes. Mol. Cell 45, 344–356. [DOI] [PMC free article] [PubMed] [Google Scholar]
- Hall LL, Carone DM, Gomez AV, Kolpa HJ, Byron M, Mehta N, Fackelmayer FO, and Lawrence JB (2014). Stable C0T-1 repeat RNA is abundant and is associated with euchromatic interphase chromosomes. Cell 156, 907–919. [DOI] [PMC free article] [PubMed] [Google Scholar]
- Hansen AS, Hsieh T-HS, Cattoglio C, Pustova I, Saldaña-Meyer R, Reinberg D, Darzacq X, and Tjian R. (2019). Distinct classes of chromatin loops revealed by deletion of an RNA-binding Region in CTCF. Mol. Cell 76 Published online September 12, 2019. 10.1016/j.molcel.2019.07.039. [DOI] [PMC free article] [PubMed] [Google Scholar]
- Hashimoto H, Wang D, Horton JR, Zhang X, Corces VG, and Cheng X. (2017). Structural basis for the versatile and methylation-dependent binding of CTCF to DNA. Mol. Cell 66, 711–720.e3. [DOI] [PMC free article] [PubMed] [Google Scholar]
- He C, Sidoli S, Warneford-Thomson R, Tatomer DC, Wilusz JE, Garcia BA, and Bonasio R. (2016). High-resolution mapping of RNA-binding regions in the nuclear proteome of embryonic stem cells. Mol. Cell 64, 416–430. [DOI] [PMC free article] [PubMed] [Google Scholar]
- Heger P, Marin B, Bartkuhn M, Schierenberg E, and Wiehe T. (2012). The chromatin insulator CTCF and the emergence of metazoan diversity. Proc. Natl. Acad. Sci. U S A 109, 17507–17512. [DOI] [PMC free article] [PubMed] [Google Scholar]
- Heinz S, Benner C, Spann N, Bertolino E, Lin YC, Laslo P, Cheng JX, Murre C, Singh H, and Glass CK (2010). Simple combinations of lineage-determining transcription factors prime cis-regulatory elements required for macrophage and B cell identities. Mol. Cell 38, 576–589. [DOI] [PMC free article] [PubMed] [Google Scholar]
- Holohan EE, Kwong C, Adryan B, Bartkuhn M, Herold M, Renkawitz R, Russell S, and White R. (2007). CTCF genomic binding sites in Drosophila and the organisation of the bithorax complex. PLoS Genet. 3, e112–e112. [DOI] [PMC free article] [PubMed] [Google Scholar]
- Imakaev M, Fudenberg G, McCord RP, Naumova N, Goloborodko A, Lajoie BR, Dekker J, and Mirny LA (2012). Iterative correction of Hi-C data reveals hallmarks of chromosome organization. Nat. Methods 9, 999–1003. [DOI] [PMC free article] [PubMed] [Google Scholar]
- Kaneko S, Bonasio R, Saldaña-Meyer R, Yoshida T, Son J, Nishino K, Umezawa A, and Reinberg D. (2014a). Interactions between JARID2 and noncoding RNAs regulate PRC2 recruitment to chromatin. Mol. Cell 53, 290–300. [DOI] [PMC free article] [PubMed] [Google Scholar]
- Kaneko S, Son J, Bonasio R, Shen SS, and Reinberg D. (2014b). Nascent RNA interaction keeps PRC2 activity poised and in check. Genes Dev. 28, 1983–1988. [DOI] [PMC free article] [PubMed] [Google Scholar]
- Kemp CJ, Moore JM, Moser R, Bernard B, Teater M, Smith LE, Rabaia NA, Gurley KE, Guinney J, Busch SE, et al. (2014). CTCF haploinsufficiency destabilizes DNA methylation and predisposes to cancer. Cell Rep. 7, 1020–1029. [DOI] [PMC free article] [PubMed] [Google Scholar]
- Kim TH, Abdullaev ZK, Smith AD, Ching KA, Loukinov DI, Green RD, Zhang MQ, Lobanenkov VV, and Ren B. (2007). Analysis of the vertebrate insulator protein CTCF-binding sites in the human genome. Cell 128, 1231–1245. [DOI] [PMC free article] [PubMed] [Google Scholar]
- Kung JT, Kesner B, An JY, Ahn JY, Cifuentes-Rojas C, Colognori D, Jeon Y, Szanto A, del Rosario BC, Pinter SF, et al. (2015). Locus-specific targeting to the X chromosome revealed by the RNA interactome of CTCF. Mol. Cell 57, 361–375. [DOI] [PMC free article] [PubMed] [Google Scholar]
- Lai F, Orom UA, Cesaroni M, Beringer M, Taatjes DJ, Blobel GA, and Shiekhattar R. (2013). Activating RNAs associate with Mediator to enhance chromatin architecture and transcription. Nature 494, 497–501. [DOI] [PMC free article] [PubMed] [Google Scholar]
- Langmead B, and Salzberg SL (2012). Fast gapped-read alignment with Bowtie 2. Nat. Methods 9, 357–359. [DOI] [PMC free article] [PubMed] [Google Scholar]
- Lazaris C, Kelly S, Ntziachristos P, Aifantis I, and Tsirigos A. (2017). HiC-bench: comprehensive and reproducible Hi-C data analysis designed for parameter exploration and benchmarking. BMC Genomics 18, 22. [DOI] [PMC free article] [PubMed] [Google Scholar]
- Li H, Handsaker B, Wysoker A, Fennell T, Ruan J, Homer N, Marth G, Abecasis G, and Durbin R; 1000 Genome Project Data Processing Subgroup (2009). The Sequence Alignment/Map format and SAMtools. Bioinformatics 25, 2078–2079. [DOI] [PMC free article] [PubMed] [Google Scholar]
- Li W, Notani D, Ma Q, Tanasa B, Nunez E, Chen AY, Merkurjev D, Zhang J, Ohgi K, Song X, et al. (2013). Functional roles of enhancer RNAs for oestrogen-dependent transcriptional activation. Nature 498, 516–520. [DOI] [PMC free article] [PubMed] [Google Scholar]
- Lieberman-Aiden E, van Berkum NL, Williams L, Imakaev M, Ragoczy T, Telling A, Amit I, Lajoie BR, Sabo PJ, Dorschner MO, et al. (2009). Comprehensive mapping of long-range interactions reveals folding principles of the human genome. Science 326, 289–293. [DOI] [PMC free article] [PubMed] [Google Scholar]
- Merkenschlager M, and Nora EP (2016). CTCF and cohesin in genome folding and transcriptional gene regulation. Annu. Rev. Genomics Hum. Genet 17, 17–43. [DOI] [PubMed] [Google Scholar]
- Moore JM, Rabaia NA, Smith LE, Fagerlie S, Gurley K, Loukinov D, Disteche CM, Collins SJ, Kemp CJ, Lobanenkov VV, and Filippova GN (2012). Loss of maternal CTCF is associated with peri-implantation lethality of Ctcf null embryos. PLoS ONE 7, e34915. [DOI] [PMC free article] [PubMed] [Google Scholar]
- Nakahashi H, Kieffer Kwon KR, Resch W, Vian L, Dose M, Stavreva D, Hakim O, Pruett N, Nelson S, Yamane A, et al. (2013). A genome-wide map of CTCF multivalency redefines the CTCF code. Cell Rep. 3, 1678–1689. [DOI] [PMC free article] [PubMed] [Google Scholar]
- Narendra V, Bulajic M, Dekker J, Mazzoni EO, and Reinberg D. (2016). CTCF-mediated topological boundaries during development foster appropriate gene regulation. Genes Dev. 30, 2657–2662. [DOI] [PMC free article] [PubMed] [Google Scholar]
- Nickerson JA, Krochmalnic G, Wan KM, and Penman S. (1989). Chromatin architecture and nuclear RNA. Proc. Natl. Acad. Sci. U S A 86, 177–181. [DOI] [PMC free article] [PubMed] [Google Scholar]
- Nora EP, Goloborodko A, Valton A-L, Gibcus JH, Uebersohn A, Abdennur N, Dekker J, Mirny LA, and Bruneau BG (2017). Targeted degradation of CTCF decouples local insulation of chromosome domains from genomic compartmentalization. Cell 169, 930–944.e22. [DOI] [PMC free article] [PubMed] [Google Scholar]
- Pękowska A, Klaus B, Xiang W, Severino J, Daigle N, Klein FA, Oles M, Casellas R, Ellenberg J, Steinmetz LM, et al. (2018). Gain of CTCF-anchored chromatin loops marks the exit from naive pluripotency. Cell Syst. 7, 482–495.e10. [DOI] [PMC free article] [PubMed] [Google Scholar]
- Penã-Hernández R, Marques M, Hilmi K, Zhao T, Saad A, Alaoui-Jamali MA, del Rincon SV, Ashworth T, Roy AL, Emerson BM, and Witcher M. (2015). Genome-wide targeting of the epigenetic regulatory protein CTCF to gene promoters by the transcription factor TFII-I. Proc. Natl. Acad. Sci. U S A 112, E677–E686. [DOI] [PMC free article] [PubMed] [Google Scholar]
- Phillips-Cremins JE, Sauria MEG, Sanyal A, Gerasimova TI, Lajoie BR, Bell JSK, Ong C-T, Hookway TA, Guo C, Sun Y, et al. (2013). Architectural protein subclasses shape 3D organization of genomes during lineage commitment. Cell 153, 1281–1295. [DOI] [PMC free article] [PubMed] [Google Scholar]
- Plasschaert RN, Vigneau S, Tempera I, Gupta R, Maksimoska J, Everett L, Davuluri R, Mamorstein R, Lieberman PM, Schultz D, et al. (2014). CTCF binding site sequence differences are associated with unique regulatory and functional trends during embryonic stem cell differentiation. Nucleic Acids Res. 42, 774–789. [DOI] [PMC free article] [PubMed] [Google Scholar]
- Ramírez F, Ryan DP, Gruning B, Bhardwaj V, Kilpert F, Richter AS, Heyne S, Dundar F, and Manke T. (2016). deepTools2: a next generation web server for deep-sequencing data analysis. Nucleic Acids Res. 44 (W1), W160–W165. [DOI] [PMC free article] [PubMed] [Google Scholar]
- Rao SSP, Huang S-C, Glenn St Hilaire B, Engreitz JM, Perez EM, Kieffer-Kwon K-R, Sanborn AL, Johnstone SE, Bascom GD, Bochkov ID, et al. (2017). Cohesin loss eliminates all loop domains. Cell 171, 305–320.e24. [DOI] [PMC free article] [PubMed] [Google Scholar]
- Rizzetto S, Eltahla AA, Lin P, Bull R, Lloyd AR, Ho JWK, Venturi V, and Luciani F. (2017). Impact of sequencing depth and read length on single cell RNA sequencing data of T cells. Sci. Rep 7, 12781. [DOI] [PMC free article] [PubMed] [Google Scholar]
- Robinson JT, Thorvaldsdóttir H, Winckler W, Guttman M, Lander ES, Getz G, and Mesirov JP (2011). Integrative genomics viewer. Nat. Biotechnol 29, 24–26. [DOI] [PMC free article] [PubMed] [Google Scholar]
- Rowley MJ, and Corces VG (2018). Organizational principles of 3D genome architecture. Nat. Rev. Genet 19, 789–800. [DOI] [PMC free article] [PubMed] [Google Scholar]
- Ruiz-Velasco M, Kumar M, Lai MC, Bhat P, Solis-Pinson AB, Reyes A, Kleinsorg S, Noh K-M, Gibson TJ, and Zaugg JB (2017). CTCF-mediated chromatin loops between promoter and gene body regulate alternative splicing across individuals. Cell Syst. 5, 628–637.e6. [DOI] [PubMed] [Google Scholar]
- Saldaña-Meyer R, González-Buendía E, Guerrero G, Narendra V, Bonasio R, Recillas-Targa F, and Reinberg D. (2014). CTCF regulates the human p53 gene through direct interaction with its natural antisense transcript, Wrap53. Genes Dev. 28, 723–734. [DOI] [PMC free article] [PubMed] [Google Scholar]
- Schmidt D, Schwalie PC, Ross-Innes CS, Hurtado A, Brown GD, Carroll JS, Flicek P, and Odom DT (2010). A CTCF-independent role for cohesin in tissue-specific transcription. Genome Res. 20, 578–588. [DOI] [PMC free article] [PubMed] [Google Scholar]
- Servant N, Varoquaux N, Lajoie BR, Viara E, Chen CJ, Vert J-P, Heard E, Dekker J, and Barillot E (2015). HiC-Pro: an optimized and flexible pipeline for Hi-C data processing. Genome Biol 16, 259. [DOI] [PMC free article] [PubMed] [Google Scholar]
- Sigova AA, Abraham BJ, Ji X, Molinie B, Hannett NM, Guo YE, Jangi M, Giallourakis CC, Sharp PA, and Young RA (2015). Transcription factor trapping by RNA in gene regulatory elements. Science 350, 978–981. [DOI] [PMC free article] [PubMed] [Google Scholar]
- Soto-Reyes E, and Recillas-Targa F. (2010). Epigenetic regulation of the human p53 gene promoter by the CTCF transcription factor in transformed cell lines. Oncogene 29, 2217–2227. [DOI] [PubMed] [Google Scholar]
- Stadhouders R, Vidal E, Serra F, Di Stefano B, Le Dily F, Quilez J, Gómez A, Collombet S, Berenguer C, Cuartero Y, et al. (2018). Transcription factors orchestrate dynamic interplay between genome topology and gene regulation during cell reprogramming. Nat. Genet 50, 238–249. [DOI] [PMC free article] [PubMed] [Google Scholar]
- Stark R, and Brown G. (2011). DiffBind: differential binding analysis of ChIP-Seq peak data. R Package version 2.2.7 http://bioconductor.org/packages/DiffBind/. [Google Scholar]
- Thorvaldsdóttir H, Robinson JT, and Mesirov JP (2013). Integrative Genomics Viewer (IGV): high-performance genomics data visualization and exploration. Brief. Bioinform 14, 178–192. [DOI] [PMC free article] [PubMed] [Google Scholar]
- Trapnell C, Roberts A, Goff L, Pertea G, Kim D, Kelley DR, Pimentel H, Salzberg SL, Rinn JL, and Pachter L. (2012). Differential gene and tran-script expression analysis of RNA-seq experiments with TopHat and Cufflinks. Nat. Protoc 7, 562–578. [DOI] [PMC free article] [PubMed] [Google Scholar]
- Tsirigos A, Haiminen N, Bilal E, and Utro F. (2012). GenomicTools: a computational platform for developing high-throughput analytics in genomics. Bioinformatics 28, 282–283. [DOI] [PubMed] [Google Scholar]
- Vietri Rudan M, Barrington C, Henderson S, Ernst C, Odom DT, Tanay A, and Hadjur S. (2015). Comparative Hi-C reveals that CTCF underlies evo-lution of chromosomal domain architecture. Cell Rep. 10, 1297–1309. [DOI] [PMC free article] [PubMed] [Google Scholar]
- Weintraub AS, Li CH, Zamudio AV, Sigova AA, Hannett NM, Day DS, Abraham BJ, Cohen MA, Nabet B, Buckley DL, et al. (2017). YY1 is a structural regulator of enhancer-promoter loops. Cell 171, 1573–1588.e28. [DOI] [PMC free article] [PubMed] [Google Scholar]
- Whyte WA, Orlando DA, Hnisz D, Abraham BJ, Lin CY, Kagey MH, Rahl PB, Lee TI, and Young RA (2013). Master transcription factors and mediator establish super-enhancers at key cell identity genes. Cell 153, 307–319. [DOI] [PMC free article] [PubMed] [Google Scholar]
- Witcher M, and Emerson BM (2009). Epigenetic silencing of the p16(INK4a) tumor suppressor is associated with loss of CTCF binding and a chromatin boundary. Mol. Cell 34, 271–284. [DOI] [PMC free article] [PubMed] [Google Scholar]
- Xiao R, Chen J-Y, Liang Z, Luo D, Chen G, Lu ZJ, Chen Y, Zhou B, Li H, Du X, et al. (2019). Pervasive chromatin-RNA binding protein interactions enable RNA-based regulation of transcription. Cell 178, 107–121.e18. [DOI] [PMC free article] [PubMed] [Google Scholar]
- Xie X, Mikkelsen TS, Gnirke A, Lindblad-Toh K, Kellis M, and Lander ES (2007). Systematic discovery of regulatory motifs in conserved regions of the human genome, including thousands of CTCF insulator sites. Proc. Natl. Acad. Sci. U S A 104, 7145–7150. [DOI] [PMC free article] [PubMed] [Google Scholar]
- Yu G, Wang L-G, and He Q-Y (2015). ChIPseeker: an R/Bioconductor package for ChIP peak annotation, comparison and visualization. Bioinformatics 31, 2382–2383. [DOI] [PubMed] [Google Scholar]
- Zhang Y, Liu T, Meyer CA, Eeckhoute J, Johnson DS, Bernstein BE, Nusbaum C, Myers RM, Brown M, Li W, and Liu XS (2008). Model-based analysis of ChIP-Seq (MACS). Genome Biol. 9, R137–R139. [DOI] [PMC free article] [PubMed] [Google Scholar]
- Zuin J, Dixon JR, van der Reijden MIJA, Ye Z, Kolovos P, Brouwer RWW, van de Corput MPC, van de Werken HJG, Knoch TA, van IJcken WFJ, et al. (2014). Cohesin and CTCF differentially affect chromatin architecture and gene expression in human cells. Proc. Natl. Acad. Sci. USA 111, 996–1001. [DOI] [PMC free article] [PubMed] [Google Scholar]
Associated Data
This section collects any data citations, data availability statements, or supplementary materials included in this article.