Abstract
Background:
Varying treatment outcomes in transcranial electrical stimulation (tES) recipients may depend on the amount of current reaching the brain. Brain atrophy associated with normal aging may affect tES current delivery to the brain. Computational models have been employed to compute predicted tES current inside the brain. This study is the largest study that uses computational models to investigate tES field distribution in healthy older adults.
Methods:
Individualized head models from 587 healthy older adults (mean=73.9years, 51–95 years) were constructed to create field maps. Two electrode montages (F3-F4, M1-SO) with 2mA input current were modeled using ROAST with modified codes. A customized template of healthy older adults, the UFAB-587, was created from the same dataset and used to warp individual brains into the same space. Warped models were analyzed to determine the relationship between computed field measures, brain atrophy and age.
Main results:
Computed field measures were inversely correlated with brain atrophy (R2=0.0829, p=1.14e-12). Field pattern showed negative correlation with age in brain sub-regions including part of DLPFC and precentral gyrus. Mediation analysis revealed that the negative correlation between age and current density is partially mediated by brain-to-CSF ratio.
Conclusions:
Computed field measures showed decreasing amount of tES current reaching the brain with increasing atrophy. Therefore, adjusting current dose by modifying tES stimulation parameter in older adults based on degree of atrophy may be necessary to achieve desired stimulation benefits. Results from this study may inform future tES application in healthy older adults.
Keywords: tES, tDCS, aging, brain atrophy, finite element model
INTRODUCTION
The older adult population of 60 years and older has increased exponentially in the past decade [1] and numerous research efforts have been dedicated to address and treat age-related issues. These efforts include exploring intervention strategies targeting brain function to maintain independent living in the aging population. Transcranial electrical stimulation (tES) has emerged as an attractive treatment to remediate age-related decline in cognitive and motor functions [1–3]. Conventional tES delivers mild electrical current (typically 1–2mA) via a pair of large electrodes (e.g., ~35cm2 area) placed on scalp at locations based on desired target brain regions. Prior research shows that while tES has potential for impacting motor and cognitive functions in older adults [1, 4–8], individual responses to tES application vary significantly. This variability can depend, in part, on different amounts of current reaching the brain across participants due to inter-individual anatomical differences despite using the same standardized electrode montage. Further, direct measurements of electrical current in-vivo is difficult and thus pose a challenge to quantify current dose in the brain for optimizing stimulation effects. Therefore, finite element modeling (FEM) based computational studies have been employed to predict electrical current distribution in the human head during stimulation [9–12]. Individual head models are typically converted from T1-weighted magnetic resonance (MR) images following a standard modeling workflow [13]. Prior research shows that variation in brain anatomy e.g., gyrus morphology have considerable effects on modeled field measures in the brain, and thus warrant the need for individualized head models [12,14,15]. Initial modeling validation studies suggest that predicted field measures and reconstructed in-vivo tissue conductivity values computed using FEM are comparable to empirical values [16–19]. Therefore, FEM continues to be considered as an acceptable tool to indirectly measure electric current distribution in the brain during tES.
Prior research studies suggest that computed field measures in the brain change with increasing age, and these changes are associated with structural changes in the brain (i.e., brain atrophy). Laakso et al. [20] conducted tES FEM studies in 24 adult males (mean age=38.63, range =21–55 years) using 1mA C3-Fp2 (M1-SO) montage and reported a significant negative effect of age on peak electric field due to the positive correlation between age and cerebrospinal fluid (CSF) volume, as a measure of brain atrophy. Mahdavi et al. [21] reported decreased field measures in the brain with increasing brain atrophy in three head models (young-healthy, elder-healthy, elder-MCI) and increasing field measures in CSF from the younger to elder, both in healthy and MCI group [21]. Thomas et al. [22] computed field measures in five head models representing five decades of life (ages=42, 54, 66, 75, and 85), using conventional and high-definition electrode montages located in F3-F4 and M1-SO. They found a decreasing peak field strength from 42 to 75 years old and an increasing trend from 75–85 years old in target gyri. While previous studies observed similar trends of decreasing magnitudes in both electric field and current density with increasing age, these studies were performed in small cohorts (mean n=10.7±11.6 subjects). Therefore, computational models in a larger cohort of older adults are needed to provide a more comprehensive insight on whether age-related effects e.g., brain atrophy can alter the amount of current delivered to the brain.
In this paper, we present the largest tES FEM study in 587 older adults with ages ranging from 51 to 95 years old. Stimulation of 2mA using two conventional electrode montages was modeled to evaluate age effects on modeled field measures. Computed current density and electric field strength were assessed in brain regions only (gray and white matter). Brain atrophy was quantified as brain ratio which was the ratio of the individual brain volumes relative to their intracranial volumes. We hypothesize that predicted field measures are indicative of the structural changes of the aging brain, which can be useful for current dose determination in future tES studies involving aging populations.
METHODS
T1-weighted images of 587 older adults (age range=51–95 years; mean age=73.9 years, 325 females, 262 males) sourced from a variety of study were converted into individual models. 300 participants were sourced from the Center for Cognitive Aging and Memory (CAM) database at the University of Florida, where 161 participants were screened using the National Alzheimer’s Coordinating Center (NACC) Uniform Data Set (UDS-III) and 139 participants were screened using the Montreal Cognitive Assessment for cognitively healthy. Additional 287 were obtained from the Alzheimer’s Disease Neuroimaging Initiative (ADNI) database (adni.loni.usc.edu) and screened as cognitively normal based on the ADNI procedures manual. The ADNI was launched in 2003 as a public-private partnership, led by Principal Investigator Michael W. Weiner, MD. The primary goal of ADNI has been to test whether serial magnetic resonance imaging (MRI), positron emission tomography (PET), other biological markers, and clinical and neuropsychological assessment can be combined to measure the progression of mild cognitive impairment (MCI) and early Alzheimer’s disease (AD). For up-to-date information, see www.adni-info.org [23]. All experimental procedures reported in this study followed protocols approved by the Institutional Review Boards at the University of Florida, University of Arizona, and all participating ADNI sites. Averaged field measures were computed in nine age groups (5-year range per group) as shown in Table 1. All T1-weighted images were acquired with 3T MRI scanners as described in Table 2.
Table 1.
Age range and the total of subjects in each age group.
| Age Range | Number of Subjects (N) |
|---|---|
| 51–55 | 7 |
| 56–60 | 14 |
| 61–65 | 40 |
| 66–70 | 125 |
| 71–75 | 176 |
| 76–80 | 121 |
| 81–85 | 66 |
| 86–90 | 31 |
| 91–95 | 7 |
| Total | 587 |
Table 2.
MRI information and the number of participants. A breakdown of the number of participants and their corresponding information on MRI scanner, imaging sequence, matrix size, image resolution and pulse sequence parameters.
| Number of participants | Scanner | Imaging sequence | Matrix size | Resolution (mm) | TR (ms) | TE (ms) |
|---|---|---|---|---|---|---|
| 121 | Siemens | MPRAGE | 176×256×256 | 1×1×1 | 1800 | 2.3 |
| 25 | Siemens | MPRAGE | 176×256×256 | 1×1×1 | 1800 | 2.3 |
| 25 | Philips | MPRAGE | 170×240×240 | 1×1×1 | 7200 | 3.3 |
| 115 | Philips | MPRAGE | 170×240×240 | 1×1×1 | 7000 | 3.2 |
| 15 | Siemens | MPRAGE | 176×256×256 | 1×1×1 | 2500 | 3.4 |
| 30 | Siemens | MPRAGE | 160×240×256 | 1.2×1×1 | 2300 | 2.9 |
| 14 | GE | MPRAGE | 166×256×256 | 1.2×1×1 | 7000 | 2.9 |
| 61 | Philips | MPRAGE | 170×256×256 | 1.2×1×1 | 7000 | 3.0 |
| 121 | Siemens | MPRAGE | 176×240×256 | 1.2×1×1 | 2300 | 2.9 |
| 60 | GE | IR-SPGR | 196×256×256 | 1.2×1×1 | 7000 | 2.9 |
Electrode Placements
Two electrode montages based on the 10–20 EEG System, F3-F4 and C3-Fp2 (anode=F4, C3; cathode=F3, Fp2), were modeled independently (Figure 1). Each electrode was modeled as a 5×7cm2 pad (σ=5.9×10⁷S/m) with 3mm thickness, and placed on the scalp with a gel layer (s=0.3S/m) interface [24]. Voltage boundary conditions equivalent to 2mA total current at the anodes and −2mA at the cathodes were assigned to each electrode montage.
Figure 1.

Electrode montages investigated in this study. Showing from left to right: F3-F4 and C3-Fp2, with red electrodes denoting the anodes and blue electrodes as the cathodes.
Head Model Construction and Execution
Individual T1-weighted images acquired from both databases were converted from DICOM to NIfTI file types using dcm2niix [25] and resampled into a 256mm3 field of view (RAS orientation) 1 mm3 voxel size using FreeSurfer v6.0.0 [26] prior to processing with ROAST v2.7.1 [24]. In ROAST, each head volume was segmented into white matter (WM), gray matter (GM), CSF, bone, skin, and air compartments [27,28]. A combination of segmented WM, GM, and CSF volumes were used to compute brain ratio to estimate brain atrophy, such that:
| equation (1) |
Where {Volumeinterest} is either WM, GM, or both WM and GM (brain) volume. Isotropic conductivity values for all tissue types except air were modified from the default setting to the values listed in Table 3 [13]. WM isotropic conductivity was computed as an average of the longitudinal and transverse measured values [14,29]. Segmented head volumes were meshed and solved in ROAST [24] using parallel processing on a high-performance computing cluster (50 CPU, 175GB RAM) at the University of Florida using the MATLAB Parallel Computing Toolbox to reduce total wall time from ~18 minutes to ~1.8 minutes per subject.
Table 3.
Tissue conductivity values for six tissue types. White matter, gray matter, bone and skin values were sourced from the literature for measurement frequency up to 20kHz [13] and within the range of reported values in typical volume conductor models [29]. Bone conductivity (combined) was computed as where σcan was cancellous bone and σcor was the average of cortical bone conductivity reported in the reference. Isotropic white matter conductivity was simulated using the formula where σl was longitudinal and σt was transverse conductivity.
| Tissue types | σ (S/m) | Reference |
|---|---|---|
| White matter | 1.2×10⁻¹(trans.) 1.2 (long.) |
Geddes and Baker (1967) [29] |
| Gray matter | 1.0×10⁻¹ | Gabriel et al. (1996) [30] |
| Cerebrospinal fluid | 1.8 | Baumann et al. (1997) [31] |
| Skin | 4.3×10⁻¹ | Holdefer et al. (2006) [32] |
| Bone | 21.4 ×10⁻³ (cancellous) 5.52 × 10⁻³ (cortical) 10.9 × 10⁻³ (combined) |
Akhtari et al. (2000) [33] |
| Air | 2.5×10⁻¹⁴ | Huang (2019) [24] |
DARTEL Template Construction
The same 587 T1-weighted images were processed using the DARTEL toolbox [30] to create a custom template, referred to as the UFAB-587 (University of Florida Aging Brain-587). The UFAB-587 template (FOV=121×145×118, 1.5 mm3 voxel resolution) consists of probability distributions of six tissue volumes (WM, GM, CSF, bone, skin, and air) with assigned contrast values for visualizing purposes computed from the 587 T1 images acquired at 3T (GM = 80.56, WM = 108.06, CSF = 28.41, bone = 30.83, skin = 74.74, air = 0). Voxel-wise statistical analyses were compared between using the UFAB-587 template versus the more commonly used standard template, the ICBM-152 2009a Nonlinear Symmetric 1mm3 collected from healthy young adults [31].
Current Density and Electric Field Calculation
Current density (J) is useful for dosage determination in terms of the amount of current (A/m2) that reached the brain. Electric field (EF) values are useful for comparing predicted field strength in the cortex from stimulation to literature reported values of field threshold needed for neurons in the cortex to fire (e.g., 27 V/m for pyramidal neurons [32]). Additional MATLAB routines were added to the ROAST pipeline to convert electric field magnitudes, |EF| (V/m) to current density values, J (A/m2). Prior to all analyses, computed J and |EF| values were masked using individual brain regions to restrict field measures within the brain tissues only, excluding CSF regions. Masked values were then transformed to UFAB-587 space using FSL FMRIB’s Linear Registration Tool (FLIRT) [33]. Pre- and post-transformation J and |EF| median values were computed and plotted in MATLAB as a quality check (Appendix A). Transformed J and |EF| values were averaged in each age bin to create heatmaps per electrode montage. To demonstrate practical examples of adjusting current dose in older adults with respect to young, we applied the same modeling pipeline to young adult T1-weighted images (n=38, age range=22–31 years; mean age=27.2 years, 19 females, 19 males) sourced from the Human Connectome Project database [34]. Percent difference in median J was computed between older and young adult cohorts, and converted into current magnitudes to reflect the amount of current needed to achieve current dose equivalent to 2mA stimulation in young adults.
Voxel-wise Statistical Analyses
A smoothing filter, 3 mm3 FWHM Gaussian kernel, was applied to transformed J and |EF| values to reduce any normalization errors and satisfy the random field theory for multiple comparison corrections [35]. Four separate linear regression models were created using SPM12 for J and |EF| in F3-F4 and C3-Fp2. Each model had a predictor variable of age, and a nuisance covariate of scanner. A dummy variable of 6 classes was created to model the scanner covariate of UF-Phillips, UF-Siemens, UA-Siemens, ADNI-GE, ADNI-Phillips, and ADNI-Siemens and account for any variance explained by the different MRI scanner properties (Table 2). Clusters within the brain regions were formed using a voxel-wise threshold of 0.05 family-wise error corrected and deemed significant if they had a false discovery rate cluster-wise p-value of less than 0.05.
Mediation analyses
Mediation analysis [36] using the SPSS Process package [37] was performed in five representative clusters obtained from voxel-wise analyses to determine whether the relationship between age and J was mediated by WM, GM or CSF volume. Age, volume, and J were assigned as the independent, mediation, and dependent variables, respectively. A bootstrapping estimation approach based on 5000 samples [37,38] was used to estimate the indirect effect of the mediator.
RESULTS
The UFAB-587 template and the ICBM-152 template are shown in Figure 2. The UFAB-587 (Figure 2A) shows the pruning of gray matter volume and a larger lateral ventricle region compared to the ICBM template (Figure 2B), which is indicative of brain atrophy. Figure 3 shows the brain inclusion analysis mask overlays on their respective templates that were used for statistical analyses. The mask overlay on the UFAB-587 template (Figure 3A) shows a larger brain coverage than the mask overlay on the standard ICBM template (Figure 3B), especially in the frontal region that indicates an improvement of using a relevant older adult head template versus young. Further details of J and |EF| analyses across nine age bins in both montages are described in the subsections below.
Figure 2.
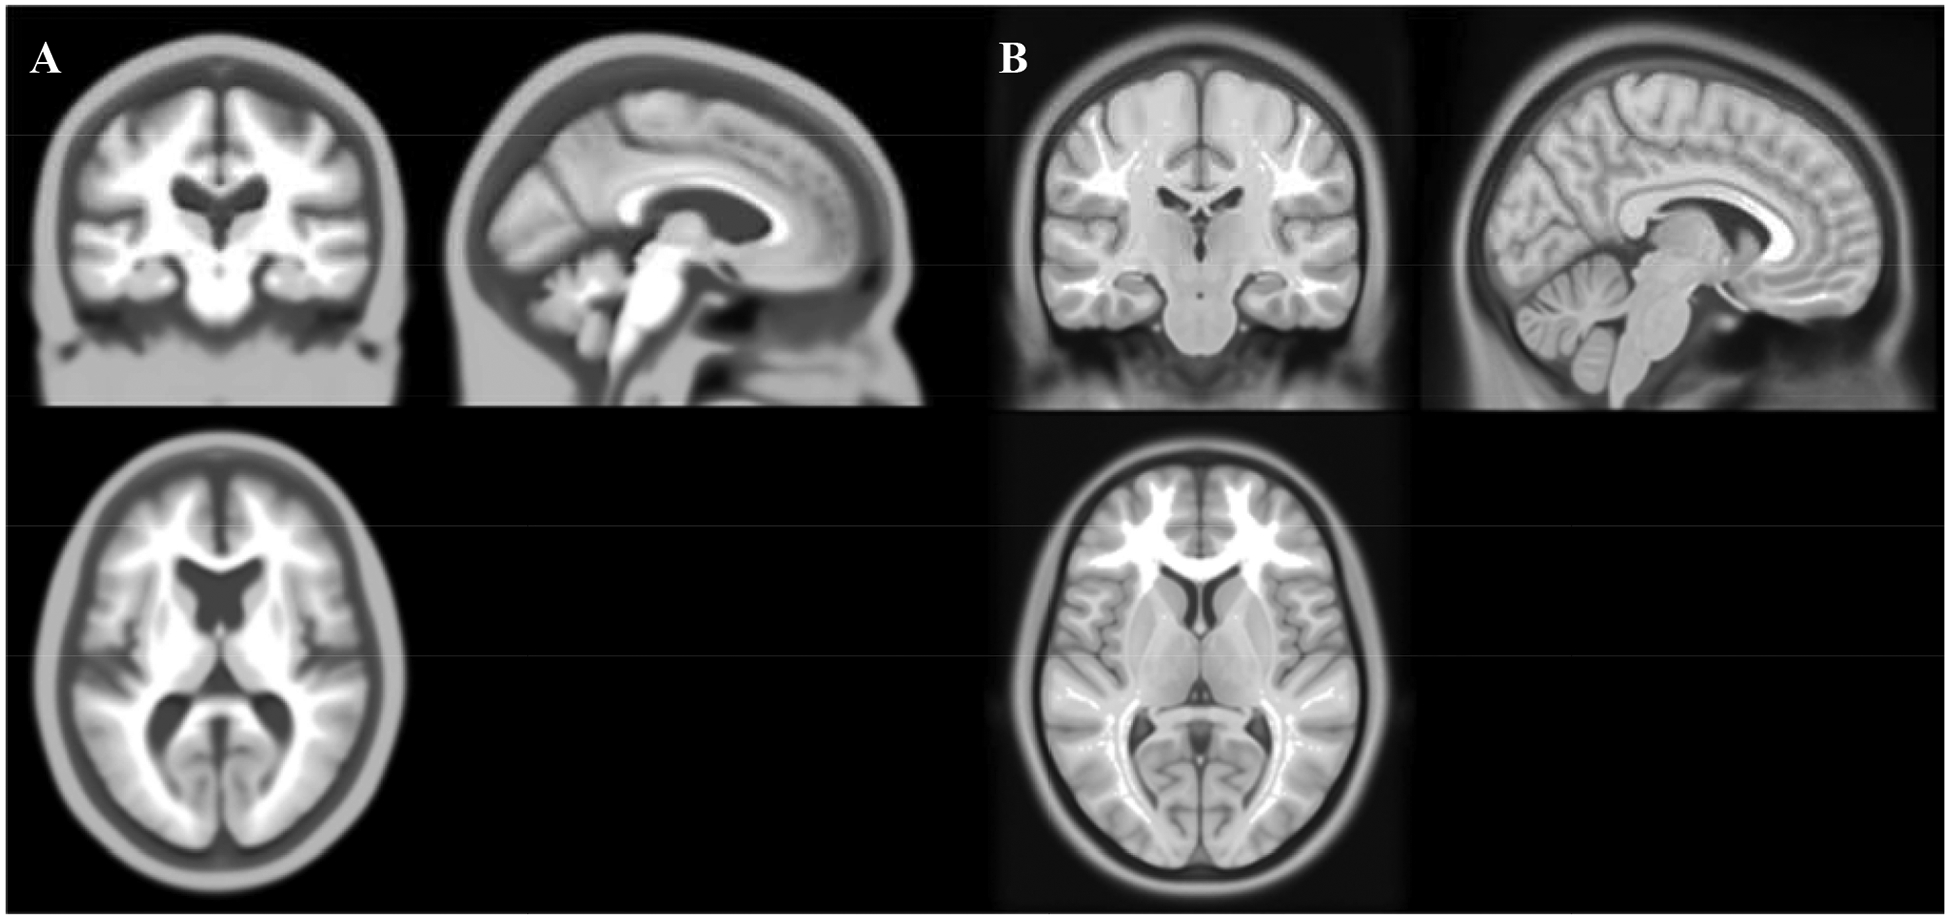
The UFAB-587 template and the standard ICBM template. Showing from left to right is A) the UFAB-587 template created from 587 T1-weighted images of healthy older adults (mean age 73.9, range 51–95 years) and B) the standard ICBM-152 template sampled from 152 T1-weighted images of young adults (mean age 25.01, range 18–44 years).
Figure 3.
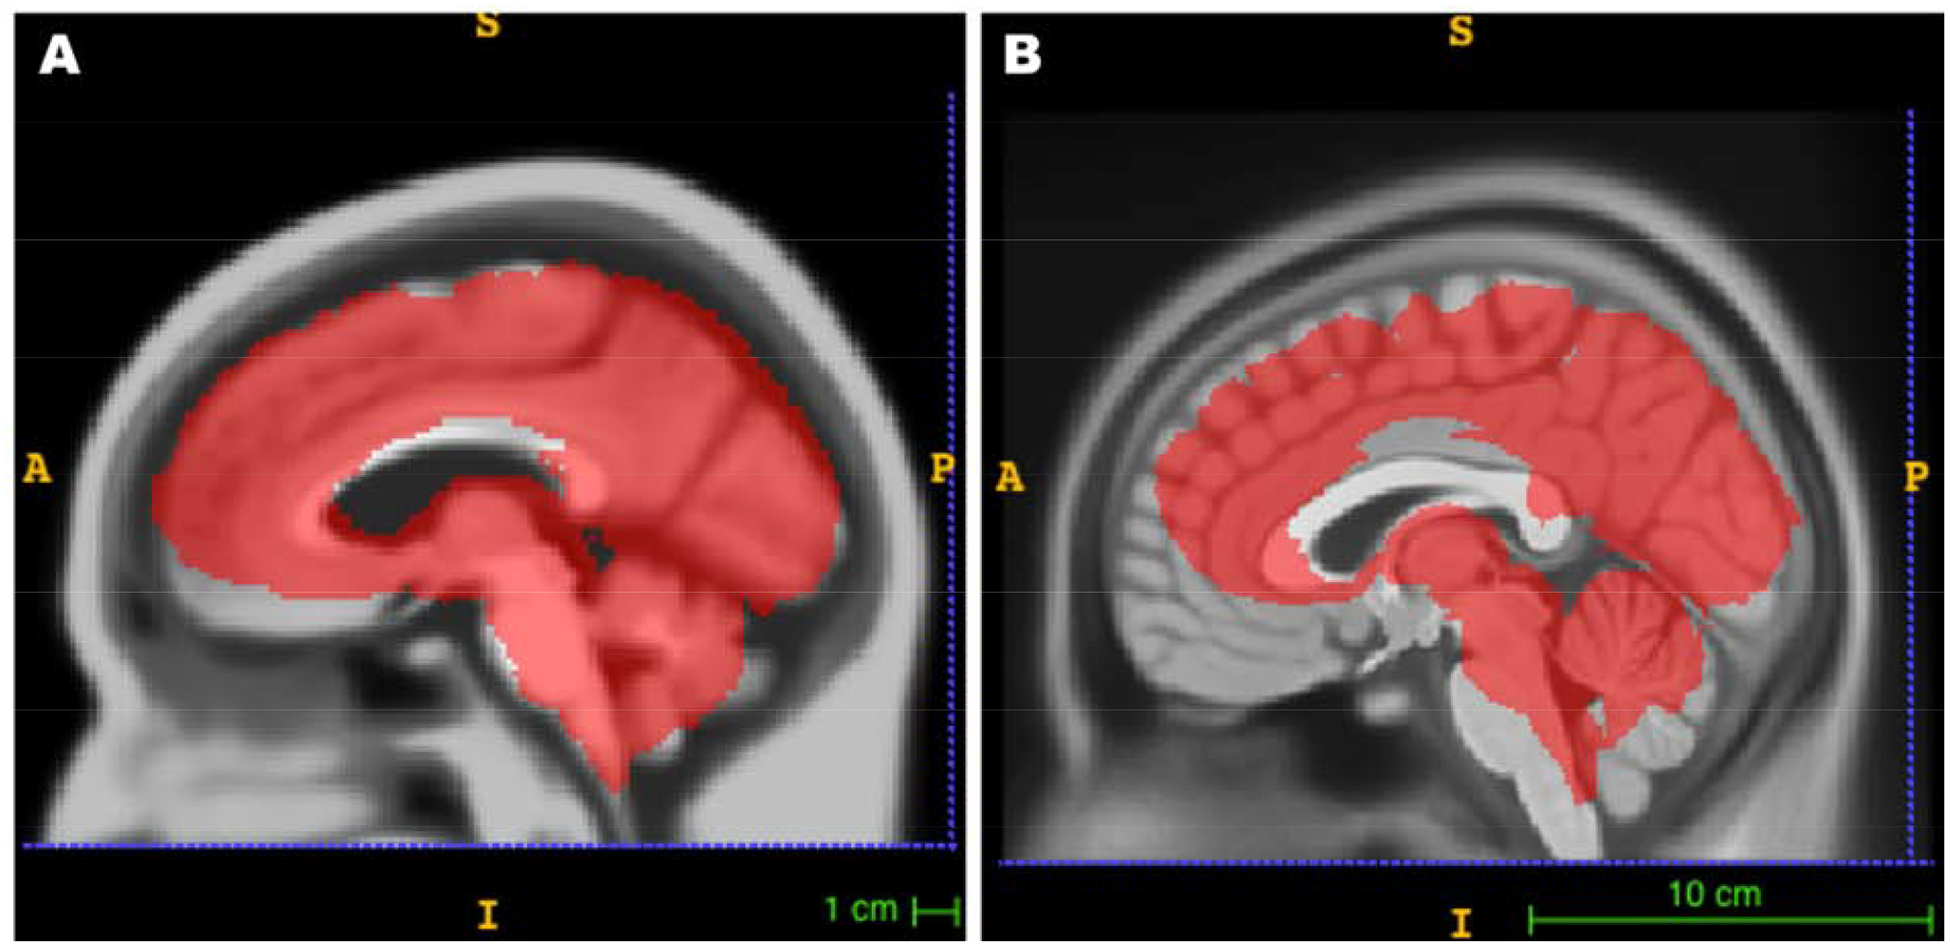
An overlay of an analysis mask on UFAB-587 and ICBM-152 templates. An example of analysis masks used in voxelwise analysis to show coverage area with respect to A) our custom template (UFAB-587) of older adults and B) the ICBM-152 sampled from young adults.
Brain Atrophy
Computed brain ratio as a measure of brain atrophy was plotted against age (Figure 4A–C) and median J (Figure 4D–F)). Brain ratio shows a declining trend with increasing age (R2=0.1163, p=1.7e-17) as illustrated in Figure 4A. Further breakdown of brain ratio into WM and GM showed the negative correlation between brain ratio and age was primarily driven by decreasing GM volume (R2=0.1875, p=2.78e-28) versus WM (R2=0.0071, p=0.0421) as shown in Figure 4B, C, respectively. On the contrary, Figure 4D shows an increasing trend of median J values with larger brain ratio (R2=0.0829, p=1.14e-12), while GM and WM volume had a negative and positive correlation with median J, respectively. WM (R2=0.3505, p=9.66e-57) primarily drives the positive correlation between brain ratio and median J as opposed to GM (R2=0.0085, p=0.0251), as shown in Figure 4E–F.
Figure 4.
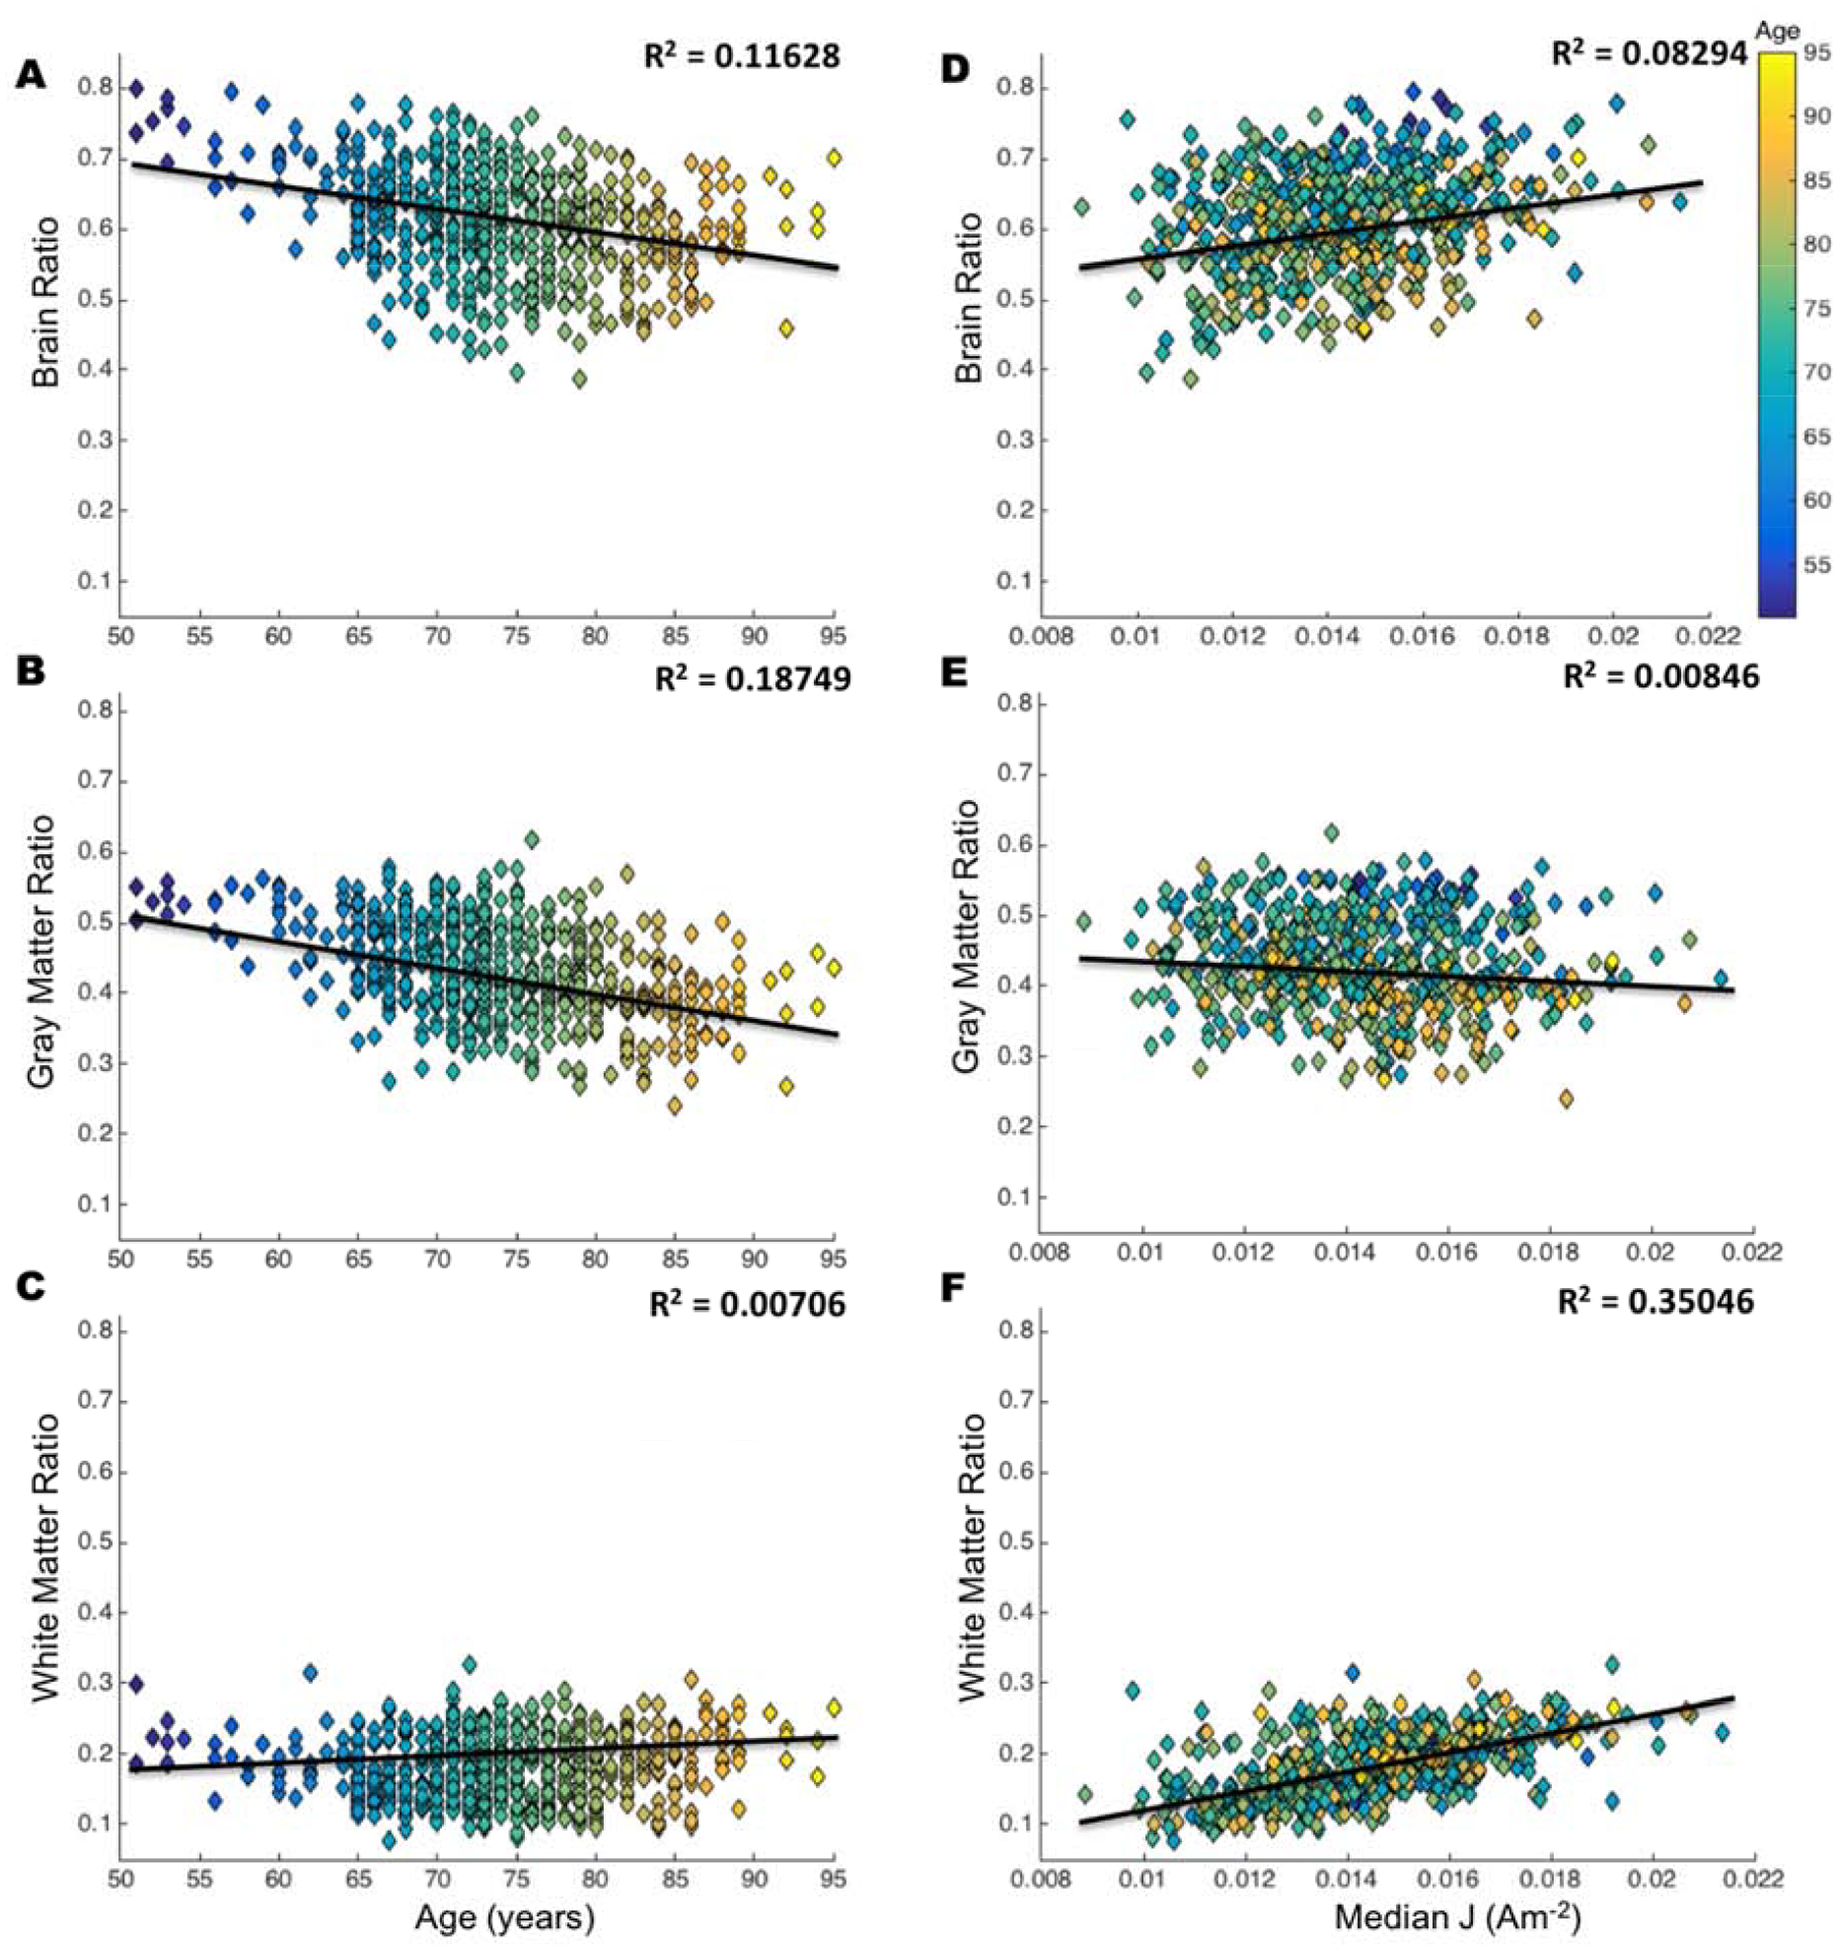
Relationship of brain ratio with age and median current density (J). Each plot is color coded based on age from the youngest (blue) to oldest (yellow). Volume ratio is computed in equation (1), brain is a combination of white and gray matter. Correlation values (R2) indicate the relationship between A) brain ratio and age, B) gray matter ratio and age, C) white matter and age, D) brain ratio and median J, E) gray matter ratio and median J, and F) white matter and median J. Smaller values of volume ratio indicate an increase in atrophy.
Field Measure Heatmaps
Heatmaps of the average J and |EF| values in the brain for each age bin (Figure 5, 6) demonstrate a qualitative observation of changes in field measures across age. Each row of heatmaps in Figure 5 and 6 represents each age group with 5 years span. Overall distribution of J values in the brain (Figure 5) showed a decreasing trend in the inferior frontal, precentral and postcentral gyrus from the youngest (51 years) to the oldest (95 years) cohort. Montage C3-Fp2 in Figure 5 shows decreasing J values in the basal nuclei, particularly the caudate, putamen and pallidum. J distribution in Figure 5 also showed an “enlargement” of the lateral ventricle region from younger to older age, indicating an increase in brain atrophy. Overall |EF| distribution on the cortical surface (Figure 6) indicated larger |EF| values in the frontal lobe, the precentral and postcentral gyrus for the younger cohort in both montages. Figure 6 also demonstrates the strongest |EF| values are located in between the anode and cathode electrodes, rather than directly underneath them.
Figure 5.
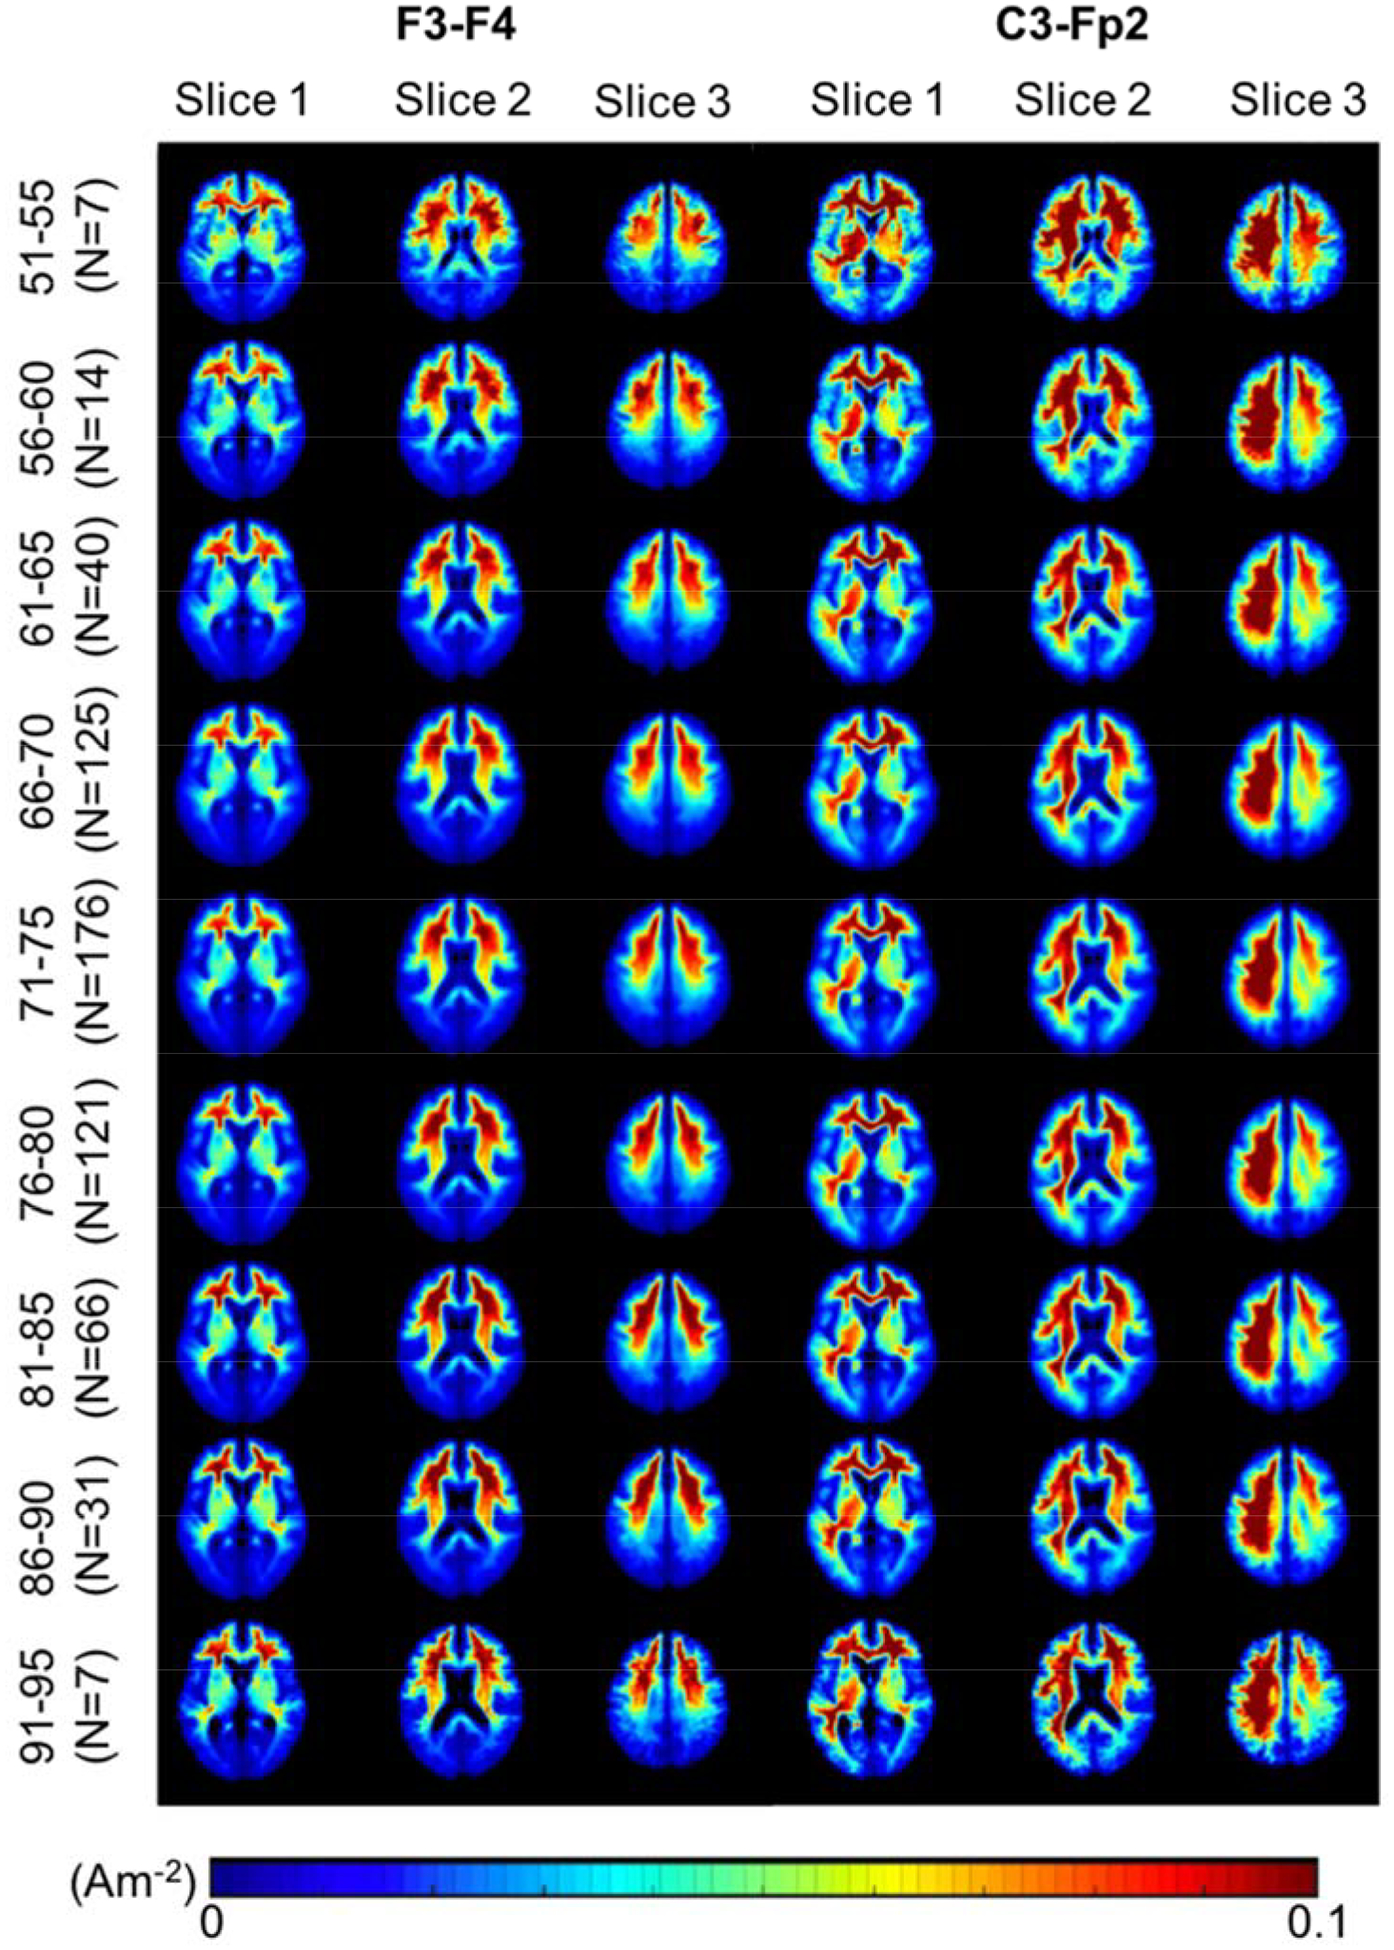
Current density (J) heatmaps in F3-F4 and C3-Fp2 montage. Heatmaps of current density distribution in the brain region (white and gray matter) shown in a typical scale reported in the literature. Qualitatively, a decreasing trend of J values is seen from the youngest (51–55) to oldest (91–95) cohort, particularly in the inferior frontal, precentral and postcentral gyrus. Montage C3-Fp2 also shows decreasing J values in the caudate, putamen and pallidum regions.
Figure 6.
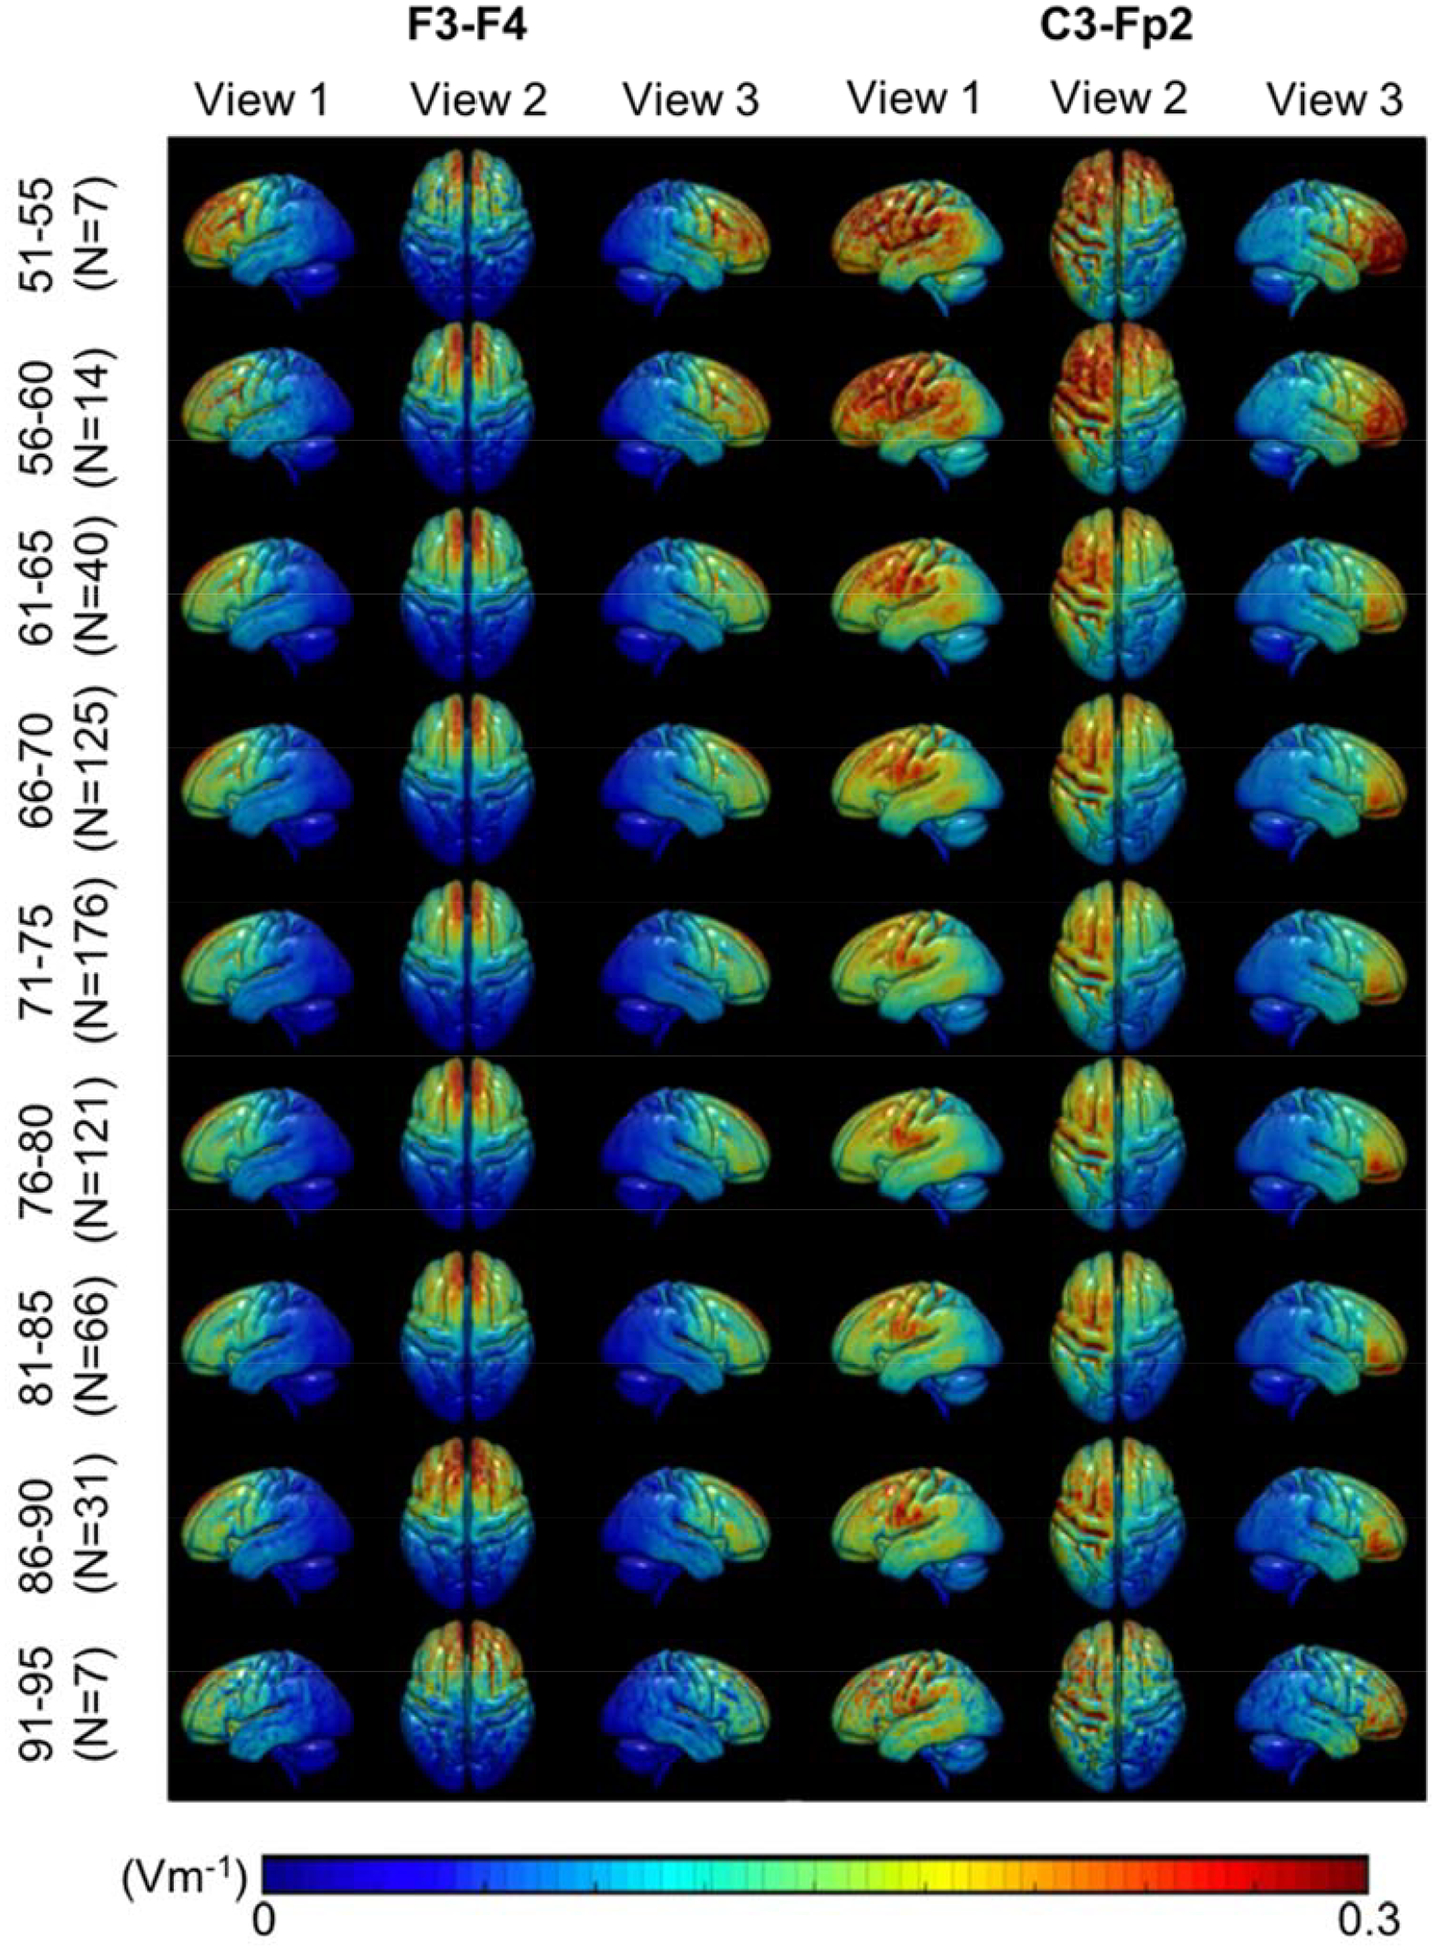
Electric field strength (|EF|) heatmaps in F3-F4 and C3-Fp2 montage. Heatmaps of electric field strengths in the brain region (white and gray matter) shown in a typical scale reported in the literature. A decreasing trend in |EF| values, particularly in the brain region underneath the electrodes (the frontal lobe, the precentral and postcentral gyrus), is seen from the youngest (51–55) to oldest (91–95) cohort.
Current Dose Variability
Figure 7 shows the continuous relationship between age and current density with color distribution represents brain ratio computed in equation 1. The average median Js were 0.0142A/m2 and 0.0170A/m2 for F3-F4, and 0.0211A/m2 and 0.0239A/m2 for C3-Fp2 montage in older and young adult cohort, respectively. No correlation was found between age and median J computed in the whole brain (Figure 7A) for both montages. Figure 7B shows the percent difference in median J of old versus young, as well as the required current dose in the older adult cohort. Overall, the majority of the older adult cohort requires applied current larger than 2mA to achieve the same current level as those found in the young adult brains.
Figure 7.
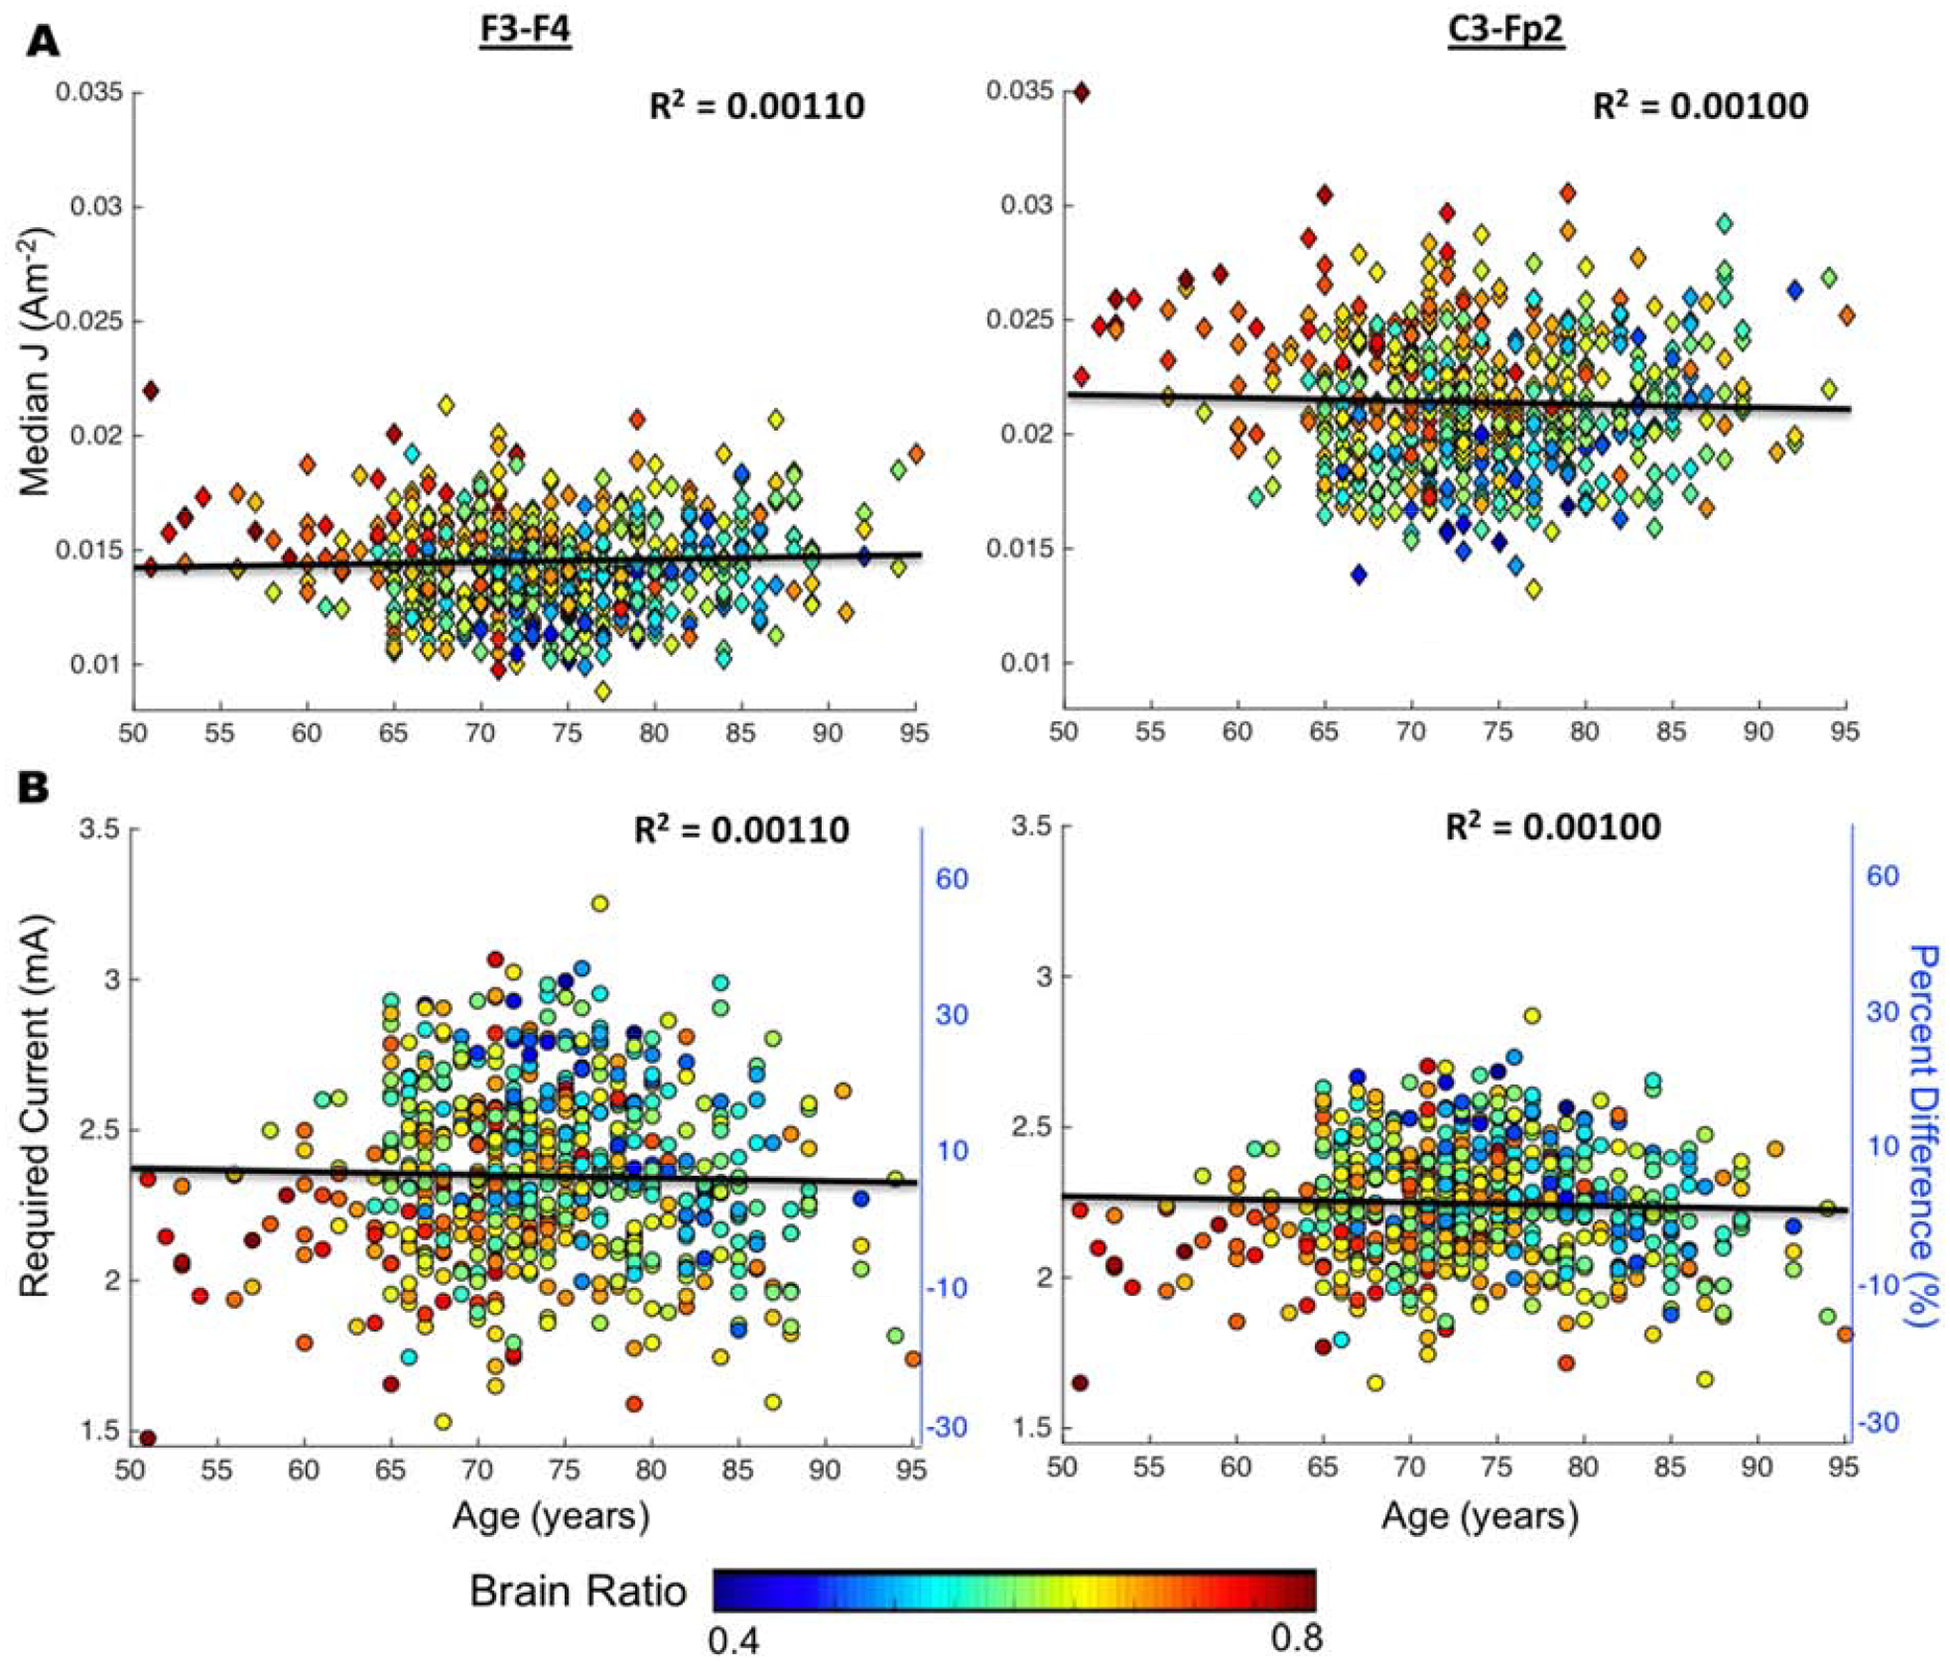
Scatter plots of age versus current density (J) for F3-F4 and C3-Fp2 montage. Showing from top to bottom is scatter plots to show the relationship between A) age and median J (Am−2) as well as B) age and required current (mA) with respect to young adult cohort. Percent difference was computed between older adults and the averaged young adult median J values. Color distribution demonstrates brain ratio computed as where Brain is the volume of white and gray matter (equation 1).
Voxel-wise Analyses of Transformed Field Measure and Age
Significant clusters from the voxel-wise analyses for J are reported in Table 4–7 and their locations are illustrated across the axial slices in Figure 8. Locations of clusters in Table 4–7 and analyses for |EF| are reported in Appendix B. For both electrode montages, significant (FDR p < 0.05) clusters were observed for the negative relationship between age and J while controlling for scanner. A single cluster was observed for the positive relationship between J and age. Figure 9 shows five representative clusters selected from Table 4–7 with positive and negative correlation between field measures and age.
Table 4.
F3-F4 montage: J × Age positive relationship clusters
| Peak T | Cluster Size (voxels) | Cluster FDR | Coordinates (peak) |
|---|---|---|---|
| 5.69 | 41 | 0.037 | 51,86,75 |
Table 7.
C3-Fp2 montage: J × Age negative relationship clusters
| Peak T | Cluster Size (voxels) | Cluster FDR | Coordinates (peak) |
|---|---|---|---|
| 7.99 | 4651 | 6.83E-55 | 66,112,60 |
| 7.26 | 191 | 1.40E-06 | 136,102,86 |
| 7.22 | 1100 | 7.19E-21 | 90,160,94 |
| 7.09 | 318 | 3.80E-09 | 116,114,58 |
| 7.06 | 678 | 3.36E-15 | 84,66,80 |
| 6.79 | 719 | 1.01E-15 | 124,74,74 |
| 6.66 | 133 | 3.32E-05 | 50,110,81 |
| 6.66 | 1567 | 2.23E-26 | 68,81,60 |
| 6.65 | 196 | 1.23E-06 | 76,90,74 |
| 6.41 | 52 | 0.007 | 142,99,68 |
| 6.03 | 34 | 0.025 | 106,92,74 |
| 5.89 | 50 | 0.007 | 48,135,60 |
| 5.78 | 43 | 0.012 | 88,72,26 |
| 5.76 | 33 | 0.025 | 117,81,63 |
| 5.66 | 39 | 0.016 | 92,78,93 |
| 5.65 | 84 | 0.001 | 106,54,60 |
| 5.64 | 94 | 3.58E-04 | 86,174,86 |
| 5.59 | 26 | 0.048 | 81,87,36 |
Figure 8.
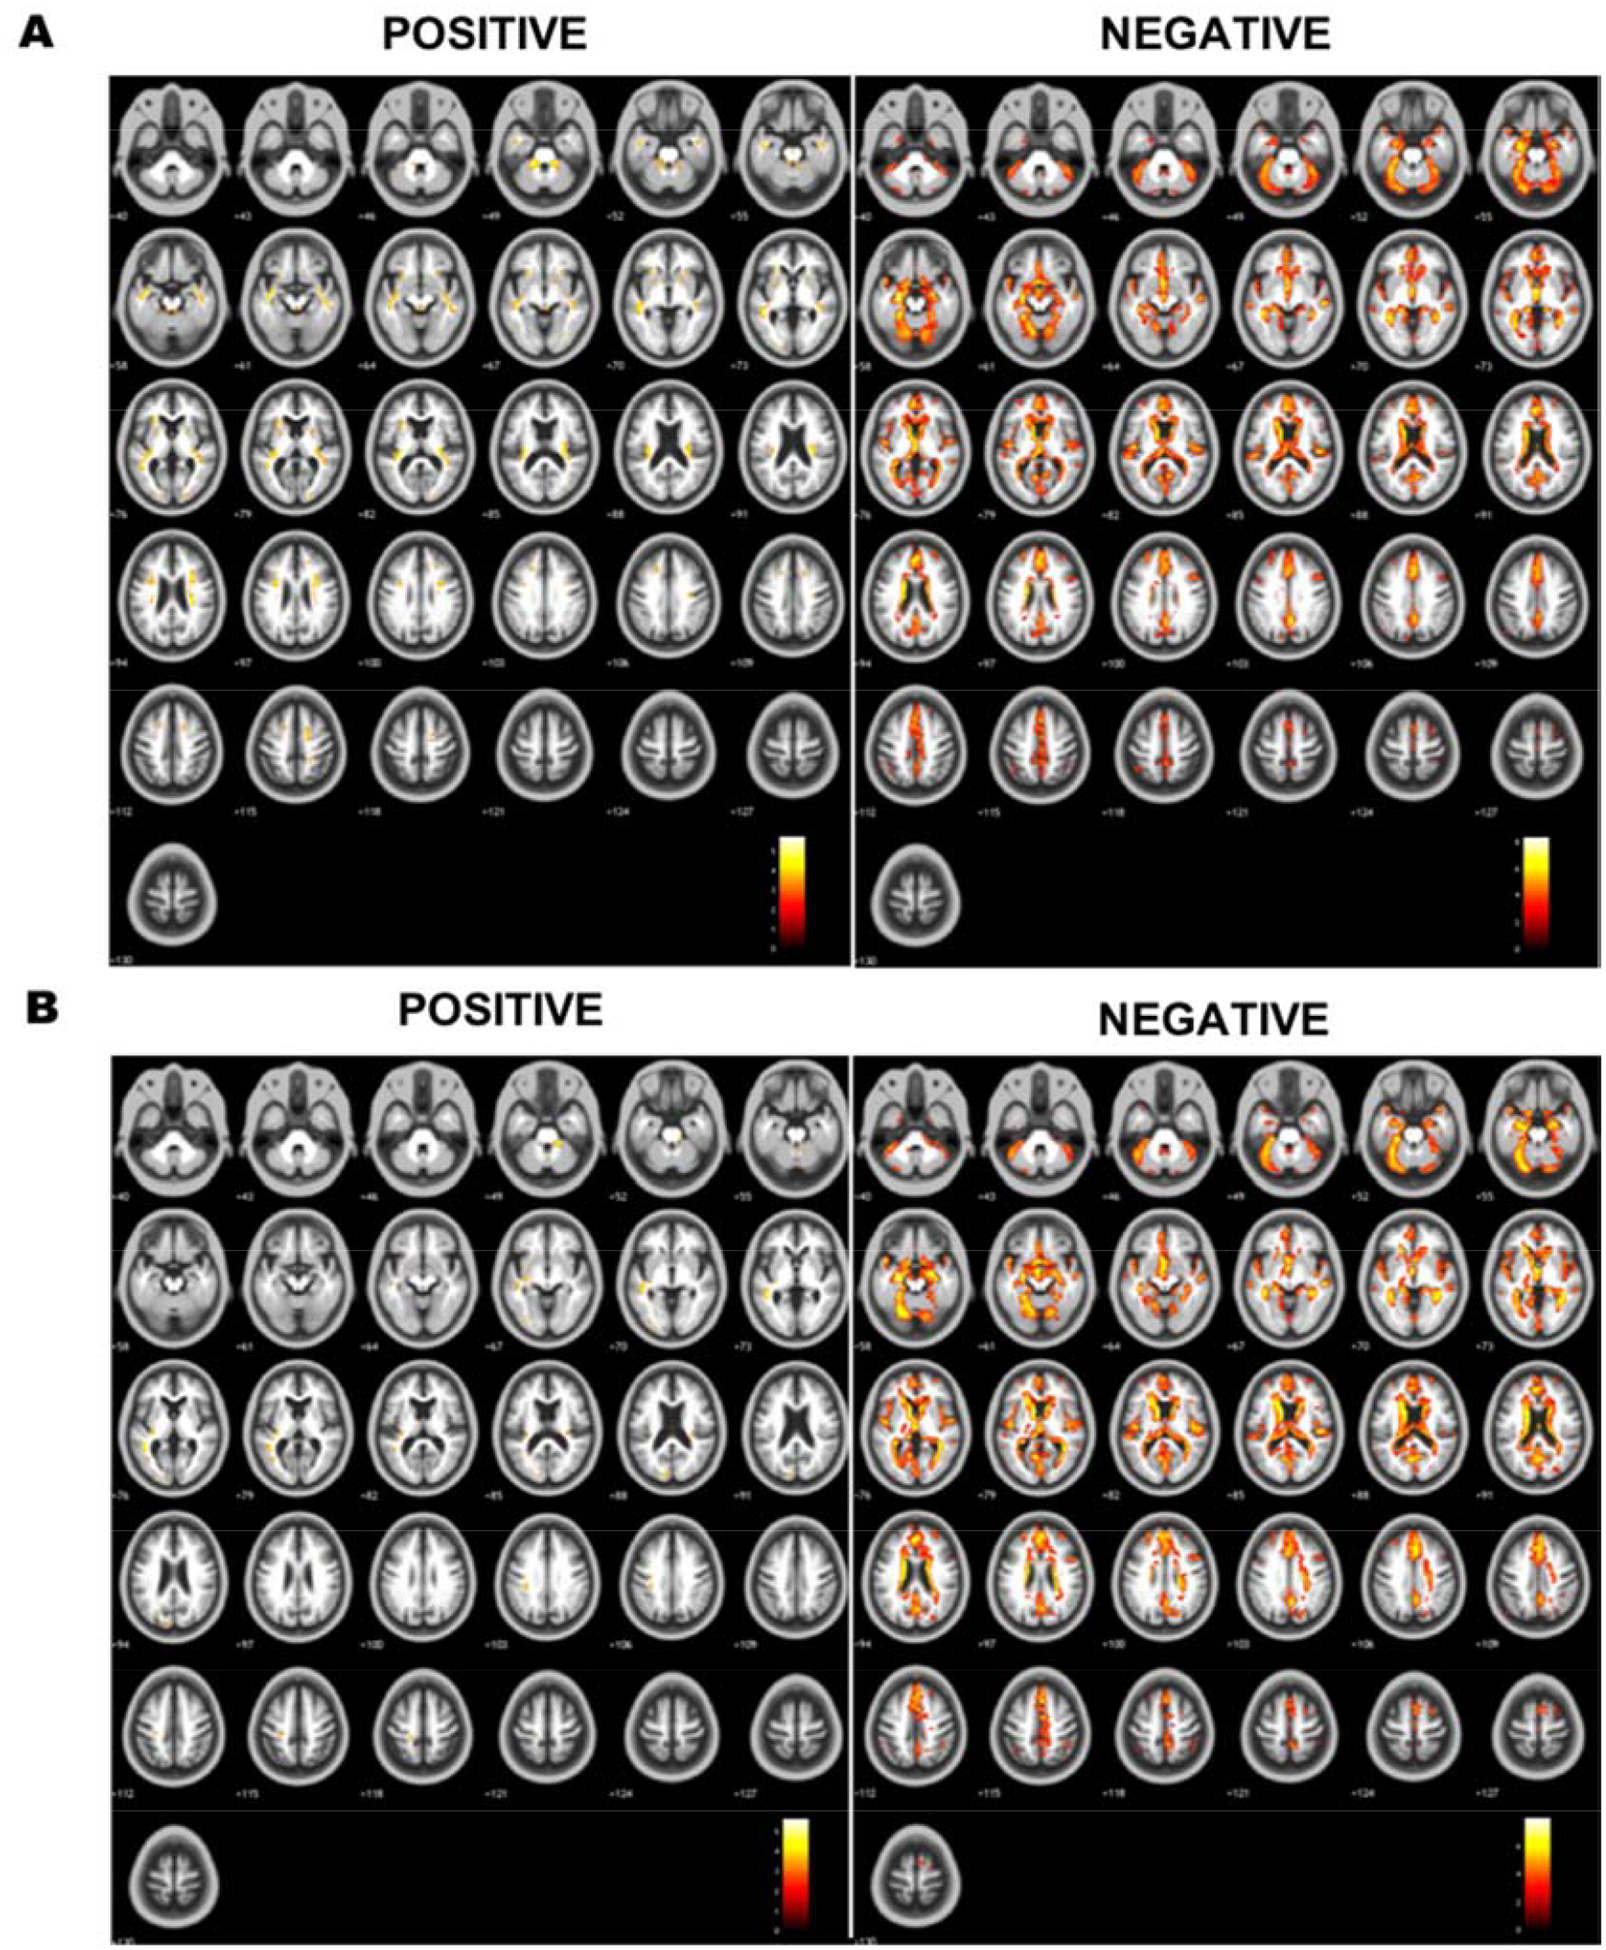
Axial montages showing specific regions with significant positive and negative correlation between median current density (J) and age. Axial montages showing cluster location within the brain (brighter colors indicate larger significant values) for significant positive and negative correlation between age and median J in A) F3-F4 and B) C3-Fp2 (M1-SO) montage.
Figure 9.
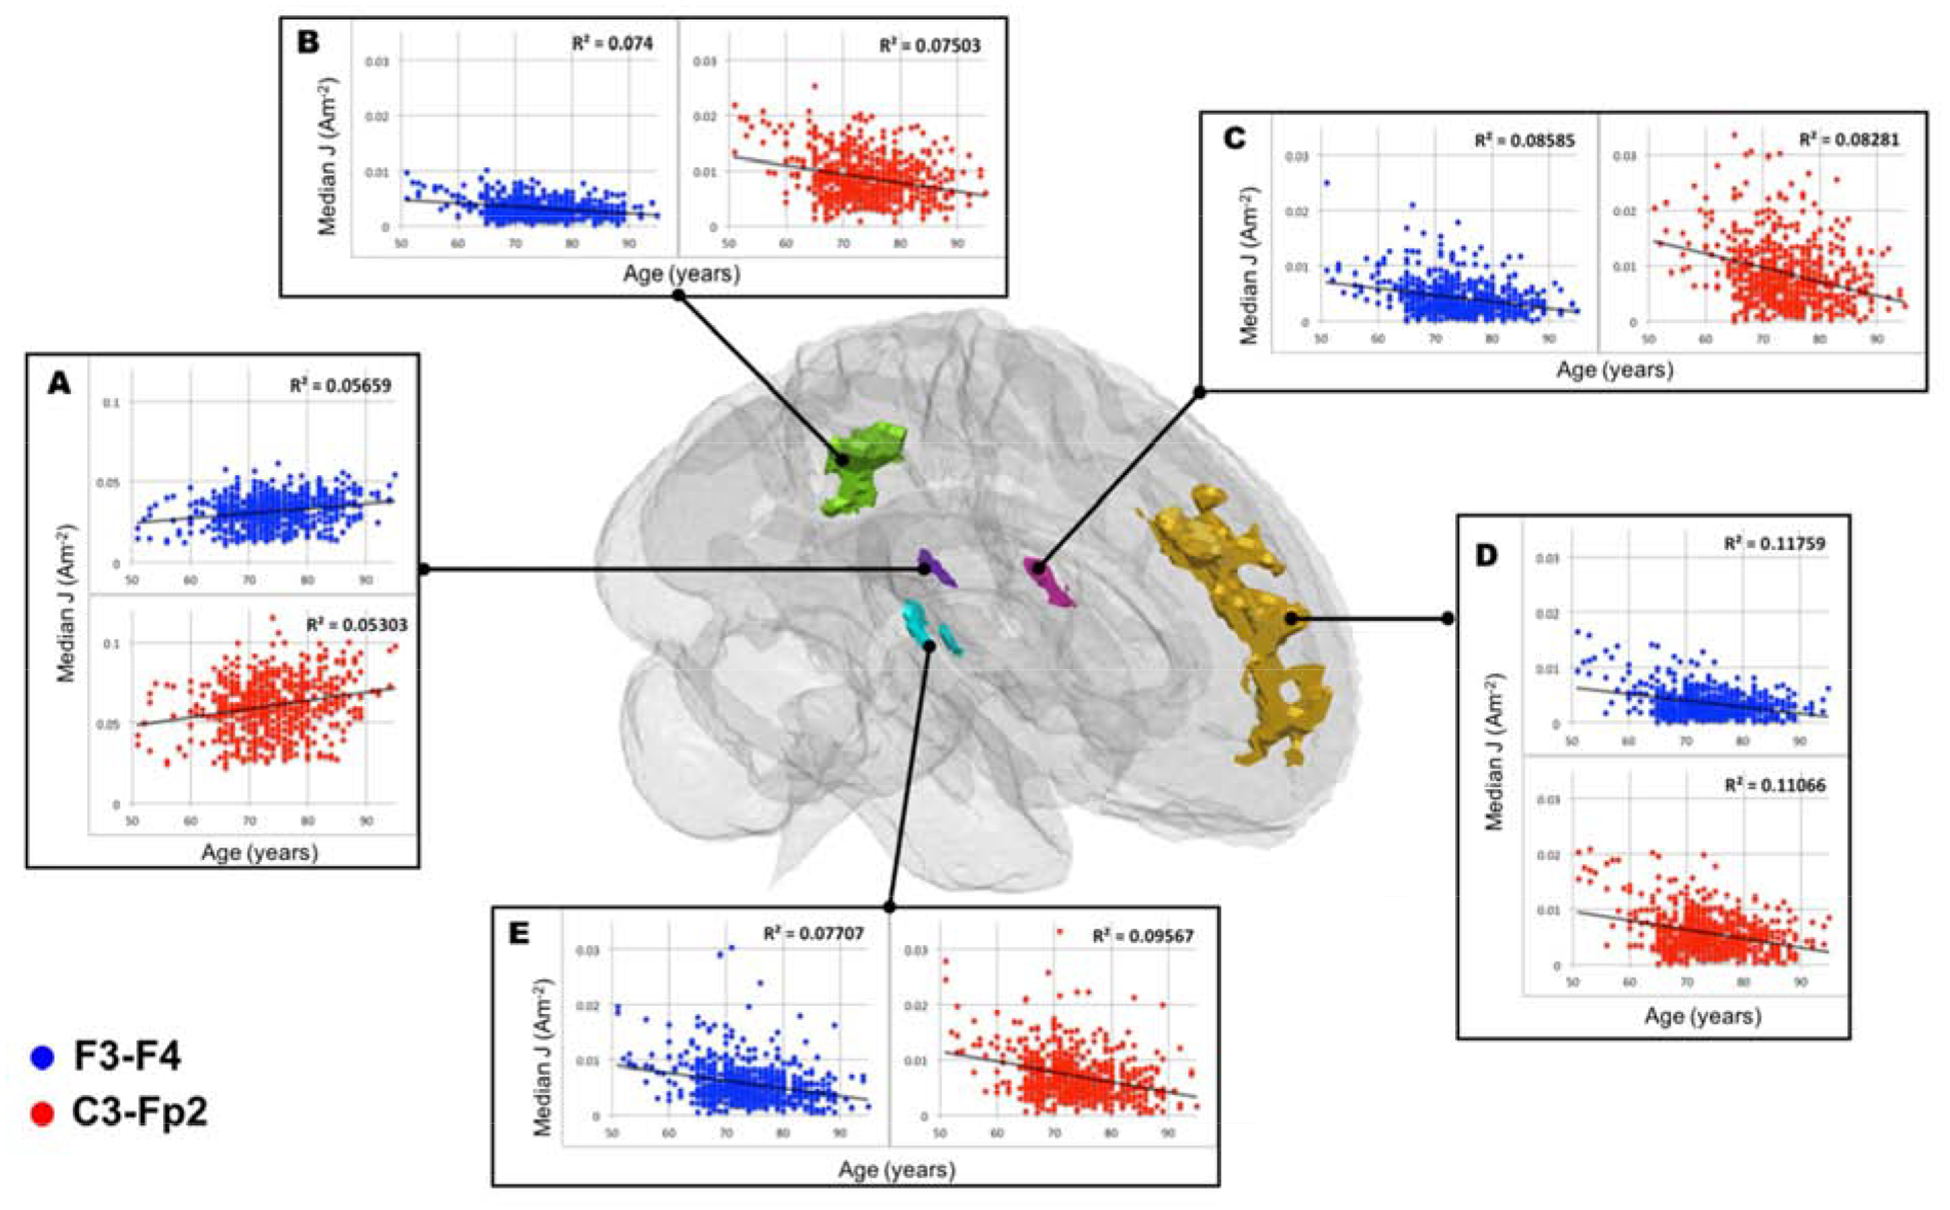
Cluster specific scatter plots to illustrate current density (J) and age relationship. Blue and red markers are corresponded to F3-F4 and C3-Fp2 montage, respectively. Five selected clusters reported as significant at [x,y,z] location of A) [51, 86, 75] in Table 4, and B) [93, 72, 102] C) [50, 108, 82] D) [92, 162, 94] E) [136, 102, 86] in Table 5 were plotted as a representative of positive and negative correlation between median J and age.
Mediation Analysis
GM, WM, and CSF volume ratio were independently assessed as mediators on the relationship between age and J in five representative clusters (Appendix E). The direct and indirect effects of GM, WM and CSF ratio on age and J relationship were significant in the four negative clusters (Cluster B-E in Figure 9), indicating partial mediation effects of brain ratio on age and J. In the positive cluster (Cluster A in Figure 9), gray and white matter ratio also partially mediated the relationship between age and J with no significant mediation effect of CSF volume in the positive cluster.
DISCUSSION
To our knowledge, this is the largest study to investigate individualized tES head models in healthy older adults and determine the relationship between age related effects and produced tES field distribution. Overall, model results show variation in the amount of current reaching the brain tissue depending on brain ratio, and comparisons to a younger adult cohort provide insight for current dose determination in healthy older adults.
Model Validity
The use of a custom older adult template (UFAB-587) and restricting field measures to only brain tissues improved the accuracy of tES current prediction in an older adult population. The UFAB-587 produces a better representation of older adult brain morphology (such as enlarged lateral ventricles and larger gaps between gyri curvature) than the ICBM-152 template sourced from young adults and, in turn, produced a more accurate correlation of field measures versus age. Voxel-wise analysis performed using the ICBM-152 template without restricting current values in the brain only yielded an opposite trend (Appendix C), with an increase in current strength with age. The opposing trend was likely caused by incorrect tissue assignments (CSF erroneously included in regions that appear as brain in young adults), underlining the importance in excluding field measures outside of gray and white matter prior to group analyses. This partial volume and boundary tissue effect is further exacerbated when considering that CSF conductivity is high in comparison to gray/white matter conductivity (see Table 3). Therefore, CSF contamination artificially inflated field measures in presumed gray/white matter structures and CSF regions were excluded in group-level analysis post-registration to the UFAB-587 template. We also performed another voxel-wise analysis using a more restricted analysis mask based on the UFAB-587 template (Appendix D) to further eliminate possible CSF contamination. Further, since the rate of brain atrophy might vary across gender [39], we performed voxel-wise analysis by adding gender as a predictor (Appendix B). We found the location of significant clusters remain within the same regions as the default mask when applying a more restricted mask and including gender as a predictor, and thus deeming the voxel-wise analyses results reported in Figure 8–9 and Table 4–7 as valid.
Model implication on tES application in older adults
Field measure and age
Correlations between age and field measure exist locally in brain sub-regions rather than globally. We found no correlation between age and median current density computed in the whole brain (Figure 7A). However, voxel-wise analyses (Figure 8) produced positive or negative correlation between age and median J in specific brain sub-regions. This finding implies that significant changes of current dose in the brain does not happen globally, but rather in more localized regions within the brain. For example, qualitative analyses from heatmaps showed that J decreased in the temporal/insula boundary and the precuneus region from the youngest to oldest group. This decrease was confirmed in voxel-wise analyses showing a significant negative relationship (FDR p<0.05) between age and J in Cluster B(R2F3-F4=0.074, R2C3-Fp2=0.075), C(R2F3-F4=0.086, R2C3-Fp2=0.083) and E(R2F3-F4=0.077, R2C3-Fp2=0.096). Therefore, a sub-region analysis may be required to assess the subtle changes of varying current dose in the aging brain.
Voxel-wise analyses indicated that the sub-brain regions with significant negative correlation of field measures and age might reflect the location of brain atrophy. Figure 6 shows a decrease in field strength in the frontal lobe for both electrode placements. This observation was further supported by voxel-wise analysis as reported in Figure 8 that illustrates the location of clusters with significant relationship between age and median J. The location of significant clusters might be indicative of the brain regions that experience the most atrophy across age. For example, Cluster D with the largest effect size (R2F3-F4=0.118, R2C3-Fp2=0.111) located in the frontal region (Figure 9), which has been reported as the most prone region to decline with normal aging [21,40,41]. Further, the positive relationship with brain ratio and current density (Figure 4) implied that there was less current reaching the brain tissues with more atrophy. This observation agrees with previous modeling studies that were performed using various conductivity values assigned to WM and GM, and concluded the critical role of CSF volume in current delivery to the aging brain due to atrophy [20–22]. Brain tissue loss due to atrophy is replaced by CSF, causing an increase of CSF content within the brain cavity. CSF is a better conductor than brain tissue and thus the electrical current reaching the brain cavity is “shunted” around the CSF, causing less current to enter the brain.
Field measure and electrode montage
Adjusting current dose in the aging brain might be necessary to ensure sufficient amount of current reaching target brain regions. The dorsolateral prefrontal cortex (DLPFC) and the precentral gyrus are commonly presumed target ROIs for stimulation using F3-F4 and M1-SO (C3-Fp2) montage, respectively [1]. We found a non-significant relationship between age and median J (Appendix F) when using predetermined ROIs restricted to the prefrontal cortex and precentral gyrus, probably because the presumed target ROIs were too broad and brain atrophy occurs non-uniformly within these ROIs. Our voxel-wise analyses were able to identify location where age had the most effect e.g., brain atrophy on Js in both montages (Appendix B). For instance, we found a significant negative relationship (FDR p<0.05) in Cluster D (R2F3-F4=0.118, R2C3-Fp2=0.111 that is partially within the superior frontal gyrus, which encompasses DLPFC, a target brain region for F3-F4 montage. Furthermore, Cluster E (R2F3-F4=0.077, R2C3-Fp2=0.096) is located in the precentral/postcentral gyrus boundary where the motor strip lies and thus a typical target ROI for M1-SO (C3-Fp2) montage. These findings demonstrated that brain atrophy location may have significant effects on the current distribution within target brain regions for F3-F4 and M1-SO and thus a consideration to adjust current dose in tES may be warranted.
Brain atrophy, age and field measures
Mediation analysis revealed that the negative relationship observed between age and field measure in five clusters were partially mediated by brain ratio. For a mediation analysis to be valid, a correlation of brain ratio versus age, brain ratio versus J, and age versus J need to exist. Brain ratio showed a declining trend with increasing age (R2=0.1162, p=1.17e-17) indicating that brain atrophy increased with normal aging (Figure 4A) and was primarily driven by GM volume loss (Figure 4B, C), which agrees with observations reported in the literature [42–44]. Since the interaction between age, brain ratio and current density might be difficult to disentangle, we performed a mediation analysis by testing GM, WM, and CSF volume ratio separately as mediator variables. The partial mediation effect of brain ratio on age versus J implies that the negative correlation of age and J is partially contributed by brain ratio. There were potentially other brain atrophy attributes that were not being measured by our brain ratio calculation, such as the curvature of the gyri or cortical thickness, that could contribute to the observed relationship of age and field measures.
Current Dosage Determination
Our results implicate that older adults with more brain atrophy required higher current dose than 2mA to achieve the same current level equivalent to 2mA stimulation in young adults. Results in Figure 7B demonstrates the required current input ranging from 1.47–3.25mA for F3-F4 and 1.65–2.87mA for C3-Fp2. The larger range of current dose needed for F3-F4 in Figure 7B implies that the frontal region (target region for F3-F4) is more prone to decline compared to the motor strip (target region for C3-Fp2), which agrees with the literature [41]. The color distribution in Figure 7B also illustrates that individuals with more atrophy (smaller bran ratio) are likely to require more current compared to those with less atrophy (larger brain ratio). Therefore, the practical application of tES may need to consider the degree of brain tissue loss (atrophy) instead of the numerical age when considering the appropriate current dose in healthy older adults.
Model limitation and future direction
Models presented in this study can be improved to increase accuracy prediction and investigate other potential age-related factors that can affect current distribution. Head volume can be segmented into more tissue types and include anisotropic conductivity [14]. Osteoporosis associated with aging [45] can be modeled by separating bone tissue into cancellous and cortical bone, and assigned them with different conductivity values. White matter integrity can also deteriorate with aging, and can be incorporated into the models by using information gathered from diffusion weighted imaging [46].
CONCLUSION
We present the largest tES modeling study in a healthy older adult population. Brain ratio, which is a measure of brain atrophy, plays a larger role than numerical age in determining appropriate current dosage in an older adult cohort. Therefore, adjusting current dose for tES application in older adults depending on their degree of brain atrophy may be necessary to achieve a stimulation level equivalent to a younger adult cohort. This study underlines the importance of performing individualized modeling. Future studies can pair modeling results with behavioral outcomes, and aid the transition towards personalized medicine by tailoring current dose to each individual’s anatomy.
Supplementary Material
Table 5.
F3-F4 montage: J × Age negative relationship clusters
| Peak T | Cluster Size (voxels) | Cluster FDR | Coordinates (peak) |
|---|---|---|---|
| 8.31 | 2860 | 1.32E-39 | 68,112,60 |
| 7.34 | 1371 | 3.36E-24 | 92,162,94 |
| 6.92 | 93 | 0.0002 | 142,99,69 |
| 6.78 | 99 | 0.0002 | 84,64,80 |
| 6.77 | 80 | 0.001 | 136,102,86 |
| 6.66 | 308 | 4.30E-09 | 93,72,102 |
| 6.65 | 688 | 3.15E-15 | 70,87,58 |
| 6.61 | 92 | 0.0002 | 50,108,82 |
| 6.57 | 515 | 1.34E-12 | 58,90,66 |
| 6.52 | 110 | 9.03E-05 | 117,116,57 |
| 6.3 | 373 | 2.83E-10 | 108,116,96 |
| 6.27 | 146 | 1.19E-05 | 104,66,87 |
| 6.24 | 437 | 2.34E-11 | 68,52,56 |
| 6.24 | 279 | 1.45E-08 | 124,74,74 |
| 6.13 | 52 | 0.004 | 40,94,84 |
| 6.09 | 150 | 1.05E-05 | 124,76,52 |
| 6.04 | 30 | 0.026 | 105,92,74 |
| 5.8 | 115 | 7.15E-05 | 108,60,60 |
| 5.44 | 77 | 0.001 | 116,90,56 |
| 5.41 | 68 | 0.001 | 92,148,63 |
| 5.3 | 27 | 0.033 | 92,52,81 |
Table 6.
C3-Fp2 montage: J × Age positive relationship clusters
| Peak T | Cluster Size (voxels) | Cluster FDR | Coordinates (peak) |
|---|---|---|---|
| 5.64 | 36 | 0.007 | 51,82,76 |
The majority of older adults have less current in their brains than young adults
Brain tissue loss in healthy older adults can affect tES current dose
Individuals with a larger degree of brain atrophy have less current in their brains
Our results may inform future tES current dose determination in older adults
ACKNOWLEDGEMENTS
This work was supported in part by the National Institute of Aging/National Institutes of Health (K01AG050707, R01AG054077) and the Evelyn F. and William L. McKnight Brain Institute. Data collection and sharing for part of this project was funded by the Alzheimer’s Disease Neuroimaging Initiative (ADNI) (National Institutes of Health Grant U01 AG024904) and DOD ADNI (Department of Defense award number W81XWH-12-2-0012). ADNI is funded by the National Institute on Aging, the National Institute of Biomedical Imaging and Bioengineering, and through generous contributions from the following: AbbVie, Alzheimer’s Association; Alzheimer’s Drug Discovery Foundation; Araclon Biotech; BioClinica, Inc.; Biogen; Bristol-Myers Squibb Company; CereSpir, Inc.; Cogstate; Eisai Inc.; Elan Pharmaceuticals, Inc.; Eli Lilly and Company; EuroImmun; F. Hoffmann-La Roche Ltd and its affiliated company Genentech, Inc.; Fujirebio; GE Healthcare; IXICO Ltd.; Janssen Alzheimer Immunotherapy Research & Development, LLC.; Johnson & Johnson Pharmaceutical Research & Development LLC.; Lumosity; Lundbeck; Merck & Co., Inc.; Meso Scale Diagnostics, LLC.; NeuroRx Research; Neurotrack Technologies; Novartis Pharmaceuticals Corporation; Pfizer Inc.; Piramal Imaging; Servier; Takeda Pharmaceutical Company; and Transition Therapeutics. The Canadian Institutes of Health Research is providing funds to support ADNI clinical sites in Canada. Private sector contributions are facilitated by the Foundation for the National Institutes of Health (www.fnih.org). The grantee organization is the Northern California Institute for Research and Education, and the study is coordinated by the Alzheimer’s Therapeutic Research Institute at the University of Southern California. ADNI data are disseminated by the Laboratory for Neuro Imaging at the University of Southern California. Data for the young adult cohort were provided [in part] by the Human Connectome Project, WU-Minn Consortium (Principal Investigators: David Van Essen and Kamil Ugurbil; 1U54MH091657) funded by the 16 NIH Institutes and Centers that support the NIH Blueprint for Neuroscience Research; and by the McDonnell Center for Systems Neuroscience at Washington University
Footnotes
Publisher's Disclaimer: This is a PDF file of an unedited manuscript that has been accepted for publication. As a service to our customers we are providing this early version of the manuscript. The manuscript will undergo copyediting, typesetting, and review of the resulting proof before it is published in its final form. Please note that during the production process errors may be discovered which could affect the content, and all legal disclaimers that apply to the journal pertain.
AUTHOR DECLARATION
The authors report no conflicts of interest.
REFERENCES
- [1].Gomes-Osman J, Indahlastari A, Fried PJ, Cabral DLF, Rice J, Nissim NR, et al. Non-invasive Brain Stimulation: Probing Intracortical Circuits and Improving Cognition in the Aging Brain. Front Aging Neurosci 2018;10:177. doi: 10.3389/fnagi.2018.00177. [DOI] [PMC free article] [PubMed] [Google Scholar]
- [2].Tatti E, Rossi S, Innocenti I, Rossi A, Santarnecchi E. Non-invasive brain stimulation of the aging brain: State of the art and future perspectives. Ageing Res Rev 2016. doi: 10.1016/j.arr.2016.05.006. [DOI] [PubMed] [Google Scholar]
- [3].Zimerman M, Hummel FC. Non-invasive brain stimulation: Enhancing motor and cognitive functions in healthy old subjects. Front Aging Neurosci 2010. doi: 10.3389/fnagi.2010.00149. [DOI] [PMC free article] [PubMed] [Google Scholar]
- [4].Deldar Z, Rustamov N, Blanchette I, Piché M. Improving working memory and pain inhibition in older persons using transcranial direct current stimulation. Neurosci Res 2019. doi: 10.1016/j.neures.2018.12.007. [DOI] [PubMed] [Google Scholar]
- [5].Nissim NR, O’Shea A, Indahlastari A, Telles R, Richards L, Porges E, et al. Effects of in-Scanner Bilateral Frontal tDCS on Functional Connectivity of the Working Memory Network in Older Adults. Front Aging Neurosci 2019. doi: 10.3389/fnagi.2019.00051. [DOI] [PMC free article] [PubMed] [Google Scholar]
- [6].Gupta T, Kelley NJ, Pelletier-Baldelli A, Mittal VA. Transcranial Direct Current Stimulation, Symptomatology, and Cognition in Psychosis: A Qualitative Review. Front Behav Neurosci 2018. doi: 10.3389/fnbeh.2018.00094. [DOI] [PMC free article] [PubMed] [Google Scholar]
- [7].Summers JJ, Kang N, Cauraugh JH. Does transcranial direct current stimulation enhance cognitive and motor functions in the ageing brain? A systematic review and meta- analysis. Ageing Res Rev 2016. doi: 10.1016/j.arr.2015.11.004. [DOI] [PubMed] [Google Scholar]
- [8].Perceval G, Flöel A, Meinzer M. Can transcranial direct current stimulation counteract age-associated functional impairment? Neurosci Biobehav Rev 2016. doi: 10.1016/j.neubiorev.2016.03.028. [DOI] [PubMed] [Google Scholar]
- [9].Indahlastari A, Kasinadhuni AK, Saar C, Castellano K, Mousa B, Chauhan M, et al. Methods to Compare Predicted and Observed Phosphene Experience in tACS Subjects. Neural Plast 2018;2018:1–10. doi: 10.1155/2018/8525706. [DOI] [PMC free article] [PubMed] [Google Scholar]
- [10].Sadleir RJ, Vannorsdall TD, Schretlen DJ, Gordon B. Transcranial direct current stimulation (tDCS) in a realistic head model. Neuroimage 2010;51:1310–8. doi: 10.1016/j.neuroimage.2010.03.052. [DOI] [PubMed] [Google Scholar]
- [11].Drumond Marra HL, Myczkowski ML, Maia Memória C, Arnaut D, et al. Transcranial Magnetic Stimulation to Address Mild Cognitive Impairment in the Elderly: A Randomized Controlled Study, Transcranial Magnetic Stimulation to Address Mild Cognitive Impairment in the Elderly: A Randomized Controlled Study. Behav Neurol Behav Neurol 2015;2015, 2015:e287843. doi: 10.1155/2015/287843, 10.1155/2015/287843. [DOI] [PMC free article] [PubMed] [Google Scholar]
- [12].Salvador R, Truong DQ, Bikson M, Opitz A, Dmochowski J, Miranda PC. Role of Computational Modeling for Dose Determination. Pract. Guid. to Transcranial Direct Curr. Stimul, 2019. doi: 10.1007/978-3-319-95948-1_9. [DOI] [Google Scholar]
- [13].Indahlastari A, Chauhan M, Sadleir RJ. Benchmarking transcranial electrical stimulation finite element models: A comparison study. J Neural Eng 2019. doi: 10.1088/1741-2552/aafbbd. [DOI] [PMC free article] [PubMed] [Google Scholar]
- [14].Indahlastari A, Chauhan M, Schwartz B, Sadleir RJ. Changing head model extent affects finite element predictions of transcranial direct current stimulation distributions. J Neural Eng 2016;13. doi: 10.1088/1741-2560/13/6/066006. [DOI] [PMC free article] [PubMed] [Google Scholar]
- [15].Datta A, Bansal V, Diaz J, Patel J, Reato D, Bikson M. Gyri-precise head model of transcranial direct current stimulation: Improved spatial focality using a ring electrode versus conventional rectangular pad. Brain Stimul 2009;2. doi: 10.1016/j.brs.2009.03.005. [DOI] [PMC free article] [PubMed] [Google Scholar]
- [16].Kasinadhuni AK, Indahlastari A, Chauhan M, Schär M, Mareci TH, Sadleir RJ. Imaging of current flow in the human head during transcranial electrical therapy. Brain Stimul 2017;10:764–72. doi: 10.1016/j.brs.2017.04.125. [DOI] [PMC free article] [PubMed] [Google Scholar]
- [17].Chauhan M, Indahlastari A, Kasinadhuni AK, Schar M, Mareci TH, Sadleir RJ. Low-Frequency Conductivity Tensor Imaging of the Human Head In Vivo Using DT-MREIT: First Study. IEEE Trans Med Imaging 2018. doi: 10.1109/TMI.2017.2783348. [DOI] [PMC free article] [PubMed] [Google Scholar]
- [18].Opitz A, Falchier A, Yan C-G, Yeagle EM, Linn GS, Megevand P, et al. Spatiotemporal structure of intracranial electric fields induced by transcranial electric stimulation in humans and nonhuman primates. Sci Rep 2016;6:31236. doi: 10.1038/srep31236. [DOI] [PMC free article] [PubMed] [Google Scholar]
- [19].Huang Y, Liu AA, Lafon B, Friedman D, Dayan M, Wang X, et al. Measurements and models of electric fields in the in vivo human brain during transcranial electric stimulation. Elife 2017;6. doi: 10.7554/eLife.18834. [DOI] [PMC free article] [PubMed] [Google Scholar]
- [20].Laakso I, Tanaka S, Koyama S, De Santis V, Hirata A. Inter-subject variability in electric fields of motor cortical tDCS. Brain Stimul 2015;8:906–13. doi: 10.1016/j.brs.2015.05.002. [DOI] [PubMed] [Google Scholar]
- [21].Mahdavi S, Towhidkhah F. Computational human head models of tDCS: Influence of brain atrophy on current density distribution. Brain Stimul 2018. doi: 10.1016/j.brs.2017.09.013. [DOI] [PubMed] [Google Scholar]
- [22].Thomas C, Datta A, Woods A. Effect of Aging on Cortical Current Flow Due to Transcranial Direct Current Stimulation: Considerations for Safety. Proc. Annu. Int. Conf. IEEE Eng. Med. Biol. Soc. EMBS, 2018. doi: 10.1109/EMBC.2018.8513014. [DOI] [PubMed] [Google Scholar]
- [23].Woo CW, Chang LJ, Lindquist MA, Wager TD. Building better biomarkers: Brain models in translational neuroimaging. Nat Neurosci 2017. doi: 10.1038/nn.4478. [DOI] [PMC free article] [PubMed] [Google Scholar]
- [24].Huang Y, Datta A, Bikson M, Parra LC. Realistic vOlumetric-Approach to Simulate Transcranial Electric Stimulation -- ROAST -- a fully automated open-source pipeline. J Neural Eng 2019. doi: 10.1088/1741-2552/ab208d. [DOI] [PMC free article] [PubMed] [Google Scholar]
- [25].Li X, Morgan PS, Ashburner J, Smith J, Rorden C. The first step for neuroimaging data analysis: DICOM to NIfTI conversion. J Neurosci Methods 2016. doi: 10.1016/j.jneumeth.2016.03.001. [DOI] [PubMed] [Google Scholar]
- [26].Fischl B. FreeSurfer. Neuroimage 2012;62:774–81. doi: 10.1016/j.neuroimage.2012.01.021. [DOI] [PMC free article] [PubMed] [Google Scholar]
- [27].Ashburner J, Friston KJ. Unified segmentation. Neuroimage 2005. doi: 10.1016/j.neuroimage.2005.02.018. [DOI] [PubMed] [Google Scholar]
- [28].Huang Y, Dmochowski JP, Su Y, Datta A, Rorden C, Parra LC. Automated MRI segmentation for individualized modeling of current flow in the human head. J Neural Eng 2013. doi: 10.1088/1741-2560/10/6/066004. [DOI] [PMC free article] [PubMed] [Google Scholar]
- [29].Sadleir RJ, Vannorsdall TD, Schretlen DJ, Gordon B. Target optimization in transcranial direct current stimulation. Front Psychiatry 2012. doi: 10.3389/fpsyt.2012.00090. [DOI] [PMC free article] [PubMed] [Google Scholar]
- [30].Ashburner J. A fast diffeomorphic image registration algorithm. Neuroimage 2007. doi: 10.1016/j.neuroimage.2007.07.007. [DOI] [PubMed] [Google Scholar]
- [31].Fonov V, Almli C, Evans A, Collins D, McKinstry R. Unbiased nonlinear average age-appropriate brain templates from birth to adulthood. Neuroimage 2009;47:S102. doi: 10.1016/s1053-8119(09)70884-5. [DOI] [Google Scholar]
- [32].Radman T, Ramos RL, Brumberg JC, Bikson M. Role of cortical cell type and morphology in subthreshold and suprathreshold uniform electric field stimulation in vitro. Brain Stimul 2009;2:215–228.e3. doi: 10.1016/j.brs.2009.03.007. [DOI] [PMC free article] [PubMed] [Google Scholar]
- [33].Jenkinson M, Beckmann CF, Behrens TEJ, Woolrich MW, Smith SM. FSL - Review. Neuroimage 2012. doi: 10.1016/j.neuroimage.2011.09.015. [DOI] [PubMed] [Google Scholar]
- [34].Van Essen DC, Smith SM, Barch DM, Behrens TEJ, Yacoub E, Ugurbil K. The WU-Minn Human Connectome Project: An overview. Neuroimage 2013. doi: 10.1016/j.neuroimage.2013.05.041. [DOI] [PMC free article] [PubMed] [Google Scholar]
- [35].Hayasaka S, Nichols TE. Validating cluster size inference: Random field and permutation methods. Neuroimage 2003. doi: 10.1016/j.neuroimage.2003.08.003. [DOI] [PubMed] [Google Scholar]
- [36].Kenny R, Baron D. The moderator mediator variable distinction in social psychological research: Conceptual strategic and statistical considerations. Ournal Personal Soc Psychol 2001. doi: 10.1007/BF02512353. [DOI] [PubMed] [Google Scholar]
- [37].Preacher KJ, Hayes AF. SPSS and SAS procedures for estimating indirect effects in simple mediation models. Behav Res Methods, Instruments, Comput 2004;36:717–31. doi: 10.3758/BF03206553. [DOI] [PubMed] [Google Scholar]
- [38].Preacher KJ, Rucker DD, Hayes AF. Addressing Moderated Mediation Hypotheses: Theory, Methods, and Prescriptions. Multivariate Behav Res 2007;42:185–227. doi: 10.1080/00273170701341316. [DOI] [PubMed] [Google Scholar]
- [39].Smith CD, Chebrolu H, Wekstein DR, Schmitt FA, Markesbery WR. Age and gender effects on human brain anatomy: A voxel-based morphometric study in healthy elderly. Neurobiol Aging 2007. doi: 10.1016/j.neurobiolaging.2006.05.018. [DOI] [PubMed] [Google Scholar]
- [40].Indahlastari A, Woods AJ. Brain Atrophy In: Gu D, Dupre ME, editors. Encycl. Gerontol. Popul. Aging, Cham: Springer International Publishing; 2019, p. 1–3. doi: 10.1007/978-3-319-69892-2_667-1. [DOI] [Google Scholar]
- [41].Fjell AM, Walhovd KB, Fennema-Notestine C, McEvoy LK, Hagler DJ, Holland D, et al. One-Year Brain Atrophy Evident in Healthy Aging. J Neurosci 2009;29:15223–31. doi: 10.1523/JNEUROSCI.3252-09.2009. [DOI] [PMC free article] [PubMed] [Google Scholar]
- [42].Lemaitre H, Goldman AL, Sambataro F, Verchinski BA, Meyer-Lindenberg A, Weinberger DR, et al. Normal age-related brain morphometric changes: Nonuniformity across cortical thickness, surface area and gray matter volume? Neurobiol Aging 2012;33. doi: 10.1016/j.neurobiolaging.2010.07.013. [DOI] [PMC free article] [PubMed] [Google Scholar]
- [43].Walhovd KB, Fjell AM, Reinvang I, Lundervold A, Dale AM, Eilertsen DE, et al. Effects of age on volumes of cortex, white matter and subcortical structures. Neurobiol Aging 2005;26:1261–70. doi: 10.1016/j.neurobiolaging.2005.05.020. [DOI] [PubMed] [Google Scholar]
- [44].Good CD, Johnsrude IS, Ashburner J, Henson RNA, Friston KJ, Frackowiak RSJ. A Voxel-Based Morphometric Study of Ageing in 465 Normal Adult Human Brains. Neuroimage 2001;14:21–36. doi: 10.1006/nimg.2001.0786. [DOI] [PubMed] [Google Scholar]
- [45].Pietschmann P, Rauner M, Sipos W, Kerschan-Schindl K. Osteoporosis: An age-related and gender-specific disease - A mini-review. Gerontology 2009. doi: 10.1159/000166209. [DOI] [PubMed] [Google Scholar]
- [46].Madden DJ, Bennett IJ, Burzynska A, Potter GG, Chen N kuei, Song AW. Diffusion tensor imaging of cerebral white matter integrity in cognitive aging. Biochim Biophys Acta - Mol Basis Dis 2012. doi: 10.1016/j.bbadis.2011.08.003. [DOI] [PMC free article] [PubMed] [Google Scholar]
Associated Data
This section collects any data citations, data availability statements, or supplementary materials included in this article.


