Abstract
To improve personalized diagnosis and prognosis for oral squamous cell carcinoma (OSCC) by identification of hub methylated‐CpG sites and associated genes, weighted gene comethylation network analysis (WGCNA) was performed to examine and identify hub modules and CpG sites correlated with OSCC. Here, WGCNA modeling yielded blue and brown comethylation modules that were significantly associated with OSCC status. Following screening of the differentially expressed genes (DEGs) from gene expression microarrays and differentially methylated‐CpG sites (DCGs), integrated multiomics analysis of the DEGs, DCGs, and hub CpG sites from the modules was performed to investigate their correlations. Expression levels of 16 CpG sites‐associated genes were negatively correlated with methylation patterns of promoter. Moreover, Kaplan‐Meier survival analysis of the hub CpG sites and associated genes was carried out using 2 public databases, MethSurv and GEPIA. Only 5 genes, ACTA1, ACTN2, OSR1, SYNGR1, and ZNF677, had significant overall survival using GEPIA. Hypermethylated‐CpG sites ACTN2‐cg21376883 and OSR1‐cg06509239 were found to be associated with poor survival by MethSurv. Methylation status of specific site and expression levels of associated genes were determined using clinical samples by quantitative methylation‐specific PCR and real‐time PCR. Pearson's correlation analysis showed that methylation levels of cg06509239 and cg18335068 were negatively related to OSR1 and ZNF677 expression levels, respectively. Our classification schema using multiomics analysis represents a screening framework for identification of hub CpG sites and associated genes.
Keywords: CpG site, methylation, multiomics, oral squamous cell carcinoma, survival analysis, WGCNA
Construction of comethylation network associated with oral squamous cell carcinoma status by WGCNA. Dendrogram of consensus module eigengenes obtained by WGCNA on the consensus correlation. Seven modules were generated after merging according to the correlation of modules.
1. INTRODUCTION
Oral cancers represent the sixth‐most common malignant tumor type.1 Oral squamous cell carcinoma (OSCC) accounts for 90% of the incidence of head and neck squamous cell carcinoma (HNSCC) and has a poor prognosis and low 5‐year survival rate.2 Smoking, drinking, and chewing betel nuts are the main causes of OSCC; however, its tumorigenesis is a complicated and multistep process involving many crucial genes and signaling pathways.3, 4, 5 It is, therefore, necessary to explore the underlying molecular biology mechanisms of the pathogenesis of OSCC and further characterize its early prognostic signature in order to identify novel drug targets for the disease.6, 7
Over the past few decades, early epigenetic changes have been reported to predispose cells to further genetic abnormalities, which may allow progression of the neoplastic process.8, 9 Epigenetic modification, particularly DNA methylation regulation, in carcinogenesis has become a focus of cancer research.10, 11 Numerous studies have shown that aberrant DNA methylation can lead to changes in chromatin structure, DNA conformation, DNA stability, and DNA‐protein interactions, thereby dysregulating gene expression.12 Aberrant methylation patterns of CpG sites within gene promoters have been shown to be correlated with the development of human cancers, including OSCC.8, 12, 13, 14 These findings indicate that the differential methylation phenotype of CpG islands may be an early event in OSCC development.15 AGTR1, FOXI2, and PENK promoter hypermethylation and LINE1 hypomethylation may be associated with an increased risk of OSCC development.15 In addition, the methylation status of certain genes, including FLT4, KDR, and TFPI2, could potentially be used as a biomarker for early detection of OSCC.8 Thus, there is a motivation to further explore the correlation between the methylation status of CpG sites and associated gene expression in OSCC.
Weighted gene coexpression network analysis (WGCNA) is a typical systematic biological algorithm that aims to separate and identify core genes significantly related to certain biological traits from a dataset consisting of thousands of genes.16, 17 WGCNA has been used to identify hub genes, microRNAs (miRNAs), and long noncoding RNAs (lncRNAs) in a wide variety of cancers, including osteosarcoma,18 glioblastoma,19 colon cancer,20 breast cancer,21 ovarian cancer,22 and cholangiocarcinoma.23 Moreover, these hub genes, miRNAs and lncRNAs, were found to be significantly correlated with progression, prognosis, metastasis, and recurrence in multiple carcinomas. Recently, in order to determine the correlation between hub methylated‐CpG sites and clinical traits of cancers, a modified weighted gene comethylation network analysis (WGCNA) was performed on methylation microarrays of large samples.10, 24, 25 Based on the analysis of hub genes related to radiotherapy efficacy by WGCNA, a 4‐gene methylation signature was identified that could predict survival outcomes of patients with HNSCC.26 However, further evidence is required to determine whether methylated‐CpG sites and their corresponding genes affect the tumorigenesis and development of OSCC.
In this study, we aimed to identify hub differential methylated‐CpG sites and associated genes in OSCC through systematic multiomics analysis, using WGCNA, CpG methylation profiles, and mRNA expression profiles from the Gene Expression Omnibus (GEO) database and other public databases. We also investigated CpG sites and gene‐based prognostic signatures based on accurate prediction of overall survival by public database MethSurv and GEPIA (Gene Expression Profiling Interactive Analysis). Finally, we developed a modified quantitative methylation‐specific PCR (QMSP) to determine methylation status of specific CpG sites. We determined the correlation of hub CpG sites and mRNA levels of associated genes. Our findings indicate that integrated multiomics analysis is a favorable method for identifying hub genes and differential CpG sites, which can be expected to provide novel insights for screening prognostic and diagnostic indicators of OSCC in the future.
2. MATERIAL AND METHODS
2.1. Data collection
All microarray data were downloaded from the GEO database (http://www.ncbi.nlm.nih.gov/geo/). The methylation microarray (http://www.ncbi.nlm.nih.gov/geo/query/acc.cgi?acc=GSE38532) included 40 OSCC samples and 40 nontumor pairwise samples, based on the Illumina HumanMethylation27 BeadChip (GPL8490 platform). The gene expression microarray (http://www.ncbi.nlm.nih.gov/geo/query/acc.cgi?acc=GSE30784) used as the training dataset contained 167 OSCC samples and 45 normal oral tissues. The gene expression microarray (http://www.ncbi.nlm.nih.gov/geo/query/acc.cgi?acc=GSE31056) used for validation contained samples from 21 OSCC patients and 24 normal tissue samples. The Affymetrix Human Genome U133 Plus 2.0 array was used to annotate the probes in both cases. This integrated study was a second analysis of GEO data; as such, patient consent was not required.
2.2. Construction of weighted gene comethylation network
To illustrate our workflow of identification of hub methylated‐CpG sites and associated genes in OSCC, overall flowchart about analysis pipeline was in the Figure S1. The WGCNA algorithm was used to construct comethylation networks.16 The methylation microarray http://www.ncbi.nlm.nih.gov/geo/query/acc.cgi?acc=GSE38532 containing 80 samples comprised a matrix of methylation CpG sites. First, before network construction, obvious outlier samples with excessive numbers of missing entries were removed using a sample dendrogram cluster method for outlier detection, with visualization using a trait heatmap. Second, the soft‐threshold power was selected using the pickSoftThreshold function of WGCNA based on the criteria of approximate scale‐free topology and mean connectivity. Third, we calculated adjacencies using best‐fit soft‐threshold power, transformed the adjacency into a topological overlap matrix (TOM), and calculated the corresponding dissimilarity TOM (dissTOM). Finally, after hierarchical clustering analysis based on the dissTOM, modules were generated by the dynamic tree cut method for module merging (deep split = 2, cut height = 0.25; default values were used for the other parameters).
2.3. Construction of module‐trait relationships and identification of hub CpG sites associated with clinical modules
Pearson's correlation coefficients and P‐values between modules and OSCC status were calculated and visualized in a module‐trait heat map. Module membership (MM) represents the correlation of the methylation patterns of CpG sites with OSCC clinical status. The average gene significance (GS) in each module (module significance, MS, is the absolute average value of the correlation between all the CpGs and the trait) was displayed in a bar graph, which also reflected the relationship between the module and OSCC clinical status. Modules with the highest MS and MM were considered to be key modules with respect to OSCC status. To further identify hub CpG sites within key modules, a scatter plot of GS and MM for all CpG sites within each module was constructed. Using MM >0.8 and GS >0.8 as screening criteria, hub CpG sites were selected from among the key modules, and associated genes were annotated for subsequent function enrichment analysis.
2.4. Function enrichment analysis for hub CpG site‐associated genes from key modules
Enrichr (https://amp.pharm.mssm.edu/Enrichr/) is a web‐based tool for functional enrichment analysis of signaling pathways.27 Hub CpG site‐associated genes within significant clinical modules were annotated and analyzed by Kyoto Encyclopedia of Genes and Genomes (KEGG) pathway analysis in Enrichr with default parameters. A P < .05 was regarded as significance, and −log10 P values were plotted and ranked in a bar graph.
2.5. Integrated analysis of DCGs and DEGs
The analysis of three microarray datasets was performed using R studio packages, including raw data format transition, missing value interpolation, background calibration, and data quantitative normalization.28 After data preprocessing, we defined P < .05 and |log 2FC|≥0.25 (FC, fold change) as the threshold for screening differentially methylated‐CpG sites (DCGs). We analyzed differentially expressed genes (DEGs) between the tumor and normal groups using the limma package, with thresholds set at |log2FC|≥1 and P ≤ .05. Statistical analysis was performed using the ggstatsplot package in R studio, and the results were visualized using volcano plots or violin plots. The overlapping hub CpG sites between key modules and DCGs were used to annotate the proximate genes in a Venn diagram. The expression levels of annotated genes were further validated in a training dataset (http://www.ncbi.nlm.nih.gov/geo/query/acc.cgi?acc=GSE30784) and a validation dataset (http://www.ncbi.nlm.nih.gov/geo/query/acc.cgi?acc=GSE31056). To explore the relationship between differential expression levels and methylation patterns, the promoter methylation of selected hub genes was analyzed by MethHC (http://methhc.mbc.nctu.edu.tw/php/index.php)29 and plotted in a bar graph.
2.6. Survival analysis
To explore the potential prognostic value of hub genes, we used GEPIA database (http://gepia.cancer-pku.cn/)30 for HNSCC to perform overall survival analysis for multiple‐hub CpG site‐associated genes using Mantel‐Cox tests, and presented the results as a survival heatmap. Overall survival analysis for each CpG site was performed using the Kaplan‐Meier test in the MethSurv database (://biit.cs.ut.ee/methsurv/).31 Log‐rank tests were used to measure statistical significance and Log‐rank P < .05 was considered as significance.
2.7. Patients and samples
A series of 40 OSCC biopsy specimens was prospectively collected and frozen at −80℃ in the Xiangya Hospital, Central South University, Changsha City, China. All subjects gave their informed consent for inclusion before they participated in the study. The study was conducted in accordance with the Declaration of Helsinki, and the protocol was approved by the Ethics Committee of Xiangya Hospital. The clinical and histological information of 40 OSCC patients were summarized in Table S1.
2.8. Bisulfite treatment and QMSP
DNA was extracted from all samples with phenol/chloroform and precipitated with ethanol. Sodium bisulfite conversion of genomic DNA was done as previously paper.11 The modified DNA was used as a template for real‐time fluorogenic QMSP. The primers used for the each target gene CpG sites (OSR1 cg06509239 and ZNF677 cg18335068) and for the internal reference gene (ACTB) are listed in Table 1. QMSP assay was prepared including 10 μL of 2×SYBR® Green Realtime PCR Master Mix (Cat # QPK‐201, TOYOBO Life Science), 2 μL of bisulfite‐modified genomic DNA, 2 μL of 100‐pmol primers, and completed with 6 μL of DEPC H2O. The PCR cycling conditions were as follows: initiated the PCR with a 10 minutes denaturation step at 95℃, followed by 36 cycles: 95℃‐30 seconds (denaturation); 55℃‐30 seconds (annealing); and 72℃‐30 seconds (elongation) on a LightCycler480 (Roche). To determine the relative levels of methylated‐CpG sites in each sample, the values of each CpG sites were normalized against the values of the internal reference gene ACTB to obtain a ratio. The following formula of 2−ΔΔ C t method was used: Methylation ratio = 2−ΔΔ C t/(2−ΔΔ C t + 1). ΔΔCt = (Ct Methyprimer − Ct ACTB) − (Ct UnMethyprimer − Ct ACTB). We also set negative control (use ddH2O instead of ACTB primer).
Table 1.
Primer sequences for QMSP and real‐time PCR
| Sequence name | Sequence (5′‐3′) |
|---|---|
| OSR1‐cg06509239 MethyPrimer | GGGAGAGGTTGGGTTTAAGC |
| OSR1‐cg06509239 UnMethyPrimer | GGGAGAGGTTGGGTTTAAGT |
| OSR1‐cg06509239 Reverse primer | ACTAACCCAAACAACAAACT |
| ZNF677‐cg18335068 MethyPrimer | GAGAGGGTTTAGAGATTTGC |
| ZNF677‐cg18335068 UnMethyPrimer | GAGAGGGTTTAGAGATTTGT |
| ZNF677‐cg18335068 Reverse primer | TTACCCTCTTCAAAACAAT |
| ACTB UnMethyPrimer | GGTGATGGAGGAGGTTTAGTAAG |
| ACTB UnMethy ReversePrimer | ACCAATAAAACCTACTCCTCCCTTA |
| OSR1 RT‐PCR forward primer | CGGTGCCTATCCACCCTTC |
| OSR1 RT‐PCR reverse primer | GCAACGCGCTGAAACCATA |
| ZNF677 RT‐PCR forward primer | ACAAGCAAGGGATTATCACCAAA |
| ZNF677 RT‐PCR reverse primer | CAGGCTGTCAAACTTAGGCAT |
| ACTB RT‐PCR forward primer | CATGTACGTTGCTATCCAGGC |
| ACTB RT‐PCR reverse primer | CTCCTTAATGTCACGCACGAT |
| GAPDH RT‐PCR forward primer | GGAGCGAGATCCCTCCAAAAT |
| GAPDH RT‐PCR reverse primer | GGCTGTTGTCATACTTCTCATGG |
Abbreviation: QMSP, quantitative methylation‐specific PCR.
2.9. Real‐time PCR
Total RNA was extracted from OSCC tissues by TRIZOL method (Invitrogen) and RNA was reversely transcripted to cDNA by Reverse transcription kit (Thermo Fisher Scientific). Real‐time PCR was performed using 10 μL of SYBR® Green Realtime PCR Master Mix, 2 μL of cDNA, 2 μL of primers, and 6 μL of ddH2O on a LightCycler480 to detect the expression of OSR1 and ZNF677, with ACTB and GAPDH as a normalizing control. The primers sequence for OSR1, ZNF677, ACTB, and GAPDH was listed in Table 1.
2.10. Correlation scatter plot of selected hub gene expression and CpG methylation patterns
To analyze whether OSR1 and ZNF677 expression levels were correlated with methylation of hub CpG sites, a http://www.baidu.com/link?url=JhH_GEQNs1JT-nvMEPZrZVhVOySQohEpKmVDNM1kUcj3Ww88D9uFyW0C5FJSBdo9aI-KDoAc7H5gFu0y6leInNPiAjRhs8SuFwsi7PIW21-Oy3CROOAqaq8kyCb31Vh_%26wd=%26eqid=ae8f119d00008557000000055d9d8524 scatter plot was constructed using the expression and methylation data from MethHC and our OSCC samples. The association was determined by calculating Pearson's correlation coefficient (R 2). A P < .05 was considered to indicate a statistically significant correlation.
3. RESULTS
3.1. Construction of comethylation network associated with OSCC status by WGCNA
A total of 27 578 probes for CpG sites were annotated and matched with OSCC status. In the sample dendrogram and trait heat map, the samples and related clinical information were connected by WGCNA, with two outlier samples (GSM944918 and GSM944919) excluded using the flashClust function (Figure 1A). A “soft‐thresholding procedure” was performed by WGCNA, and a best‐fit cutoff value (β = 13) was selected at the lowest value of the mean connective and the appropriate scale‐free topology fit index (0.75) (Figure 1B). To construct the comethylation network and identify the key module, a hierarchical clustering tree for the module was produced using the best‐fit β‐value of 13 (Figure 1C). The cut line was set at 0.25 to merge similar modules, resulting in 7 merged modules (Figure 1D).
Figure 1.
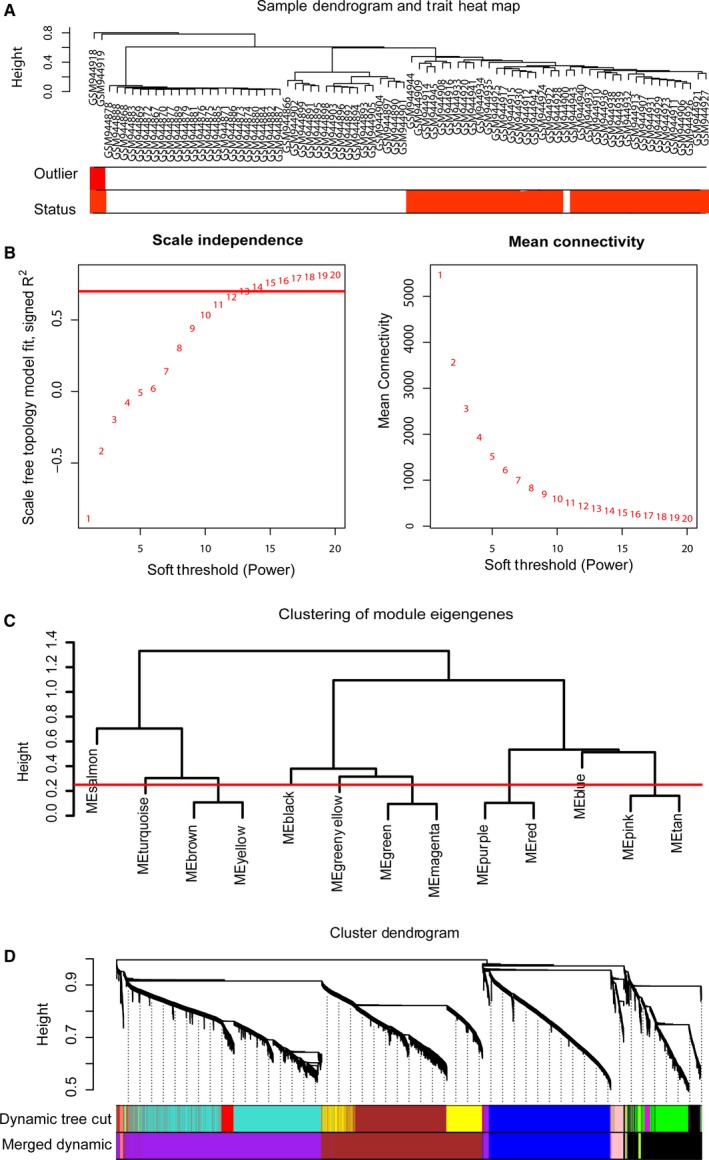
Construction of comethylation network associated with OSCC status by WGCNA. (A) Clustering dendrogram of 80 samples. (B) Analysis of the scale‐free fit index and mean connectivity for various soft‐thresholding powers. Red line represents the appropriate scale‐free topology fit index at 0.75. (C) Dendrogram of consensus module eigengenes obtained by WGCNA on the consensus correlation. The red line at 0.25 indicates the merging threshold; groups of eigengenes below the threshold represent modules whose expression profiles were merged owing to their similarity. (D) Merged modules were identified by the Dynamic Tree Cutting method. Each module was assigned a color as an identifier. Seven modules were generated after merging according to the correlation of modules. OSCC, oral squamous cell carcinoma
The module‐trait heat map revealed the relationship of OSCC status and methylated‐CpG sites within the modules (Figure 2A,B). The blue module, comprising positively related CpGs, was significantly correlated with OSCC status (R = .93 and P = 8e‐36). Meanwhile, the brown module was negatively associated with OSCC status (R=−.84 and P = 1e‐21). The modules with the highest MS were considered to be key modules with respect to OSCC status. The blue and brown modules shown in Figure 2B represent the 2 modules with the highest MS, consistent with the Pearson's correlation index results in the module‐trait heat map.
Figure 2.
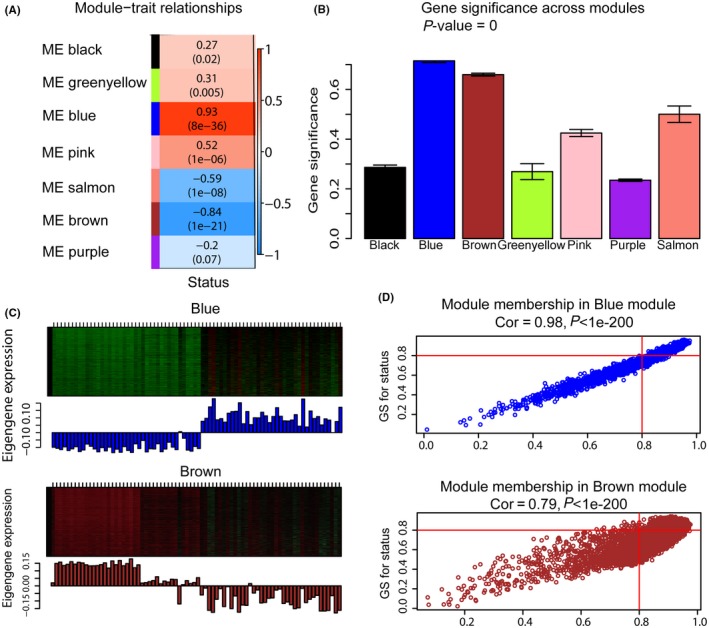
Identification of hub modules associated with OSCC status. (A) Heatmap of the correlation between module eigengenes and OSCC status. Vertical axis represents modules, horizontal axis represents status. (B) Distribution of average GS in modules associated with OSCC status. (C) Heat maps and boxplots showing methylation status of CpG sites within the 2 hub modules. Hypermethylation is represented by red and hypomethylation by green in the heat maps. In the boxplot, the vertical axes represent the methylation ratio and the horizontal axes represent samples. (D) Scatter plot of GS vs MM in the brown module and blue module. Red cutoff lines for MM and GS at 0.8 indicate the criteria used to screen for hub CpG sites. GS, gene significance; MM, module membership; OSCC, oral squamous cell carcinoma
3.2. Screen of hub methylated‐CpG sites within blue and brown modules
The methylation status of CpG sites within the blue and brown modules related to OSCC status is displayed in the heat map and boxplot in Figure 2C. A higher methylation ratio of CpG sites was observed in the blue module for OSCC samples compared with normal samples, with the opposite tendency for the brown module. These results imply that the methylation status of CpG sites within key modules is highly related to clinical characteristics, consistent with the MS and Pearson's correlation index results shown in the module‐trait heat map. To further identify the hub CpG sites within key modules, screening criteria of MM >0.8 and GS >0.8 were used to identify 559 CpG sites from the blue module and 298 CpG sites from the brown module (Table S2).
3.3. Screen of hub methylated‐CpG sites and associated genes
To further screen hub methylated‐CpG sites and associated genes, 3 microarrays (http://www.ncbi.nlm.nih.gov/geo/query/acc.cgi?acc=GSE30784, http://www.ncbi.nlm.nih.gov/geo/query/acc.cgi?acc=GSE31056, and http://www.ncbi.nlm.nih.gov/geo/query/acc.cgi?acc=GSE38532) were used to analyze the DEGs and DCGs. As shown in Figure 3A, A total of 723 hyper‐DCGs and 470 hypo‐DCGs were screened out in the methylation profile of http://www.ncbi.nlm.nih.gov/geo/query/acc.cgi?acc=GSE38532. These DCGs intersected with hub CpG sites within the blue or brown module, resulting in a total of 559 hyper‐DCGs within the blue module and 298 hypo‐DCGs within the brown module, as illustrated in the Venn diagram in Figure 3B. In addition, 559 genes associated with hyper‐DCGs were annotated within the blue module, and 298 genes were found near hypo‐DCGs within the brown module (Table S2), according to the corresponding annotation information. As shown in the volcano plot in Figure 3A, 1091 upregulated DEGs and 1109 downregulated DEGs were found in the http://www.ncbi.nlm.nih.gov/geo/query/acc.cgi?acc=GSE30784 microarray. Figure 3C shows the four groups of genes that overlapped, from which hub genes associated with methylated‐CpG sites were selected. We selected the hub DEGs from the module eigengenes for which expression levels were negatively associated with the methylated ratio of CpG sites. Therefore, among the 4 groups, 27 downregulated DEGs from the blue module and 14 upregulated DEGs from the brown module were identified. The http://www.ncbi.nlm.nih.gov/geo/query/acc.cgi?acc=GSE31056 expression profile was used to validate the differential expression of 41 hub genes in the OSCC samples. Only 18 hub genes had statistically different expression levels in the validation dataset of http://www.ncbi.nlm.nih.gov/geo/query/acc.cgi?acc=GSE31056 in Figure 4B (P < .05).
Figure 3.
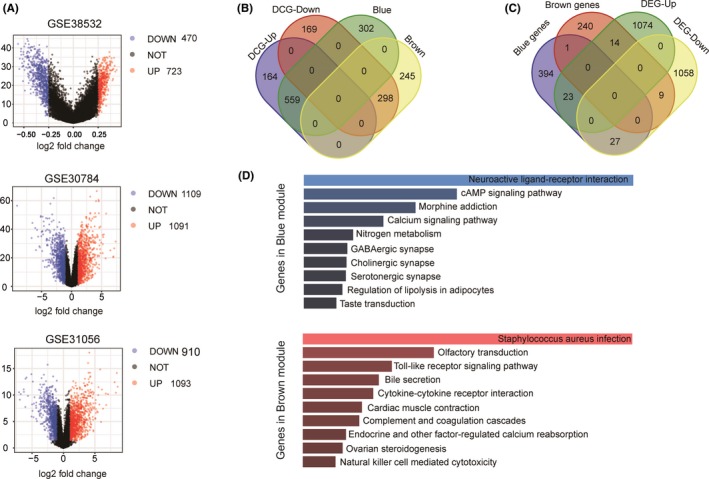
Selection of hub methylated‐CpG sites and associated genes. (A) Volcano plot of DCGs and DEGs. Red dots represent upregulated genes, blue dots represent downregulated genes. (B) Venn diagrams of DCGs and genes in blue and brown modules. (C) Venn diagram of DEGs and DCG‐associated genes in blue and brown modules. (D) Functional analysis of DCG‐associated genes in blue and brown modules showed in boxplot. Top 10 enriched KEGG pathways are ranked by −log10 (P). DCGs, differentially methylated‐CpG sites; DEGs, differentially expressed genes; KEGG, Kyoto Encyclopedia of Genes and Genomes
Figure 4.
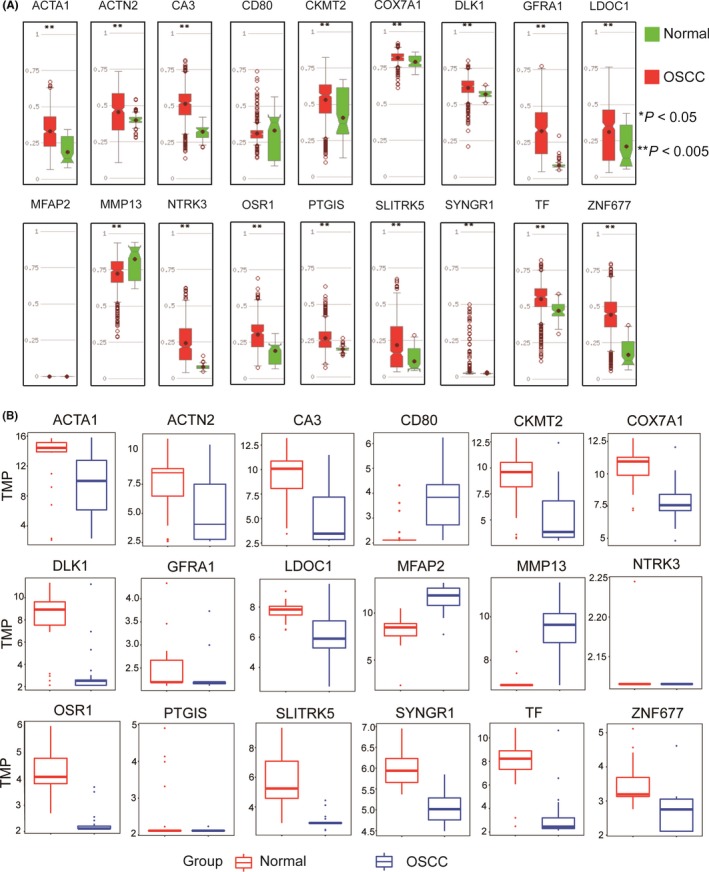
Correlation analysis for selected hub genes between promoter methylation status and expression levels. (A) Boxplots showing promoter methylation status of 18 hub genes, analyzed via MethHC. (B) Boxplots showing expression levels of 18 hub genes from http://www.ncbi.nlm.nih.gov/geo/query/acc.cgi?acc=GSE31056. Normal samples (n = 45) are shown as red box and dots and OSCC samples (n = 167) as blue box and dots. OSCC, oral squamous cell carcinoma
3.4. Functional enrichment analysis of hub CpG site‐associated eigengenes from key modules
We performed KEGG enrichment analysis to reveal the functions of the hub genes associated with hyper‐DCGs and hypo‐DCGs in the blue and brown modules. As shown in Figure 3D, hub genes in the blue and brown module were mainly enriched in top 10 signaling pathways, respectively. Some critical pathways of blue module were enriched, such as cAMP signaling pathway and calcium signaling pathway, which are related to cancers.
3.5. Differential expression and methylation patterns of hub methylated‐CpG site‐associated genes
To investigate the correlation of differential expression levels and methylation patterns, the promoter methylation of hub methylated‐CpG sites‐associated genes were analyzed using MethHC. Promoter methylation ratios of 15 hub genes were significantly higher in OSCC samples than in normal tissues (P < .005) (Figure 4A), and expression levels of 15 hub genes were significantly lower (P < .05) (Figure 4B). Only levels of MMP13 were elevated and had a lower promoter methylation ratio. The expression levels of MFAP2 and CD80 were not correlated with their promoter methylation and the 2 genes were excluded in the following analysis. Thus, expression levels of 16 hub genes were negatively correlated with their methylation status of promoter. It implies that promoter methylation of hub methylated‐CpG site‐associated genes affects their expression.
3.6. Survival analysis for hub methylated‐CpG sites and their associated genes
In order to assess whether these hub genes were prognostic indicators, a survival heat map of multiple genes identified by the Mantel‐Cox test was constructed in GEPIA. Figure 5A shows the survival heat map for 18 hub genes and only 5 genes, ACTA1, ACTN2, OSR1, SYNGR1, and ZNF677 had significant overall survival (log‐rank P < .05). The Kaplan‐Meier curve showed that low expression of ACTA1 and ACTN2 was associated with improved survival, and 3 genes, OSR1, SYNGR1, and ZNF677, were associated with poor survival (Figure 5B).
Figure 5.
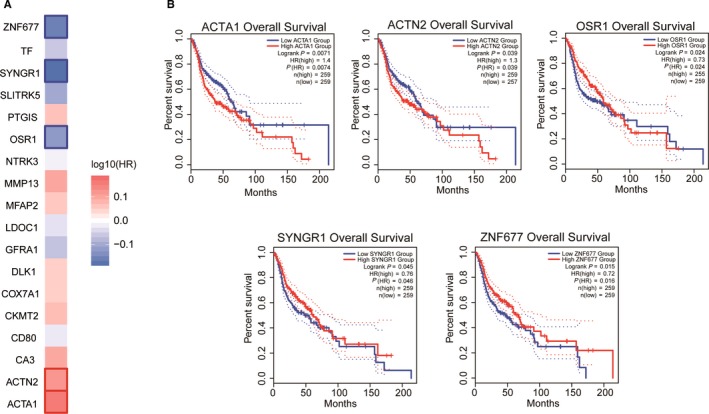
Overall survival analysis of hub genes. (A) Survival heat map for 18 selected hub genes. (B) Kaplan‐Meier curve analysis for ACTA1, ACTN2, OSR1, SYNGR1, and ZNF677 with respect to overall survival in OSCC patients. A log‐rank P > .05 was considered to indicate a significant difference. OSCC, oral squamous cell carcinoma
Seven hub CpG sites from key modules were found to be located near these 5 genes. Hypermethylation patterns of 6 hub CpG sites were found in OSCC samples compared with normal samples (Figure 6A). Kaplan‐Meier curve analysis was performed to obtain the prognostic signature of hub methylated‐CpG sites by log‐rank test. SYNGR1‐cg19713460 was excluded for lack of survival data. Hypermethylation CpG sites ACTN2‐cg21376883 (log‐rank P = .015) and OSR1‐cg06509239 (log‐rank P = .0055) were associated with poor survival (Figure 6B), whereas hypermethylation CpG site ZNF677‐cg18335068 (log‐rank P = .0048) was associated with an improved prognosis. Methylation levels of ZNF677‐cg16708981, ACTA1‐cg13547644, and ACTA1‐cg20025656 were not associated with survival (P > .05).
Figure 6.
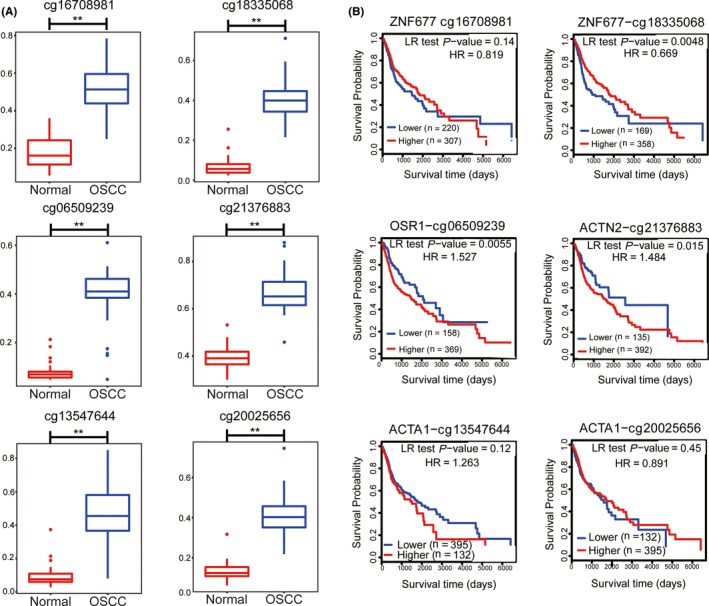
Methylation status of hub CpG sites and overall survival analysis. (A) Hypermethylation patterns of the 6 hub CpG sites in OSCC samples compared with normal samples using data of http://www.ncbi.nlm.nih.gov/geo/query/acc.cgi?acc=GSE38532. Normal samples (n = 40) are shown as red box and OSCC samples (n = 40) as blue box. Y axis represents methylation level. ** (P<0.01) indicates a significant difference. (B) Overall survival analysis of hub CpG sites by Kaplan‐Meier test using MethSurv. A log‐rank P < .05 was considered to indicate a significant difference. OSCC, oral squamous cell carcinoma
3.7. Correlation scatter plot of selected hub genes’ expression and CpG methylation patterns
Linear Pearson's correlation analysis was performed to clarify whether the methylation status of hub CpG sites was correlated with the associated hub genes. In Figure 7A, we used the public data from MethHC and constructed a linear regression scatter plot. The results showed that methylation levels of cg06509239 and cg18335068 were negatively related to OSR1 (R 2 = .255) and ZNF677 (R 2 = .2724) mRNA levels, respectively. Moreover, we also constructed QMSP assays to detect methylation status of hub CpG sites (Figure 7B) using clinical samples of OSCC, which were further used to build a linear regression scatter plot. In Figure 7C, methylation ratio of cg06509239 (R 2 = .2679) and cg18335068 (R 2 = .1994) was also decreased, accompanied by the increase in expression levels of OSR1 and ZNF677 (P < .05) in a negatively dependent manner. Thus, these findings demonstrate that the decrease in OSR1 and ZNF677 expression levels in OSCC samples could be associated with the hypermethylated‐CpG sites.
Figure 7.
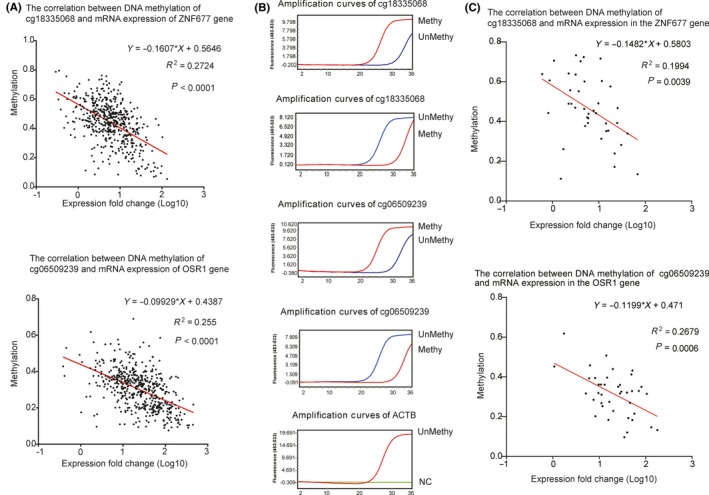
Linear correlation analysis of selected hub CpG sites and mRNA expression levels in MethHC and clinical samples by Pearson's correlation analysis. (A) Linear correlation scatterplot of hub CpG sites in MethHC. X‐axis represents mRNA expression fold change (Log10). Y‐axis represents methylation ratio. (B) QMSP for the identification of methylation status of CpG sites using 40 OSCC samples from the hospital. Methy represents MehthyPrimer and UnMethy represents UnMethyPrimer. NC means negative control (using ddH2O instead of ACTB primers). (C) Linear correlation scatterplot of hub CpG sites using 40 OSCC samples. Real‐time PCR was used to determine mRNA levels of ZNF677 and OSR1 in 40 OSCC samples from the hospital. X‐axis represents mRNA expression fold change (Log10). Y‐axis represents methylation ratio. P < .05 is statistical significance. Red line indicates the tendency of scatterplot. R 2 is correlation coefficient. Equation is linear regression equation. OSCC, oral squamous cell carcinoma; QMSP, quantitative methylation‐specific PCR
4. DISCUSSION
This study used integrated multiomics analysis to show that methylation patterns of hub CpG sites in OSCC were associated with expression levels of the corresponding genes. To describe the relationships between methylation profiles and OSCC status, we used a modified WGCNA method, weighted gene comethylation network analysis, to screen hub CpG sites from clinical trait‐related modules. In previous studies, many reporters used integrated multiomics analysis to screen hub genes and associated methylated differential genes.32, 33 The prognostic model based on 5 aberrant differential methylation genes (PAX9, STK33, GPR150, INSM1, and EPHX3) can be used as independent prognostic biomarkers for predicting the prognosis of patients with head and neck cancer.32 Using gene expression profiles of OSCC (http://www.ncbi.nlm.nih.gov/geo/query/acc.cgi?acc=GSE30784 and http://www.ncbi.nlm.nih.gov/geo/query/acc.cgi?acc=GSE38532), 28 upregulated hypomethylated genes and 24 downregulated hypermethylated genes were identified, which were mainly enriched in the biological process of regulation in immune response, PI3K‐AKT and EMT pathways.33 WGCNA was used to directly screen out 5 methylation‐associated genes, CENPV, SYTL2, OCLN, CASD1, and TUB, which may be predictors of survival in patients with OSCC.34 Another report characterized a 4‐gene methylation signature consisting of ZNF10, TMPRSS12, ERGIC2, and RNF215, which are associated with efficacy of radiotherapy in HNSCC.26
Compared with previous study, a novel aspect of our study was the use of WGCNA to investigate the methylation profile of CpGs in OSCC with a large sample size. This method greatly reduced the multiple testing problems; instead of attempting to relate 27 578 CpGs to OSCC status, we only needed to consider 7 merged comethylation modules. We directly screened out 559 hypermethylation CpG sites and 298 hypomethylation CpG sites from the OSCC status‐associated key module using our screening criteria. The hub methylated‐CpG sites were mapped to the genome and annotated with the nearest genes.
To validate these DCG‐associated genes, two independent gene expression profiles of OSCC were further analyzed. Seven hub genes were statistically differentially expressed in the validating dataset. Hypermethylation of CpG spots in promoters is widely considered to interrupt genomic binding of activating transcription factors or other proteins, and shows a high level of association with gene repression.35 Expression levels of 16 of the 18 hub genes (except CD80 and MFAP2) were negatively correlated with their promoter's methylation status. In order to investigate the effect of hub genes on prognosis, a survival heat map was constructed. This showed that 5 hub genes had significant association with survival outcomes, suggesting key roles for these genes in the progression of OSCC. Three hub methylated‐CpG sites (cg21376883, cg06509239, and cg18335068) and their associated genes were characterized by divergent methylated patterns, expression FC, and significant association with survival outcomes. Identification of these unique CpG sites and the associated genes may help to develop novel therapeutic targets for clinical diagnosis in OSCC patients.
ACTN2, an actin‐binding protein, functions as a key transducing molecule in the signaling pathway from IGF receptor I activation to cell membrane microspike production, cell‐cell separation, and cell migration.36 ACTN2 has been identified as a hub gene involved in the focal adhesion signaling pathway and represents a potential new target for treatment of chordomas.37 The parafibromin tumor suppressor protein interacts with ACTN2 and ACTN3, suggesting that these proteins probably have antitumor roles.38 In this study, ACTN2 expression was decreased in OSCC with the elevated methylation ratio of promoter. However, hypermethylated‐cg21376883 in OSCC samples was not correlated with the low levels of ACTN2 (Data not shown). cg21376883 was an independent favorable prognostic indicator for OSCC survival (Logrank P = .015).
Zinc finger protein 677 (ZNF677), located at the chromosomal region 19q13, is involved in transcriptional regulation. ZNF677 has been shown to have all 3 types of genomic aberration (gain, loss, and copy neutral loss of heterozygosity) in gliomas.39 In non–small cell lung cancer (NSCLC), ZNF677 functions as a tumor suppressor regulating many genes, mainly those involved in growth hormone regulation and interferon signaling.40 Moreover, hypermethylation of ZNF677 probably causes a decrease in ZNF677 expression, which could serve as a prognostic marker in NSCLC patients.40 ZNF677 also exerts its tumor suppressor functions in thyroid cancer cells through transcriptional repression of CDKN3 and HSPB1, thereby interfering with phosphorylation and activation of Akt via distinct mechanisms.41 In this study, we further demonstrated that low expression of ZNF677 may be associated with poor outcomes in patients (log‐rank P = .015); thus, the indicator could be used to monitor cancer progression. Methylation level of ZNF677‐cg18335068 was significantly correlated with its expression using MethHC and our cohort. However, hypermethylation CpG site ZNF677‐cg18335068 (log‐rank P = .0048) was associated with an improved prognosis using the data from MethSurv. Because of 2 public data onto overall survival be used, it seems like that hypermethylation of cg18335068 and lower expression of ZNF677 in OSCC are inconsistent with the tumor suppressor functions in other cancers. Further exploration of the role of ZNF677 in OSCC and the effect of cg18335068 on the expression of ZNF677 are still needed to be performed.
The odd‐skipped related 1 (OSR1) gene, located on human chromosome 2p24.1, is a transcription factor that plays a part in the regulation of embryonic heart and urogenital development.42 OSR1 methylation is closely related to the development of several different cancer types.43 Methylation of OSR1 has been shown to be a sensitive indicator of the detection of recurrent urothelial cell carcinoma.44 In addition, OSR1 hypermethylation was identified as an independent predictor of poor survival in gastric cancer patients.45 OSR1 also showed clinical potential as a biomarker in lung adenocarcinoma,46 owing to the inactivity of the Wnt signaling pathway resulting from a decrease in SOX9 and β‐catenin levels.47 Moreover, OSR1 blocks cell migration and invasion through inhibiting the NF‐κB pathway in tongue squamous cell carcinoma.43 OSR1 could serve as a novel epigenetic silenced tumor suppressor downregulating invasion and proliferation in renal cell carcinoma.48 In this study, OSR1 methylated cg06509239 was highly correlated with OSCC status and negatively associated with expression levels in MethHC and our cohort. In OSCC, the low levels of OSR1 were probably downregulated by the high ratio of methylated cg06509239. Thus, OSR1 expression and its CpG spot cg06509239 could serve as prognostic indicators for OSCC.
In conclusion, the classification schema using multiomics analysis developed in this work represents a screening framework that could be used to identify hub CpG sites and associated genes to serve as diagnostic and prognostic indicators in OSCC patients.
CONFLICTS OF INTEREST
The authors declare no conflict of interest.
AUTHOR CONTRIBUTIONS
Qiang Qu was involved in project administration and supervision. Yuxin Dai was in charge of original draft preparation and software. Qiaoli Lv was involved in data curation, investigation, and original draft preparation. Jian Qu was in charge of picture visualization. Hongli Ni and Yongkang Liao were involved in formal analysis. Peng Liu was in charge of data validation.
Supporting information
Fig S1
Table S1
Table S2
ACKNOWLEDGMENTS
We are grateful to Miss Haiwen Zhang and Zhaohui Jiang for WGCNA.
Dai Y, Lv Q, Qi T, et al. Identification of hub methylated‐CpG sites and associated genes in oral squamous cell carcinoma. Cancer Med. 2020;9:3174–3187. 10.1002/cam4.2969
Yuxin Dai and Qiaoli Lv have contributed equally to this paper.
Funding information
This research was funded by the National Natural Science Foundation of China (No. 81503166, 81603208), the Youth Foundation of Xiangya Hospital in Central South University (2014Q08), and the Natural Scientific Foundation of Hunan Province in China (2018JJ3846).
DATA AVAILABILITY STATEMENT
The data that support the findings of this study are openly available.
REFERENCES
- 1. Zheng J‐W, Yang Y, Yang S, et al. Gene microarray analysis revealed a potential crucial gene RACK1 in oral squamous cell carcinoma (OSCC). Animal Cells and Systems. 2018;22(2):82‐91. [DOI] [PMC free article] [PubMed] [Google Scholar]
- 2. Chi AC, Day TA, Neville BW. Oral cavity and oropharyngeal squamous cell carcinoma–an update. CA: A Cancer Journal for Clinicians. 2015;65(5):401‐421. [DOI] [PubMed] [Google Scholar]
- 3. Li X, Hu WW, Wang L, Yang XH. Co‐expression analysis reveals key gene modules and pathways of oral squamous cell carcinoma. Cancer Biomarkers. 2018;22(4):763‐771. [DOI] [PubMed] [Google Scholar]
- 4. Wang J, Sun F, Lin X, Li Z, Mao X, Jiang C. Cytotoxic T cell responses to Streptococcus are associated with improved prognosis of oral squamous cell carcinoma. Experimental Cell Research. 2018;362(1):203‐208. [DOI] [PubMed] [Google Scholar]
- 5. Jiang C, Yuan F, Wang J, Wu L. Oral squamous cell carcinoma suppressed antitumor immunity through induction of PD‐L1 expression on tumor‐associated macrophages. Immunobiology. 2017;222(4):651‐657. [DOI] [PubMed] [Google Scholar]
- 6. Zhang X, Feng H, Li Z, et al. Application of weighted gene co‐expression network analysis to identify key modules and hub genes in oral squamous cell carcinoma tumorigenesis. OncoTargets and Therapy. 2018;11:6001‐6021. [DOI] [PMC free article] [PubMed] [Google Scholar]
- 7. Wang YH, Tian X, Liu OS, et al. Gene profiling analysis for patients with oral verrucous carcinoma and oral squamous cell carcinoma. International Journal of Clinical and Experimental Medicine. 2014;7(7):1845‐1852. [PMC free article] [PubMed] [Google Scholar]
- 8. Li Y‐F, Hsiao Y‐H, Lai Y‐H, et al. DNA methylation profiles and biomarkers of oral squamous cell carcinoma. Epigenetics. 2015;10(3):229‐236. [DOI] [PMC free article] [PubMed] [Google Scholar]
- 9. Zhang HX, Liu OS, Deng C, et al. Genome‐wide gene expression profiling of tongue squamous cell carcinoma by RNA‐seq. Clinical Oral Investigations. 2018;22(1):209‐216. [DOI] [PubMed] [Google Scholar]
- 10. Yang Y, Chu F‐H, Xu W‐R, et al. Identification of regulatory role of DNA methylation in colon cancer gene expression via systematic bioinformatics analysis. Medicine. 2017;96(47):e8487. [DOI] [PMC free article] [PubMed] [Google Scholar]
- 11. Qu Q, Qu J, Zhan M, et al. Different involvement of promoter methylation in the expression of organic cation/carnitine transporter 2 (OCTN2) in cancer cell lines. PloS One. 2013;8(10):e76474. [DOI] [PMC free article] [PubMed] [Google Scholar]
- 12. Michalak EM, Burr ML, Bannister AJ, Dawson MA. The roles of DNA, RNA and histone methylation in ageing and cancer. Nature Reviews Molecular Cell Biology. 2019;20:573‐589. [DOI] [PubMed] [Google Scholar]
- 13. Guerrero‐Preston R, Michailidi C, Marchionni L, et al. Key tumor suppressor genes inactivated by "greater promoter" methylation and somatic mutations in head and neck cancer. Epigenetics. 2014;9(7):1031‐1046. [DOI] [PMC free article] [PubMed] [Google Scholar]
- 14. Morandi L, Gissi D, Tarsitano A, et al. CpG location and methylation level are crucial factors for the early detection of oral squamous cell carcinoma in brushing samples using bisulfite sequencing of a 13‐gene panel. Clinical Epigenetics. 2017;9:85. [DOI] [PMC free article] [PubMed] [Google Scholar]
- 15. Foy J‐P, Pickering CR, Papadimitrakopoulou VA, et al. New DNA methylation markers and global DNA hypomethylation are associated with oral cancer development. Cancer Prevention Research. 2015;8(11):1027‐1035. [DOI] [PMC free article] [PubMed] [Google Scholar]
- 16. Langfelder P, Horvath S. WGCNA: an R package for weighted correlation network analysis. BMC Bioinformatics. 2008;9:559. [DOI] [PMC free article] [PubMed] [Google Scholar]
- 17. Ma H, Qu J, Luo J, et al. Super‐enhancer‐associated hub genes in chronic myeloid leukemia identified using weighted gene co‐expression network analysis. Cancer Management and Research. 2019;11:10705‐10718. [DOI] [PMC free article] [PubMed] [Google Scholar]
- 18. Fan H, Lu S, Wang S, Zhang S. Identification of critical genes associated with human osteosarcoma metastasis based on integrated gene expression profiling. Molecular Medicine Reports. 2019;20(2):915‐930. [DOI] [PMC free article] [PubMed] [Google Scholar]
- 19. Yin W, Tang G, Zhou Q, et al. Expression profile analysis identifies a novel five‐gene signature to improve prognosis prediction of glioblastoma. Frontiers in Genetics. 2019;10:419. [DOI] [PMC free article] [PubMed] [Google Scholar]
- 20. Feng Y, Li Y, Li L, Wang X, Chen Z. Identification of specific modules and significant genes associated with colon cancer by weighted gene coexpression network analysis. Molecular Medicine Reports. 2019;20(1):693‐700. [DOI] [PubMed] [Google Scholar]
- 21. Tang J, Yang Q, Cui Q, et al. Weighted gene correlation network analysis identifies RSAD2, HERC5, and CCL8 as prognostic candidates for breast cancer. Journal of Cellular Physiology. 2020;235:394‐407. [DOI] [PubMed] [Google Scholar]
- 22. Zhao Q, Fan C. A novel risk score system for assessment of ovarian cancer based on co‐expression network analysis and expression level of five lncRNAs. BMC Medical Genetics. 2019;20(1):103. [DOI] [PMC free article] [PubMed] [Google Scholar]
- 23. Tian A, Pu KE, Li B, et al. Weighted gene co‐expression network analysis reveals hub genes involved in cholangiocarcinoma progression and prognosis. Hepatology Research. 2019;49:1195‐1206. [DOI] [PMC free article] [PubMed] [Google Scholar]
- 24. Shi Q, Shen L, Gan J, et al. Integrative analysis identifies DNMTs against immune‐infiltrating neutrophils and dendritic cells in colorectal cancer. Epigenetics. 2019;14(4):392‐404. [DOI] [PMC free article] [PubMed] [Google Scholar]
- 25. Wang X, Ghareeb WM, Zhang Y, et al. Hypermethylated and downregulated MEIS2 are involved in stemness properties and oxaliplatin‐based chemotherapy resistance of colorectal cancer. Journal of Cellular Physiology. 2019;234(10):18180‐18191. [DOI] [PubMed] [Google Scholar]
- 26. Ma J, Li R, Wang J. Characterization of a prognostic fourgene methylation signature associated with radiotherapy for head and neck squamous cell carcinoma. Molecular Medicine Reports. 2019;20(1):622‐632. [DOI] [PMC free article] [PubMed] [Google Scholar]
- 27. Kuleshov MV, Jones MR, Rouillard AD, et al. Enrichr: a comprehensive gene set enrichment analysis web server 2016 update. Nucleic Acids Research. 2016;44(W1):W90‐W97. [DOI] [PMC free article] [PubMed] [Google Scholar]
- 28. Smyth GK. limma: Linear Models for Microarray Data In: Gentleman R, Carey VJ, Huber W, Irizarry RA, Dudoit S, eds. Bioinformatics and Computational Biology Solutions Using R and Bioconductor. Statistics for Biology and Health. New York, NY: Springer; 2005. [Google Scholar]
- 29. Huang WY, Hsu SD, Huang HY, et al. MethHC: a database of DNA methylation and gene expression in human cancer. Nucleic Acids Research. 2015;43(Database issue):D856‐D861. [DOI] [PMC free article] [PubMed] [Google Scholar]
- 30. Tang Z, Li C, Kang B, Gao G, Li C, Zhang ZJNAR. GEPIA: a web server for cancer and normal gene expression profiling and interactive analyses. Nucleic Acids Research. 2017;45(W1):W98‐W102. [DOI] [PMC free article] [PubMed] [Google Scholar]
- 31. Modhukur V, Iljasenko T, Metsalu T, Lokk K, Laisk‐Podar T, Vilo JJE. MethSurv: a web tool to perform multivariable survival analysis using DNA methylation data. Epigenomics. 2018;10(3):277‐288. [DOI] [PubMed] [Google Scholar]
- 32. Bai G, Song J, Yuan Y, et al. Systematic analysis of differentially methylated expressed genes and site‐speci fi c methylation as potential prognostic markers in head and neck cancer. Journal of Cellular Physiology. 2019;234(12):22687‐22702. [DOI] [PMC free article] [PubMed] [Google Scholar]
- 33. Zhang X, Feng H, Li D, Liu S, Amizuka N, Li M. Identification of differentially expressed genes induced by aberrant methylation in oral squamous cell carcinomas using integrated bioinformatic analysis. International Journal of Molecular Sciences. 2018;19(6):1698. [DOI] [PMC free article] [PubMed] [Google Scholar]
- 34. Zhu Q, Tian G, Gao J. Construction of prognostic risk prediction model of oral squamous cell carcinoma based on co‐methylated genes. International Journal of Molecular Medicine. 2019;44:787‐796. [DOI] [PMC free article] [PubMed] [Google Scholar]
- 35. Jones PA, Takai D. The role of DNA methylation in mammalian epigenetics. Science. 2001;293(5532):1068‐1070. [DOI] [PubMed] [Google Scholar]
- 36. Guvakova MA, Adams JC, Boettiger D. Functional role of alpha‐actinin, PI 3‐kinase and MEK1/2 in insulin‐like growth factor I receptor kinase regulated motility of human breast carcinoma cells. Journal of Cell Science. 2002;115(Pt 21):4149‐4165. [DOI] [PubMed] [Google Scholar]
- 37. Li G, Cai L, Zhou L. Microarray gene expression profiling and bioinformatics analysis reveal key differentially expressed genes in clival and sacral chordoma cell lines. Neurological Research. 2019;41(6):554‐561. [DOI] [PubMed] [Google Scholar]
- 38. Agarwal SK, Simonds WF, Marx SJ. The parafibromin tumor suppressor protein interacts with actin‐binding proteins actinin‐2 and actinin‐3. Molecular Cancer. 2008;7:65. [DOI] [PMC free article] [PubMed] [Google Scholar]
- 39. Li Y, Wang D, Wang L, et al. Distinct genomic aberrations between low‐grade and high‐grade gliomas of Chinese patients. PloS One. 2013;8(2):e57168. [DOI] [PMC free article] [PubMed] [Google Scholar]
- 40. Heller G, Altenberger C, Schmid B, et al. DNA methylation transcriptionally regulates the putative tumor cell growth suppressor ZNF677 in non‐small cell lung cancers. Oncotarget. 2015;6(1):394‐408. [DOI] [PMC free article] [PubMed] [Google Scholar]
- 41. Li Y, Yang Q, Guan H, Shi B, Ji M, Hou P. ZNF677 suppresses Akt phosphorylation and tumorigenesis in thyroid cancer. Cancer Research. 2018;78(18):5216‐5228. [DOI] [PubMed] [Google Scholar]
- 42. Stumm J, Vallecillo‐García P, Vom Hofe‐Schneider S, et al. Odd skipped‐related 1 (Osr1) identifies muscle‐interstitial fibro‐adipogenic progenitors (FAPs) activated by acute injury. Stem Cell Research. 2018;32:8‐16. [DOI] [PubMed] [Google Scholar]
- 43. Chen W, Wu K, Zhang H, Fu X, Yao F, Yang A. Odd‐skipped related transcription factor 1 (OSR1) suppresses tongue squamous cell carcinoma migration and invasion through inhibiting NF‐kappaB pathway. European Journal of Pharmacology. 2018;839:33‐39. [DOI] [PubMed] [Google Scholar]
- 44. Kandimalla R, Masius R, Beukers W, et al. A 3‐plex methylation assay combined with the FGFR3 mutation assay sensitively detects recurrent bladder cancer in voided urine. Clinical Cancer Research. 2013;19(17):4760‐4769. [DOI] [PubMed] [Google Scholar]
- 45. Otani K, Dong Y, Li X, et al. Odd‐skipped related 1 is a novel tumour suppressor gene and a potential prognostic biomarker in gastric cancer. The Journal of Pathology. 2014;234(3):302‐315. [DOI] [PMC free article] [PubMed] [Google Scholar]
- 46. Daugaard I, Dominguez D, Kjeldsen TE, et al. Identification and validation of candidate epigenetic biomarkers in lung adenocarcinoma. Scientific Reports. 2016;6:35807. [DOI] [PMC free article] [PubMed] [Google Scholar]
- 47. Wang Y, Lei L, Zheng YW, et al. Odd‐skipped related 1 inhibits lung cancer proliferation and invasion by reducing Wnt signaling through the suppression of SOX9 and beta‐catenin. Cancer Science. 2018;109(6):1799‐1810. [DOI] [PMC free article] [PubMed] [Google Scholar]
- 48. Zhang Y, Yuan Y, Liang P, et al. OSR1 is a novel epigenetic silenced tumor suppressor regulating invasion and proliferation in renal cell carcinoma. Oncotarget. 2017;8(18):30008‐30018. [DOI] [PMC free article] [PubMed] [Google Scholar]
Associated Data
This section collects any data citations, data availability statements, or supplementary materials included in this article.
Supplementary Materials
Fig S1
Table S1
Table S2
Data Availability Statement
The data that support the findings of this study are openly available.


