

Abstract
ECG beat type analysis is important in the detection of various heart diseases. The ECG beats give useful information about the status of the monitored heart condition. Up to now, various artificial intelligence-based methods have been proposed for ECG based heart failure detection. These methods were generally based on either time or frequency domain signal processing routines. In this study, we propose a different approach for ECG beat classification. The proposed approach is based on image processing. Thus, the initial step of the proposed work is converting the ECG beat signals to the ECG beat images. To do that, the ECG beat snapshots are initially saved as ECG beat images and then local feature descriptors are considered for feature extraction from ECG beat images. Eight local feature descriptors namely Local Binary Patterns, Frequency Decoded LBP, Quaternionic Local Ranking Binary Pattern, Binary Gabor Pattern, Local Phase Quantization, Binarized Statistical Image Features, CENsus TRansform hISTogram and Pyramid Histogram of Oriented Gradients are considered for feature extraction. The Support Vector Machines (SVM) classifier is used in the classification stage of the study. Linear, Quadratic, Cubic and Gaussian kernel functions are used in the SVM classifier. Five types of ECG beats from the MIT-BIH arrhythmia dataset are considered in experiments and the classification accuracy is used for performance measure. To construct a balanced training and test sets, 5000 and 10,000 ECG beat samples are randomly selected and are used in experiments in tenfold cross-validation fashion. The obtained results show that the proposed method is quite efficient where the calculated accuracy score is 99.9% and the comparisons with the state-of-the-art method show that the proposed method outperforms other methods.
Keywords: Arrhythmia detection, ECG beats, Local feature descriptors, Support vector machines
Introduction
Electrocardiogram (ECG) is a useful tool, which records the electrical activity of the heart. The heart’s condition is generally monitored and evaluated by the ECG signals. ECG signals are also used to determine the arrhythmias, which are necessary for the early treatment of heart failures. The ECG signals have long durations that necessitate patient, careful and talented physicians. In other words, effective computer-aided diagnosis (CAD) systems are needed for analyzing the ECG signals. In the last two decades, various CAD systems have been developed by the researchers for efficient analysis of the ECG waveforms. More specifically, in most of them, authors opted to classify the ECG beats automatically, which is a quite hard issue with human eyes where ECG beat types contain low morphological variations.
Das et al. [1] proposed an approach for the classification of the ECG beats. Five types of ECG beat namely normal, ventricular ectopic, supraventricular ectopic, fusion and unknown beats were considered in the work. The authors used two different feature extraction methods based on S-Transform and Wavelet Transform (WT), respectively. The multilayer neural networks (NN) classifier was used for the classification of the ECG beats. The authors used the MIT-BIH dataset and reported 95.70%, 78.05%, 49.60%, 89.68%, and 33.89% classification accuracies for normal, ventricular ectopic, supraventricular ectopic, fusion and unknown beats, respectively. Dong et al. [2] used deterministic learning for ECG beat classification. The authors used the dynamics of the ECG beats as features. Radial Bases function neural network (RBFNN) was used in the classification of the dynamics features. In experiments, the MIT-BIH dataset was used and a 97.78% accuracy score was reported when 5% of beats were used in training of the proposed method. Wang et al. [3] proposed an approach for ECG beat classification that was based on recurrent NN and active learning. More specifically, a global and updatable approach was presented which has three innovative steps. The experimental results showed that the proposed method improved the ECG beat classification on various datasets. Kaya et al. [4] proposed a traditional pattern recognition approach for ECG beat classification. Authors initially extracted statistical and temporal features from the ECG beats and feature reduction was achieved by using various techniques such as genetic algorithms (GA), principle component analysis (PCA) and independent component analysis (ICA). Reduced features were classified with various machine-learning techniques. The best accuracy score of 98.92% was produced by the SVM classifier. Arif et al. [5] used wavelet features in the classification of the six ECG beat types. Eleven features were extracted from the WT of the ECG beats and classified by using a k-nearest neighbor (k-NN) classifier. Then, PCA was used for dimension reduction of the feature vectors. Thus, the authors obtained six features for the classification of the ECG beats. 99.5% accuracy score was represented by the authors. Sahoo et al. [6] used the empirical mode decomposition (EMD) approach for ECG beat classification. Authors initially used WT for noise removal and then EMD used to detect the R peaks and QRS complex of ECG beats. Statistical and temporal features were extracted and classified with probabilistic NN and RBFNN. 99.54%, 99.89% classification accuracy scores were reported for probabilistic NN and RBFNN, respectively. Nurmaini et al. [7] proposed an automated approach for ECG beat classification which was based on deep learning (DL). The proposed DL approach has two consecutive stages such as deep auto-encoders and deep NN classifiers. The deep auto-encoders was used as an unsupervised form of feature learning. Authors used ten classes of imbalanced ECG beat datasets and obtained a 99.73% accuracy score. Alqudah et al. [8] used the Gaussian mixture model and wavelet analysis for the classification of the ECG beats. The wavelet technique was used for feature extraction and extracted features were reduced by using the PCA technique. Authors used PNN and Random Forest (RF) classifiers in the classification of the reduced features. The MIT-BIH dataset was used in experiments and a 99.99% accuracy score was reported. Alfaras et al. [9] used a fast machine learning technique for the classification of the ECG beats. The echo state network was used which has a low-demanding feature processing that only requires a single ECG lead. Two ECG datasets were used in experiments namely the AHA and MIT-BIH-AR and 98.5% and 97.7% accuracy scores were presented. Zubair et al. [10] used convolutional neural networks (CNN) for ECG beat classification. The MIT-BIH dataset was used in experiments and satisfactory performance was represented.
In this paper, a novel approach is presented for ECG beat classification. When literature was reviewed, it was seen that almost all approaches used various signal-processing techniques as feature extractors for subsequent ECG beat classification. Different from the existing methods, in this work, the ECG beat signals are saved as ECG beat images. It is worth to mention that these images are not obtained by using any time–frequency methods. The ECG beat snapshots are directly converted to the ECG beat images. The signal to image conversion is considered because each ECG beat has its shape. The proposed study is different from Tayel et al. [11] and Nandhini et al. [12] studies, respectively. Tayel et al. [11] proposed an intelligent diagnosis system for ECG image classification. The proposed system determined the normal and abnormal heart diseases from the ECG images. The input to the proposed system is ECG batches. Wavelets, edge detection, histogram, Fast Fourier Transform and Mean–Variance were used as features. The neural networks classifier was used for classification. Nandhini et al. [12] were also used the same approach of Tayel et al. [11] where the classifier was only replaced with probabilistic neural networks. On the other hand, in our system, the ECG beats (not ECG batches) images were classified based on local texture descriptors. The ECG beats images were initially acquired from the long ECG signal durations. Then, various local texture descriptors were employed for feature extraction. SVM classifiers were used in classification. So, the input, feature extraction and classification parts of our study are different than the reviewed studies.
Thus, image processing routines can be used for efficient feature extractors. To this end, the texture feature extraction methods are considered in the use of ECG beat classification. In particular, we aim to investigate the discrimination potential of local feature descriptors for ECG beat classification. Eight well-known local feature descriptors namely Local Binary Patterns (LBP) [13], Frequency Decoded LBP (FDLBP) [14], Quaternionic Local Ranking Binary Pattern (QLRBP) [15], Binary Gabor Pattern (BGP) [16], Local Phase Quantization (LPQ) [17], Binarized Statistical Image Features (BSIF) [18], CENsus TRansform hISTogram (CENTRIST) [19] and Pyramid Histogram of Oriented Gradients (PHOG) [20] are considered. In the classification phase of the work, the well-known machine learning method Support Vector Machines (SVM) is used. More specifically, linear, quadratic, cubic, medium and coarse Gaussian SVMs are used. In experiments, five ECG beat types are used from the MIT-BIH arrhythmia dataset. Besides, the classification accuracy is calculated. The evaluation of the proposed method is a test based on the cross-validation test. A tenfold cross-validation test is considered in the experimental works. The experimental results show that the best achievement 99.9% is obtained by PHOG local descriptors and quadratic SVM technique.
The remainder of this paper is as follows. The next section describes the proposed method. Section 2 briefly introduces the related theories. The experimental works and the results are discussed in Sect. 3. The paper is concluded in Sect. 4.
Proposed method
The illustration of the proposed method is given in Fig. 1. As seen in Fig. 1, the ECG signals are initially converted to the ECG beat images. This is handled by the annotations that were provided by the expert physicians. The ECG beat snapshots are directly saved as the ECG beat images. After obtaining the ECG beat images, a resizing procedure is applied to reduce the size of the images. The selected new size is 200 × 200. All ECG beat images are converted to the grayscale images with the following equation;
| 1 |
where, are the red, green and blue components of the ECG beat images.
Fig. 1.

The illustration of the proposed method
Eight local feature descriptors namely; LBP, FDLBP, QLRBP, BGP, LPQ, BSIF, CENTRIST and PHOG are used to extract features from the ECG beat images. In the classification phase of the work, the SVM classifiers are used. Various kernel functions such as linear, quadratic, cubic, medium and coarse Gaussians are used. After the classification stage, each test ECG beat image is labeled as one of the ECG beat types.
Local binary patterns (LBP)
LBP was proposed to encode the spatial structures of a given image [13]. LBP constructs a new image from the given image by applying a transformation operation. Let’s consider a 3 × 3 window, the LBP thresholds the neighborhood of each pixel with the center pixel’s value and considering the result as a binary number. The obtained binary numbers are then used to construct an 8 bits sequence. The center pixel’s gray tone value is re-calculated by converting the 8 bits sequence to integer number. The histogram of the encoded image is used as a feature vector. By using uniform LBP, 59-dimensional feature vector is obtained for each ECG beat image.
Binary gabor pattern (BGP)
BGP was developed to use both Gabor filters and LBP [16]. BGP is robust against the noise because it utilizes the difference between image regions instead of a difference between two pixels as in LBP. Gabor filters are used to compute the difference between regions. In other words, BGP feature descriptor is computed by convolving the image with a filter bank. Resultant convoluted responses are thresholded depending on the sign to achieve binarized vector. Then, the n-binary representation at the pixel is converted into an integer number.
Binarized statistical image features (BSIF)
BSIF uses linear filters that were learned from natural images and independent component analysis for binarization of input images [18]. The learned filters are utilized to encode every pixel as a binary string, which is used to generate a histogram as a BSIF descriptor. BSIF technique employs three steps such as the mean subtraction of patches, reducing dimensionality via PCA, and computing statistically independent filters with independent component analysis.
Census transform histogram (CENTRIST)
CENTRIST, which depends on Census Transform, is structurally similar to the LBP histogram [19]. A coding operation is in the heart of the CENTRIST where a comparison of the center pixel value with its eight neighboring pixel values in a 3 × 3 window is considered. If the center pixel’s intensity value is bigger or equal to it’s given neighbor then a bit 1 is set in the respective position, otherwise 0. The obtained binary vector from every neighbor pixel position is then transformed in a decimal number to construct a coded new image. Finally, the histogram of the new coded image is used as CENTRIST descriptor.
Pyramid of histogram of oriented gradients (PHOG)
HOG extracts local descriptors by dividing an image into the number of blocks then each block is arranged into the number of cells by combining neighborhood pixels [20]. PHOG, which is a variant of HOG, applies HOG algorithm in a pyramid fashion. The algorithm initially uses the edge detector for the extraction of the edges, which is then tessellated in smaller cells depending on the numbers of levels. The histograms of gradient orientations’ occurrences in these cells produce PHOG descriptor.
Quaternionic local ranking binary pattern (QLRBP)
QLRBP was developed for local feature extraction based on Quaternion [14]. Quaternion is a complex number, which contains three imaginary and one real part. The imaginary components of the QLRBP are used to represent the color pixels of an image. In a 3 × 3 window, a reference color pixel Í(ŕ, ǵ, b′) and a color pixel I(r, g, b) is employed to drive QLRBP operator. In the window, the Clifford Translation of Quaternionic is utilized to encode and rank the color pixels. The phase of the function is used for ranking. The phase angles are computed for all pixels in the window.
Local phase quantization (LPQ)
LPQ was developed as quantizing the Fourier Transform (FT) phase in local neighborhoods [17]. The Short Time FT (STFT) is used to analyze the pixels. After STFT, only four frequencies of directions 0°, are considered. The phase of the chosen frequencies is used as the LPQ features. The features are then quantized with the range of to provide indexes, which are finally considered in a scalar value between 0 to 255.
Frequency decoded local binary pattern (FDLBP)
Frequency Decoded LBP was developed as a special case of the LBP where the input image is gone through some filtering operations. The input image is initially filtered by the low-pass filter. Then, four high-pass filters namely horizontal–vertical difference, diagonal difference, Sobel vertical edge and Sobel horizontal edge are used to filtering the low-pass filtered image. The LBP operation is applied to the filtered images to obtain the LPB codes. The relationship among different frequency filtered images is calculated by using two encoders and the FDLBP features are obtained by using the histogram operation.
Experimental works and results
All experiments were run on a workstation equipped with the NVIDIA Quadro M4000 GPU and Intel(R) Xeon(R) CPU E5-1650 @3.60 GHz 64 GB memory using the MATLAB (R2018b). The MIT-BIH arrhythmia database was used in experimental works. Especially, the five-beat types namely normal beats (N), left-bundle-branch-blocks beats (LBBB), right-bundle-branch-blocks beats (RBBB), premature-ventricular-contractions beats (PVC) and paced-beats (PB) were used in classification stage of the work [2]. The MIT-BIH arrhythmia database contains 40 ECG records and all records were used to evaluate the proposed method. No pre-processing such as denoising or subsampling was applied to the ECG signals.
The ECG signals were converted to the ECG images by using the annotations that were prepared by the experts. A MATLAB code was used in signal-to-image conversion that was written by us. All obtained images were then resized to 200 × 200 and were converted to grayscale images. Figure 2 shows the obtained images.
Fig. 2.
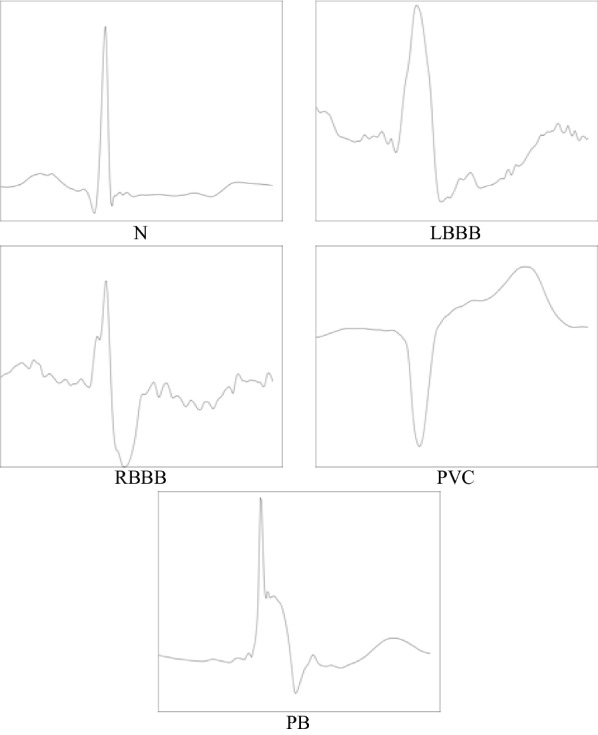
The obtained five types of beat images
For alleviating the imbalance problem of the ECG beat types, randomly selected 1000 samples from each ECG type were used in the initial experiment. Thus, a total of 5000 ECG beat samples were used in the first experiment. The performance of the proposed method was evaluated by using the accuracy score. The accuracy was calculated as the ratio of the number of correctly classified samples to the number of all samples. Tenfold cross-validation test was applied in all experiments and average accuracy scores were calculated. Five SVM methods namely linear SVM, quadratic SVM, cubic SVM, medium Gaussian SVM and coarse Gaussian SVM were used in classification. In linear SVM, the linear kernel function was used and the epsilon value of the SVM method was set to 0.01. In quadratic SVM, the quadratic function was used as kernel function and the epsilon value was set to 0.2. The Cubic kernel function was used in cubic SVM and the epsilon value was assigned to 0.02. For both medium and coarse Gaussian SVMs, the Gaussian kernel function was used and the epsilon parameters set to 0.1 and 0.2, respectively.
In Table 1, the performance comparison between the local feature descriptors and SVM classifiers were reported in term of accuracy. The last column of Table 1 shows the average accuracy score of the local texture descriptors. According to the represented results in Table 1, various observations can be extracted. For example, the BGP local texture descriptor obtained the highest average classification accuracy score, where the calculated accuracy score was 99.72%. In other words, BGP method outperformed other used local feature descriptors. And, quadratic SVM technique outperformed other SVM classifiers where the obtained average accuracy score was 99.0875%. LBP approach produced a 97.46% average accuracy score, which was the second-worst score. Quadratic and Cubic SVM methods produced the 98.1% accuracy scores with LBP features that were the highest among all other accuracy scores obtained with the LBP features. As mentioned earlier, the BGP local descriptors produced high accuracy scores with almost all SVM classifiers. The produced accuracy scores were in the range of 99.6% and 99.8%. As BGP produced the high results, we opted to give some illustrations about the BGP features and results. Figure 3 shows the distribution of the BGP features. While the x-axis shows the first column of the BGP feature vector, the y-axis shows the second column of the BGP feature vector. The color shows the types of ECG beat. Besides, Fig. 4 shows the confusion matrix that was obtained by the BGP features and the quadratic SVM classifier. As seen in Figs. 2 and 4 of the N beats, 1 of the LBBB, RBBB and PB were wrongly classified as PVC and 4 of the PVC beats were wrongly classified as other ECG types. Only one misclassified ECG beat BSIF features were also produced better achievements where the accuracy scores were ranging between 98.9 and 99.8%. The average accuracy score with BSIF was 99.50%, which is the second-best performance. CENTRIST technique produced accuracy scores between 96.4 and 98.4%. The calculated average accuracy score was 97.50%, which was the third-worst score. PHOG features produced the third-best average accuracy score. The obtained score was 99.30%. LPQ technique produced similar achievements with PHOG and BSIF techniques, where the average accuracy score was 99.24%. The highest accuracy score of 99.5% was produced by the LPQ and quadratic SVM techniques. As FDLBP technique is an improved version of the LBP technique, its achievement was better than the LBP, where the average accuracy score was 98.68%. FDLBP technique produced accuracy scores in the range of 97.4% and 99.3%.
Table 1.
The obtained results for first experiment by using local feature descriptors and SVM classifiers
| Linear SVM | Quadratic SVM | Cubic SVM | Medium gaussian SVM | Coarse gaussian SVM | Average accuracy (%) | |
|---|---|---|---|---|---|---|
| LBP | 97.6% | 98.1% | 98.1% | 97.1% | 96.4% | 97.46 |
| BGP | 99.7% | 99.8% | 99.8% | 99.7% | 99.6% | 99.72 |
| BSIF | 99.8% | 99.7% | 99.6% | 98.9% | 99.5% | 99.50 |
| CENTRIST | 97.9% | 98.4% | 98.3% | 96.4% | 96.5% | 97.50 |
| PHOG | 99.6% | 99.7% | 99.6% | 98.4% | 99.2% | 99.30 |
| LPQ | 99.3% | 99.5% | 99.4% | 99.1% | 98.9% | 99.24 |
| FDLBP | 99.3% | 99.2% | 99.0% | 98.5% | 97.4% | 98.68 |
| QLRBP | 97.5% | 98.3% | 98.1% | 97.1% | 94.2% | 97.04 |
| Average accuracy (%) | 98.8375 | 99.0875 | 98.9875 | 98.1500 | 97.7125 |
Fig. 3.

The distribution of the BGP features. The first vs second features are plotted. The color shows the type of ECG beat
Fig. 4.

The confusion matrix of the BGP features and quadratic SVM classifier
The best accuracy score 99.3% of FDLBP technique was produced by the Linear SVM method. Finally, it was observed that the worst average accuracy score of 97.04% was produced by the QLRBP technique. Besides, the accuracy scores, which were obtained by the QLRBP, were in the range of 94.2% and 98.3%. It is worth mentioning that the worst accuracy score of 94.2% was also produced by the QLRBP method.
In our second experiment, randomly selected 10,000 ECG beat samples were used, where each beat type has 2000 samples. The obtained accuracy scores were tabulated in Table 2. Similar to Table 1, the last column and last row show the average achievements of the local feature descriptors and SVM classifiers, respectively. A tenfold cross-validation technique was also used in the second experiment. As the number of samples was increased, the subsequent performance of the proposed methods was also improved. As Table 2 was analyzed, it was seen that some observations were similar to the observations that were extracted from Table 1. For example, the BGP method outperformed other considered local feature descriptors. And, quadratic SVM technique outperformed other SVM classifiers where the obtained average accuracy score was 99.1750%. The highest accuracy score of 99.9% was produced by the PHOG local descriptors and the worst accuracy score 94.9% was produced by the QLRBP method. The LBP descriptors produced accuracy scores in the range of 96.4% and 98.3 and the average accuracy score was 97.72%. This score was the second-worst score among all average accuracy scores. BGP technique produced accuracy scores in the range of 99.7% and 99.8% where the average accuracy was 99.78%. BSIF produced 99.44% average accuracy score, which was the third-highest average accuracy score and the accuracy scores of BSIF method, were in the range of 98.8% and 99.7%. 97.92% average accuracy score was produced by CENTRIST features and the accuracy range covered 96.9% and 98.6%. PHOG features produced the second-highest average accuracy score, where the score was 99.54%. LPQ local descriptors produced similar scores to PHOG method where the average accuracy score was 99.34%. This score was also the highest fourth score among all descriptors. FDLBP produced a 98.94% average accuracy score. Quadratic and cubic SVM techniques produced 98.4% accuracy scores with FDLBP features. Similar to Table 1, the QLRBP produced a 97.38% average accuracy score, which was the worst among all methods.
Table 2.
The obtained results for the second experiment by using local feature descriptors and SVM classifiers
| Linear SVM | Quadratic SVM | Cubic SVM | Medium gaussian SVM | Coarse gaussian SVM | Average accuracy (%) | |
|---|---|---|---|---|---|---|
| LBP | 97.9% | 98.3% | 98.3% | 97.7% | 96.4% | 97.72 |
| BGP | 99.8% | 99.8% | 99.8% | 99.8% | 99.7% | 99.78 |
| BSIF | 99.7% | 99.6% | 99.6% | 98.8% | 99.5% | 99.44 |
| CENTRIST | 98.4% | 98.6% | 98.5% | 96.9% | 97.2% | 97.92 |
| PHOG | 99.8% | 99.9% | 99.8% | 98.8% | 99.4% | 99.54 |
| LPQ | 99.4% | 99.5% | 99.5% | 99.2% | 99.1% | 99.34 |
| FDLBP | 99.3% | 99.3% | 99.1% | 98.7% | 98.3% | 98.94 |
| QLRBP | 97.8% | 98.4% | 98.4% | 97.4% | 94.9% | 97.38 |
| Average accuracy (%) | 99.0125 | 99.1750 | 99.1250 | 98.4125 | 98.0625 |
We also compared the obtained results with state-of-the-art results. Table 3 shows the comparisons. Thomas et al. [21] used dual-tree-complex WT and multi-layered NN for the classification of cardiac arrhythmias. Kaur et al. [22] used wavelet coefficients and feature reduction methods for efficient cardiac dysfunctions classification. Rai et al. [23] used Daubechies WT and RBFNN for five types of ECG beat classification. Khalaf et al. [24] used spectral correlation and SVM classifiers for cardiac arrhythmia classification.
Table 3.
Performance comparison of the proposed method with some state-of-the-art methods
From Table 3, it is observed that the proposed method outperformed other state-of-the-art methods. Rai et al. [23] produced the second-best classification accuracy score where the calculated achievement was 99.60%. Kaur et al. [22] also produced the 99.06% accuracy score. Khalaf et al. [24], Dong et al. [2] and Thomas et al. [22] produced 98.60%, 97.78% and 97.68% accuracy scores, respectively.
The first experiment was re-run by using various classifiers namely, linear discriminant, tree, k-nearest neighbor (k-NN) where k was set to 3 and Naïve Bayes classifiers [25]. MATLAB classification learner tool was used to obtain the results. Table 4 shows the obtained results.
Table 4.
The obtained results for the second experiment by using local feature descriptors and other classifiers
| Linear discriminant | Tree | k-NN | Naïve bayes | Average accuracy (%) | |
|---|---|---|---|---|---|
| LBP | 97.4% | 92.1% | 93.4% | 94.4% | 94.32 |
| BGP | 99.4% | 96.5% | 98.7% | 98.0% | 98.15 |
| BSIF | 98.2% | 98.2% | 97.3% | 97.0% | 97.67 |
| CENTRIST | 97.3% | 96.2% | 83.6% | 92.1% | 92.30 |
| PHOG | 98.7% | 97.6% | 99.5% | 93.4% | 97.30 |
| LPQ | 99.1% | 97.7% | 98.4% | 98.7% | 98.47 |
| FDLBP | 96.2% | 95.8% | 81.9% | 96.5% | 92.60 |
| QLRBP | 97.3% | 95.4% | 93.0% | 93.4% | 94.77 |
| Average accuracy (%) | 97.95 | 96.18 | 93.22 | 95.43 |
When the calculated average accuracy scores for the classifiers were examined, it was seen that the linear discriminant classifier produced a 97.95% average accuracy score. This score was the better than the scores that were obtained by the tree, k-NN and Naïve Bayes classifiers. Tree, k-NN and Naïve Bayes classifiers produced 96.18%, 93.22%, and 95.43% average accuracy scores, respectively. When the local texture descriptor’s achievements were examined, it was seen that LPQ produced the 98.47% average accuracy score, which the highest among all local texture descriptor’s achievements. Besides, the BGP produced the second-best average accuracy score. If the results in Tables 1 and 4 were compared, it was seen that the SVM classifiers' performances were better than the linear discriminant, tree, k-NN and Naïve Bayes classifiers.
Besides, the ROC curve and AUC values were plotted for BGP features with each classifier. The related ROC curve plots and AUC values were given in Fig. 5. The calculated AUC scores for Tree, linear discriminant, k-NN Naïve Bayes and linear SVM were 0.99, 1.00, 0.99, 1.00 and 1.00, respectively.
Fig. 5.

The ROC curves and AUC values of the BGP features and all classifiers
Conclusions
In this paper, an efficient approach was proposed for ECG beat type classification. The proposed approach was different from the signal processing based approaches, where ECG beats were initially converted into ECG beat images and image-processing routines were applied for feature extraction. The well-known SVM techniques were used with linear, quadratic, cubic and Gaussian kernel functions. Experiments were conducted with 5000 and 10,000 ECG beat samples, respectively that were classified into five ECG beat types. The classification accuracy was calculated as the performance measure of the proposed study. From the experiments the following conclusions were extracted;
When the 10,000 ECG beat samples were used in experiments, the obtained accuracy scores were better than the accuracy scores that were obtained with 5000 ECG beat samples.
From the experiments, it was seen that the best average accuracy score was obtained for BGP local descriptors and the best accuracy score was obtained with PHOG local features and Quadratic SVM classifier.
As LBP, CENTRIST and FDLBP have similar conceptual structures, their achievements were quite close [26].
The comparison of the proposed method with the state-of-the-art methods revealed that the proposed method has the potential in the use of various ECG based disease detection applications.
In the future works, other local descriptors will be considered for ECG beat type classification. The concatenation of the local descriptors and feature selection mechanism will be investigated. Other machine learning techniques achievements will be considered in our future works. These local feature descriptors will be used on other signals such as EMG and EEG [27]. The proposed method was applied to an offline dataset. However, the save weights of the classifier and the algorithm can be used to construct a smartphone application. The proposed system can be embedded in an ECG system for intelligent analysis of the ECG beats.
Footnotes
Publisher's Note
Springer Nature remains neutral with regard to jurisdictional claims in published maps and institutional affiliations.
Contributor Information
Daban Abdulsalam Abdullah, Email: daban.abdulsalam@spu.edu.iq.
Muhammed H. Akpınar, Email: muhammedakpinr@gmail.com
Abdulkadir Şengür, Email: ksengur@firat.edu.tr.
References
- 1.Das MK, Ari S. ECG beats classification using mixture of features. Int Scholar Res Not. 2014;2014:12. doi: 10.1155/2014/178436. [DOI] [PMC free article] [PubMed] [Google Scholar]
- 2.Dong Wang Si XCW. ECG beat classification via deterministic learning. Neurocomputing. 2017;240:1–12. doi: 10.1016/j.neucom.2017.02.056. [DOI] [Google Scholar]
- 3.Wang G, Zhang C, Liu Y, Yang H, Fu D, Wang H, Zhang P. A global and updatable ECG beat classification system based on recurrent neural networks and active learning. Inf Sci. 2019;501:523–542. doi: 10.1016/j.ins.2018.06.062. [DOI] [Google Scholar]
- 4.Kaya Y, Pehlivan H, Tenekeci ME. Effective ECG beat classification using higher order statistic features and genetic feature selection. Biomed Res. 2017;28(17):7594–7603. [Google Scholar]
- 5.Arif M. Robust electrocardiogram (ECG) beat classification using discrete wavelet transform. Physiol Meas. 2008;29(5):555. doi: 10.1088/0967-3334/29/5/003. [DOI] [PubMed] [Google Scholar]
- 6.Sahoo S, Mohanty M, Behera S, Sabut SK. ECG beat classification using empirical mode decomposition and mixture of features. J Med Eng Technol. 2017;41(8):652–661. doi: 10.1080/03091902.2017.1394386. [DOI] [PubMed] [Google Scholar]
- 7.Nurmaini S, Umi Partan R, Caesarendra W, Dewi T, Naufal Rahmatullah M, Darmawahyuni A, Firdaus F. An automated ECG beat classification system using deep neural networks with an unsupervised feature extraction technique. Appl Sci. 2019;9(14):2921. doi: 10.3390/app9142921. [DOI] [Google Scholar]
- 8.Alqudah AM, Albadarneh A, Abu-Qasmieh I, Alquran H. Developing of robust and high accurate ECG beat classification by combining Gaussian mixtures and wavelets features. Australas Phys Eng Sci Med. 2019;42(1):149–157. doi: 10.1007/s13246-019-00722-z. [DOI] [PubMed] [Google Scholar]
- 9.Alfaras M, Soriano MC, Ortín S. A fast machine learning model for ECG-based heartbeat classification and arrhythmia detection. Front Phys. 2019;7:103. doi: 10.3389/fphy.2019.00103. [DOI] [Google Scholar]
- 10.Zubair M, Kim J, Yoon C. An automated ECG beat classification system using convolutional neural networks. In: 2016 6th international conference on IT convergence and security (ICITCS), pp. 1–5. IEEE; 2016
- 11.Tayel MB, El-Bouridy ME. ECG images classification using artificial neural network based on several feature extraction methods. In: 2008 International Conference on Computer Engineering & Systems, Cairo, pp. 113–115; 2018
- 12.Nandhini R, Subhasini P. Classification of ECG images using probabilistic neural network based on statistical feature analysis. In: Proceedings of the Fourth International Conference on Signal and Image Processing 2012 (ICSIP 2012), pp. 535–544. Springer, India; 2012
- 13.Ahonen T, Hadid A, Pietikainen M. Face description with local binary patterns: application to face recognition. IEEE Trans Pattern Anal Mach Intell. 2006;28(12):2037–2041. doi: 10.1109/TPAMI.2006.244. [DOI] [PubMed] [Google Scholar]
- 14.Dubey SR. Face retrieval using frequency decoded local descriptor. Multimed Tools Appl. 2019;78(12):16411–16431. doi: 10.1007/s11042-018-7028-8. [DOI] [Google Scholar]
- 15.Lan R, Zhou Y, Tang YY. Quaternionic local ranking binary pattern: a local descriptor of color images. IEEE Trans Image Process. 2016;25(2):566–579. doi: 10.1109/TIP.2015.2507404. [DOI] [PubMed] [Google Scholar]
- 16.Zhang L, Zhou Z, Li H. Binary Gabor pattern: an efficient and robust descriptor for texture classification. In: IEEE international conference on image processing, pp. 81–84; 2012
- 17.Ojansivu V, Heikkila J. Blur insensitive texture classification using local phase quantization. In: International conference on image and signal processing, pp. 236–243; 2008.
- 18.Kannala J, Rahtu E. BSIF: Binarized statistical image features. In: International conference on pattern recognition, pp. 1363–1366; 2012.
- 19.Wu J, Rehg JM. CENTRIST: a visual descriptor for scene categorization. IEEE Trans Pattern Anal Mach Intell. 2011;33(8):1489–1501. doi: 10.1109/TPAMI.2010.224. [DOI] [PubMed] [Google Scholar]
- 20.Bosch A, Zisserman A, Munoz X. Representing shape with a spatial pyramid kernel. ACM International Conference on Image and video retrieval, pp. 401–408; 2007.
- 21.Thomas M, Das MK, Ari S. Automatic ecg arrhythmia classification using dual tree complex wavelet based features. AEU-Int J Electr Commun. 2015;69(4):715–721. doi: 10.1016/j.aeue.2014.12.013. [DOI] [Google Scholar]
- 22.Kaur M, Arora A. Classification of ecg signals using LDA with factor analy- sis method as feature reduction technique. J Med Eng Technol. 2012;36(8):411–420. doi: 10.3109/03091902.2012.702851. [DOI] [PubMed] [Google Scholar]
- 23.Rai H, Trivedi A, Chatterjee K, Shukla S. R-peak detection using daubechies wavelet and ecg signal classification using radial basis function neural net- work. J Inst Eng India Ser B. 2014;95(1):63–71. doi: 10.1007/s40031-014-0073-4. [DOI] [Google Scholar]
- 24.Khalaf AF, Owis MI, Yassine IA. A novel technique for cardiac arrhythmia classification using spectral correlation and support vector machines. Exp Syst Appl. 2015;42(21):8361–8368. doi: 10.1016/j.eswa.2015.06.046. [DOI] [Google Scholar]
- 25.Şengür D, Turhan M. Prediction of the action identification levels of teachers based on organizational commitment and job satisfaction by using k-nearest neighbors method. Fırat Univ Turkish J Sci Technol. 2018;13(2):61–68. [Google Scholar]
- 26.Akhtar Z, Dasgupta D. A comparative evaluation of local feature descriptors for deepfakes detection. In: IEEE international symposium on technologies for homeland security; 2019.
- 27.Deniz E, Şengür A, Kadiroğlu Z, Guo Y, Bajaj V, Budak Ü. Transfer learning based histopathologic image classification for breast cancer detection. Health Inf Sci Syst. 2018;6(1):18. doi: 10.1007/s13755-018-0057-x. [DOI] [PMC free article] [PubMed] [Google Scholar]