

Abstract
Background and aims:
Leukocytosis, particularly monocytosis, has been shown to promote atherosclerosis in both diabetic and non-diabetic mouse models. We previously showed that hyperglycemia independently promotes monocytosis and impairs the resolution of atherosclerosis. Since patients with chronic diabetes often develop dyslipidemia and also have increased risk for atherosclerosis, we sought to examine how controlling blood glucose affects atherosclerosis development in the presence of severe hyperlipidemia.
Methods:
Diabetes was induced using streptozotocin (STZ) in low density lipoprotein receptor (Ldlr) knockout (Ldlr−/−) mice after which they were fed a high-cholesterol diet for 4 weeks. Control and diabetic mice were treated with vehicle or sodium glucose cotransporter inhibitor (SGLT2i, Phlorizin or Dapagliflozin) for the duration of the diet.
Results:
Induction of diabetes resulted in a dramatic increase in plasma cholesterol (TC) and triglyceride (TG) levels. These mice also exhibited an increased number of circulating monocytes and neutrophils. Monocytosis was driven by increased proliferation of progenitor cells in the bone marrow. Tighter glycemic control by SGLT2i treatment not only reduced monocytosis and atherosclerosis but also improved plasma lipoprotein profile. Interestingly, improved lipoprotein profile was not due to decreased TG synthesis or clearance via low density lipoprotein receptor-related protein (Lrp) 1 or scavenger receptor class B member (Scarb1) Pathways, but likely mediated by heparin sulfate proteoglycans (HSPG)-dependent clearance mechanisms in the liver. Further examination of the liver revealed an important role for bile acid transporters (Abcg5, Abcg8) and cytochrome P450 enzymes in the clearance of hepatic cholesterol.
Conclusions:
These data suggest that tighter glycemic control in diabetes can improve lipoprotein clearance exclusive of Ldlr, likely via HSPG and bile acid pathways and, has an overall net positive effect on atherosclerosis.
1. Introduction
Diabetes is one of the most potent risk factors for atherosclerotic cardiovascular disease (CVD). Additionally, patients with CVD and diabetes are, some of the most vulnerable subjects, who suffer from recurrent cardiac events [1]. Whether this is due to changes in atherogenesis secondary to hyperglycemia, hyperlipidemia or other vascular toxicities such as defective insulin action is still a subject of intense debate [2]. Animal models linking diabetes with atherosclerosis have been studied for decades but these studies are complicated due to associated changes in plasma lipids [2, 3] that sometimes mask any direct effects of hyperglycemia on mouse arteries. Moreover, lipids themselves might have a number of untoward effects such as causing greater lesional hemorrhage, a finding in diabetic mice that was reduced by correction of hypertriglyceridemia [4]. Diabetic models created using streptozotocin (STZ) or viral destruction of islets [3] have both hyperglycemia and insulin deficiency, each of which may have effects on vascular cells and inflammation [5]. For example, lack of insulin receptors in myeloid cells reduced atherosclerosis in Apoe−/− mice, a finding associated with decreased cellular inflammation [6]. In contrast, endothelial insulin receptor deficiency increased atherosclerosis [7]. Similarly, hyperglycemia alone [8] or in combination with free fatty acids [9], lipoprotein oxidation [10] and advanced glycation end product (AGE) formation [11, 12] promotes inflammation, and in some cases correlates with more severe forms of atherosclerosis. Thus, in the setting of diabetes at least three major changes in whole body metabolism; hyperglycemia, reduced insulin actions, and hyperlipidemia, are involved in atherosclerosis [2].
The Diabetes Control and Complications Trial (DCCT)/Epidemiology of Diabetes Interventions and Complications (EDIC) is a landmark study that specifically examined the effects of hyperglycemia on vascular disease in type I diabetes (T1D) and over the years has convincingly demonstrated that tighter glucose control favorably alters macrovascular disease independent of changes in blood pressure or lipids [13]. Furthermore, in a recent clinical trial investigating the effects of sodium-glucose co-transport-2 inhibition (SGLT2i), there was a significant improvement in CVD [14, 15]. In line with this clinical study, we and others also reported that in animal models of T1D, hyperglycemia alone can impair the resolution of atherosclerosis either by enhancing the production of monocytes and/ or adversely affecting the polarization of lesional macrophages [16, 17]. However, these studies were conducted mainly in the context of atherosclerotic lesion regression and did not address the other important clinical scenario of lesion progression, which is mainly influenced by dyslipidemia [18] and hyperglycemia [3].
Mice with a genetic deficiency of LDL receptors (Ldlr−/−) coupled with a high cholesterol-rich diet allow sufficient hyperlipidemia for development of atherosclerotic lesions [3, 19]. A seminal study by Bornfeldt group examining the specific role of diabetes and diabetes-associated lipid abnormalities in Ldlr−/− mice found distinct effects on the initiation and progression of atherosclerosis [3]. Diabetes in Ldlr−/− mice fed a cholesterol-free diet caused both accelerated lesion initiation and increased macrophage burden [20]. On the other hand, diabetic mice fed with cholesterol-rich diet displayed severe hypercholesterolemia and advanced lesions, suggesting that diabetes-induced dyslipidemia could accelerate atherosclerosis towards a more advanced and severe phenotype. Hyperlipidemic diabetic and non-diabetic mice with similar plasma cholesterol levels demonstrated a comparable level of atherosclerosis [21]. Thus, it appeared that the severe hyperlipidemia was able to swamp out hyperglycemia-driven progression of atherosclerosis.
Ldlr−/− mice display severe hypercholesterolemia in the setting of islet destruction when fed with a high cholesterol diet [3, 19]. The reasons for this are not clear but could reflect either or a combination of the following; A) reduced lipoprotein clearance pathways through LDL receptor–related protein (Lrp) and/ or scavenger receptors; B) increased lipoprotein production; C) reduced liver trapping associated with reduced heparan sulfate proteoglycan production (HSPG) [2, 20, 22]. In order to examine the factors associated with diabetes-mediated hypercholesterolemia, we created diabetes in Ldlr−/− mice using STZ and studied the effect of glucose reduction using sodium glucose cotransporter inhibitors (SGLT, phlorizin or dapagliflozin) on dyslipidemia and the ensuing atherosclerosis. Currently, there is a lack of information as to how this class of drugs can alter atherogenesis via altered lipid metabolism. In light of this, we specifically focused on the mechanisms involved in lipoprotein clearance by HSPGs because we previously had observed that decreased sulfation of HSPGs by N-deacetylase/ N-sulfotransferase-1 (Ndst1) was associated with defective lipoprotein clearance in Ldlr−/− mice with STZ-diabetes [20]. We hypothesized that maintenance of euglycemia preserves the function of hepatic HSPGs and thus improved clearance of lipoproteins in Ldlr−/− mice with T1D.
2. Materials and methods
2.1. Animals
Male, 10–12 week old Ldlr−/− (B6.129S7-Ldlrtm1Her) mice on C57BL6 background were purchased from The Jackson Laboratory. Mice were maintained in a temperature-controlled (25°C) facility with a 12-h light/dark cycle and given free access to food and water, except when fasting blood specimens were obtained. Diabetes was induced by streptozotocin (STZ) according to the AMDCC protocol (50 mg/kg body weight intraperitoneally for 5 days) and one week after the last injection of STZ, the Ldlr−/− mice were placed on a cholesterol rich diet (0.15% cholesterol; catalog no. D01061401; Research Diets Inc.,) for 4 weeks. Phlorizin treatment was started on the same day of diet. Phlorizin was administered subcutaneously at a dose of 400 mg/kg/ twice daily for 4 weeks [23]. A group of control and diabetic mice received vehicle (10% DMSO, 15% alcohol and 75% saline). In a separate study, diabetic and non-diabetic Ldlr−/− mice on cholesterol rich diet were treated with dapagliflozin, a specific SGLT2 inhibitor at 25 mg/kg b.w for 4 weeks in drinking water. Unless indicated, reversal of hyperglycemia was achieved mainly by using phlorizin. All protocols were approved by the Animal Care and Use Committee of Columbia University and followed the Guide for the Care and Use of Laboratory Animals.
2.2. Metabolic and vascular characterization
Mice were caged individually and treated with either phlorizin or vehicle, as described above. The amount of food in the feeding container was measured once every 2 days. Food intake was normalized to body weight of each mouse and was expressed as g/ day. Plasma samples were obtained from 6-h–fasted mice. Blood glucose was measured directly from the tail tip using a One Touch Ultra 2 glucose monitoring system (Lifescan, Johnson & Johnson, USA). Total cholesterol and triglycerides (TG) levels in the plasma were measured using colorimetric assays (Wako Diagnostics). Plasma insulin was measured by ELISA (using kits from ALPCO Immunoassays) as per the manufacturer’s instructions. For lipoprotein analysis, VLDL [density 1.006 g/ml], intermediate-density lipoprotein plus LDL [density 1.006–1.063 g/ml], and HDL [density 1.063–1.21 g/ml], were separated by sequential density ultracentrifugation of plasma in a TLA100 rotor (Beckman Coulter, Brea, CA, USA) followed by colorimetric analysis of cholesterol and TG levels. For atherosclerotic lesion analysis, serial frozen sections of proximal aortic roots were prepared and stained with H&E for quantification of lesion size as previously described [17]. Oil Red O staining was employed for lipid quantification while CD68 staining was used to assess macrophages in lesions of the proximal aortic root. En face analysis was performed to quantify lipids in atherosclerotic plaques of aortic arch. Quantification was performed using either Image J, Image Pro Plus or Adobe Photoshop CS5.
2.3. Flow cytometry
For identification of monocytes and neutrophils from whole blood the following strategy was employed. Blood was drawn via tail bleeding and collected into EDTA lined tubes and immediately placed on ice. All following steps were performed on ice. RBCs were lysed (BD PharmLyse, BD Bioscience) and WBCs were centrifuged, washed and resuspended in HBSS (0.1% BSA w/v, 5mM EDTA). Cells were stained with a cocktail of antibodies against CD45-APC-Cy7, Ly6-C/G-PerCP-Cy5.5 (BD Pharmigen), CD115-APC and CD11b-FITC (eBioscience). Samples were analyzed on an LSR-II (BD Biosciences) flow cytometer. Monocytes were identified as CD45hiCD115hi and further classified into Ly6-Chi and Ly6-Clo subsets. Neutrophils were identified as CD45hiCD115loLy6-C/Ghi (Gr-1). The mean fluorescence intensity of CD11b on the surface of monocytes and neutrophils was measured as marker of activation [17, 24]. Total WBC counts were obtained from freshly drawn blood via tail bleeding and quantified using the FORCYTE Veterinary Analyzer (Oxford Science Inc, Oxford, CT, USA). For identification of BM HSPCs, bone marrow was harvested from the femurs and tibias by flushing with ice cold PBS on a 40-μm cell strainer over a 50-ml centrifuge and subjected to brief RBC lysis. BM was suspended in HBSS (BSA/ EDTA) and incubated with a cocktail of antibodies to lineage committed cells (CD45R, CD19, CD11b, CD3e, TER-119, CD2, CD8, CD4, Ly-6G: All FITC, eBioscience), Sca1-Pacific Blue, ckit-APC Cy7. Where further identification of progenitor subsets was required, antibodies to CD16/CD32 (FcγRII/III), CD34 to separate CMP (lin−, Sca1−, ckit+, CD34int, FcγRII/IIIint), GMP (lin−, Sca1−, ckit+, CD34int, FcγRII/IIIhi) and MEP (lin−, Sca1−, ckit+, CD34lo, FcγRII/IIIlo). HSPCs were identified as lin−, Sac1+ and ckit+ cells and analyzed using LSRII flow cytometer (BD Biosciences, NJ, USA) with FACS DiVa software. Data were analyzed using FlowJo software (Tree Star Inc.) For identification of HSPCs in the splenic tissues, spleens were weighed and minced into small pieces using a pair of scissors followed by manual disruption on a 40-μm cell strainer over a 50-ml centrifuge tube using a syringe piston. The single cell suspension was washed with PBS and cells collected via centrifugation (300g, 5 min) and subject to a brief RBC lysis. HSPCs and progenitor cells were analyzed by flow cytometry as described above.
2.4. Tissue collection, RNA isolation, cDNA synthesis, qRT-PCR and Western blotting
When the mice were killed, hearts were perfused with 10 ml ice cold PBS. Adequacy of the perfusion was evident from blanching of the livers. Tissues were removed and immediately frozen in liquid nitrogen. Total RNA from BM and liver was extracted using RNeasy Micro kit (Qiagen) and cDNA synthesized using SuperScript VILO (Invitrogen). qRT-PCR was monitored in real time with an Mx3000 sequence detection system (Stratagene, San Diego, CA, USA) using SYBR Green (Agilent Technologies). Samples were normalized against 18 s. For Western blotting, total protein extracts were prepared from liver samples for detection of Scarb1, and Lrp. Protein extracts were electrophoresed on 4–20% gradient SDS-PAGE gels and transferred to 0.22 μm nitrocellulose membranes. The membrane was blocked in Tris-buffered saline, 0.1% Tween20 containing 5%(w/v) nonfat milk (TBST) at room temperature (RT) for 1h and then incubated with the primary antibody in TBST at RT for 4h, followed by incubation with the appropriate secondary antibody coupled to horseradish peroxidase. Proteins normalized to GAPDH were detected by ECL chemiluminescence (Pierce) and quantified by densitometry using image J software.
2.5. Statistics
Data are presented as mean± SEM. Statistical significance was performed by one-way analysis of variance (ANOVA, 4-group comparisons) with a Bonferroni multiple comparison post-test (GraphPad Prism, San Diego, CA). Statistical significance was defined by a p-value less than 0.05.
3. Results
3.1. Maintenance of euglycemia improves plasma lipoprotein levels in Ldlr−/− mice
To explore the effects of hyperglycemia on plasma lipoproteins, Ldlr−/− mice were made diabetic with STZ and fed with a high cholesterol diet (0.15%, fat free) for 4 weeks. We excluded fat from the diet to prevent any confounding effect of insulin resistance in the non-diabetic groups. We chose to feed the Ldlr−/− mice, a high cholesterol diet to promote hypercholesterolemia, a prerequisite for atherogenesis in this model. Moreover, the high cholesterol diet allowed us to determine the effect of glucose lowering (with PZ treatment) on atherosclerotic lesion progression in a condition of dyslipidemia that is often observed in diabetic subjects. Only those mice with a fasting glucose of >300mg/dl (1 mmol/l = mg/dl /18) were considered diabetic and used in the study. Induction of diabetes in Ldlr−/− mice produced severe but characteristic symptoms of T1D including hyperglycemia, hypoinsulinemia, hypertriglyceridemia, hypercholesterolemia and decreased body weight (Fig.1). As expected the body weights were consistently lower (Fig. 1A) with higher blood glucose levels (Fig. 1B) and greater food intake (Fig. 1E) compared to non-diabetic mice. After 4 weeks of diabetes, the plasma cholesterol (Fig. 1C) and triglyceride levels (Fig. 1D) in diabetic Ldlr−/− mice were more than double compared to non-diabetic littermates. Treatment of diabetic mice with phlorizin normalized blood glucose by week 1 and maintained euglycemia for rest of the treatment period (Fig. 1B). Treatment with phlorizin also led to greater body weight gain in diabetic mice, even though food intake was normalized. Control of blood glucose also significantly decreased plasma total cholesterol (TC) and triglycerides (TGs) without affecting insulin levels (Fig. 1F). This is in contrast to WT mice with STZ diabetes that do not display significant changes in cholesterol levels [25].
Fig. 1.
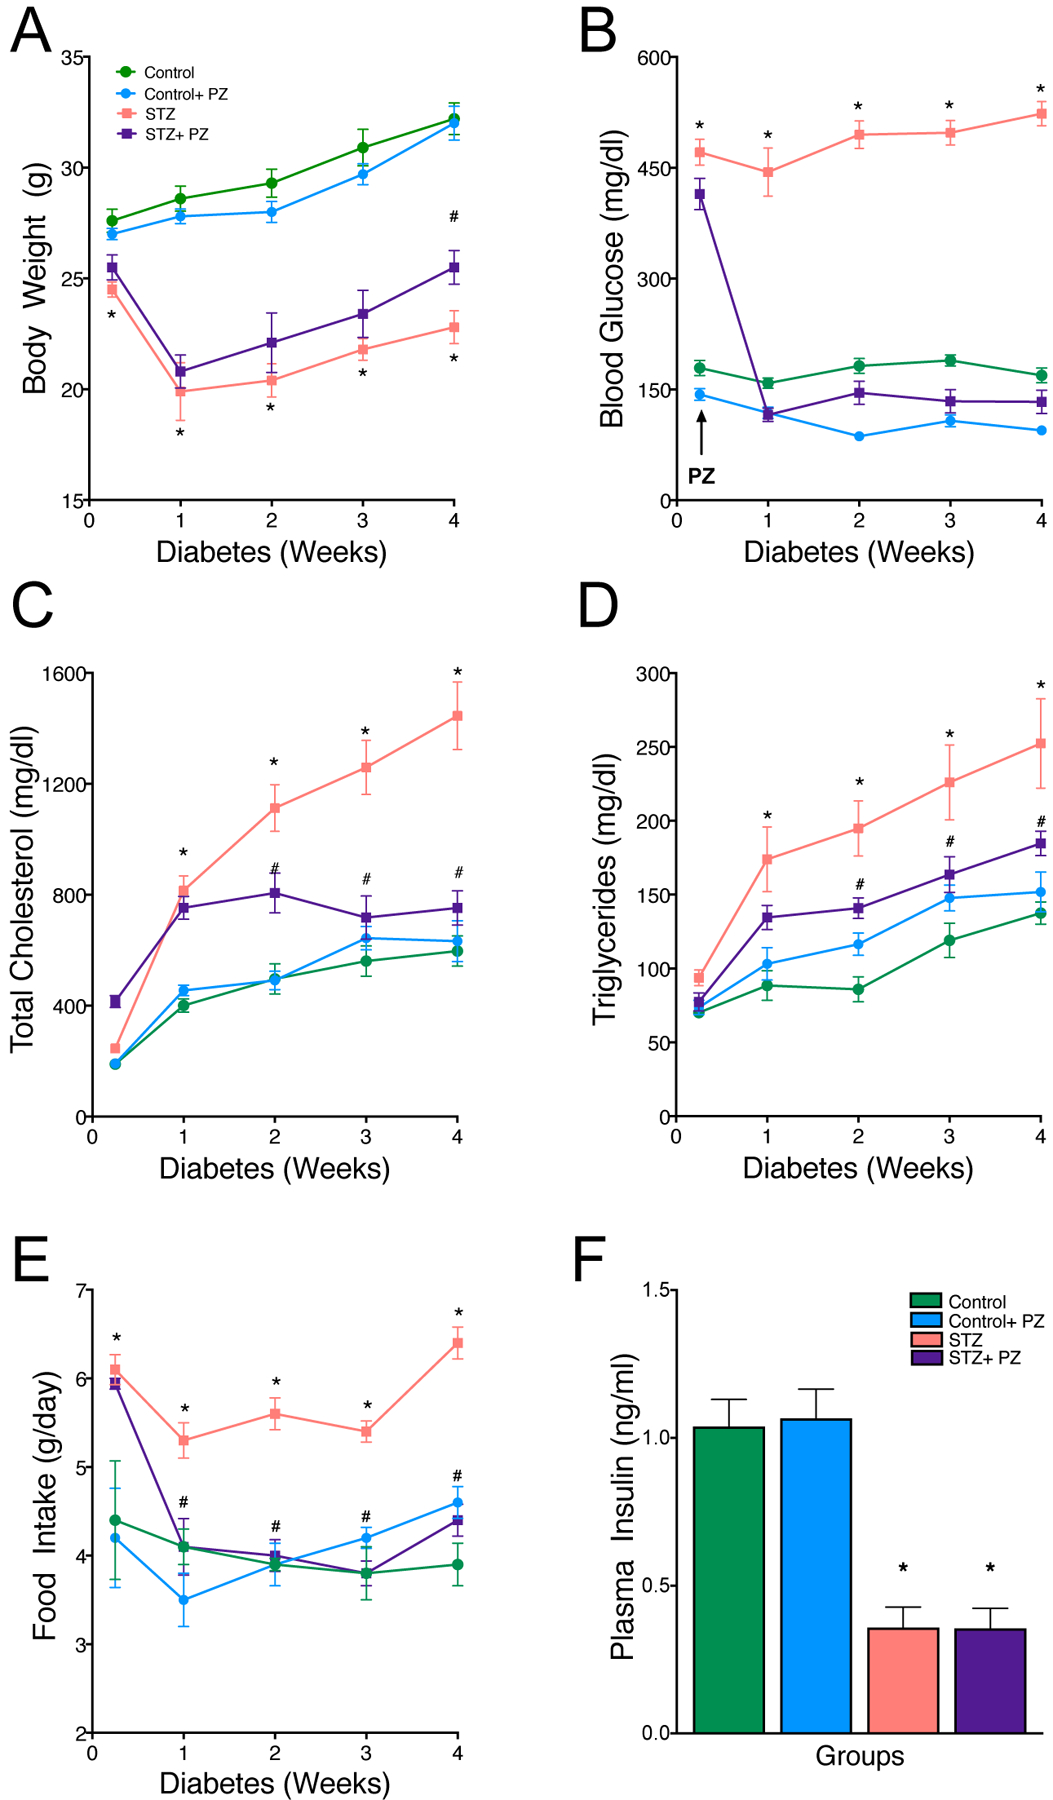
Effect of reversal of hyperglycemia on body weight and plasma biochemical parameters.
Diabetic and non-diabetic Ldlr−/− mice on cholesterol-rich diet (0.15%) were treated with either vehicle or phlorizin for 4 weeks. Quantification of (A) body weight, (B) blood glucose, (C) plasma cholesterol, (D) plasma triglycerides and (E) food intake and (F) plasma insulin levels in Control, Control+ phlorizin (PZ), Diabetic (STZ) and STZ+ phlorizin groups. Data are means ± SEM, n= 10 /group. *p< 0.05 vs. Control group, #vs. STZ group.
We next examined plasma lipoprotein profiles by isolating lipoprotein participles using ultracentrifugation and analyzed the TG and cholesterol composition separately in very low density (VLDL), low density lipoproteins (LDL) and high-density lipoproteins (HDL). The total cholesterol levels in VLDL and LDL was significantly increased while TGs increased only in VLDL particles in diabetic mice compared to non-diabetic mice (Fig. 2). HDL cholesterol did not change. Most importantly, treatment of phlorizin reduced cholesterol only in VLDL and LDL (Fig. 2A). TGs were also reduced in the VLDL particles (Fig. 2B). The same phenotype was observed when the mice were treated with dapagliflozin, a specific SGLT2 inhibitor, where plasma glucose, total cholesterol and triglycerides were reduced (Supplementary Fig. 1 A–C).
Fig. 2.
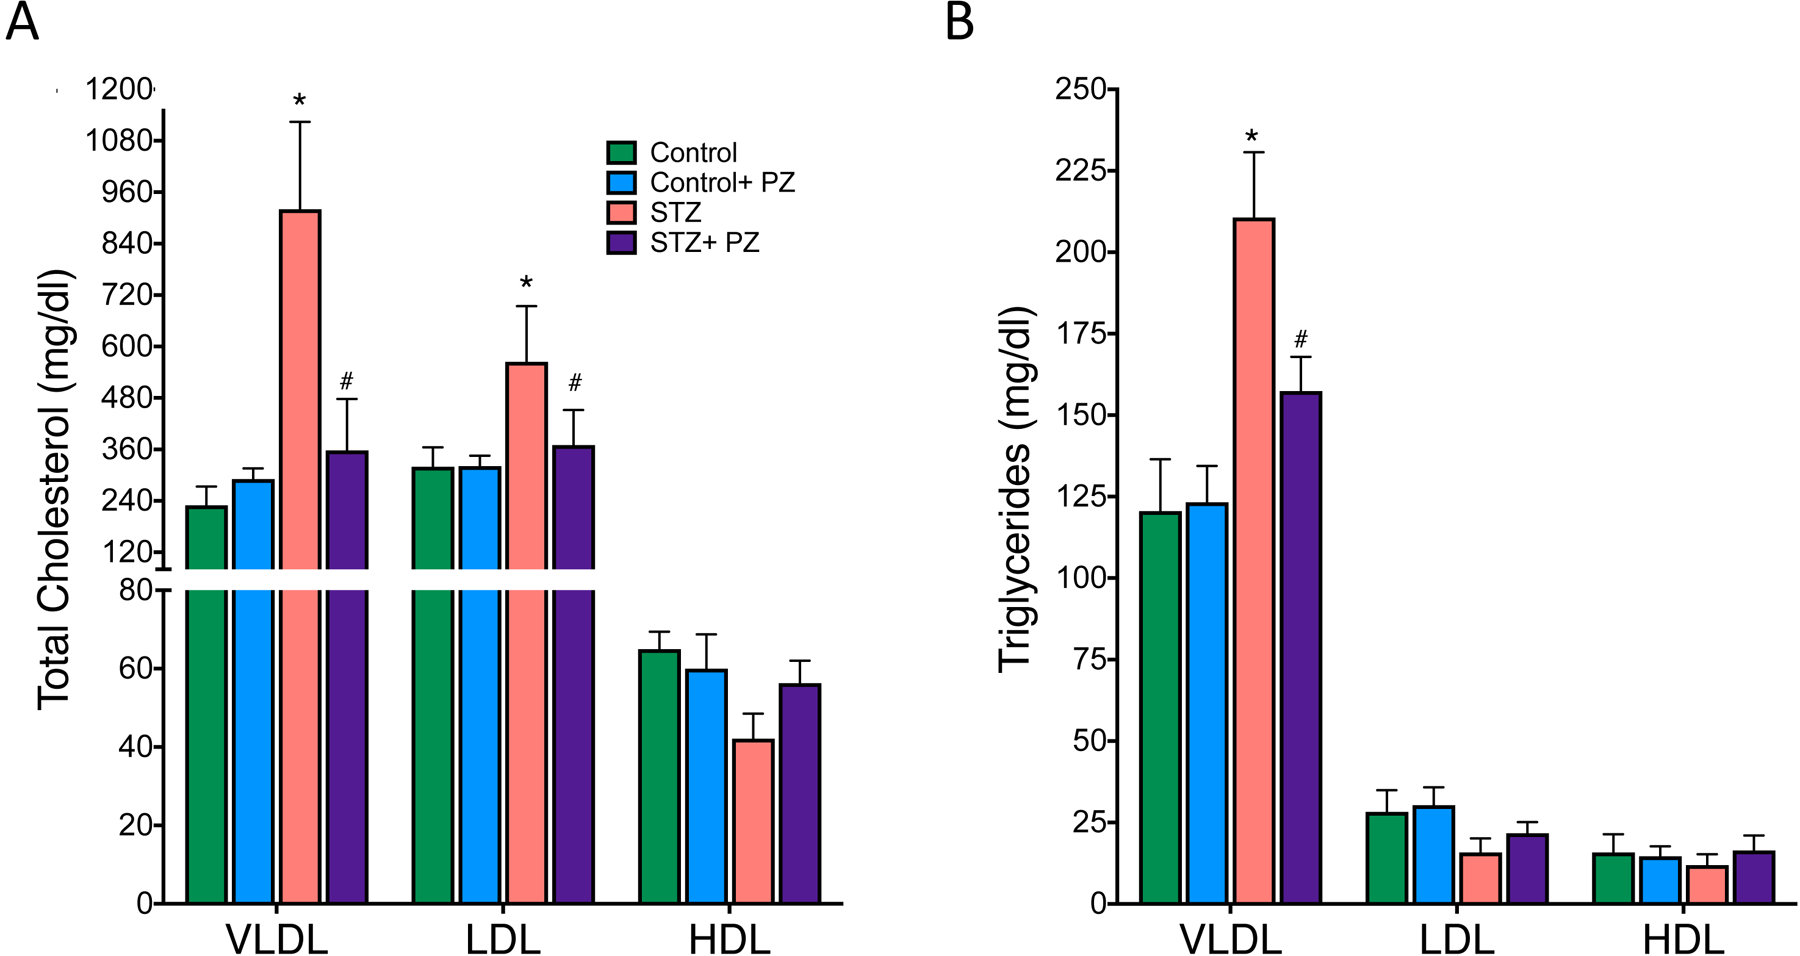
Distribution of cholesterol and triglyceride in plasma lipoproteins of control and diabetic Ldlr−/− mice.
Plasma was collected from 6 hour-fasted mice and analyzed for total cholesterol and TG in VLDL, LDL and HDL particles as described in methods. (A) Total cholesterol and (B) triglycerides in Control, Control + phlorizin (PZ), Diabetic (STZ) and STZ+ phlorizin groups. Data are means ± SEM, n= 10 /group. *p< 0.05 vs. Control group, # vs. STZ group.
3.2. Lowering glucose reduces atherosclerosis in diabetic Ldlr−/− mice
To test the hypothesis that reversal of hyperglycemia in diabetic Ldlr−/− mice would reduce atherosclerosis due to improved glycemic and lipoprotein profile, we first examined the extent of atherosclerosis in aortic arch. As shown in Fig.3, as expected, aortic arches of diabetic mice contained significantly more atherosclerotic lesions compared to non-diabetic mice (Fig. 3A and B). While phlorizin treatment had no effect on lesion size in the non-diabetic mice, we observed a significant reduction in lesion size in the diabetic mice (Fig. 3A and B), consistent with similar reduction in both blood glucose and atherogenic lipoprotein levels (i.e. Figs. 1 and 2). Parallel findings were observed when we quantified lesion size in the aortic root (Fig. 3C). We next examined the composition of the atherosclerotic lesions in the aortic root by examining lipid content using oil red O (ORO) staining and macrophage accumulation by CD68 staining. Not surprisingly, untreated diabetic mice had increased lipid and macrophage content in their lesions, while reduction in plasma lipoproteins and glucose by phlorizin led to a marked decrease in both the macrophage burden (Fig. 3D and E) and neutral lipids (Fig. 3F and G). These findings suggest that hyperglycemia and concurrent dyslipidemia promotes atherosclerosis while normalization of glucose using phlorizin significantly improves both the macrophage and lipid content in the lesions of diabetic mice (Fig. 3D to G).
Fig. 3.
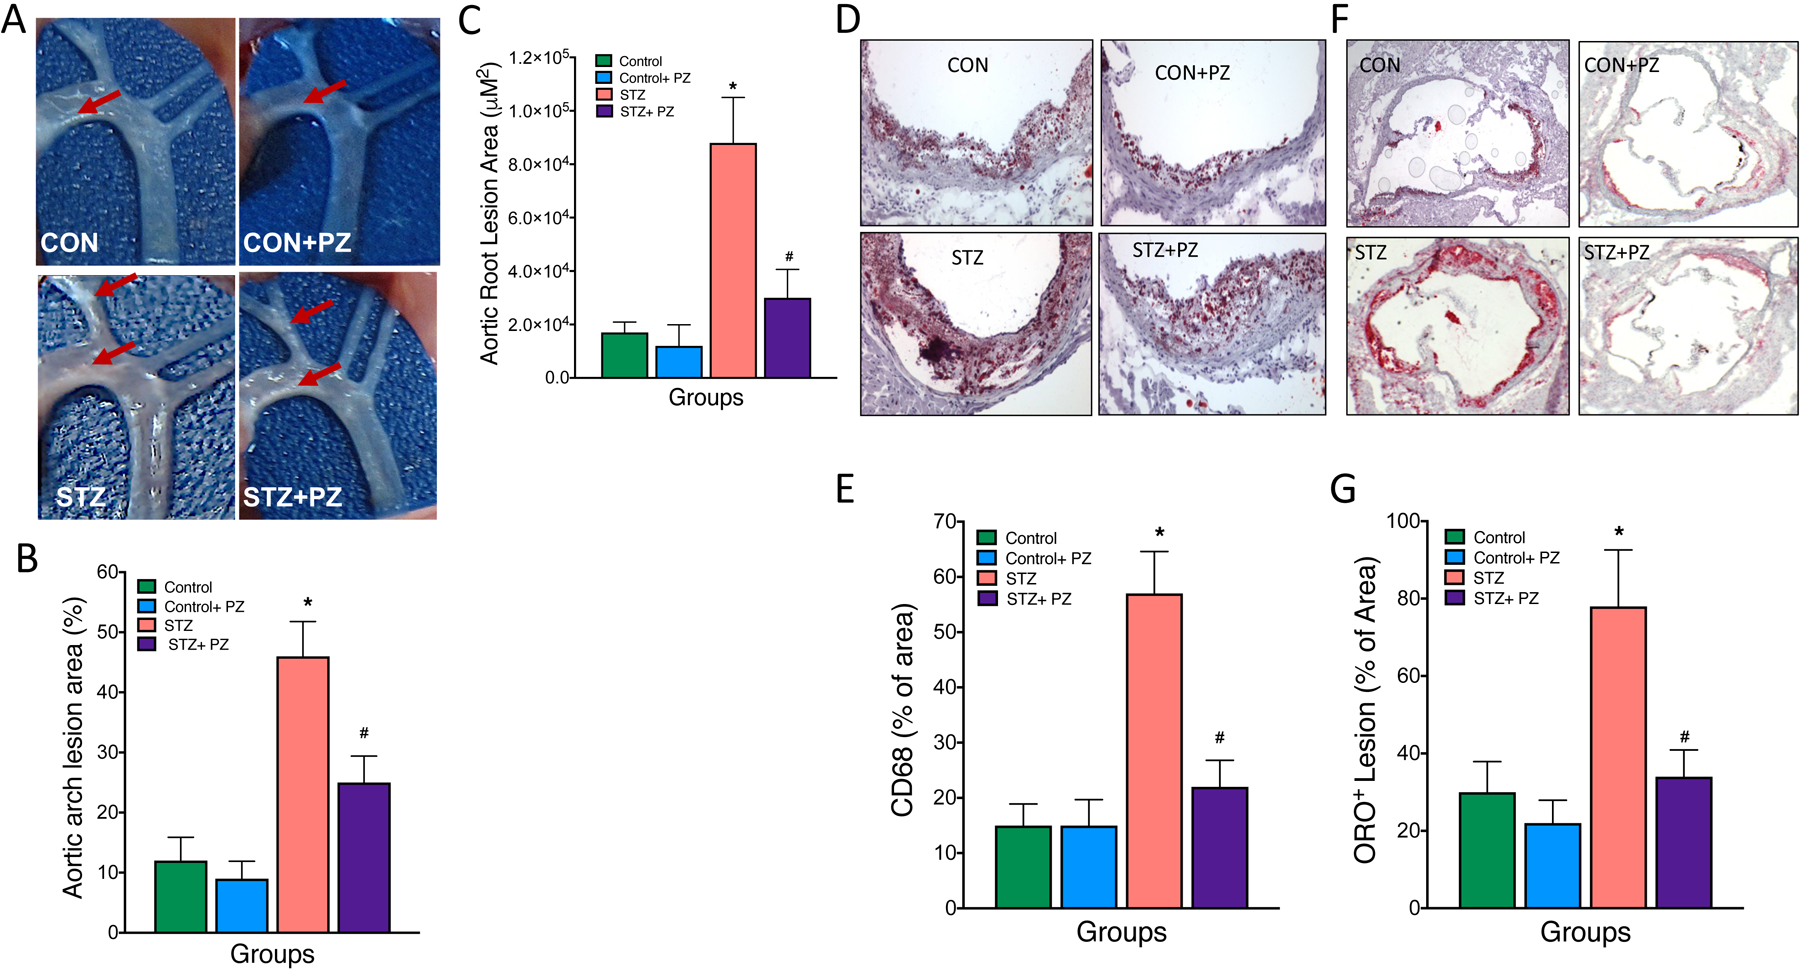
Normalization of hyperglycemia improves atherosclerosis in diabetic Ldlr−/− mice.
Diabetic Ldlr−/− mice on cholesterol-rich diet (0.15%) were treated with either vehicle or phlorizin for 4 weeks followed by analysis of atherosclerosis in aortic arch and roots. (A and B) Representative aortic arch depicting white cloudy plaques and their quantification (% area covered), (C) quantification (area in μM2) of the aortic root lesions. (D) Representative oil red O-stained sections of atherosclerotic lesion area in the aortic root and its (E) quantification. (F) Representative CD68 stained sections of aortic root and its g) quantification. Data are means ± SEM, n= 7–10 /group. *p< 0.05 vs. Control group, # vs. STZ group.
3.3. Lowering glucose suppresses myelopoiesis in diabetic Ldlr−/− mice
Since macrophage content in the lesions correlates positively with circulating monocytes [18], and monocytes are causal players in atherogenesis [17, 26], we next explored if changes in circulating monocytes could account for the changes observed in atherosclerosis. Previous studies have demonstrated that hyperglycemia alone [17] or in conjunction with dyslipidemia impacts atherosclerosis in diabetes [4, 16, 27]. In the setting of lesion regression with normalized lipids, this was mainly due to increased production and recruitment of inflammatory Ly6-Chi monocytes and neutrophils to the lesions [17]. To determine if diabetes promotes monocytosis and neutrophilia, we analyzed the blood leukocytes by flow cytometry. This revealed a significant increase in the number of circulating monocytes, particularly the Ly6-Chi cells, and neutrophils in diabetic Ldlr−/− mice compared to non-diabetic mice (Fig. 4A and B). Further, both monocytes and neutrophils from diabetic mice were activated and primed for adhesion, as demonstrated by increased expression of CD11b in monocytes and neutrophils (Fig. 4C). Normalization of blood glucose with phlorizin resulted in a significant decrease in the number of monocytes, neutrophils and activation (CD11b expression) of these cells in diabetic mice without affecting the same populations in non-diabetic mice (Fig. 4A–C).
Fig. 4.
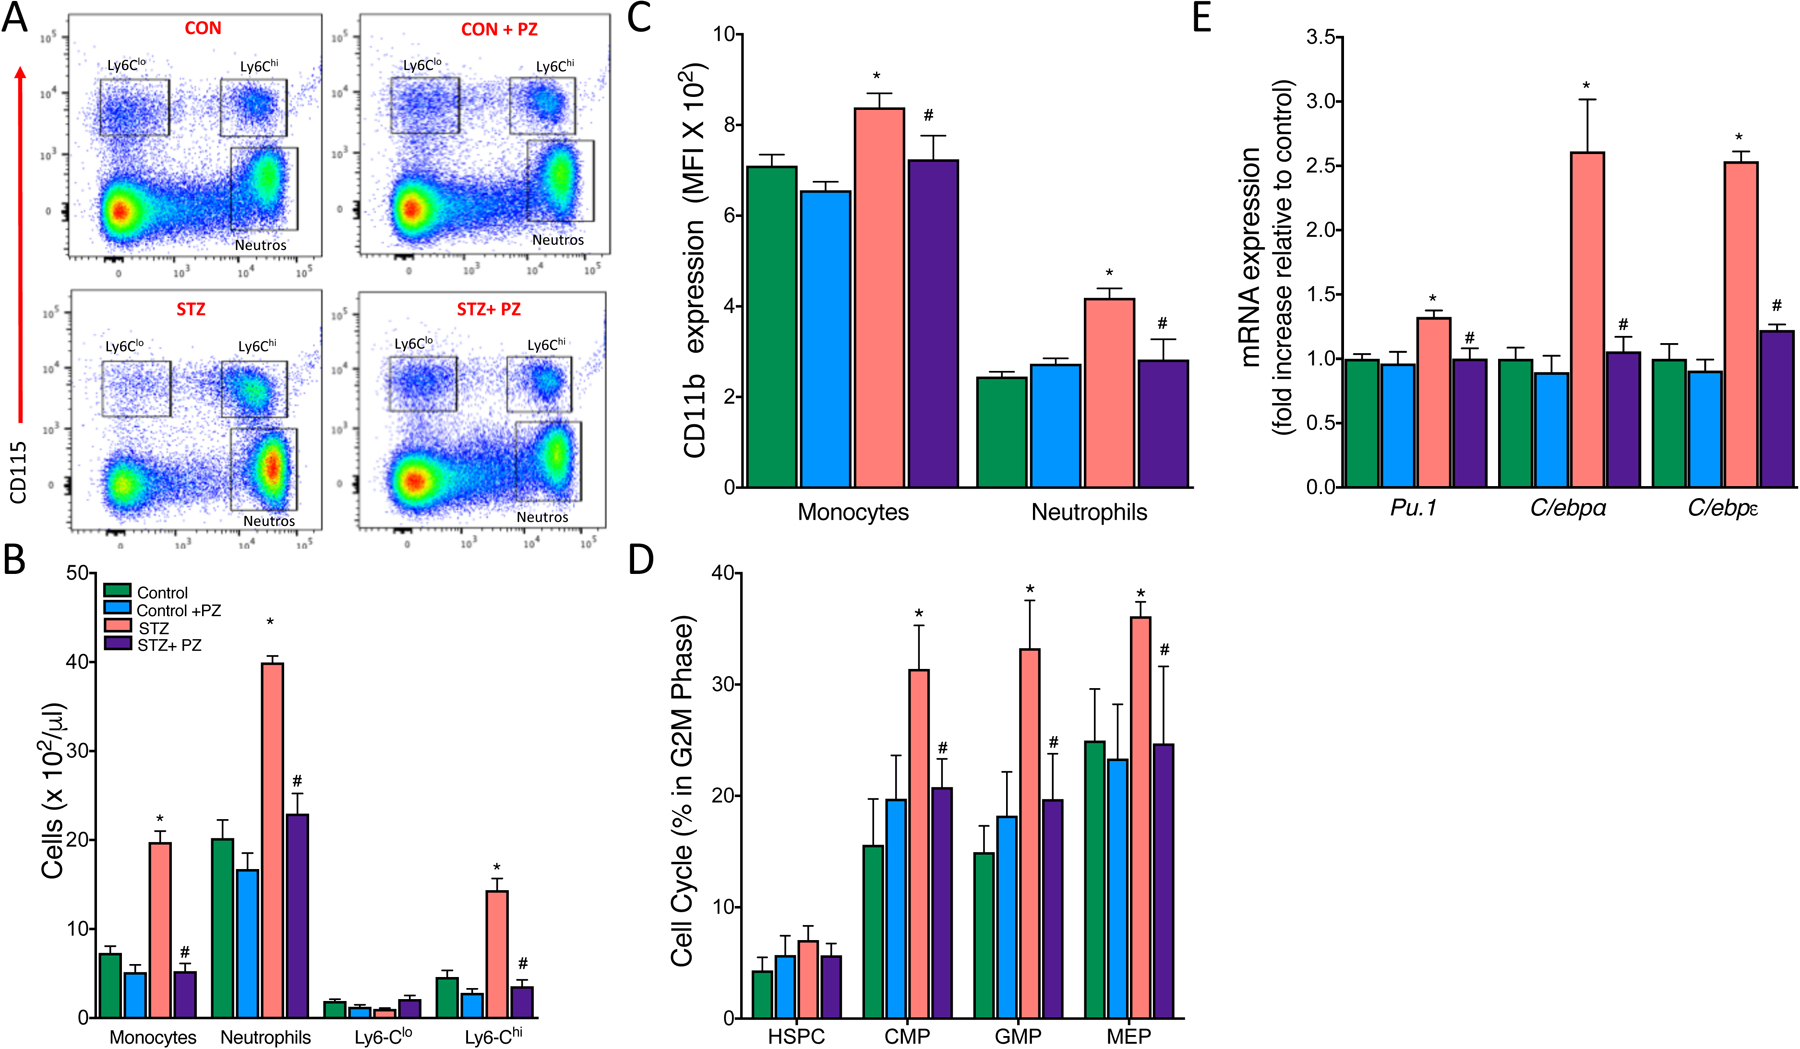
Normalization of hyperglycemia reduces the number of circulating monocytes and neutrophils via suppression of myelopoiesis in the bone marrow.
Leukocytosis develops in response to hyperglycemia via proliferation of BM progenitor cells in diabetic mice. Diabetic and non-diabetic Ldlr−/− mice on cholesterol-rich diet (0.15%) were treated with either vehicle or phlorizin for 4 weeks. (A) Representative flow cytometry plots of blood leukocyte subsets. (B) Quantification of monocyte subsets and neutrophils. (C) Mean Fluorescence Intensity (MFI) of CD11b on monocytes and neutrophils as assessed by flow cytometry. (D) BM hematopoietic stem and progenitor cell proliferation as assessed by percentage of cells in the G2M phase (DAPI staining) of the cell cycle and (E) myeloid lineage commitment markers in Control, Control + phlorizin (PZ), Diabetic (STZ) and STZ+ phlorizin groups. Data are means ± SEM, n= 7–10 /group. *p< 0.05 vs. Control group, # vs. STZ group.
We next wanted to examine if increased monocytosis and neutrophilia in these mice was associated with enhanced myelopoiesis in the bone marrow and/ or spleen. Previous studies from our group and elsewhere have reported that monocytosis and neutrophilia in atherosclerosis prone Ldlr−/−, Apoe−/− or Abca1−/−/Abcg1−/− mice fed with a cholesterol rich diet was due to enhanced proliferation of hematopoietic stem and progenitor cells (HSPCs) in the bone marrow and/ or spleen [17, 18, 26, 28]. To determine if diabetes promoted monocytosis and neutrophilia via increased proliferation of stem and progenitor cells, we assessed the amount of BM and spleen HSPCs that are in G2M phase of the cell cycle. Hyperglycemia in diabetic mice significantly increased the proliferation of common myeloid progenitor (CMP), granulocyte macrophage progenitor (GMP) and megakaryocyte erythroid progenitor (MEP) cells in the BM (Fig. 4D) but not in spleen (data not shown). Consistent with our previous data, there was no change in the proliferation of HSPCs (LSKs) in BM (Fig. 4D). However, as expected lowering blood glucose led to a marked decrease in the proliferation of all myeloid progenitor cells in the BM. To understand the molecular mechanisms responsible for the myeloproliferative phenotype, we assessed the mRNA levels of Pu.1 and the CCAAT enhancer binding proteins alpha (C/ebpα) and epsilon (C/ebpε), the key transcriptional factors that influence the lineage commitment decision of multipotential cells. Total BM cells isolated from untreated diabetic mice showed a significant increase in Pu.1, C/ebpα and C/ebpε transcripts that were normalized by reversing hyperglycemia (Fig. 4E). These data clearly demonstrate that diabetes is associated with a myeloproliferative phenotype with increased number of highly activated circulating monocytes that could potentially contribute to increased macrophage burden and atherosclerosis.
3.4. Maintenance of euglycemia improves lipoprotein clearance via heparan sulfate proteoglycans in diabetic Ldlr−/− mice
We next asked how the reversal of hyperglycemia could possibly improve the plasma lipoprotein profile in diabetic Ldlr−/− mice. Reduced circulating LDL is likely due to either decreased synthesis of lipoproteins in the liver or improved clearance via non-LDLR pathways. Based on our previous data, we concluded that decreased lipoprotein synthesis was not driving this phenotype as we had previously found no significant difference in either apoB or TG production from the liver between control and diabetic Ldlr−/− mice [20]. Thus, we explored changes in other lipoprotein clearance pathways, specifically examining the Ldlr-related protein (Lrp) and Scavenger Receptor B1 (Scarb1) in the liver. mRNA expression of the liver Lrp and Scarb1 was not decreased in untreated diabetic mice (Fig. 5A). Surprisingly, reducing glucose in diabetic mice increased the expression of both Lrp and Scarb1. However, when we examined the protein level of these receptors by Western blotting we failed to see an increase in diabetic mice treated with phlorizin and concluded that increased lipoprotein clearance via these receptors is unlikely to have led to an improved lipoprotein profile (Fig. 5B).
Fig. 5.
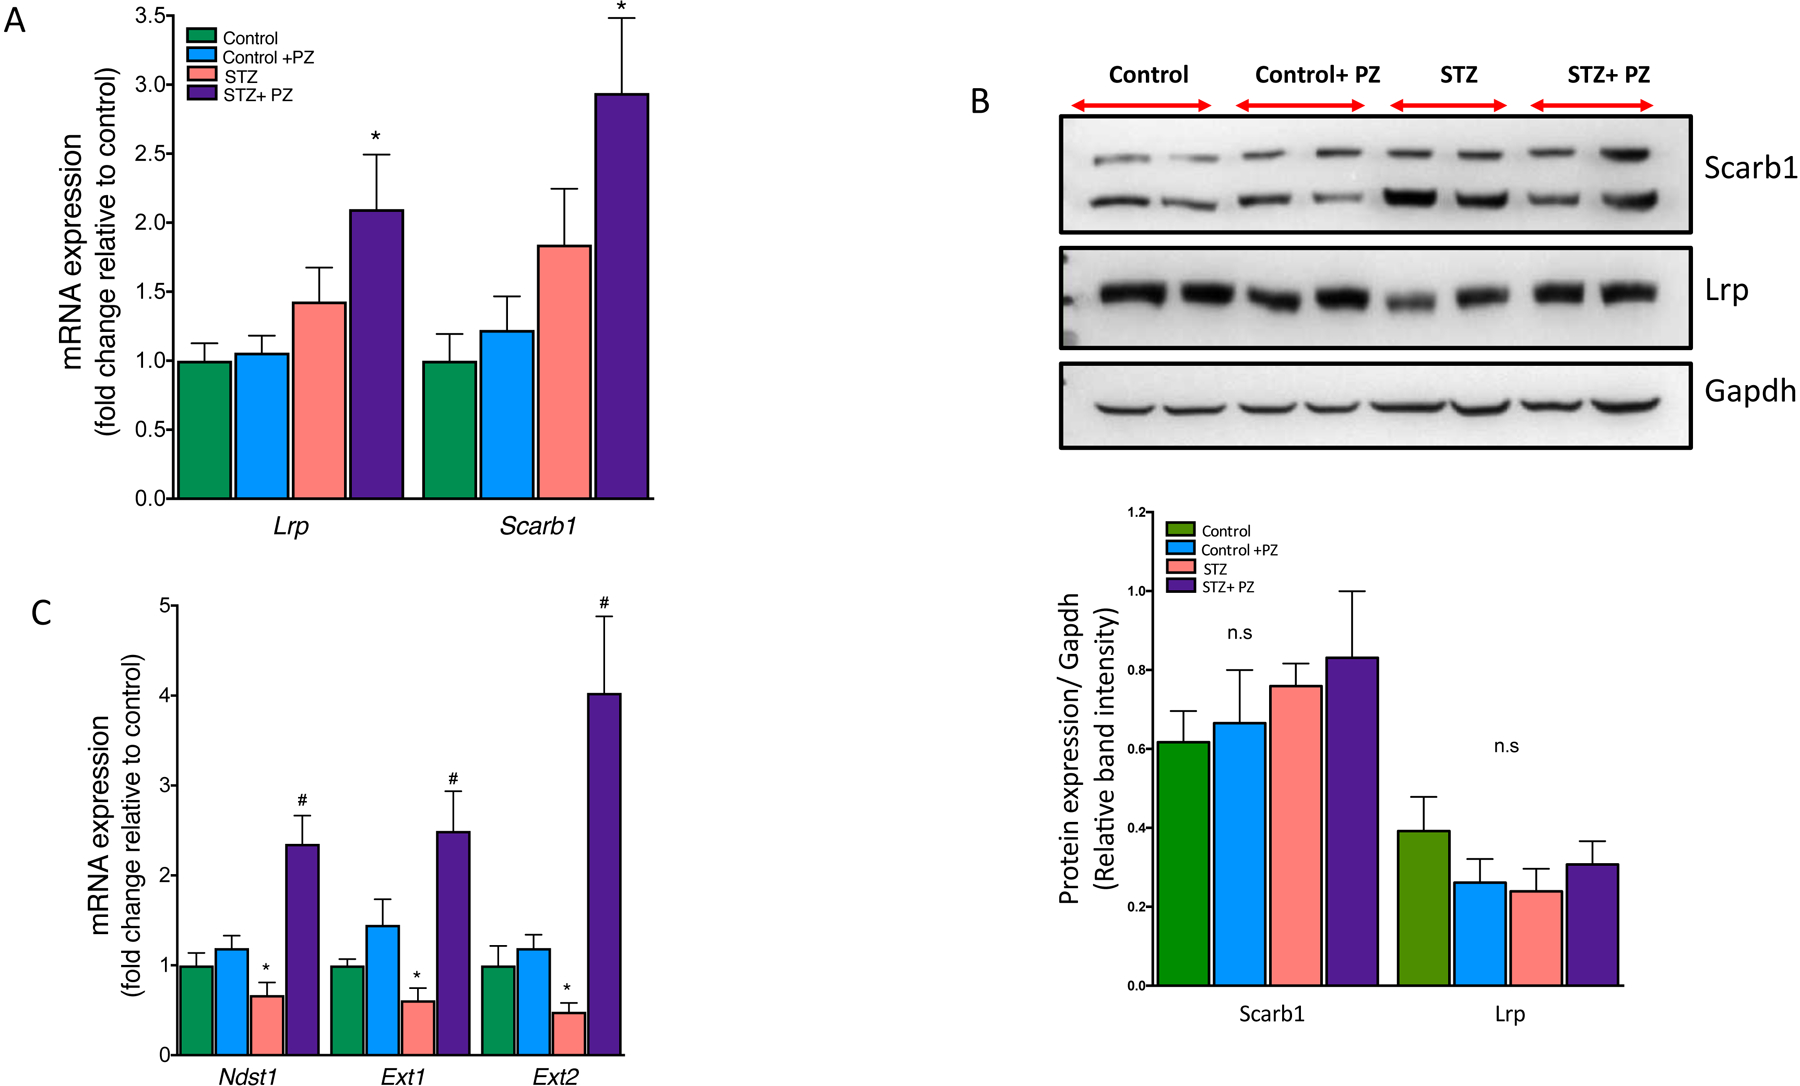
Effect of reversal of hyperglycemia on lipoprotein receptors and HSPG enzymes in the livers.
Livers from control and diabetic mice treated with or without phlorizin were used for mRNA analysis and protein expression by Western blot analysis. (A) mRNA and (B) protein expression of Lrp and Scarb1 in the livers. (C) mRNA expression of Ndst1, Ext1 and Ext2 in the livers from Control, Control + phlorizin (PZ), Diabetic (STZ) and STZ+ phlorizin groups. Data are means ± SEM, n= 7–10 /group. *p<0.05 vs. Control group, # vs. STZ group.
We previously had reported that TG rich lipoproteins isolated from diabetic mice when administered to non-diabetic mice cleared much more rapidly than diabetic mice [20]. This defect in TG rich lipoprotein clearance was attributed by us and others to impaired heparan sulfate proteoglycans (HSPG) in the liver [20, 29, 30]. Therefore, we examined the role of liver HSPGs, particularly the enzymes involved in sulfation and elongation of HSPGs in the absence of Ldlr or Lrp [29–31]. We specifically measured the mRNA expression of Ndst1, Ext1 and Ext2 in the liver and found a marked suppression in diabetic mice while maintenance of euglycemia by phlorizin led to a marked increase rather than mere normalization in the livers of diabetic mice (Fig. 5C). These data suggest that defective lipoprotein clearance in diabetic Ldlr−/− mice is likely due to hyperglycemia-mediated suppression of key enzymes involved in HSPG function.
3.5. Maintenance of euglycemia led to improved hepatobiliary excretion and cholesterol catabolism in diabetic mice
Because our data supported the hypothesis that enhanced sulfation of HSPGs with phlorizin treatment might have led to improved clearance of TG rich lipoproteins, we next sought to determine their fate in the livers. We first measured the weights of livers, which as expected showed smaller livers in the lighter STZ mice, but once normalized to body weight, revealed a significant increase in the liver to bodyweight ratio compared to control mice (Fig. 6A). Further, the amount of cholesterol and free fatty acids (FFAs) in the liver were higher and TGs lower in diabetic mice compared to non-diabetic mice (Fig. 6B). These data suggest that untreated-diabetic mice potentially had impaired lipoprotein secretion or movement into the bile from the livers, resulting in excess hydrolysis of TG to form FFAs. Phlorizin-treated diabetic mice had cholesterol levels comparable to non-diabetic mice.
Fig. 6.
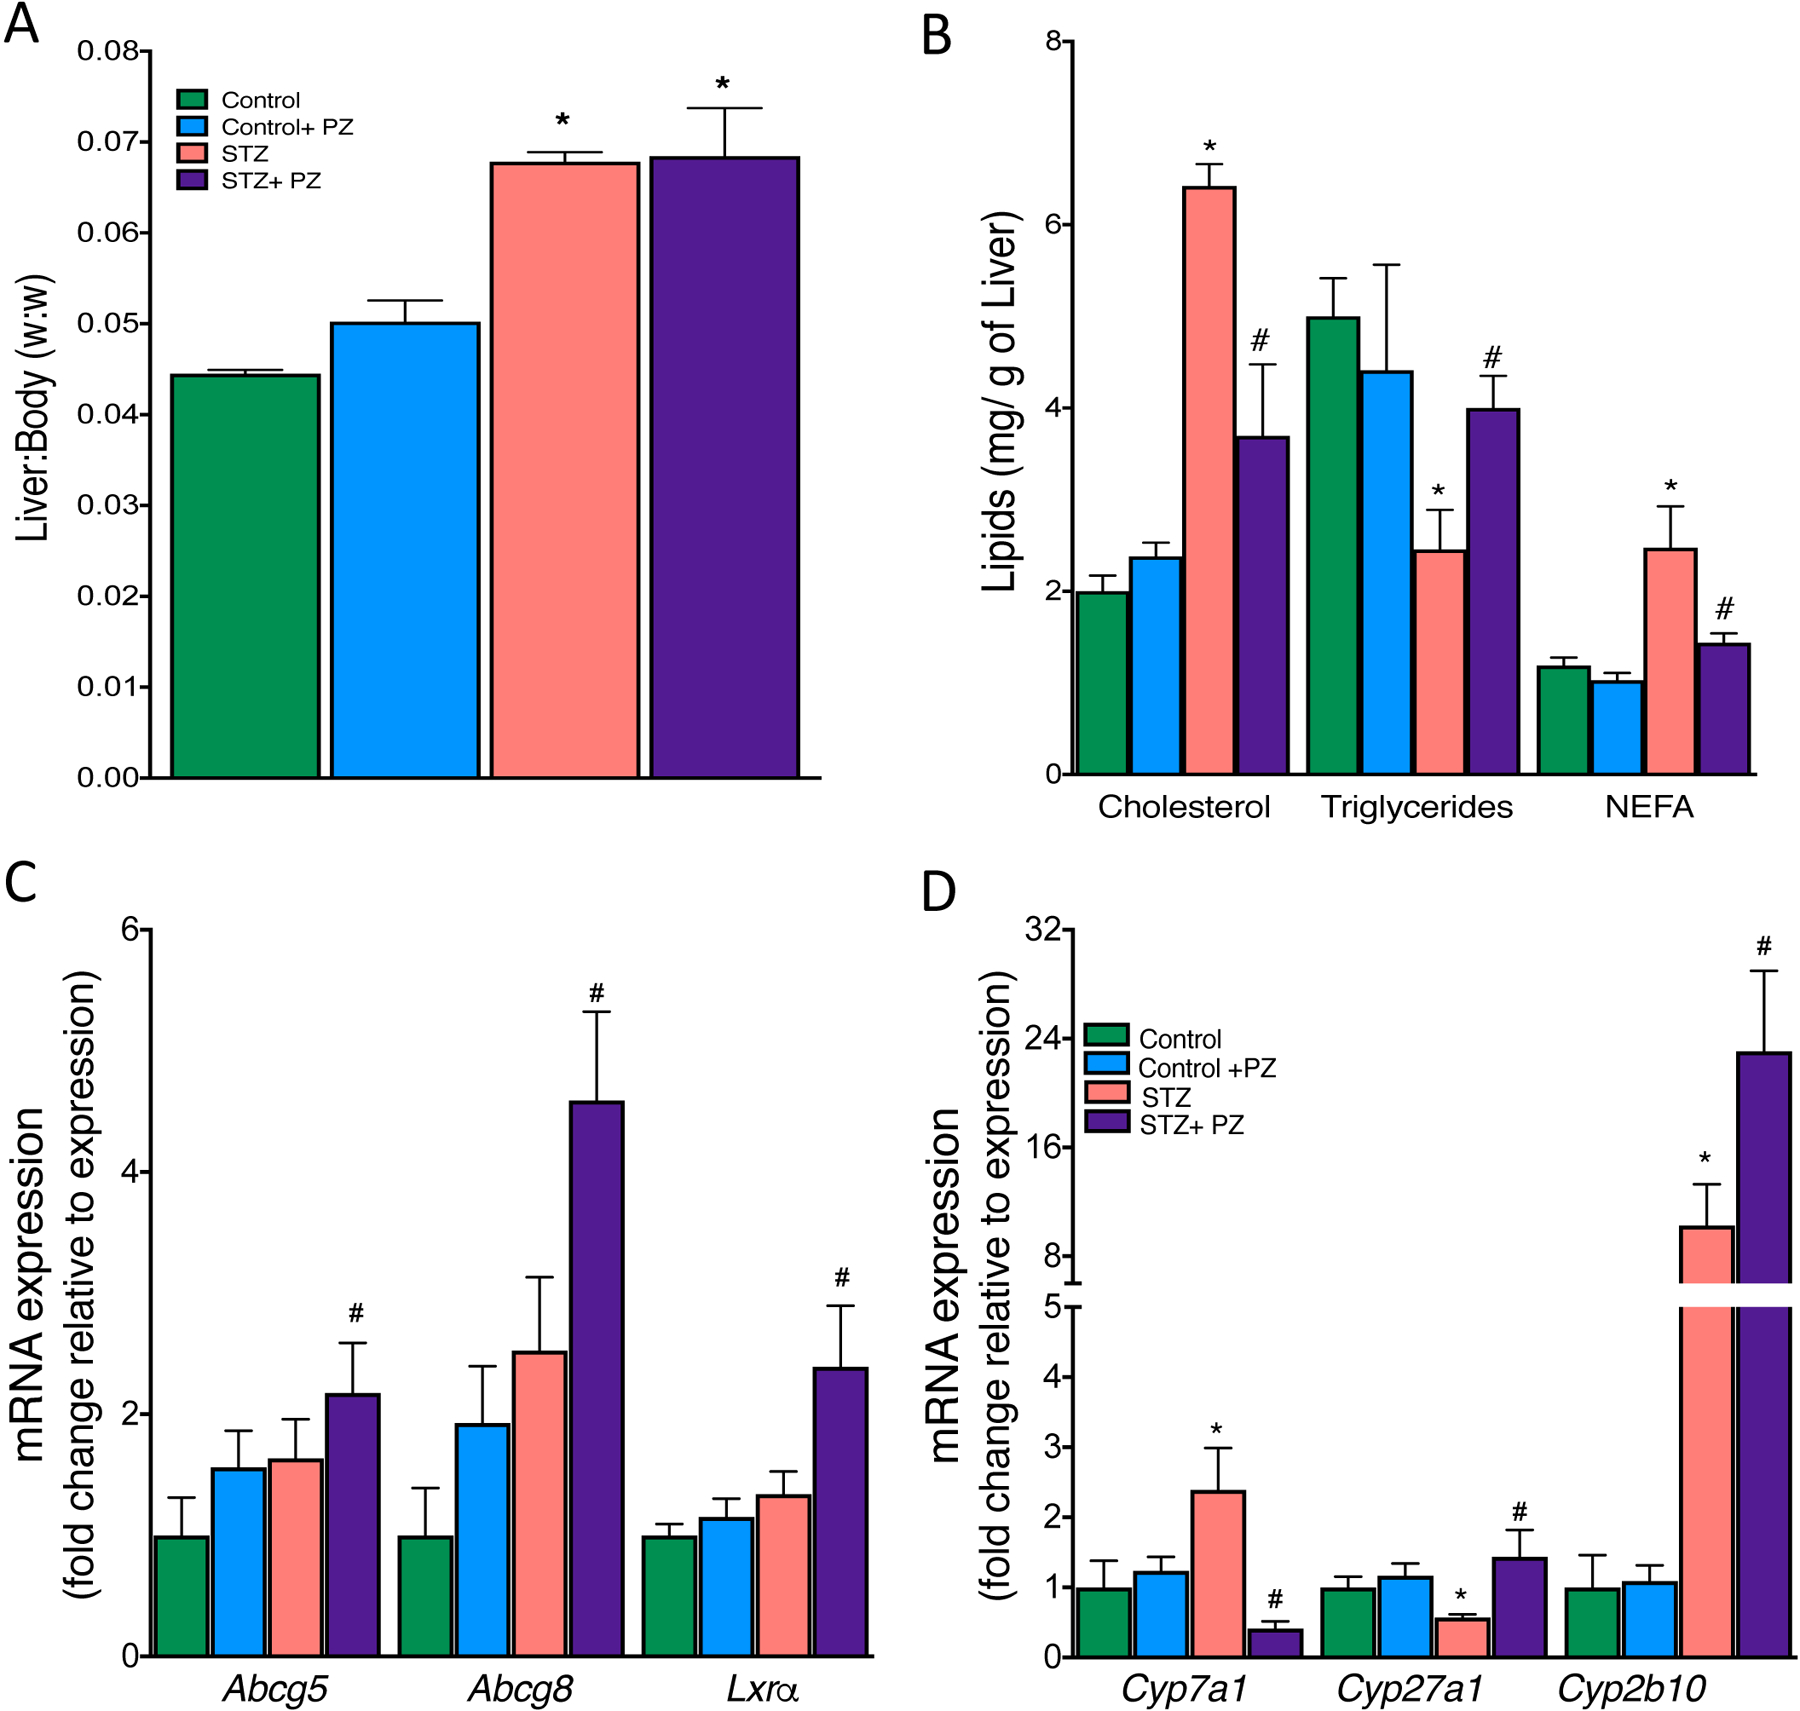
Effect of reversal of hyperglycemia on lipoprotein fate in the liver.
Livers from control and diabetic mice treated with or without phlorizin were used for analysis of (A) liver to body weight, (B) Cholesterol, TG and Free Fatty Acids (FFA), (C) mRNA expression of bile acids transporters (Abcg5, Abcg8) and its transcriptional regulator, (D) mRNA expression of Cyp450 enzymes involved in the conversion of cholesterol to bile acids and salts. Data are means ± SEM, n= 7–10 /group. *p<0.05 vs. Control group, # vs. STZ group.
The mechanism behind the phlorizin-induced decrease in plasma cholesterol levels was then explored. Dietary cholesterol has four possible fates once it reaches the liver: 1) esterification and storage in hepatocytes, 2) incorporation into VLDL particles, which are then secreted, 3) secretion directly into the bile, and 4) conversion into bile acids and secretion into the bile. The first two options were ruled out since phlorizin did not increase accumulation of cholesterol either in the liver nor did it reduce VLDL secretion. We next examined if biliary secretion of cholesterol played a role in the clearance of cholesterol from liver and thus plasma. Biliary sterol excretion is mainly executed by the two ATP-binding cassette (ABC) transporters, Abcg5 and Abcg8. The expression of Abcg5 and Abcg8 and their upstream transcription factor Lxrα, was increased when glucose levels were lowered (Fig. 6C). We next examined the Lxr target genes that promote cholesterol conversion to bile acids for excretion. We specifically focused on cholesterol 7 alpha-hydroxylase (Cyp7a1), the rate-limiting enzyme in the classic bile acid biosynthetic pathway [32]. We found a marked increase in Cyp7a1 expression in the livers of diabetic mice, while lowering glucose suppressed its expression. Cyp27a1, an enzyme that participates in the conversion of cholesterol into bile acids, was suppressed in diabetes but increased when plasma glucose was lowered (Fig. 6D). Cyp2b10, another diet-inducible enzyme that plays a role in decreasing hepatic cholesterol accumulation via formation of polyhydoxylated bile acids was dramatically upregulated in diabetes and further increased in phlorizin-treated diabetic mice. These data suggest that lowering blood glucose promotes lipoprotein clearance via mechanisms that involve increased secretion and catabolism of cholesterol into bile acid pathways.
4. Discussion
It is well know that deposition of cholesterol-rich lipoproteins in the arterial wall initiates atherosclerosis but that the entry of inflammatory monocytes propagates the disease [33]. Accordingly, the potential for monocyte recruitment into the lesion is strongly affected by the number and phenotype of circulating monocytes [26], implying that monocyte availability in the circulation may be one of the rate-limiting step for atherogenesis [18]. We recently reported that in mouse models of T1D, hyperglycemia alone impairs atherosclerotic lesion regression by increasing the number of inflammatory Ly6-Chi monocytes in the blood and their entry into the lesions [17]. These findings led us to hypothesize that a tighter glycemic control in diabetes, which is often associated with improvements in plasma lipids [2], would reduce atherosclerosis, accompanied by reductions in monocytes and neutrophils. Indeed, we found treating diabetic mice with sodium glucose cotransporter inhibitors, a class of clean glucose lowering agents improved lipid profiles, reduced the size of atherosclerotic lesions, and reduced the number of myeloid cells in the blood.
Both hyperglycemia and hyperlipidemia can independently promote leukocytosis and accelerate atherosclerosis [17, 18, 26]. For that reason, we sought to separate these two factors to determine which was the more potent effector of circulating monocyte levels. Our previous studies had shown that hypercholesterolemia stimulated HSPCs proliferation in the BM [26], while hyperglycemia affected CMPs and GMPs that are at a later stage of differentiation [17]. Treatment of diabetic mice reduced levels of glucose and cholesterol in Ldlr−/− mice, but their effects on the BM were confined to reductions in CMPs and GMPs. Thus, although this is a model of hyperglycemia and hypercholesterolemia, the benefits of phlorizin on reducing myelopoiesis appeared to be due to the glucose lowering via reduction in the more committed progenitors [34]. However, as lipids do regulate the proliferation of these progenitors, we cannot definitively rule out the contribution of lipids. Nonetheless, SGLT inhibition has a net positive effect on BM myelopoiesis.
Lipoprotein metabolism is complex and highly regulated, such that multiple pathways contribute to the total pool of plasma cholesterol. Our data suggested a defect in the HSPG-regulated lipoprotein clearance pathway. Clearance of lipoproteins by HSPGs is rapid and involves their trapping and internalization by endocytosis within the liver’s perisinusoidal space (space of Disse) through electrostatic binding. We previously had reported the suppression of Ndst1, a key biosynthetic enzyme that regulates the overall level of sulfation of HSPGs, led to defective lipoprotein clearance in diabetic mice [20, 35, 36]. HSPGs are decorated with heparan sulfate chains on a proteoglycan backbone and the assembly of these chains including their initiation and elongation is catalyzed by members of the exostosin family (Ext) [37, 38]. Given the importance of HSPGs in regulating lipoprotein clearance, restoration of Ndst1, Ext1 and Ext2 expression levels by normalizing blood glucose using phlorizin is consistent with our previous observations of defective lipoprotein clearance in diabetes.
Since normalization of hyperglycemia led to a significant decrease in plasma lipoproteins presumably by an efficient clearance mechanism mediated by HSPGs, we next examined the fate of lipoproteins, particularly the cholesterol in the liver. Cholesterol homeostasis is controlled by a series of regulatory pathways via synthesis of endogenous cholesterol, absorption from the diet and elimination by secretion or conversion to bile acids. A previous study by our group found no differences either in the synthesis or dietary absorption of cholesterol in Ldlr−/− diabetic mice [20]. Other processes such as biliary secretion and/ or conversion to bile acids may play a vital role in the clearance of lipoproteins. Biliary excretion of cholesterol is mainly regulated by Abcg5 and Abcg8, the two “half transporters” that are predominantly expressed in hepatocytes and under the transcriptional control of liver X receptor (Lxrα) [39]. Polymorphisms in either of these genes have led to elevated phytosterols in the plasma and premature atherosclerosis [40] mainly due to enhanced intestinal absorption and decreased biliary excretion of sterols [41]. Accordingly, mice deficient in Abcg5/Abcg8 genes have reduced ability to secrete sterols into bile while overexpression of Abcg5/Abcg8 in the liver reduces diet-induced increase in hepatic cholesterol content [42] by facilitating biliary secretion and suppressing intestinal cholesterol absorption [43]. We found that normalization of glucose by phlorizin led to a significant increase in the expression of both Abcg5 and Abcg8 as well as their transcriptional regulator Lxrα. These data suggest that some of the dietary cholesterol that was absorbed into the liver was channeled towards the bile. Whether this is mediated directly by hyperglycemia is unclear, but it is interesting to note that phlorizin treatment in control mice did not lead to overexpression of Abcg5, Abcg8 or Lxrα. Thus, it is unlikely that phlorizin has off target effects that directly induces the expression of these genes.
We next assessed the Lxr target genes that promotes excretion of cholesterol in the form of bile acids. We specifically focused on Cyp7a1, Cyp27a1, and Cyp2b10. Previous studies have demonstrated increased expression of Cyp7a1 along with increased bile acid pool and fecal bile acids in STZ diabetic mice. In line with this, we also found a significant increase in Cyp7a1 expression in the livers of untreated diabetic mice that might have led to enhanced fecal excretion of cholic and deoxycholic acids. These bile acids have lower critical micelle concentration [44] and therefore efficiently reabsorbed into the circulation and ultimately to the liver [45]. Similarly, Cyp27a1, an enzyme that plays an important role in cholesterol catabolism to bile acids was suppressed in diabetic livers [46] and reversed when blood glucose was lowered. Cyp2b10, another diet-inducible enzyme that decreases hepatic cholesterol accumulation via formation of polyhydoxylated bile acids was upregulated in phlorizin-treated diabetic mice. These data suggest that lowering blood glucose promotes hepatic cholesterol degradation leading to enhanced bile acid formation and their effective removal by suppressing entero-hepatic recycling. However, further studies are required to examine the precise molecular mechanisms that led to efficient clearance of hepatic cholesterol via bile acid pathways.
In summary, we have studied the effect of reversal of hyperglycemia on accelerated atherosclerosis using a mouse model of STZ-induced diabetes in Ldlr−/− background fed with high cholesterol diet. Our model mimics an hyperlipidemic condition that is often found in T1D humans in Western society with poorly controlled blood glucose levels, high fat diet and reduced Ldlr activity due to insulin deficiency [47]. In concert with our previous observations, we found that poorly controlled hyperglycemia led to defective lipoprotein clearance [20] and hepatobiliary excretion of cholesterol. This was associated with increased number of circulating monocytes and their precursor cells in the BM as well as increased lipid and macrophage content in atherosclerotic lesions. In this situation, the hyperglycemic effects on the BM were more pronounced than the effect of hyperlipidemia. Reversal of hyperglycemia not only led to improvement in plasma and liver lipoprotein profiles but also significantly reduced atherosclerosis. These data underscore the importance of tighter blood glucose control to prevent acute coronary syndromes particularly in T1D subjects who are at greater risk of developing atherosclerosis.
Supplementary Material
Fig. S1. SGLT2 specific inhibitor (dapagliflozin) reduces blood glucose, total cholesterol and triglycerides.
Diabetic and non-diabetic Ldlr−/− mice on cholesterol-rich diet (0.15%) were treated with either vehicle or dapagliflozin (25 mg/kg b.w in drinking water) for 4 weeks. Plasma was collected from 6 hour-fasted mice and analyzed for glucose, total cholesterol and TG as described in methods. (A) Total blood glucose levels with SGLT2 inhibitor treatment. (B) Total plasma cholesterol and (C) plasma triglyceride levels.
Fig.7.
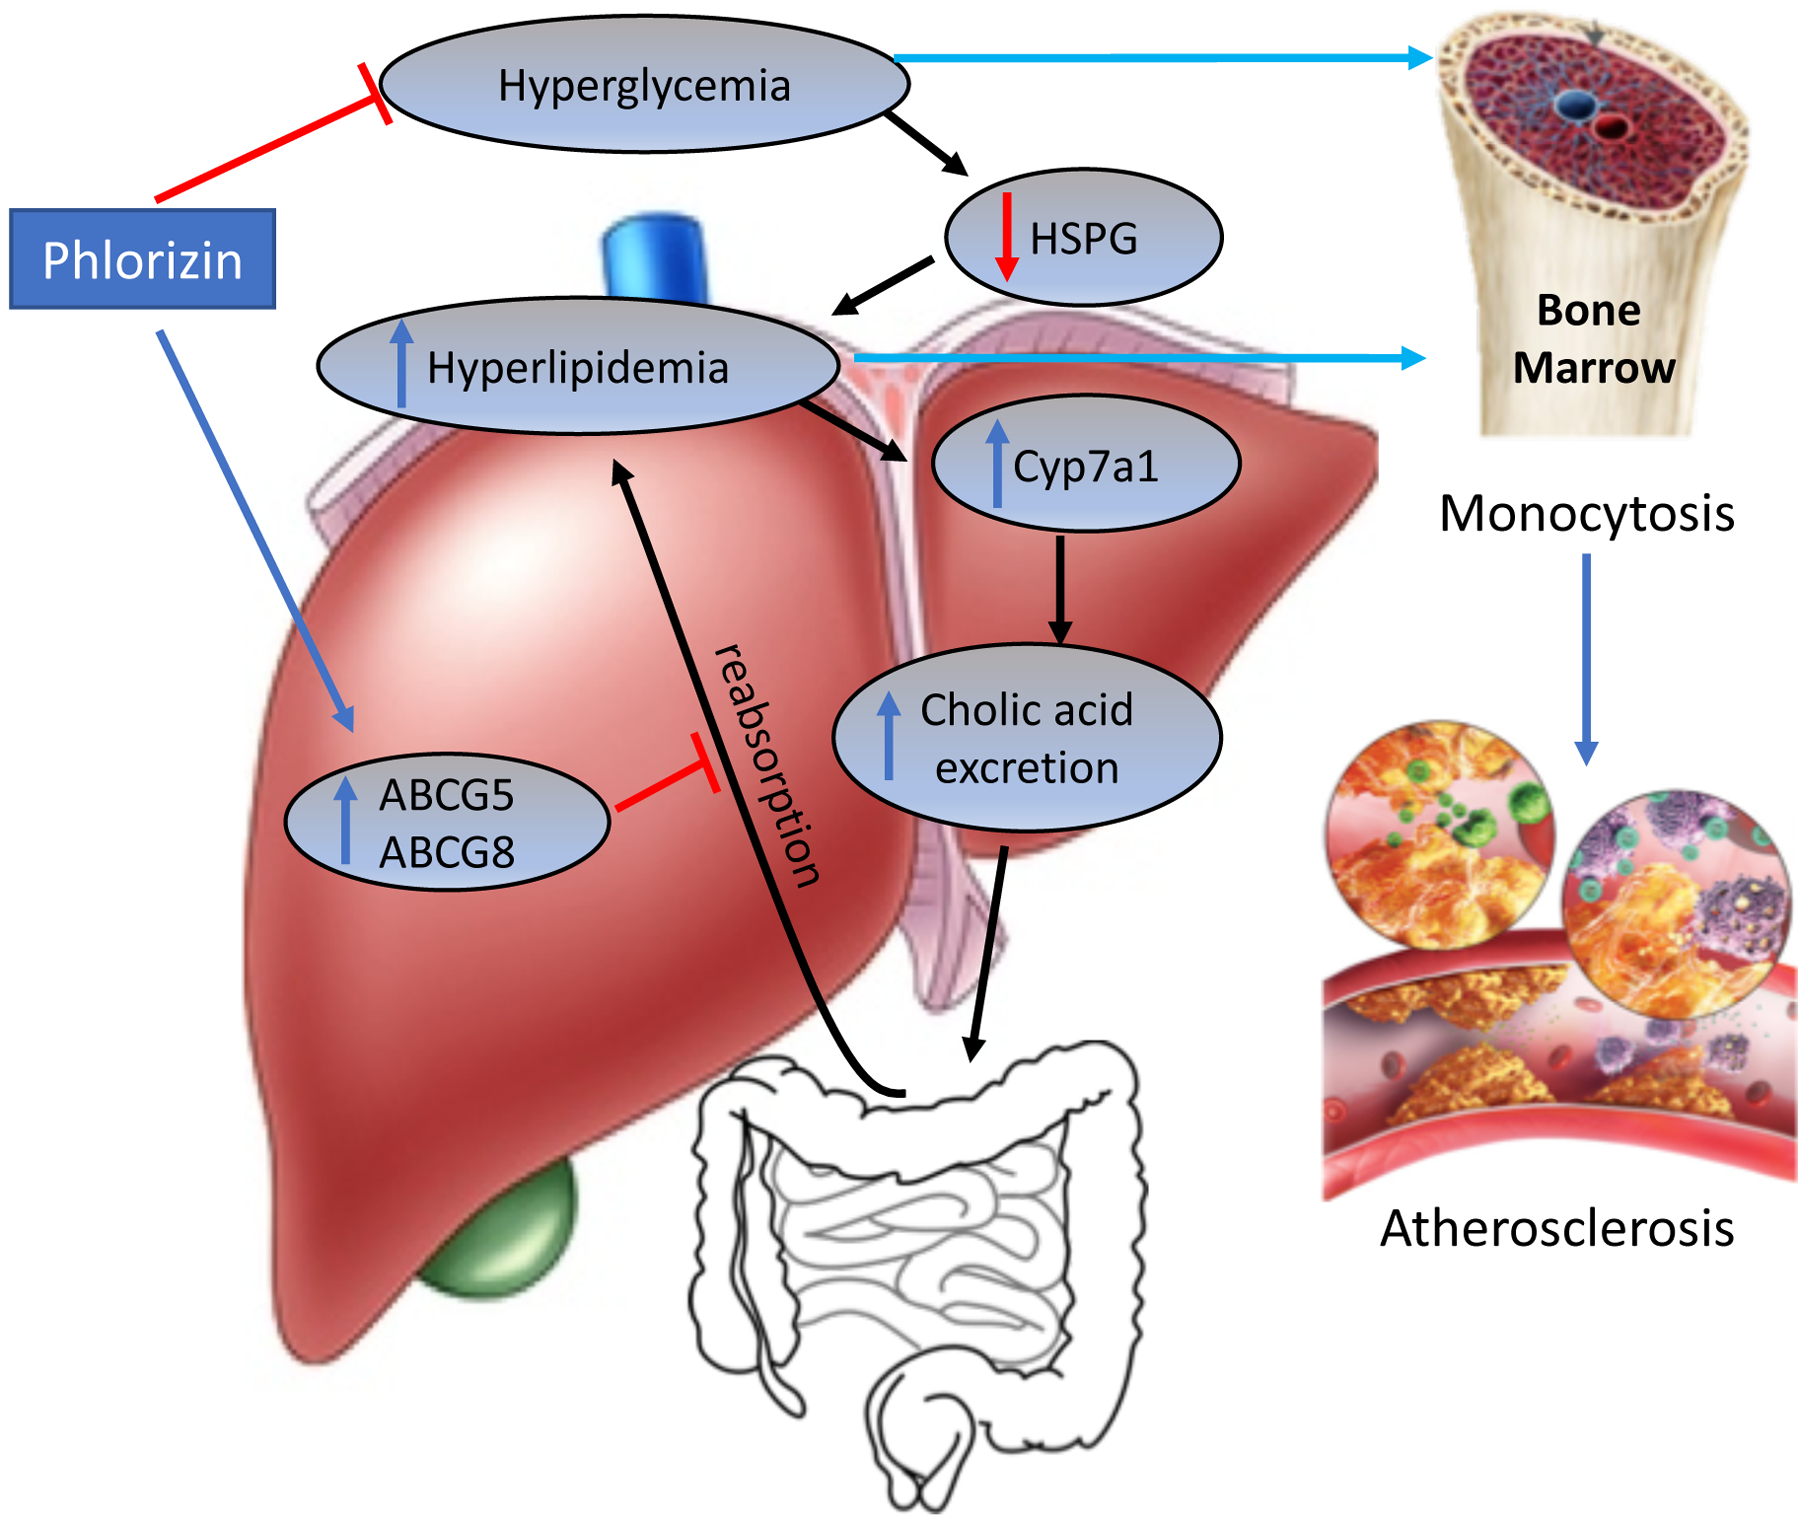
Schematic representation of phlorizin-induced effects on hyperglycemia, cholesterol metabolism and atherosclerosis in diabetes. Induction of diabetes led a marked increase in atherosclerosis due to hypercholesterolemia/ hyperglycemia-mediated increase in monocytosis in Ldlr−/− mice. Treatment with phlorizin, an SGLT2i led to marked decrease in hyperlipidemia via mechanisms involving, 1. Improved clearance of lipoproteins by preserving heparin sulfate proteoglycan (HSPG) function and thereby augmenting lipoprotein trapping and 2. Channeling them for bile acid secretion via upregulation of Abcg5 and Abcg8 and 3. Promoting concomitant hepatic cholesterol degradation leading to enhanced bile acid formation and their effective removal by suppressing entero-hepatic recycling. Reduction in blood glucose and cholesterol led to a marked improvement in atherosclerosis.
Highlights.
SGLT2 inhibitors reduce hyperglycemia, monocytosis and atherosclerosis development
Reversal of hyperglycemia improves plasma lipid profile
Improved lipoprotein profile is achieved mainly by hepatic HSPG and bile acid pathways
SGLT2 inhibitors can be used as a lipid lowering drug in diabetics with dyslipidemia
Acknowledgements
We acknowledge the assistance from the Flow Cytometry and Imaging Core Facilities at Columbia University and UAB. We thank Dr. Ashish Dhyani for his assistance in manuscript preparation.
Financial support
PRN is supported by grants from the NIH (HL122505, HL137799) and IJG (DK095684). A.J.M is supported by a NHMRC grant (APP1106154), a Career Development Fellowship from the NHMRC (APP1085752) and a Future Leader Fellowship from the National Heart Foundation (100440).
Footnotes
Publisher's Disclaimer: This is a PDF file of an unedited manuscript that has been accepted for publication. As a service to our customers we are providing this early version of the manuscript. The manuscript will undergo copyediting, typesetting, and review of the resulting proof before it is published in its final form. Please note that during the production process errors may be discovered which could affect the content, and all legal disclaimers that apply to the journal pertain.
Conflict of Interest
The authors declared they do not have anything to disclose regarding conflict of interest with respect to this manuscript.
References
- 1.Smith SC Jr., et al. , AHA/ACC Guidelines for Preventing Heart Attack and Death in Patients With Atherosclerotic Cardiovascular Disease: 2001 update. A statement for healthcare professionals from the American Heart Association and the American College of Cardiology. J Am Coll Cardiol, 2001. 38(5): p. 1581–3. [DOI] [PubMed] [Google Scholar]
- 2.Goldberg IJ and Dansky HM, Diabetic vascular disease: an experimental objective. Arterioscler Thromb Vasc Biol, 2006. 26(8): p. 1693–701. [DOI] [PubMed] [Google Scholar]
- 3.Renard CB, et al. , Diabetes and diabetes-associated lipid abnormalities have distinct effects on initiation and progression of atherosclerotic lesions. J Clin Invest, 2004. 114: p. 659–68. [DOI] [PMC free article] [PubMed] [Google Scholar]
- 4.Johansson F, et al. , Type 1 diabetes promotes disruption of advanced atherosclerotic lesions in LDL receptor-deficient mice. Proc Natl Acad Sci U S A, 2008. 105(6): p. 2082–7. [DOI] [PMC free article] [PubMed] [Google Scholar]
- 5.Dandona P, et al. , Insulin as an anti-inflammatory and antiatherosclerotic hormone. Clin Cornerstone, 2003. Suppl 4: p. S13–20. [DOI] [PubMed] [Google Scholar]
- 6.Baumgartl J, et al. , Myeloid lineage cell-restricted insulin resistance protects apolipoproteinE-deficient mice against atherosclerosis. Cell Metab, 2006. 3(4): p. 247–56. [DOI] [PMC free article] [PubMed] [Google Scholar]
- 7.Rask-Madsen C, et al. , Loss of insulin signaling in vascular endothelial cells accelerates atherosclerosis in apolipoprotein E null mice. Cell Metab, 2010. 11(5): p. 379–89. [DOI] [PMC free article] [PubMed] [Google Scholar]
- 8.Wen Y, et al. , Elevated glucose and diabetes promote interleukin-12 cytokine gene expression in mouse macrophages. Endocrinology, 2006. 147(5): p. 2518–25. [DOI] [PubMed] [Google Scholar]
- 9.Du X, et al. , Insulin resistance reduces arterial prostacyclin synthase and eNOS activities by increasing endothelial fatty acid oxidation. J Clin Invest, 2006. [DOI] [PMC free article] [PubMed] [Google Scholar]
- 10.Lopes-Virella MF, et al. , Immune complexes containing modified lipoproteins are related to the progression of internal carotid intima-media thickness in patients with type 1 diabetes. Atherosclerosis, 2007. 190(2): p. 359–69. [DOI] [PubMed] [Google Scholar]
- 11.Park L, et al. , Suppression of accelerated diabetic atherosclerosis by the soluble receptor for advanced glycation endproducts. Nat Med, 1998. 4(9): p. 1025–31. [DOI] [PubMed] [Google Scholar]
- 12.Bucciarelli LG, et al. , RAGE blockade stabilizes established atherosclerosis in diabetic apolipoprotein E-null mice. Circulation, 2002. 106(22): p. 2827–35. [DOI] [PubMed] [Google Scholar]
- 13.Effect of intensive diabetes management on macrovascular events and risk factors in the Diabetes Control and Complications Trial. Am J Cardiol, 1995. 75(14): p. 894–903. [DOI] [PubMed] [Google Scholar]
- 14.Wanner C, et al. , Empagliflozin and Clinical Outcomes in Patients With Type 2 Diabetes Mellitus, Established Cardiovascular Disease, and Chronic Kidney Disease. Circulation, 2018. 137(2): p. 119–129. [DOI] [PubMed] [Google Scholar]
- 15.Zinman B, et al. , Empagliflozin, Cardiovascular Outcomes, and Mortality in Type 2 Diabetes. N Engl J Med, 2015. 373(22): p. 2117–28. [DOI] [PubMed] [Google Scholar]
- 16.Parathath S, et al. , Diabetes Mellitus Adversely Affects Macrophages During Atherosclerotic Plaque Regression in Mice. Diabetes, 2011. [DOI] [PMC free article] [PubMed] [Google Scholar]
- 17.Nagareddy PR, et al. , Hyperglycemia promotes myelopoiesis and impairs the resolution of atherosclerosis. Cell metabolism, 2013. 17(5): p. 695–708. [DOI] [PMC free article] [PubMed] [Google Scholar]
- 18.Swirski FK, et al. , Ly-6Chi monocytes dominate hypercholesterolemia-associated monocytosis and give rise to macrophages in atheromata. J Clin Invest, 2007. 117(1): p. 195–205. [DOI] [PMC free article] [PubMed] [Google Scholar]
- 19.Keren P, et al. , Effect of hyperglycemia and hyperlipidemia on atherosclerosis in LDL receptor-deficient mice: establishment of a combined model and association with heat shock protein 65 immunity. Diabetes, 2000. 49(6): p. 1064–9. [DOI] [PubMed] [Google Scholar]
- 20.Goldberg IJ, et al. , Decreased lipoprotein clearance is responsible for increased cholesterol in LDL receptor knockout mice with streptozotocin-induced diabetes. Diabetes, 2008. 57(6): p. 1674–82. [DOI] [PubMed] [Google Scholar]
- 21.Renard CB, et al. , Diabetes and diabetes-associated lipid abnormalities have distinct effects on initiation and progression of atherosclerotic lesions. J Clin Invest, 2004. 114(5): p. 659–68. [DOI] [PMC free article] [PubMed] [Google Scholar]
- 22.Chen K, et al. , Type 2 diabetes in mice induces hepatic overexpression of sulfatase 2, a novel factor that suppresses uptake of remnant lipoproteins. Hepatology, 2010. 52(6): p. 1957–67. [DOI] [PMC free article] [PubMed] [Google Scholar]
- 23.Zernecke A, et al. , Protective role of CXC receptor 4/CXC ligand 12 unveils the importance of neutrophils in atherosclerosis. Circ Res, 2008. 102(2): p. 209–17. [DOI] [PubMed] [Google Scholar]
- 24.Potteaux S, et al. , Suppressed monocyte recruitment drives macrophage removal from atherosclerotic plaques of Apoe−/− mice during disease regression. J Clin Invest, 2011. 121(5): p. 2025–36. [DOI] [PMC free article] [PubMed] [Google Scholar]
- 25.Kunjathoor VV, Wilson DL, and LeBoeuf RC, Increased atherosclerosis in streptozotocin-induced diabetic mice. J Clin Invest, 1996. 97(7): p. 1767–73. [DOI] [PMC free article] [PubMed] [Google Scholar]
- 26.Murphy AJ, et al. , ApoE regulates hematopoietic stem cell proliferation, monocytosis, and monocyte accumulation in atherosclerotic lesions in mice. J Clin Invest, 2011. 121(10): p. 4138–49. [DOI] [PMC free article] [PubMed] [Google Scholar]
- 27.Vikramadithyan RK, et al. , Human aldose reductase expression accelerates diabetic atherosclerosis in transgenic mice. J Clin Invest, 2005. 115(9): p. 2434–43. [DOI] [PMC free article] [PubMed] [Google Scholar]
- 28.Yvan-Charvet L, Wang N, and Tall AR, Role of HDL, ABCA1, and ABCG1 transporters in cholesterol efflux and immune responses. Arterioscler Thromb Vasc Biol, 2010. 30(2): p. 139–43. [DOI] [PMC free article] [PubMed] [Google Scholar]
- 29.MacArthur JM, et al. , Liver heparan sulfate proteoglycans mediate clearance of triglyceride-rich lipoproteins independently of LDL receptor family members. J Clin Invest, 2007. 117(1): p. 153–64. [DOI] [PMC free article] [PubMed] [Google Scholar]
- 30.Stanford KI, et al. , Syndecan-1 is the primary heparan sulfate proteoglycan mediating hepatic clearance of triglyceride-rich lipoproteins in mice. J Clin Invest, 2009. 119(11): p. 3236–45. [DOI] [PMC free article] [PubMed] [Google Scholar]
- 31.Foley EM, et al. , Hepatic remnant lipoprotein clearance by heparan sulfate proteoglycans and low-density lipoprotein receptors depend on dietary conditions in mice. Arterioscler Thromb Vasc Biol, 2013. 33(9): p. 2065–74. [DOI] [PMC free article] [PubMed] [Google Scholar]
- 32.Peet DJ, et al. , Cholesterol and bile acid metabolism are impaired in mice lacking the nuclear oxysterol receptor LXR alpha. Cell, 1998. 93(5): p. 693–704. [DOI] [PubMed] [Google Scholar]
- 33.Gautier EL, Jakubzick C, and Randolph GJ, Regulation of the migration and survival of monocyte subsets by chemokine receptors and its relevance to atherosclerosis. Arterioscler Thromb Vasc Biol, 2009. 29(10): p. 1412–8. [DOI] [PMC free article] [PubMed] [Google Scholar]
- 34.Nagareddy PR, et al. , Hyperglycemia promotes myelopoiesis and impairs the resolution of atherosclerosis. Cell Metab, 2013. 17(5): p. 695–708. [DOI] [PMC free article] [PubMed] [Google Scholar]
- 35.Kjellen L, Bielefeld D, and Hook M, Reduced sulfation of liver heparan sulfate in experimentally diabetic rats. Diabetes, 1983. 32(4): p. 337–42. [DOI] [PubMed] [Google Scholar]
- 36.Williams KJ, et al. , Loss of heparan N-sulfotransferase in diabetic liver: role of angiotensin II. Diabetes, 2005. 54(4): p. 1116–22. [DOI] [PubMed] [Google Scholar]
- 37.Forsberg E and Kjellen L, Heparan sulfate: lessons from knockout mice. J Clin Invest, 2001. 108(2): p. 175–80. [DOI] [PMC free article] [PubMed] [Google Scholar]
- 38.Lind T, et al. , The putative tumor suppressors EXT1 and EXT2 are glycosyltransferases required for the biosynthesis of heparan sulfate. J Biol Chem, 1998. 273(41): p. 26265–8. [DOI] [PubMed] [Google Scholar]
- 39.Repa JJ, et al. , Regulation of ATP-binding cassette sterol transporters ABCG5 and ABCG8 by the liver X receptors alpha and beta. J Biol Chem, 2002. 277(21): p. 18793–800. [DOI] [PubMed] [Google Scholar]
- 40.Lee MH, Lu K, and Patel SB, Genetic basis of sitosterolemia. Curr Opin Lipidol, 2001. 12(2): p. 141–9. [DOI] [PMC free article] [PubMed] [Google Scholar]
- 41.Salen G, et al. , Sitosterolemia. J Lipid Res, 1992. 33(7): p. 945–55. [PubMed] [Google Scholar]
- 42.Yu L, et al. , Overexpression of ABCG5 and ABCG8 promotes biliary cholesterol secretion and reduces fractional absorption of dietary cholesterol. J Clin Invest, 2002. 110(5): p. 671–80. [DOI] [PMC free article] [PubMed] [Google Scholar]
- 43.Wu JE, et al. , Hepatic ABCG5 and ABCG8 overexpression increases hepatobiliary sterol transport but does not alter aortic atherosclerosis in transgenic mice. J Biol Chem, 2004. 279(22): p. 22913–25. [DOI] [PubMed] [Google Scholar]
- 44.Murphy C, et al. , Cholic acid as key regulator of cholesterol synthesis, intestinal absorption and hepatic storage in mice. Biochim Biophys Acta, 2005. 1735(3): p. 167–75. [DOI] [PubMed] [Google Scholar]
- 45.Li T, et al. , Glucose and insulin induction of bile acid synthesis: mechanisms and implication in diabetes and obesity. J Biol Chem, 2012. 287(3): p. 1861–73. [DOI] [PMC free article] [PubMed] [Google Scholar]
- 46.Zhou C, et al. , Hyperglycemic Ins2AkitaLdlr(−)/(−) mice show severely elevated lipid levels and increased atherosclerosis: a model of type 1 diabetic macrovascular disease. J Lipid Res, 2011. 52(8): p. 1483–93. [DOI] [PMC free article] [PubMed] [Google Scholar]
- 47.Chait A, Bierman EL, and Albers JJ, Low-density lipoprotein receptor activity in cultured human skin fibroblasts. Mechanism of insulin-induced stimulation. J Clin Invest, 1979. 64(5): p. 1309–19. [DOI] [PMC free article] [PubMed] [Google Scholar]
Associated Data
This section collects any data citations, data availability statements, or supplementary materials included in this article.
Supplementary Materials
Fig. S1. SGLT2 specific inhibitor (dapagliflozin) reduces blood glucose, total cholesterol and triglycerides.
Diabetic and non-diabetic Ldlr−/− mice on cholesterol-rich diet (0.15%) were treated with either vehicle or dapagliflozin (25 mg/kg b.w in drinking water) for 4 weeks. Plasma was collected from 6 hour-fasted mice and analyzed for glucose, total cholesterol and TG as described in methods. (A) Total blood glucose levels with SGLT2 inhibitor treatment. (B) Total plasma cholesterol and (C) plasma triglyceride levels.