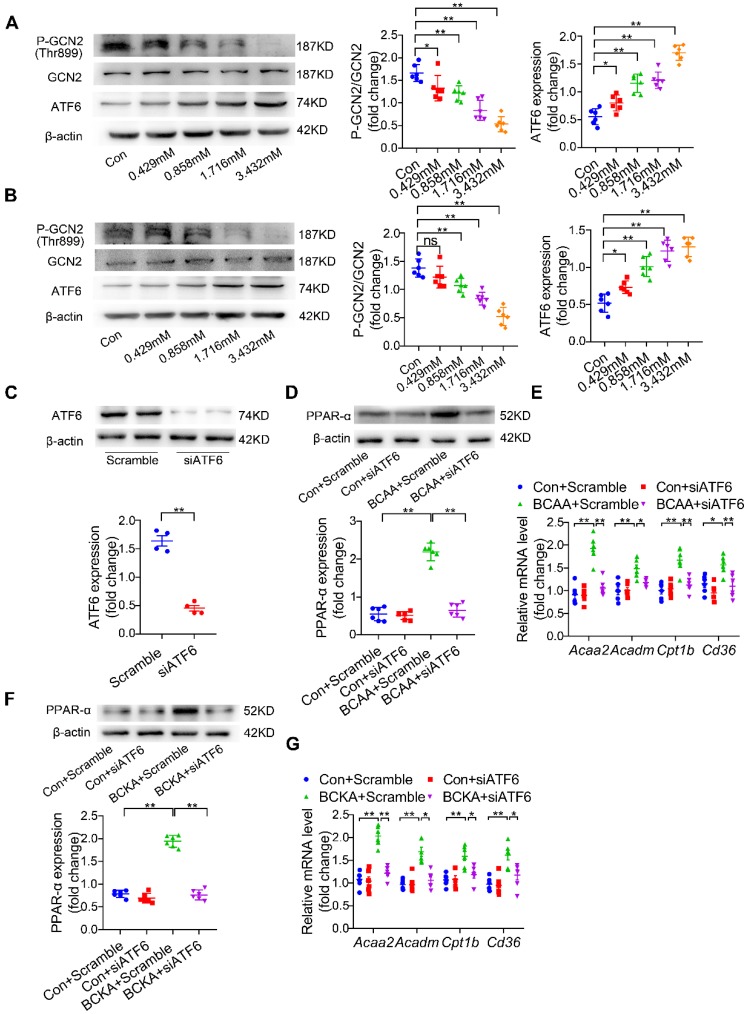
Figure 6.
BCAA increase PPAR-α expression in a GCN2/ATF6 pathway-dependent manner. (A) Expression of p-GCN2, GCN2 and ATF6 in the presence of increasing concentrations of BCAA (0, 0.429 mM, 0.858 mM, 1.716 mM, 3.432 mM) by western blotting (n=6). (B) Expression of p-GCN2, GCN2 and ATF6 in the presence of increasing concentrations of BCKA (0, 0.429 mM, 0.858 mM, 1.716 mM, 3.432 mM) by western blotting (n=6). BCKA mixture is composed of αKIC, αKIV and αKMV (weight ratio, αKIC: αKIV: αKMV= 2:1:1). (C) NRVMs were treated with control siRNA and ATF6 siRNA. 48 h after transfection, expression of ATF6 was determined by western blotting (n=4). (D-E) ATF6 siRNA transferred NRVMs were treated with or without BCAA (3.432 mM) (n=6). (D) PPAR-α expression was determined by western blotting. (E) Expression of Acaa2, Acadm, Cd36 and Cpt1b by real-time PCR. (F-G) ATF6 siRNA transferred NRVMs were treated with or without BCKA (3.432 mM) (n=6). (F) PPAR-α expression was determined by western blotting. (G) Expression of Acaa2, Acadm, Cd36 and Cpt1b by real-time PCR. (C) Data were analyzed by Student's t test. (A-B) and (D-G) Data were analyzed by one-way ANOVA, followed by a Bonferroni post-hoc test. * P<0.05, ** P<0.01. All values are presented as mean ± SEM.

