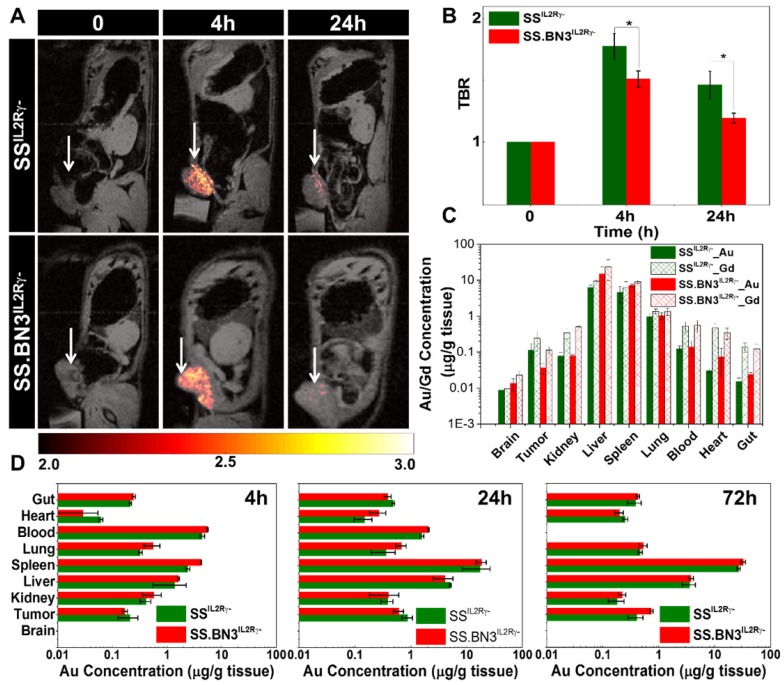
Figure 2.
T1 contrast MR imaging and bio distribution by ICP-MS after systemic delivery of TNPs in 231LUC+ tumors implanted in SSIL2Rγ- and SS.BN3IL2Rγ- rats. (A) Monitoring in vivo T1-weighted MR images of SSIL2Rγ- and SS.BN3IL2Rγ- rats with 231LUC+ tumors for pre- (0 h), post-4 h, and post-24 h systemic injection. The tumor is marked with white arrow. (B) TBR enhancement comparison of 231LUC+ tumors between SS IL2Rγ- and SS.BN3 IL2Rγ- rats (n = 3). (C) Bio distributions of TNPs and AuNRs in 231LUC+ implanted SS IL2Rγ- and SS.BN3 IL2Rγ- rats were analyzed by ICP-MS. Mean and standard deviation of Au and Gd content in different organs including tumor was determined after post- 24 h of systemic injection. Mean and standard deviation of Au content in the organs determined after (D) 4 h, (E) 24 h and (F) 72 h of systemic injection of AuNRs. The Au and Gd content in tumors in μg of metal/g of wet tissue are plotted as a log10 scale for visual clarity of values in organs with low nanoparticle content. All the data are shown as the mean±s.e.

