Abstract
Background
Clear cell renal cell carcinoma (ccRCC) is the most common pathological subtype of renal cell carcinoma. Bioinformatics analyses were used to screen candidate genes associated with the prognosis and microenvironment of ccRCC and elucidate the underlying molecular mechanisms of action.
Methods
The gene expression profiles and clinical data of ccRCC patients were downloaded from The Cancer Genome Atlas database. The ESTIMATE algorithm was used to compute the immune and stromal scores of patients. Based on the median immune/stromal scores, all patients were sorted into low‐ and high‐immune/stromal score groups. Differentially expressed genes (DEGs) were extracted from high‐ versus low‐immune/stromal score groups and were described using functional annotations and protein‒protein interaction (PPI) network.
Results
Patients in the high‐immune/stromal score group had poorer survival outcome. In total, 95 DEGs (48 upregulated and 47 downregulated genes) were screened from the gene expression profiles of patients with high immune and stromal scores. The genes were primarily involved in six signaling pathways. Among the 95 DEGs, 43 were markedly related to overall survival of patients. The PPI network identified the top 10 hub genes—CD19, CD79A, IL10, IGLL5, POU2AF1, CCL19, AMBP, CCL18, CCL21, and IGJ—and four modules. Enrichment analyses revealed that the genes in the most important module were involved in the B‐cell receptor signaling pathway.
Conclusion
This study mainly revealed the relationship between the ccRCC microenvironment and prognosis of patients. These results also increase the understanding of how gene expression patterns can impact the prognosis and development of ccRCC by modulating the tumor microenvironment. The results could contribute to the search for ccRCC biomarkers and therapeutic targets.
Keywords: ccRCC, immune scores, microenvironment, stromal scores, TCGA database
Identification of genes of prognostic value in the ccRCC microenvironment from TCGA database

1. INTRODUCTION
Renal cell carcinoma (RCC) is a common malignant tumor of the urinary system (Jonasch et al., 2012), and clear cell renal cell carcinoma (ccRCC) is its most common pathological subtype. The morbidity and mortality of ccRCC are reportedly increasing every year (Motzer et al., 2017). Although the treatment of ccRCC has improved, the prognosis of ccRCC remains poor, especially in cases of locally advanced and metastatic ccRCCs (Dutcher, 2013). Therefore, the exploration of biomarkers associated with ccRCC diagnosis, therapy, and patient prognosis has become an important issue (Adashek, Salgia, Posadas, Figlin, & Gong, 2019).
The tumor microenvironment (TM) plays a vital role in the prognosis of patients with cancer. Components of the TM are very complicated. It primarily consists of nontumor components that include stromal cells and tumor cells, and tumor components that are predominantly tumor cells, stromal cells, and tumor cells. Nontumor components can be regarded as valuable indexes for the therapeutic and prognostic assessment of tumors. Wu and Dai (2017) reported that the TM noticeably affects the therapeutic response and clinical outcome, and can mediate drug resistance by inducing the secretion of soluble factors from tumor or stromal cells. Moreover, the adhesion of tumor cells to stromal fibroblasts or components of the extracellular matrix can also attenuate therapeutic responses. Şenbabaoğlu et al found that a decrease in immune cell content (such as Th17 cells) correlated with ccRCC progression and poor patient prognosis (Şenbabaoğlu et al., 2016). Ghatalia et al reported that sunitinib therapy significantly prolonged the disease‐free survival of the patients with high CD8+ T‐cell density (George et al., 2018). Although these studies explored the role of the TM in the development and prognosis of ccRCC, most have only highlighted the association between the TM components and patient prognosis. Few studies have used expression profile data from high‐throughput sequencing to examine the relationship between gene expression patterns in the TM and ccRCC prognosis.
In this study, we aimed to identify genes of prognostic value in the ccRCC microenvironment and examine the possible mechanisms underlying ccRCC development. We downloaded gene expression profiles and clinical information of ccRCC patients from The Cancer Genome Atlas (TCGA) and utilized the R programming language software to analyze the data for differentially expressed genes (DEGs). We used the DAVID database to conduct gene ontology (GO) functions and the Kyoto Encyclopedia of Genes and Genomes (KEGG) for pathway enrichment analyses of the DEGs. A protein‒protein interaction (PPI) network was constructed using the Search Tool for the Retrieval of Interacting Genes (STRING) online database and the results were downloaded through Cytoscape. Finally, we identified hub genes and constructed modules from the PPI network. The results of this study reveal reliable prognostic biomarkers and therapeutic targets for ccRCC.
2. MATERIALS AND METHODS
2.1. Database
The gene expression profiles and clinical data (e.g., gender, age, stage, grade, survival, and outcome) of patients with ccRCC were obtained from TCGA database (https://portal.gdc.cancer.gov/). Immune scores and stromal scores of ccRCC patients were calculated by applying the ESTIMATE algorithm using the estimate package in R (https://www.r-project.org/). All patients were divided into low‐ and high‐ immune/stromal score groups according to the median immune/stromal scores.
2.2. Identification of DEGs
We utilized the limma R package to identify the differentially expressed genes (DEGs) according to the following cut‐off value: False discovery rate (FDR) <0.05 and |log2 fold change (FC)| > 1.
2.3. GO and KEGG pathway enrichment analyses of DEGs
The DAVID 6.8 database (https://david.ncifcrf.gov/) is a widely used database for gene enrichment and functional annotation analyses. Using DAVID, we applied the GO function and KEGG pathway enrichment analyses to the identified DEGs, with a cut‐off criterion of p‐value <.05.
2.4. PPI network construction and analysis of modules
To help us understand the interactions between different genes, we used the STRING (https://string-db.org/) online database (Franceschini et al., 2013) to analyze the protein‒protein interaction (PPI) network of the DEGs. To identify modules in the PPI network, we used the Molecular Complex Detection (MCODE) plug‐in in the Cytoscape software (Shannon et al., 2003), with the following default parameters: “Degree Cutoff = 2,” “Node Score Cutoff = 0.2,” “K‐Core = 2,” and “Max.Depth = 100” (Bader & Hogue, 2003).
2.5. Identification and analysis of hub genes
The top 10 hub genes were selected using the degree algorithm (Chin et al., 2014) in cytoHubba (a Cytoscape plugin). The cBioPortal database online portal (http://www.cbioportal.org) was used to analyze the network of hub genes and their coexpressed genes.
2.6. Overall survival analysis
The survival R package was used to analyze the relationship between DEGs expression levels (including hub genes) and the overall survival of patients. We tested this relationship with a log‐rank test and landmark analysis, where p < .05 was regarded as statistically significant.
3. RESULTS
3.1. Immune scores and stromal scores are significantly correlated with clinical parameters
We downloaded gene expression profiles and clinical information of ccRCC patients from TCGA database. We then matched immune and stromal scores of these patients via the estimate package in R. Next, we obtained 530 patients with complete immune and stromal scores; stromal scores ranged from −1,433.76 to 1,967.19 and immune scores ranged from −693.95 to 3,328.20 (Table 1). The median immune/stromal score was used as the cut‐off value to classify all ccRCC patients into low‐ and high‐ immune/stromal score groups. Analyses of the relationship between patient immune or stromal scores and overall survival using the survival package in R showed that patients in the high‐immune score group had a poorer prognosis than those in the low‐immune score group. After 4.3 years of follow‐up, patients in the high‐stromal score group had a worse prognosis than those in the low‐stromal score group (Figure 1). In addition, we analyzed the relationship between patient immune or stromal scores and clinical parameters (Figure 2) and found that the clinical parameters (histological grade, pathological, T, and M stages) increased with higher immune scores (p < .05). Increased stromal scores were associated with an increase in T stage (p < .05).
Table 1.
Immune scores, stromal scores, and clinical data of patients with ccRCC
| Characteristic | n | Stromal score (range) | Immune score (range) |
|---|---|---|---|
| Age | |||
| ≤60 | 264 | −1433.76 to 1778.24 | −693.95 to 3,328.20 |
| >60 | 266 | −1375.62 to 1967.19 | −389.80 to 3,223.9 |
| Gender | |||
| Female | 186 | −1433.76 to 1828.05 | −693.95 to 3,238.35 |
| Male | 344 | −1413.81 to 1967.19 | −660.28 to 3,328.2 |
| Histological grade | |||
| G1 | 14 | −615.34 to 1,054.71 | −136.19 to 2,368.85 |
| G2 | 227 | −1375.62 to 1768.6 | −389.80 to 3,102.67 |
| G3 | 206 | −1433.76 to 1888.47 | −693.95 to 3,328.2 |
| G4 | 75 | −690.60 to 1967.19 | 255.63 to 3,238.35 |
| GX | 5 | −1413.81 to 945.64 | −660.28 to 1859.09 |
| Unknown | 3 | −385.32 to 654.11 | 362.53 to 1518.59 |
| Stage | |||
| I | 265 | −1433.76 to 1778.24 | −693.95 to 3,135.31 |
| II | 57 | −1413.81 to 1764.27 | −660.28 to 3,328.2 |
| III | 123 | −827.01 to 1888.47 | −9.16 to 3,306.6 |
| IV | 82 | −690.60 to 1967.19 | 189.47 to 3,238.35 |
| unknown | 3 | 822.33 to 1,346.92 | 780.29 to 3,094.80 |
| T stage | |||
| T1 | 271 | −1433.76 to 1778.24 | −693.95 to 3,135.31 |
| T2 | 69 | −1413.81 to 1764.27 | −660.28 to 3,328.20 |
| T3 | 179 | −827.01 to 1967.19 | −9.16 to 3,306.60 |
| T4 | 11 | −339.67 to 1757.07 | 925.24 to 2,884.05 |
| N stage | |||
| N0 | 239 | −1413.81 to 1967.19 | −660.28 to 3,328.20 |
| N1 | 16 | −394.15 to 1627.16 | 688.28 to 3,306.60 |
| Nx | 275 | −1433.76 to 1778.24 | −693.95 to 3,238.35 |
| M stage | |||
| M0 | 420 | −1433.76 to 1888.47 | −693.95 to 3,328.20 |
| M1 | 78 | −690.60 to 1967.19 | 189.47 to 3,238.35 |
| Mx | 30 | −615.34 to 1,375.84 | −136.19 to 3,022.26 |
| Unknown | 2 | 818.41 to 1752.31 | 1,424.61 to 2,235.77 |
| Survival status | |||
| Death | 166 | −1413.81 to 1967.19 | −660.28 to 3,328.20 |
| Alive | 364 | −1433.76 to 1757.07 | −693.95 to 3,306.60 |
Figure 1.
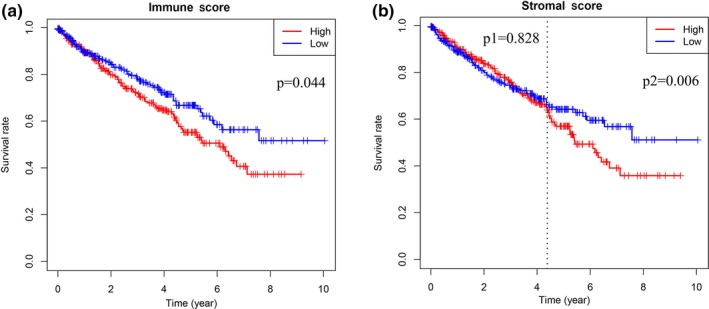
The correlation between (a) immune scores or (b) stromal scores of patients and overall survival. Immune scores and stromal scores were significantly associated with the prognosis of patients (p < .05)
Figure 2.
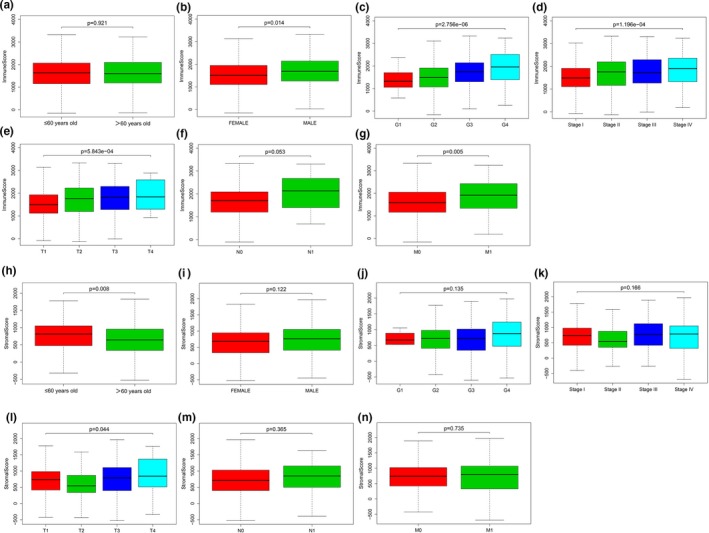
The relationship between immune scores or stromal scores of patients and clinical parameters. Immune scores were differential in gender, grade, clinical stage, T stage, and M stage parameters (p < .05); stromal scores were only differential in age and T stage parameters (p < .05). (a) Immune scores and age; (b) Immune scores and gender (p < .05); (c) Immune scores and grade (p < .05); (d) Immune scores and pathological stage (p < .05); (e) Immune scores and T stage (p < .05); (f) Immune scores and N stage; (g) Immune scores and M stage (p < .05); (h) Stromal scores and age (p < .05); (i) Stromal scores and gender; (j) Stromal scores and grade; (k) Stromal scores and pathological stage; (l) Stromal scores and T stage (p < .05); (m) Stromal scores and N stage; (n) Stromal and M stage
3.2. Identification of DEGs
To better understand the correlation between gene expression profiles and immune and/or stromal scores, we analyzed the gene expression profiles of the 530 ccRCC patients. We categorized the patients based on the median of their immune or stromal scores (high vs. low, for each); Figure 3 shows that the gene expression profiles can be used to differentiate the two groups. For immune scores, 512 genes were upregulated and 147 genes were downregulated in the high‐score versus low‐score group (|log2 fold change (FC)|> 1, FDR < .05; Figure 4a). Similarly, for stromal scores, 259 genes were upregulated and 152 genes downregulated in the high‐score versus low‐score group (|log2 fold change (FC)|> 1, FDR <0.05; Figure 4b). We also analyzed the shared upregulated and downregulated genes in both high‐score groups (immune and stromal scores) and found 48 upregulated and 47 downregulated genes (Figure 5). These 95 genes obtained by comparing the high versus low immune scores and stromal score groups were regarded as DEGs and subsequently used in further analyses.
Figure 3.
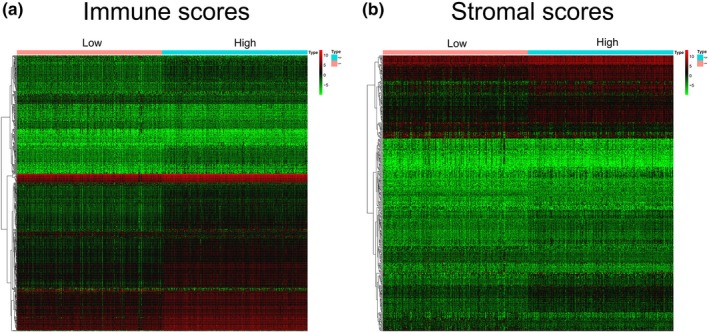
Heatmap of differential gene expression in the low score group (immune scores or stromal scores) and the high score group (immune scores or stromal scores). (a) Immune scores (low score in left and high score in right; |log2 fold change (FC)|> 1, FDR < 0.05); (b) Stromal scores (low score in left and high score in right; |log2 fold change (FC)|> 1, FDR < 0.05)
Figure 4.
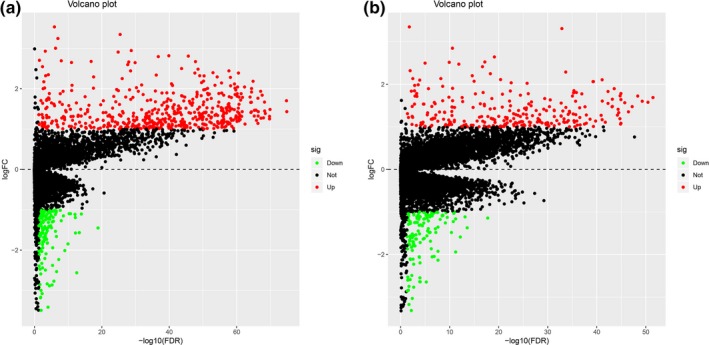
Differentially expressed genes (DEGs) in (a) immune scores and (b) stromal scores. Red represents upregulated genes, green represents downregulated genes, according to |log2 fold change (FC)|> 1, FDR <0.05
Figure 5.
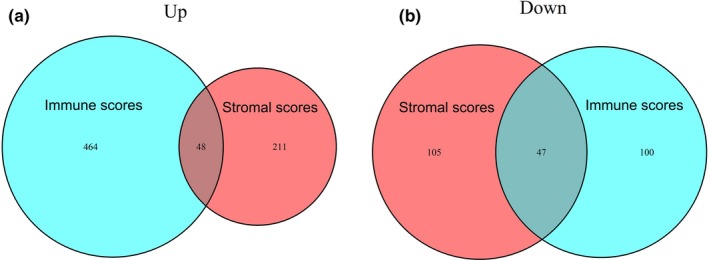
Common differentially expressed genes in immune scores and stromal scores. (a) Common upregulated genes; (b) common downregulated genes
3.3. Correlation between DEGs and overall survival
To assess the prognostic value of the 95 DEGs, we analyzed the relationship between the expression of each DEG and overall survival of the ccRCC patients. Among the 95 DEGs, 43 were significantly related to overall patient survival (p < .05); the top 10 results are shown in Figure 6.
Figure 6.
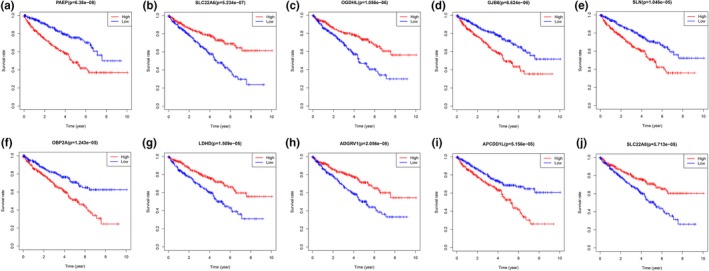
Top ten Kaplan–Meier analysis results of DEGs correlated with overall survival
3.4. GO function and KEGG pathway enrichment analyses of DEGs
To understand the potential mechanisms underlying the 95 DEGs and ccRCC development, we performed GO function annotation and KEGG pathway enrichment analyses using the DAVID database and its online analysis tool. The GO function analyses of the DEGs were divided into the following three parts: biological process (BP), molecular function (MF), and cell component (CC), and the top 15 results are shown in Figure 7a,b and Table 2. The DEGs were primarily enriched in the immune response (BP), extracellular region (CC), and cytokine activity (MF). Results of KEGG pathway enrichment analyses indicated that the DEGs were mainly enriched in six pathways involved in cytokine‒cytokine receptor interaction, hematopoietic cell lineage, primary immunodeficiency, chemokine signaling pathway, steroid hormone biosynthesis, and intestinal immune network for IgA production (Figure 7c,d and Table 3).
Figure 7.
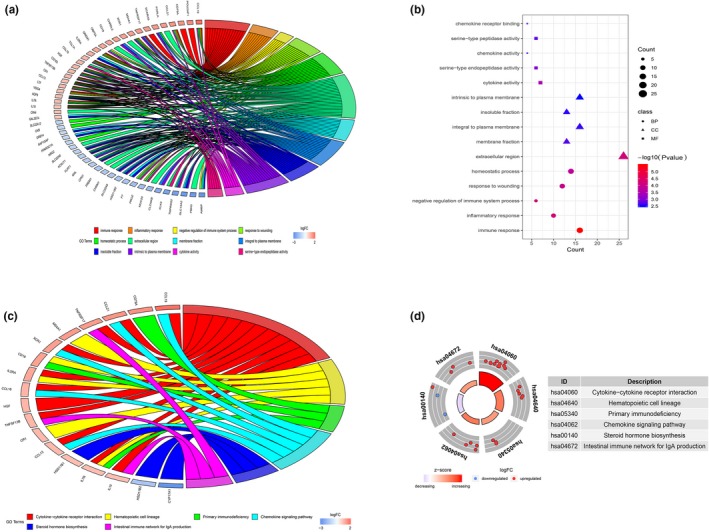
Top 15 GO enrichment terms of DEGs (a and b) and KEGG pathway analysis of DEGs (c and d)
Table 2.
Top 15 GO enrichment terms from analysis of DEGs
| Category | ID | Term | Count | p‐value |
|---|---|---|---|---|
| BP | GO:0006955 | Immune response | 16 | 3.24105E‐06 |
| BP | GO:0006954 | Inflammatory response | 10 | 5.99498E‐05 |
| BP | GO:0002683 | Negative regulation of immune system process | 6 | 8.33701E‐05 |
| BP | GO:0009611 | Response to wounding | 12 | 0.000118248 |
| BP | GO:0042592 | Homeostatic process | 14 | 0.000167634 |
| CC | GO:0005576 | Extracellular region | 26 | 7.3887E‐05 |
| CC | GO:0005624 | Membrane fraction | 13 | 0.001961813 |
| CC | GO:0005887 | Integral to plasma membrane | 16 | 0.002557573 |
| CC | GO:0005626 | Insoluble fraction | 13 | 0.002656894 |
| CC | GO:0031226 | Intrinsic to plasma membrane | 16 | 0.00317684 |
| MF | GO:0005125 | Cytokine activity | 7 | 0.000354613 |
| MF | GO:0004252 | Serine‐type endopeptidase activity | 6 | 0.000888895 |
| MF | GO:0008009 | Chemokine activity | 4 | 0.001424593 |
| MF | GO:0008236 | Serine‐type peptidase activity | 6 | 0.001692938 |
| MF | GO:0042379 | Chemokine receptor binding | 4 | 0.001711249 |
Table 3.
KEGG pathway analysis of DEGs
| ID | Pathway | Count | p‐value | Genes |
|---|---|---|---|---|
| hsa04060 | Cytokine‒cytokine receptor interaction | 11 | 4.85E‐06 | CCL13 IL2RA TNFSF13B CCL21 CCL19 TNFRSF17 HGF IL7R XCR1 IL10 CCL18 |
| hsa04640 | Hematopoietic cell lineage | 5 | 0.002402127 | CR1 CD19 IL2RA MS4A1 IL7R |
| hsa05340 | Primary immunodeficiency | 3 | 0.022496299 | CD19 CD79A IL7R |
| hsa04062 | Chemokine signaling pathway | 5 | 0.034718017 | CCL13 CCL21 CCL19 XCR1 CCL18 |
| hsa00140 | Steroid hormone biosynthesis | 3 | 0.037388975 | CYP17A1 HSD11B1 HSD11B2 |
| hsa04672 | Intestinal immune network for IgA production | 3 | 0.041959354 | TNFSF13B TNFRSF17 IL10 |
3.5. Construction of the PPI network of DEGs and analyses of the modules
To further explore the interaction of the DEGs and their mechanisms underlying the regulation of ccRCC development, we utilized the STRING online database to analyze the DEGs and construct a PPI network. The results were downloaded and analyzed in the Cytoscape software. In the PPI network, we identified 53 genes (Figure 8a) and 4 function modules (using MCODE). We selected the most important module (Figure 8b) and used the STRING database to analyze the biological processes associated with the genes in this module. Our results indicate that the genes were mainly enriched in the B‐cell receptor signaling pathway (Figure 8c).
Figure 8.
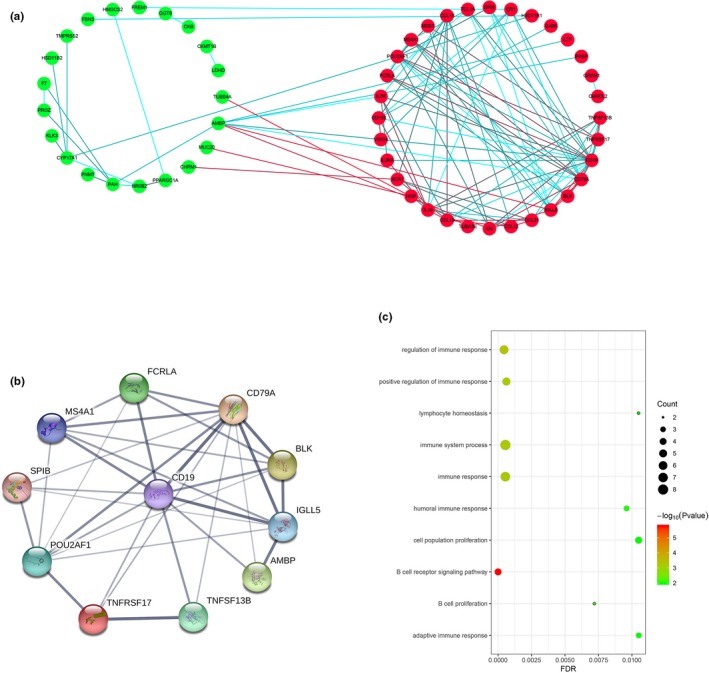
Constructed PPI network of DEGs and analysis of module. (a) PPI network of DEGs; red nodes represent upregulated DEGs and green nodes represent downregulated DEGs. The blue and red lines indicate the combined score from low to high. (b) The most important module; (c) biological process of all genes in the most important module
3.6. Identification and analyses of hub genes
To identify hub genes of the ccRCC microenvironment, we further analyzed the PPI network of DEGs using the degree algorithm in Cytoscape software. Ten hub genes were screened, based on their degree score. The screened hub genes were as follows: CD19, CD79A, IL10, IGLL5, POU2AF1, CCL19, AMBP, CCL18, CCL21, and IGJ (Figure 9a,b and Table 4). A network of the hub genes and their coexpressed genes was analyzed using the cBioPortal database, with a total of six hub genes in this network (Figure 9c). We analyzed the correlation between hub gene expression and overall ccRCC patient survival; the results are shown in Figure 10.
Figure 9.
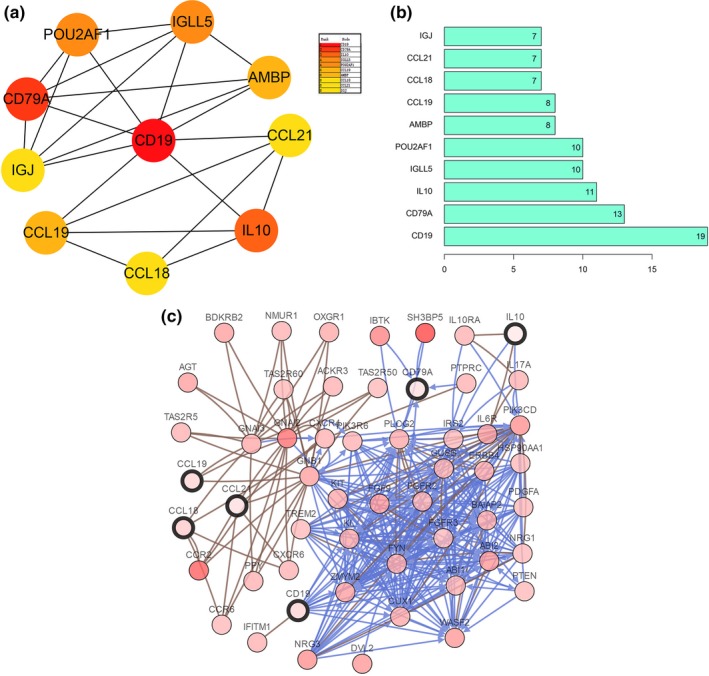
Identification and analysis of hub genes. (a) The ten hub genes were identified using Cytoscape. (b) Degree value of the ten hub genes; (c) hub genes and their co‐expression genes were analyzed via cBioPortal database
Table 4.
List of 10 hub genes
| Rank | Gene name | Gene ID | Description | Location | Expression | Degree score |
|---|---|---|---|---|---|---|
| 1 | CD19 | 930 | CD19 molecule | Chr16p11.2 | Upregulated | 19 |
| 2 | CD79A | 973 | CD79a molecule | Chr19q13.2 | Upregulated | 13 |
| 3 | IL10 | 3586 | interleukin 10 | Chr1q32.1 | Upregulated | 11 |
| 4 | IGLL5 | 100423062 | immunoglobulin lambda‐like polypeptide 5 | Chr22q11.22 | Upregulated | 10 |
| 5 | POU2AF1 | 5450 | POU class 2 homeobox associating factor 1 | Chr11q23.1 | Upregulated | 10 |
| 6 | CCL19 | 6363 | C‐C motif chemokine ligand 19 | Chr9p13.3 | Upregulated | 8 |
| 7 | AMBP | 259 | alpha−1‐microglobulin/bikunin precursor | Chr9q32 | Downregulated | 8 |
| 8 | CCL18 | 6362 | C‐C motif chemokine ligand 18 | Chr17q12 | Upregulated | 7 |
| 9 | CCL21 | 6366 | C‐C motif chemokine ligand 21 | Chr9p13.3 | Upregulated | 7 |
| 10 | IGJ (JCHAIN) | 1114 | Ig J chain (joining chain of multimeric IgA and IgM) | Chr4q13.3 | Upregulated | 7 |
Figure 10.

Kaplan–Meier analysis results of hub genes (p < .05). Three hub genes were found to be correlated with the prognosis of ccRCC patients: (a) IL10, (b) IGLL5, and (c) POU2AF1
4. DISCUSSION
In this study, we used TCGA database to screen tumor microenvironment‐related genes to explore the novel prognostic biomarkers and therapeutic targets of ccRCC. Moreover, we compared the gene expression profiles of 530 patients with high versus low immune scores (or stromal scores) and found 42 genes to be involved in the immune response.
First, we analyzed the relationship between immune/stromal scores and prognosis of ccRCC and found patients with high immune/stromal scores had a worse overall survival. In addition, the immune scores were significantly related to the clinical parameters (gender, grade, pathological stage, T stage, and M stage). These results suggested that the change of tumor microenvironment prominently correlated with the prognosis and development of ccRCC. We then analyzed the gene expression profiles of the patients in the high‐ versus low‐score groups and obtained 95 DEGs, which included 48 upregulated and 47 downregulated genes. Overall survival analysis of these 95 genes resulted in the identification of 43 genes associated with ccRCC patient outcomes. These results showed that tumor microenvironment‐related genes are an important predictor of ccRCC patient prognosis.
Next, we subjected the 95 DEGs to GO and KEGG enrichment analyses. Results of the GO functional analysis indicated that DEGs were mainly enriched in the immune response (BP), extracellular region (CC), and cytokine activity (MF). These results suggest that the DEGs play a vital role in regulating the ccRCC microenvironment, and could influence ccRCC development. Previous studies have suggested that the immune response contributes to tumor progression and drug resistance of various cancers (Astaneh, Dashti, & Esfahani, 2019; Miranda et al., 2019; Pitt et al., 2016), including bladder (Flores‐Martín et al., 2019; Holland et al., 2019), lung (Hays & Bonavida, 2019; Sorich, Rowland, Karapetis, & Hopkins, 2019), and breast cancers (Wagner et al., 2019). The results of the KEGG enrichment analyses suggested that the DEGs were mostly enriched in cytokine‒cytokine receptor interaction, hematopoietic cell lineage, primary immunodeficiency, chemokine signaling pathway, steroid hormone biosynthesis, and intestinal immune network for IgA production. These signaling pathways also play a key role in the ccRCC microenvironment and the progression of ccRCC. Previous studies indicated that the cytokine‒cytokine receptor interaction might participate in the development of glioblastoma (GBM) (Agrawal et al., 2018) and osteosarcoma (Tsukamoto et al., 2012), and modulate the tumor microenvironment of hematopoietic cell lineage. Therefore, regulation of the tumor microenvironment could impact tumor progression (Flores et al., 2018; Xiong et al., 2015). Hematopoietic stem cells, through the myeloid lineage, may act as progenitors for cancer‐associated adipocytes (CAAs) and cancer‐associated fibroblasts (CAFs); these cells could remodel the tumor microenvironment, thereby driving all aspects of tumor progression, including tumor growth and survival, chemoresistance, tumor vascularization, tumor invasion, and tumor cell metastasis (Xiong et al., 2015). Moreover, primary immunodeficiency (Yazdani et al., 2017), chemokine signaling pathway (Meng, Xue, & Chen, 2018; Zhou, Cao, Li, & Zhao, 2018), steroid hormone biosynthesis (Boibessot & Toren, 2018; Hima & Sreeja, 2016), and intestinal immune network for IgA production (Liang et al., 2018) all participate in tumor progression and regulation of the tumor microenvironment. Moreover, we performed module analyses on the constructed PPI network, selected the most significant module, and performed BP analysis of the genes in this module. We found that the genes in the module were primarily enriched in the B‐cell receptor signaling pathway. These results indicate that the development of ccRCC and changes to the ccRCC microenvironment might be related to these biological processes.
Finally, we selected 10 DEGs as hub genes using the degree algorithm. The hub genes are CD19, CD79A, IL10, IGLL5, POU2AF1, CCL19, AMBP, CCL18, CCL21, and IGJ (JCHAIN). We then analyzed the correlation between these 10 DEGs and the prognosis of ccRCC patients and found that three hub genes (IL10, IGLL5, and POU2AF1) were associated with overall patient survival. These three genes are of particular interest. Interleukin‐10 (IL10) is produced by immune cells (e.g., macrophages, T lymphocytes, and natural killer cells) and functions as a multifunctional immune‐regulatory cytokine with both immunosuppressive and antiangiogenic effects (Sheikhpour et al., 2018). IL10 plays an important role in both immune‐mediated diseases and cancer (Geginat et al., 2016; Mannino et al., 2015); Wang et al found that lower serum IL10 levels were correlated with a better prognosis in cervical cancer patients (Wang et al., 2018). In addition, IL10 might promote tumor cell proliferation and metastasis through immunosuppression. A previous study has shown that it promotes IL6 expression and synthesis, which gives rise to cell proliferation via B‐cell lymphoma‐2 (Bcl‐2) upregulation that changes the proliferation/apoptosis equivalence toward neoplastic cell proliferation (Sheikhpour et al., 2018). IGLL5 encodes one of the immunoglobulin lambda‐like polypeptides and plays a significant role in tumor progression. Liang et al reported that fusion of the IGLL5 gene might promote metastasis of the lymph nodes and play a role in breast cancer development (Liang et al., 2015). Moreover, White et al found that an IGLL5 mutation was associated with the incidence and progression of multiple myeloma (MM) (White et al., 2018). POU2AF1 is also an important gene in tumorigenesis and tumor progression. Zhao et al. reported that POU2AF1 is activated by amplification (or through other mechanisms) and may promote MM progression by accelerating the growth of MM cells through direct transactivation of one of its target genes, TNFRSF17 (Zhao et al., 2008). Expression dysregulation or POU2AF1 mutation is also related to the development of chronic lymphocytic leukemia (CLL) (Auer et al., 2005).
The tumor microenvironment plays an important role in the evolution of tumors. For example, in breast cancer, changes in the tumor microenvironment components were considered a key element for cancer development and progression, as well as potential therapeutic targets. Various components of the tumor microenvironment, such as suppressive immune cells, soluble factors, and altered extracellular matrix, act together to impede effective antitumor immunity and promote breast cancer progression and metastasis (Soysal, Tzankov, & Muenst, 2015). In addition, changes in the tumor microenvironment have also been found to be correlated with drug resistance; Mikami et al. (2019) detected upregulated expression of PD‐1 and PD‐L1 in tumor‐infiltrating immune cells (TIIC) in the tumor microenvironment, related to the resistance of vascular endothelial growth factor‐tyrosine kinase inhibitors (VEGF‐TKIs).
In the present study, we examined how patterns of gene expression in the tumor microenvironment influenced components of the microenvironment and the prognosis of ccRCC patients. Our results provide data that will support further explorations of the complex interactions between the tumor and its environment in ccRCC. Inevitably, our study had a few limitations. First, we used data from public databases that were not verified in prospective clinical trials. Second, the functions of the DEGs that impact the development of ccRCC need to be investigated further through in vivo and in vitro experiments.
5. CONCLUSION
In summary, our study revealed correlations between the ccRCC microenvironment and patient prognosis, and also between gene expression in the microenvironment and overall survival of patients. These findings increase the understanding of the mechanisms through which gene expression affects the prognosis and development of ccRCC through the tumor microenvironment. This study also screened several candidate genes and biological pathways that may contribute to the search for biomarkers and therapeutic targets of ccRCC. However, further experiments are necessary to probe the biological function of these genes in ccRCC.
CONFLICT OF INTERESTS
The authors declare that they have no competing interests.
AUTHOR CONTRIBUTIONS
Bangbei Wan, Yuan Huang, and Cai Lv conceived and designed the study. Bangbei Wan and Bo Liu revised the images and performed data analysis. Bangbei Wan and Cai Lv wrote and revised the manuscript.
ETHICAL STATEMENT
Our study did not require an ethical board approval because it did not contain human or animal trials.
Wan B, Liu B, Huang Y, Lv C. Identification of genes of prognostic value in the ccRCC microenvironment from TCGA database. Mol Genet Genomic Med. 2020;8:e1159 10.1002/mgg3.1159
Funding information
The study was supported by the Natural Science Foundation of Hainan Province (No. 819MS136).
REFERENCES
- Adashek, J. J. , Salgia, M. M. , Posadas, E. M. , Figlin, R. A. , & Gong, J. (2019). Role of biomarkers in prediction of response to therapeutics in metastatic renal‐cell carcinoma. Clinical Genitourinary Cancer, 17(3), e454–e460. 10.1016/j.clgc.2019.01.004 [DOI] [PubMed] [Google Scholar]
- Agrawal, R. , Garg, A. , Benny Malgulwar, P. , Sharma, V. , Sarkar, C. , & Kulshreshtha, R. (2018). p53 and miR‐210 regulated NeuroD2, a neuronal basic helix‐loop‐helix transcription factor, is downregulated in glioblastoma patients and functions as a tumor suppressor under hypoxic microenvironment. International Journal of Cancer, 142(9), 1817–1828. 10.1002/ijc.31209 [DOI] [PubMed] [Google Scholar]
- Astaneh, M. , Dashti, S. , & Esfahani, Z. T. (2019). Humoral immune responses against cancer‐testis antigens in human malignancies. Human Antibodies, 27(4), 237–240. 10.3233/HAB-190377 [DOI] [PubMed] [Google Scholar]
- Auer, R. L. , Starczynski, J. , McElwaine, S. , Bertoni, F. , Newland, A. C. , Fegan, C. D. , & Cotter, F. E. (2005). Identification of a potential role for POU2AF1 and BTG4 in the deletion of 11q23 in chronic lymphocytic leukemia. Genes, Chromosomes and Cancer, 43(1), 1–10. 10.1002/gcc.20159 [DOI] [PubMed] [Google Scholar]
- Bader, G. D. , & Hogue, C. W. (2003). An automated method for finding molecular complexes in large protein interaction networks. BMC Bioinformatics, 4, 2. [DOI] [PMC free article] [PubMed] [Google Scholar]
- Boibessot, C. , & Toren, P. (2018). Sex steroids in the tumor microenvironment and prostate cancer progression. Endocrine‐Related Cancer, 25(3), R179–R196. 10.1530/ERC-17-0493 [DOI] [PubMed] [Google Scholar]
- Chin, C. H. , Chen, S. H. , Wu, H. H. , Ho, C. W. , Ko, M. T. , & Lin, C. Y. (2014). cytoHubba: Identifying hub objects and sub‐networks from complex interactome. BMC Systems Biology, 8(Suppl 4), S11 10.1186/1752-0509-8-S4-S11 [DOI] [PMC free article] [PubMed] [Google Scholar]
- Dutcher, J. P. (2013). Recent developments in the treatment of renal cell carcinoma. Therapeutic Advances in Urology, 5(6), 338–353. 10.1177/1756287213505672 [DOI] [PMC free article] [PubMed] [Google Scholar]
- Flores, C. T. , Wildes, T. J. , Drake, J. A. , Moore, G. L. , Dean, B. D. , Abraham, R. S. , & Mitchell, D. A. (2018). Lin‐CCR2+ hematopoietic stem and progenitor cells overcome resistance to PD‐1 blockade. Nature Communications, 9(1), 4313 10.1038/s41467-018-06182-5 [DOI] [PMC free article] [PubMed] [Google Scholar]
- Flores‐Martín, J. F. , Perea, F. , Exposito‐Ruiz, M. , Carretero, F. J. , Rodriguez, T. , Villamediana, M. , … Aptsiauri, N. (2019). A combination of positive tumor HLA‐I and negative PD‐L1 expression provides an immune rejection mechanism in bladder cancer. Annals of Surgical Oncology, 2226(8), 2631–2639. 10.1245/s10434-019-07371-2 [DOI] [PubMed] [Google Scholar]
- Franceschini, A. , Szklarczyk, D. , Frankild, S. , Kuhn, M. , Simonovic, M. , Roth, A. , … Jensen, L. J. (2013). STRING v9. 1: Protein‐protein interaction networks, with increased coverage and integration. Nucleic Acids Research, 41(D1), D808–D815. 10.1093/nar/gks1094 [DOI] [PMC free article] [PubMed] [Google Scholar]
- Geginat, J. , Larghi, P. , Paroni, M. , Nizzoli, G. , Penatti, A. , Pagani, M. , … Flavell, R. A. (2016). The light and the dark sides of Interleukin‐10 in immune‐mediated diseases and cancer. Cytokine and Growth Factor Reviews, 30, 87–93. 10.1016/j.cytogfr.2016.02.003 [DOI] [PubMed] [Google Scholar]
- George, D. J. , Martini, J.‐F. , Staehler, M. , Motzer, R. J. , Magheli, A. , Escudier, B. , … Ravaud, A. (2018). Immune biomarkers predictive for disease‐free survival with adjuvant sunitinib in high‐risk locoregional renal cell carcinoma: from randomized phase III S‐TRAC study. Clinical Cancer Research, 24(7), 1554–1561. 10.1158/1078-0432.CCR-17-2822 [DOI] [PubMed] [Google Scholar]
- Hays, E. , & Bonavida, B. (2019). YY1 regulates cancer cell immune resistance by modulating PD‐L1 expression. Drug Resistance Updates, 43, 10–28. 10.1016/j.drup.2019.04.001 [DOI] [PubMed] [Google Scholar]
- Hima, S. , & Sreeja, S. (2016). Modulatory role of 17β‐estradiol in the tumor microenvironment of thyroid cancer. IUBMB Life, 68(2), 85–96. 10.1002/iub.1462 [DOI] [PubMed] [Google Scholar]
- Holland, B. C. , Sood, A. , Delfino, K. , Dynda, D. I. , Ran, S. , Freed, N. , & Alanee, S. (2019). Age and sex have no impact on expression levels of markers of immune cell infiltration and immune checkpoint pathways in patients with muscle‐invasive urothelial carcinoma of the bladder treated with radical cystectomy. Cancer Immunology, Immunotherapy, 68(6), 991–997. 10.1007/s00262-019-02340-w [DOI] [PMC free article] [PubMed] [Google Scholar]
- Jonasch, E. , Futreal, P. A. , Davis, I. J. , Bailey, S. T. , Kim, W. Y. , Brugarolas, J. , … Rathmell, W. K. (2012). State of the science: An update on renal cell carcinoma. Molecular Cancer Research, 10(7), 859–880. 10.1158/1541-7786.MCR-12-0117 [DOI] [PMC free article] [PubMed] [Google Scholar]
- Liang, F. , Qu, H. , Lin, Q. , Yang, Y. , Ruan, X. , Zhang, B. O. , … Hao, X. (2015). Molecular biomarkers screened by next‐generation RNA sequencing for non‐sentinel lymph node status prediction in breast cancer patients with metastatic sentinel lymph nodes. World Journal of Surgical Oncology, 13, 258 10.1186/s12957-015-0642-2 [DOI] [PMC free article] [PubMed] [Google Scholar]
- Liang, L. , Zeng, J. H. , Qin, X. G. , Chen, J. Q. , Luo, D. Z. , & Chen, G. (2018). Distinguishable prognostic signatures of left‐ and right‐sided colon cancer: A study based on sequencing data. Cellular Physiology and Biochemistry, 48(2), 475–490. 10.1159/000491778 [DOI] [PubMed] [Google Scholar]
- Mannino, M. H. , Zhu, Z. , Xiao, H. , Bai, Q. , Wakefield, M. R. , & Fang, Y. (2015). The paradoxical role of IL‐10 in immunity and cancer. Cancer Letters, 367(2), 103–107. 10.1016/j.canlet.2015.07.009 [DOI] [PubMed] [Google Scholar]
- Meng, W. , Xue, S. , & Chen, Y. (2018). The role of CXCL12 in tumor microenvironment. Gene, 2018(641), 105–110. 10.1016/j.gene.2017.10.015 [DOI] [PubMed] [Google Scholar]
- Mikami, S. , Mizuno, R. , Kondo, T. , Shinohara, N. , Nonomura, N. , Ozono, S. , … Oya, M. (2019). Clinical significance of PD‐1 and PD‐L1 expression in the tumor microenvironment of clear cell renal cell carcinoma. Cancer Science, 110(6), 1820–1828. 10.1111/cas.14019 [DOI] [PMC free article] [PubMed] [Google Scholar]
- Miranda, A. , Hamilton, P. T. , Zhang, A. W. , Pattnaik, S. , Becht, E. , Mezheyeuski, A. , … Nelson, B. H. (2019). Cancer stemness, intratumoral heterogeneity, and immune response across cancers. Proceedings of the National Academy of Sciences of the United States of America, 116(18), 9020–9029. 10.1073/pnas.1818210116 [DOI] [PMC free article] [PubMed] [Google Scholar]
- Motzer, R. J. , Jonasch, E. , Agarwal, N. , Bhayani, S. , Bro, W. P. , Chang, S. S. , … Kumar, R. (2017). Kidney cancer, Version 2.2017, NCCN clinical practice guidelines in oncology. Journal of the National Comprehensive Cancer Network, 15(6), 804–834. 10.6004/jnccn.2017.0100 [DOI] [PubMed] [Google Scholar]
- Pitt, J. M. , Marabelle, A. , Eggermont, A. , Soria, J. C. , Kroemer, G. , & Zitvogel, L. (2016). Targeting the tumor microenvironment: Removing obstruction to anticancer immune responses and immunotherapy. Annals of Oncology, 27(8), 1482–1492. 10.1093/annonc/mdw168 [DOI] [PubMed] [Google Scholar]
- Şenbabaoğlu, Y. , Gejman, R. S. , Winer, A. G. , Liu, M. , Van Allen, E. M. , de Velasco, G. , … Hakimi, A. A. (2016). Tumor immune microenvironment characterization in clear cell renal cell carcinoma identifies prognostic and immunotherapeutically relevant messenger RNA signatures. Genome Biology, 17(1), 231 10.1186/s13059-016-1092-z [DOI] [PMC free article] [PubMed] [Google Scholar]
- Shannon, P. , Markiel, A. , Ozier, O. , Baliga, N. S. , Wang, J. T. , Ramage, D. , … Ideker, T. (2003). Cytoscape: A software environment for integrated models of biomolecular interaction networks. Genome Research, 13(11), 2498–2504. 10.1101/gr.1239303 [DOI] [PMC free article] [PubMed] [Google Scholar]
- Sheikhpour, E. , Noorbakhsh, P. , Foroughi, E. , Farahnak, S. , Nasiri, R. , & Neamatzadeh, H. (2018). A survey on the role of interleukin‐10 in breast cancer: A narrative. Reports of Biochemistry and Molecular Biology, 7(1), 30–37. [PMC free article] [PubMed] [Google Scholar]
- Sorich, M. J. , Rowland, A. , Karapetis, C. S. , & Hopkins, A. M. (2019). Evaluation of the lung immune prognostic index for prediction of survival and response in patients treated with atezolizumab for non‐small cell lung cancer: Pooled analysis of clinical trials. Journal of Thoracic Oncology, 14(8), 1440–1446. 10.1016/j.jtho.2019.04.006 [DOI] [PubMed] [Google Scholar]
- Soysal, S. D. , Tzankov, A. , & Muenst, S. E. (2015). Role of the tumor microenvironment in breast cancer. Pathobiology, 82(3–4), 142–152. 10.1159/000430499 [DOI] [PubMed] [Google Scholar]
- Tsukamoto, S. , Honoki, K. , Fujii, H. , Tohma, Y. , Kido, A. , Mori, T. , … Tanaka, Y. (2012). Mesenchymal stem cells promote tumor engraftment and metastatic colonization in rat osteosarcoma model. International Journal of Oncology, 40(1), 163–169. 10.3892/ijo.2011.1220 [DOI] [PubMed] [Google Scholar]
- Wagner, J. , Rapsomaniki, M. A. , Chevrier, S. , Anzeneder, T. , Langwieder, C. , Dykgers, A. , … Bodenmiller, B. (2019). A single‐cell atlas of the tumor and immune ecosystem of human breast cancer. Cell, 177(5), 1330–1345. 10.1016/j.cell.2019.03.005 [DOI] [PMC free article] [PubMed] [Google Scholar]
- Wang, B. , Wang, H. , Li, P. , Wang, L. , Liu, H. , Liu, J. , & Wang, L. (2018). Relationships of interleukin‐10 with the regulatory T cell ratio and prognosis of cervical cancer patients. Clinics (Sao Paulo), 73, e679 10.6061/clinics/2018/e679 [DOI] [PMC free article] [PubMed] [Google Scholar]
- White, B. S. , Lanc, I. , O’Neal, J. , Gupta, H. , Fulton, R. S. , Schmidt, H. , … Tomasson, M. H. (2018). A multiple myeloma‐specific capture sequencing platform discovers novel translocations and frequent, risk‐associated point mutations in IGLL5. Blood Cancer Journal, 8(3), 35 10.1038/s41408-018-0062-y [DOI] [PMC free article] [PubMed] [Google Scholar]
- Wu, T. , & Dai, Y. (2017). Tumor microenvironment and therapeutic response. Cancer Letters, 387, 61–68. 10.1016/j.canlet.2016.01.043 [DOI] [PubMed] [Google Scholar]
- Xiong, Y. , McDonald, L. T. , Russell, D. L. , Kelly, R. R. , Wilson, K. R. , Mehrotra, M. , … LaRue, A. C. (2015). Hematopoietic stem cell‐derived adipocytes and fibroblasts in the tumor microenvironment. World Journal of Stem Cells, 7(2), 253–265. 10.4252/wjsc.v7.i2.253 [DOI] [PMC free article] [PubMed] [Google Scholar]
- Yazdani, R. , Abolhassani, H. , Asgardoon, M. H. , Shaghaghi, M. , Modaresi, M. , Azizi, G. , & Aghamohammadi, A. (2017). Infectious and noninfectious pulmonary complications in patients with primary immunodeficiency disorders. Journal of Investigational Allergology and Clinical Immunology, 27(4), 213–224. 10.18176/jiaci.0166 [DOI] [PubMed] [Google Scholar]
- Zhao, C. , Inoue, J. , Imoto, I. , Otsuki, T. , Iida, S. , Ueda, R. , & Inazawa, J. (2008). POU2AF1, an amplification target at 11q23, promotes growth of multiple myeloma cells by directly regulating expression of a B‐cell maturation factor, TNFRSF17. Oncogene, 27(1), 63–75. 10.1038/sj.onc.1210637 [DOI] [PubMed] [Google Scholar]
- Zhou, Y. , Cao, H. B. , Li, W. J. , & Zhao, L. (2018). The CXCL12 (SDF‐1)/CXCR4 chemokine axis: Oncogenic properties, molecular targeting, and synthetic and natural product CXCR4 inhibitors for cancer therapy. Chinese Journal of Natural Medicines, 16(11), 801–810. 10.1016/S1875-5364(18)30122-5 [DOI] [PubMed] [Google Scholar]


