

Abstract
In order to dissect the adaptation response of maize to heat-stress, we characterized and juxtaposed different physio-biochemical parameters for two contrasting genotypes, namely DTPYC9F119 (heat-stress tolerant) and K64R (heat-stress susceptible) under 6 days heat treatment (38/28 °C). Chlorophyll a and b content was found to be reduced under high temperature in both the genotypes, but, it was reduced more prominently in the susceptible genotype (K64R). Net photosynthetic rate was significantly reduced under high temperature in K64R but this reduction was relatively lower in case of DTPYC9F119. Stomatal conductance was increased under stress treatment in both the genotypes but the rate of increase was lower in tolerant one (DTPYC9F119). Activity of anti-oxidant enzymes (viz. catalase, peroxidase and superoxide dismutase) and their gene expression was increased in both the genotypes under heat-stress condition. Thus, the heat-stress tolerant genotype has evolved some strategies like modulation of anti-oxidant gene expression, lower transpiration rate, lower increase of internal CO2 concentration which could make sustain a basic level of photosynthesis even under high temperature stress, etc. that may contribute to its tolerance trait.
Keywords: Maize, Heat-stress, Photosynthesis, Antioxidant genes
Introduction
Maize (Zea mays L.), also known as the queen of cereals because of its highest genetic yield potential among the cereals, is the principal feed crop of the world. Most of the maize crop is grown in the warmer part of the temperate regions and in the humid subtropical climate, with higher production coming from areas having the warmest month isotherms from 21 to 27 °C and a frost free season of 120–180 days duration. Maize contributes about 36% in the global grain production. It has been predicted that due to climate change induced heat and water stresses, the production of major cereals may decline in future. If the current trends persist until 2050, major crop yields and food production capacity of highly populous South Asia might significantly decrease by 17% for maize, 12% for wheat, and 10% for rice (Anonymous 2009). At the same time, it has been predicted that over the next 50 years, for agriculture to feed an additional 3.5 billion people, production of major cereals crops like maize, wheat and rice will need to increase by 70% (Cairns et al. 2013). Heat-stress severely hampers the overall reproductive stage in maize (Hasanuzzaman et al. 2013). Even a few degrees increase in temperature during flowering time can result in significant losses in grain yield (Lobell et al. 2011).
Several studies on heat stress have identified pollination, fertilization and kernel setting as the most heat-sensitive reproductive processes in the cereals (Barnabás et al. 2008). In case of maize, it can desiccate exposed silk and pollen grains released from the anthers due to thin outer membranes (Sinsawat et al. 2004; Singh et al. 2017a). Vegetative growth, mainly leaf growth has been reported to increase in maize from 0 to 35 °C temperature, with sharp decline at 35–40 °C. Beyond this temperature, a sharp decline in photosynthesis and protein metabolism occurs which may be the result of protein denaturation, enzyme inactivation, inhibited protein synthesis and its degradation (Yadava et al. 2016a). The activation state of the major photosynthesis enzyme RuBP carboxylase declines at 32.5 °C (Crafts-Brandner and Salvucci 2002) with more or less complete inactivation at 45 °C and the plant dies at 54 °C (Steven et al. 2002). We have already identified heat-stress tolerant recombinant inbred lines (RILs) in maize (Singh et al. 2017b) and recently reported expression of heat-stress induced heat shock protein genes in two contrsting maize inbred lines (Kumar et al. 2019). The present investigation was carried out to compare and evaluate the effects of high temperature stress on two contrasting maize genotypes.
Materials and methods
Plant growth and treatments
Two contrasting maize genotypes DTPYC9F119 and K64R, identified as heat-stress tolerant and susceptible respectively (Debnath et al. 2016), were grown under controlled conditions in the green house in pots in Completely Randomized Design (CRD) up to the flowering stage. At the flowering stage, the plants were divided in two sets. One set was transferred to a plant growth chamber kept at 25/20 °C (days and night temperature of 14/10 h cycle) with 80% relative humidity, while the other set was shifted to a plant growth chamber maintained at 38 °C for 14 h and 28 °C for 10 h in constant 40% relative humidity (heat-stress). The plants were subjected to heat-stress for 6 days and different observations were recorded at 0, 2, 4, and 6 days after treatment to identify characteristic differences between the two contrasting genotypes.
Physiological assays
Chlorophyll content was estimated as per the method described by Hiscox and Israelstam (1979). Membrane stability index (MSI) was estimated according to the method described by Premachandra et al. (1990). Total soluble protein was calculated based on the method described by Bradford (1976).
Photosynthesis and stomatal conductance
The photosynthetic rate and the stomatal conductance were measured with the help of infrared gas analyzer (LI-COR, Biosciences, USA, model LI-6400) equipped with air supply unit and a broad leaf chamber (aperture area 6.25 cm2). Measurement was taken after enclosing the upper youngest fully opened leaf into the leaf chamber between 10:00 a.m. to 12:00 a.m.
Antioxidant enzymes
The activities of superoxide dismutase (SOD), catalase (CAT) and peroxidase (POX) were assayed following the methods adapted from Dhindsa et al. (1981), Aebi (1984) and Castillo et al. (1984) respectively and described in detail previously (Yadava et al. 2013, 2016b).
Total RNA isolation and cDNA preparation
Total RNA was extracted from pools of three plants for each experimental sample using the Genetix RNA isolation kit (Genetix Biotech, New Delhi) followed by treatment with DNase I to remove any genomic DNA contamination. Concentrations were determined with a NanoDrop spectrophotometer (Thermo scientific NanoDrop 1000). The cDNA was synthesized using Superscript III Kit (Invitrogen) from 1 μg of total RNA according to the manufacturer’s protocol. The reverse transcription reaction was carried out at 44 °C for 60 min followed by 92 °C for 10 min. The reaction without template was included as control.
Antioxidant gene expression
To identify the modulation of antioxidant gene expression, semi quantitative Reverse Transcriptase PCR (RT-PCR) was done with ZmSod2, ZmCat1 and ZmApx1 gene specific primers (Table 1). The intensity of the RT-PCR bands was measured using gene tool Syngene software and normalized with respect to β actin control.
Table 1.
List of primers used for antioxidant gene expression analysis
| Gene/primer name | Primer sequence | Tm (°C) |
|---|---|---|
| Sod2_F | ACAATGGTGAAGGCAGTTGCTGTC | 62.7 |
| Sod2_R | TTAGCCTTGGAGCCCAATGATACC | 62.7 |
| Cat1_F | AGCCATGGATCCATACAAGCACC | 62.4 |
| Cat1_R | TCTTACATGCTCGGCTTCAGGTTC | 62.7 |
| Apx1_F | CATGGCGAAGAACTACCCAACC | 62.1 |
| Apx1_R | TTAAGCATCAGCATACCCCAGTTC | 61.0 |
Statistical analysis
Recorded data were pooled together on account of non-significant interaction between genotypes, temperature treatment and days after treatment. The data were then subjected to Univariate Analysis of Variance. Treatment means were separated using least significant difference (LSD) at 0.05 probability level.
Results
Chlorophyll a and b content and their ratio
High temperature had a significant effect on chlorophyll a and b content in the two contrasting genotypes. No significant change was seen under control conditions. However, there was significant decrease in chlorophyll a and b content during 6 days of high temperature treatment with the rate of decrease being more prominent in K64R genotype. Chlorophyll a and b ratio increased significantly under high temperature in both the genotypes but the increment was more pronounced in DTPYC9F119. Before high temperature treatment, the chlorophyll a and b ratio in DTPYC9F119 and K64R genotypes was 3.32 and 2.63, respectively. After 6 days of high temperature treatment, it increased to 7.00 and 5.66 in the two genotypes, respectively (Table 2). It can be attributed to higher decrease in the chlorophyll b content than chlorophyll a.
Table 2.
Effect of heat-stress on chlorophyll a and chlorophyll b content (mg/g fresh weight) and chlorophyll a and b ratio in two contrasting maize genotypes
| Days after treatment | DTPYC9F119 | K64R | ||
|---|---|---|---|---|
| Control | Heat-stress | Control | Heat-stress | |
| Chlorophyll a | ||||
| 0 | 1.71 | 1.71 | 1.73 | 1.73 |
| 2 | 1.69 | 1.53 | 1.62 | 1.43 |
| 4 | 1.58 | 1.07 | 1.49 | 0.96 |
| 6 | 1.52 | 1.05 | 1.48 | 0.68 |
| LSD0.05 G = 0.06; T = 0.06; D = 0.08; T × D = 0.12; T × G = NS; D × G = NS; T × D × G = NS | ||||
| Chlorophyll b | ||||
| 0 | 0.52 | 0.52 | 0.66 | 0.66 |
| 2 | 0.52 | 0.36 | 0.58 | 0.32 |
| 4 | 0.49 | 0.19 | 0.53 | 0.21 |
| 6 | 0.43 | 0.15 | 0.51 | 0.12 |
| LSD 0.05 G = NS;T = 0.03; D = 0.05; T × D = 0.07; T × G = 0.05; D × G = 0.07; T × D × G = NS | ||||
| Chlorophyll a: Chlorophyll b | ||||
| 0 | 3.32 | 3.28 | 2.63 | 2.63 |
| 2 | 3.26 | 4.63 | 2.79 | 4.46 |
| 4 | 3.20 | 5.63 | 2.82 | 4.59 |
| 6 | 3.57 | 7.00 | 2.90 | 5.66 |
| LSD 0.05 G = 0.06; T = 0.06; D = 0.85; T × D = 0.01; T × G = 0.08; D × G = 0.12; T × D × G = 0.17 | ||||
G genotype, T temperature treatment, D days after treatment
Total soluble proteins
Significant reduction in total soluble protein content was observed under high temperature stress in both the genotypes but no significant change was seen under control conditions. In DTPYC9F119, the total soluble protein content under heat-stress was reduced by 3.85%, 4.87% and 1.80%, whereas in case for K64R, the percent reduction was to the magnitude of 3.97%, 3.32% and 13.38% after 2, 4 and 6 days of treatment (Table 3).
Table 3.
Effect of heat-stress on total soluble protein (mg/g fresh weight) and membrane stability index (%) in two contrasting maize genotypes
| Days after treatment | DTPYC9F119 | K64R | ||
|---|---|---|---|---|
| Control | Heat-stress | Control | Heat-stress | |
| Total soluble proteins | ||||
| 0 | 21.78 | 21.78 | 16.09 | 16.09 |
| 2 | 22.46 | 20.94 | 16.55 | 15.45 |
| 4 | 22.93 | 19.92 | 17.11 | 14.92 |
| 6 | 23.54 | 19.56 | 17.31 | 12.93 |
| LSD 0.05 G = 0.09; T = 0.09; D = 0.13; T × D = 0.19; T × G = 0.13; D × G = 0.19; T × D × G = 0.26 | ||||
| Membrane stability index | ||||
| 0 | 61.53 | 61.52 | 58.21 | 58.21 |
| 2 | 61.98 | 55.68 | 58.68 | 51.00 |
| 4 | 62.56 | 51.42 | 53.42 | 43.71 |
| 6 | 63.21 | 47.34 | 50.34 | 38.16 |
| LSD 0.05 G = 0.79; T = 0.79; D = 1.13; T × D = 1.59; T × G = 1.13; D × G = 1.59; T × D × G = 2.26 | ||||
G genotype, T temperature treatment, D days after treatment
Membrane stability
Significant differences were observed between the contrasting genotypes for MSI under heat-stress. At the initial level, MSI of DTPYC9F119 and K64R were 61.52 and 58.21 respectively, in both the control and the heat-stress condition. After 6 days treatment, MSI was reduced to 47.34 in DTPYC9F119 and 38.16 in K64R. The percent reduction after 6 days of high temperature treatment was found more in K64R (34.44%) as compared to DTPYC9F119 (23.03%) (Table 3).
Net photosynthetic rate and stomatal conductance
Net photosynthesis rate was reduced significantly under high temperature stress in both the genotypes but no significant change was found under the control condition. In K64R, the decrease in photosynthesis was three times more than that observed in DTPYC9F119. The decrease in the net photosynthetic rate was significant between the two temperature treatments; between the two contrasting genotypes; and also interaction between temperature and genotype. After 6 days of heat treatment, photosynthesis reduction was found to be 21.52% in DTPYC9F119 and 61.27% in K64R (Table 4).
Table 4.
Effect of heat-stress on net photosynthetic rate (µ mol m−2 s−1) and stomatal conductance (m mol m−2 s−1) in two contrasting maize genotypes
| Days after treatment | DTPYC9F119 | K64R | ||
|---|---|---|---|---|
| Control | Heat-stress | Control | Heat-stress | |
| Net photosynthetic rate | ||||
| 0 | 44.09 | 44.00 | 36.43 | 36.45 |
| 2 | 44.18 | 42.08 | 36.52 | 30.93 |
| 4 | 44.29 | 37.37 | 36.61 | 26.28 |
| 6 | 44.28 | 34.53 | 36.92 | 23.82 |
| LSD 0.05 G = 0.33; T = 0.33; D = 0.47; T × D = 0.67; T × G = 0.47; D × G = 0.67; T × D × G = 0.94 | ||||
| Stomatal conductance | ||||
| 0 | 248.53 | 248.53 | 216.01 | 216.05 |
| 2 | 248.82 | 256.39 | 216.72 | 235.33 |
| 4 | 248.88 | 260.53 | 216.98 | 260.80 |
| 6 | 249.94 | 266.97 | 218.11 | 297.98 |
| LSD 0.05 G = 0.75; T = 0.75; D = 1.06; T × D = 1.50; T × G = 1.06; D × G = 1.50; T × D × G = 2.12 | ||||
G genotype, T temperature treatment, D days after treatment
Stomatal conductance increased significantly under heat-stress condition over the control in both the genotypes. In K64R, the rate of increase was 5.7 times more than DTPYC9F119 genotype. Before exposure to heat-stress, stomatal conductance was 248.53 m mol m−2 s−1 and 216.04 m mol m−2 s−1 in DTPYC9F119 and K64R respectively, but after 6 days treatment, it increased to 266.97 m mol m−2 s−1 and 297.98 m mol m−2 s−1. Interaction of all the three factors (genotype, treatment and days after treatment) showed significant influence on stomatal conductance (Table 4). Under heat-stress, there was a steady increase in the stomatal conductance and steady reduction in photosynthesis rate in DTPYC9F119, while a sharp increase in stomatal conductance and sharp decrease in photosynthesis rate was observed in K64R, indicating less adaptability of K64R to high temperature as compared to DTPYC9F119.
Antioxidant enzyme activities
Under high temperature, SOD, CAT and POX activities increased significantly as compared to ambient temperature condition (Table 5). Initially, SOD activity of DTPYC9F119 was found to be 2.84 Units/min/mg proteins and it increased up to a level of 4.77 Units/min/mg proteins. In K64R also, SOD activity increased at high temperature but percentage increase (37.95%) was less than that of DTPYC9F119 (68.15%). Before treatment, CAT activity was more in DTPYC9F119 (3.18 µmol H2O2 red./min/mg protein) than K64R (1.82 µmol H2O2 red./min/mg protein) but under high temperature stress, it increased in both the genotypes, though the increment was more pronounced in DTPYC9F119. It was increased from 3.18 to 7.72 µmol H2O2 red./min/mg protein and percent change of first four days was found more than last two days. In K64R, first two days after heat-stress, the increase in CAT activity was very less (6.22%), but, then it increased from 1.93 to 3.30 µmol H2O2 red./min/mg protein during last 4 days of treatment. In the control condition, there was no significant increase of the CAT activity in both the genotypes. Initially, the POX activity of DTPYC9F119 genotype was 21.19 µmol tetraguaicol formed/min/mg protein and in K64R, it was 21.57. Exposure to 6 days heat-stress at flowering stage caused a significant increase in the POX activity of both the genotypes. But, the percent increase was more in DTPYC9F119 (28.79%) than K64R (13.85%).
Table 5.
Effect of heat-stress on specific activities of superoxide dismutase (units/min/mg protein), catalase (µmol H2O2 red./min/mg protein) and peroxidase (µmol tetraguaicol formed/min/mg protein) in two contrasting maize genotypes
| Days after treatment | DTPYC9F119 | K64R | ||
|---|---|---|---|---|
| Control | Heat-stress | Control | Heat-stress | |
| Super oxide dimutase | ||||
| 0 | 2.83 | 2.84 | 2.74 | 2.74 |
| 2 | 2.39 | 3.54 | 2.78 | 2.97 |
| 4 | 2.68 | 4.39 | 2.86 | 3.44 |
| 6 | 2.93 | 4.77 | 2.93 | 3.78 |
| LSD 0.05 G = 0.07; T = 0.07; D = 0.11; T × D = 0.15; T × G = 0.11; D × G = 0.15; T × D × G = 0.21 | ||||
| Catalase | ||||
| 0 | 3.18 | 3.18 | 1.83 | 1.82 |
| 2 | 3.86 | 4.55 | 1.96 | 1.93 |
| 4 | 4.27 | 6.53 | 2.03 | 2.78 |
| 6 | 4.90 | 7.72 | 2.33 | 3.30 |
| LSD 0.05 G = 0.10; T = 0.10; D = 0.14; T × D = 0.20; T × G = 0.14; D × G = 0.20; T × D × G = 0.28 | ||||
| Peroxidase | ||||
| 0 | 21.19 | 21.19 | 21.57 | 21.57 |
| 2 | 21.20 | 22.55 | 21.79 | 22.10 |
| 4 | 21.80 | 27.86 | 21.82 | 23.71 |
| 6 | 22.53 | 30.30 | 21.90 | 24.56 |
| LSD 0.05 G = 0.36; T = 0.36; D = 0.51; T × D = 0.72; T × G = 0.51; D × G = 0.72; T × D × G = NS | ||||
G genotype, T temperature treatment, D days after treatment
Sod2 gene expression
As discerned from the semi-quantitative Reverse Transcriptase PCR (RT-PCR), the Sod2 gene expression was increased under high temperature stress (Fig. 1) in both the genotypes. The degree of increase of Sod2 gene expression under heat-stress between the two contrasting genotypes was different and the increase was more prominent in DTPYC9F119. The duration of the treatment had significant influence in modulating the Sod2 gene expression in both the genotypes. At the beginning of the treatment, Sod2 expression was comparatively less but gradually it increased. Further, the rate of increase was more in case of DTPYC9F119. At 2 days after treatment, Sod2 expression was slightly reduced in DTPYC9F119 but then it increased rapidly. On the other hand, in case of K64R, Sod2 expression increased relatively slowly.
Fig. 1.
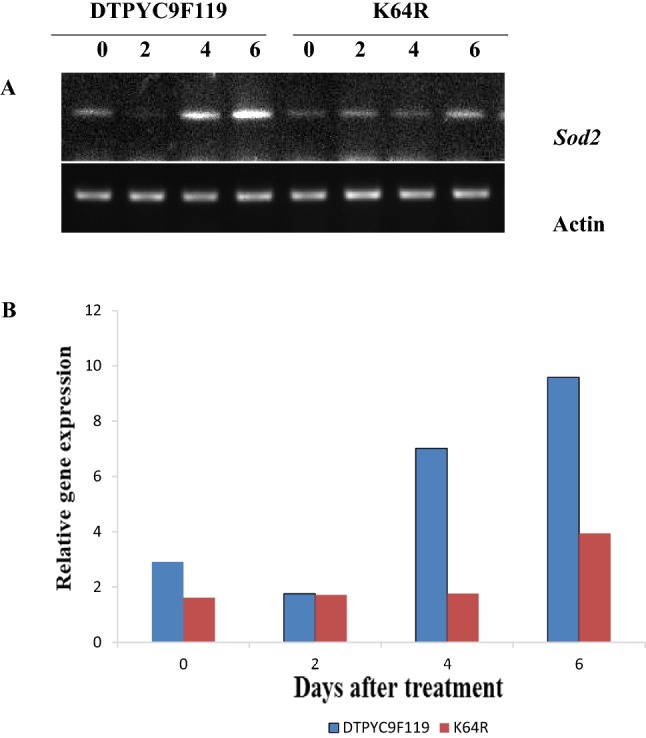
a Semi-quantitative RT-PCR of Sod2 from heat-stressed maize tissue of two contrasting genotypes (DTPYC9F119 and K64R) at 0, 2, 4, and 6 days after high temperature treatment. β actin was used as loading control. b Relative gene expression of Sod2. The intensity of the RT-PCR bands was measured using gene tool Syngene software and normalized with respect to actin control
Cat1 gene expression
Figure 2 indicates that high temperature stress had significant influence on Cat1 expression level in the two genotypes. Initially, the relative level of gene expression was 7.53 and 8.54 and after 6 days of high temperature treatment, it reached to 15.16 and 10.34 for DTPYC9F119 and K64R maize genotypes respectively. Percent increase in Cat1 gene expression was calculated as 98.27% for DTPYC9F119, but it was relatively very low for K64R (26.98%).
Fig. 2.

a Semi-quantitative RT-PCR of Cat1 from heat-stressed maize tissue of two contrasting genotypes (DTPYC9F119 and K64R) at 0, 2, 4, and 6 days after high temperature treatment. β actin was used as loading control. b Relative gene expression of Cat1. The intensity of the RT-PCR bands was measured using gene tool Syn gene software and normalized with respect to actin control
Apx1 gene expression
As discerned by the intensities of the bands (Fig. 3), significant increase in Apx1 gene expression was observed under high temperature condition. Before exposure to high temperature treatment, the relative Apx1 expression was 2.95 for DTPYC9F119 and 1.42 for K64R but it was increased to the level of 9.43 and 5.53 for DTPYC9F119 and K64R genotypes respectively after the heat-stress treatment.
Fig. 3.
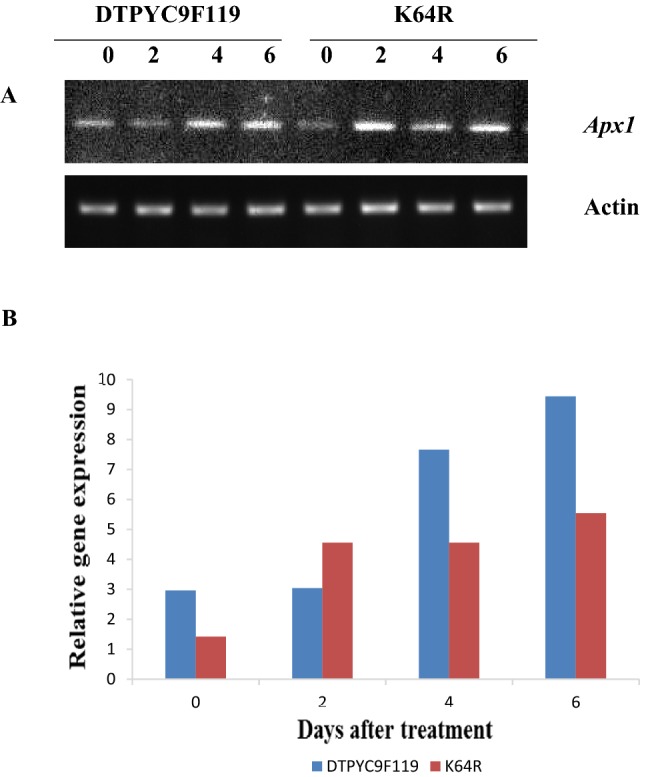
a Semi-quantitative RT-PCR of Apx1 from heat-stressed maize tissue of two contrasting genotypes (DTPYC9F119 and K64R) at 0, 2, 4, and 6 days after high temperature treatment. β actin was used as loading control. b Relative gene expression of Apx1.The intensity of the RT-PCR bands was measured using gene tool Syngene software and normalized with respect to actin control
Discussion
Chlorophyll a/b ratio is an important parameter to determine final grain yield of cereals (Coskun et al. 2011) as cholorophyll is central to the process of photosynthesis. Significant increase in chlorophyll a/b ratio was observed under heat-stress and the DTPYC9F119 genotype showed greater increase than K64R. But chlorophyll a and b, both were reduced under elevated temperature in both the genotypes. Similar finding was observed by Dhyani et al. (2013) and Cui et al. (2006). Due to increase in unsaturated fatty acid or protein denaturation in high temperature, in general, kinetic energy of molecules across membranes increases which leads to the loosening of membrane (Savchenko et al. 2002). Significant membrane stability reduction was also observed in our experiment and this reduction was more in K64R than DTPYC9F119. The observation of decrease in total soluble protein content in heat-stress is in agreement with Dutta et al. (2009). The plastid proteins are encoded by nuclear genome and translated in cytoplasm. For efficient photosynthesis, the plastid proteins needs to be imported into the chloroplast from the cytoplasm. The down-regulation of photosynthesis in the heat-stressed plants may be due to reduced post-translational import of plastid proteins required for the replacement of impaired proteins encoded by the nuclear genome.
The heat-stress imposed at reproductive stage had an adverse effect on photosynthetic efficiency of both the genotypes, however the effect was more pronounced in the susceptible genotype K64R. Under heat-stress, there was a steady increase in the stomatal conductance and steady reduction in photosynthesis rate in DTPYC9F119, while a sharp increase in stomatal conductance and sharp decrease in photosynthesis rate was observed in K64R, indicating less adaptability of K64R to high temperature compared to DTPYC9F119. High temperature mediated reduction in rate of photosynthesis in plants was also observed by Srinivasan et al. (1996). Steven et al. (2002) showed that photosynthetic apparatus in maize is highly sensitive to heat-stress. Severe photosynthesis efficiency reduction and transpiration rate increase were observed after heat-stress in our experiment. The main reason of transpiration increase was extreme rise in stomatal conductance and it was more pronounced in K64R genotype. The stomatal conductance increased sharply under heat-stress conditions in K64R, indicating its less adaptability to high temperature, which was also reflected in decreased level of water use efficiency. Genotype DTPYC9F119 had a significantly higher photosynthetic rate than K64R under normal condition. High temperature mediated reduction in rate of photosynthesis in plants was also observed by Srinivasan et al. (1996).
One of the reason why environmental stress adversely affect the growth and photosynthetic activities of plants is the breakdown of balance between the production of reactive oxygen species (ROS) and anti-oxidant defense. These ROS causes oxidative damage to membrane, lipids, proteins and nucleic acid. Under heat-stress, the extent of ROS production exceeds the anti-oxidant defense capabilities of the cells, resulting in cellular damage (Almeselmani et al. 2009). In addition to this, high temperature stress alters the biochemical and physiological process in the plants and leads to accumulation of solutes (osmolytes) for protecting them under stress environment (Sairam and Tyagi 2004). ROS production constitutes major plant responses under heat-stress (Wahid et al. 2007). The level of various ROS can be reduced at tolerable level by antioxidant enzymes activity like SOD, catalase, peroxidase. In our study, activities of all the three enzymes and their relative gene expression were largely induced under elevated temperature, but most of the times, the rate of increase was found higher in case of DTPYC9F119 than K64R. The same finding was observed by Ara et al. (2013). Sod2 gene actually encodes for a Mn SOD which is present in mitochondria and modulates stress tolerance response of the plant. SOD reduces super-oxide content in plant cell under severe stress condition. Under heat-stress condition, super-oxide radicals are highly produced and can cause severe damage to the plant cell. Some changes cannot be reversed by the plant and which ultimately reduce the growth and development of the plants under stress condition. Photosynthetic efficiency is also highly susceptible to oxidative stress produced by heat-stress. So, to cope with this problem, plants have evolved defense system and among them anti-oxidant gene expression and enzymes activity is most important. Increase in anti-oxidant gene expression shows that there may be some transcription factors which actually increased under high temperature and ultimately lead to up-regulation of gene expression
Conclusion
Contrasting genotypes offer a tractable resource for characterization of general mechanism of heat stress adaption in maize. Comparing two such genotypes- DTPYC9F119 (tolerant) and K64R (susceptible) reveal that accumulation of chlorophyll and soluble proteins, greater membrane stability, modulation of anti-oxidant gene expression, lower transpiration rate, and lower increase of internal CO2 concentration are some of the adaptive mechanisms promoting heat-stress tolerance in maize.
Acknowledgements
The authors are thankful to the Director, ICAR-IIMR for providing necessary facilities to carry out this work under in-house project “Physiological and molecular basis of heat tolerance in maize”. The research was supported in part by funds from the Indian Council of Agricultural Research funded “Network Project on Transgenics in Crops” (NPTC-3015).
Authors’ contribution
IS conceived and planned the experiments, which were primarily carried out by SD and AG. PY provided critical inputs for antioxidant genes expression studies. SD analyzed the data and wrote the initial draft of manuscript, which was critically edited and substantially improved by IS and PY. All the authors read, commented and approved the final manuscript.
Compliance with ethical standards
Conflict of interest
The authors declare that there is no conflict of interest regarding the publication of this article.
Footnotes
Publisher's Note
Springer Nature remains neutral with regard to jurisdictional claims in published maps and institutional affiliations.
Ishwar Singh and Suprokash Debnath have contributed equally to this work.
References
- Aebi H. Catalase in vitro. Methods Enzymol. 1984;105:121–126. doi: 10.1016/S0076-6879(84)05016-3. [DOI] [PubMed] [Google Scholar]
- Almeselmani M, Deshmukh P, Sairam R. High temperature stress tolerance in wheat genotypes: role of antioxidant defence enzymes. Acta Agron Hung. 2009;57(1):1–14. doi: 10.1556/AAgr.57.2009.1.1. [DOI] [Google Scholar]
- Anonymous (2009) Climate change threatens water, food security of 1.6 billion south Asians. Asian Development Bank Report. https://www.adb.org/news/adb-climate-change-threatens-water-food-security-16-billion-south-asians. Accessed 9 July 2019
- Ara N, Nakkanong K, Lv W, Yang J, Hu Z, Zhang M. Antioxidant enzymatic activities and gene expression associated with heat tolerance in the stems and roots of two cucurbit species (“Cucurbita maxima” and “Cucurbitamoschata”) and their interspecific inbred line “Maxchata”. Int J Mol Sci. 2013;14(12):24008–24028. doi: 10.3390/ijms141224008. [DOI] [PMC free article] [PubMed] [Google Scholar]
- Barnabás B, Jäger K, Fehér A. The effect of drought and heat-stress on reproductive processes in cereals. Plant, Cell Environ. 2008;31(1):11–38. doi: 10.1111/j.1365-3040.2007.01727.x. [DOI] [PubMed] [Google Scholar]
- Bradford MM. A rapid and sensitive method for the quantitation of microgram quantities of protein utilizing the principle of protein-dye binding. Ann Biochem. 1976;72:248–254. doi: 10.1016/0003-2697(76)90527-3. [DOI] [PubMed] [Google Scholar]
- Cairns JE, Hellin J, Sonder K, Araus JL, MacRobert JF, Thierfelder C, Prasanna BM. Adapting maize production to climate change in sub-Saharan Africa. Food Secur. 2013;5(3):345–360. doi: 10.1007/s12571-013-0256-x. [DOI] [Google Scholar]
- Castillo FJ, Penel C, Greppin H. Peroxidase release induced by ozone in Sedum balbum leaves involvement of Ca2+ Plant Physiol. 1984;74(4):846–851. doi: 10.1104/pp.74.4.846. [DOI] [PMC free article] [PubMed] [Google Scholar]
- Coskun Y, Coskun A, Demirel U, Ozden M. Physiological response of maize (Zea mays L.) to high temperature stress. Aust J Crop Sci. 2011;5(8):966. [Google Scholar]
- Crafts-Brandner SJ, Salvucci ME. Sensitivity of photosynthesis in a C4 plant, maize, to heat-stress. Plant Physiol. 2002;129(4):1773–1780. doi: 10.1104/pp.002170. [DOI] [PMC free article] [PubMed] [Google Scholar]
- Cui L, Li J, Fan Y, Xu S, Zhang Z. High temperature effects on photosynthesis, PSII functionality and antioxidant activity of two Festuca arundinacea cultivars with different heat susceptibility. Bot Stud. 2006;47:61–69. [Google Scholar]
- Debnath S, Gazal A, Yadava P, Singh I. Identification of contrasting genotypes under heat stress in maize (Zea mays L) Maize J. 2016;5(1 & 2):14–24. [Google Scholar]
- Dhindsa RS, Dhindsa PP, Thorpe TA. Leaf senescence correlated with increased levels of membrane permeability and lipid peroxidation, and decreased levels of superoxide dismutase and catalase. J Exp Bot. 1981;32(1):93–101. doi: 10.1093/jxb/32.1.93. [DOI] [Google Scholar]
- Dhyani K, Ansari W, Rao Y, Verma S, Shukla A, Tuteja N. Comparative physiological response of wheat genotypes under terminal heat stress. Plant Signal Behav. 2013;8(6):1–6. doi: 10.4161/psb.24564. [DOI] [PMC free article] [PubMed] [Google Scholar]
- Dutta S, Mohanty S, Tripathy BC. Role of temperature stress on chloroplast biogenesis and protein import in pea. Plant Physiol. 2009;150(2):1050–1061. doi: 10.1104/pp.109.137265. [DOI] [PMC free article] [PubMed] [Google Scholar]
- Hasanuzzaman M, Nahar K, Alam MM, Roychowdhury R, Fujita M. Physiological, biochemical, and molecular mechanisms of heat-stress tolerance in plants. Int J Mol Sci. 2013;14(5):9643–9684. doi: 10.3390/ijms14059643. [DOI] [PMC free article] [PubMed] [Google Scholar]
- Hiscox JT, Israelstam GF. A method for the extraction of chlorophyll from leaf tissue without maceration. Can J Bot. 1979;57(12):1332–1334. doi: 10.1139/b79-163. [DOI] [Google Scholar]
- Kumar K, Singh I, Aggarwal C, Tiwari I, Jha AK, Yadava P, Rakshit S. Expression profiling of heat shock protein genes in two contrasting maize inbred lines. Int J Curr Microbiol Appl Sci. 2019;8(6):347–358. doi: 10.20546/ijcmas.2019.806.039. [DOI] [Google Scholar]
- Lobell DB, Schlenker W, Costa-Roberts J. Climate trends and global crop production since 1980. Science. 2011;333(6042):616–620. doi: 10.1126/science.1204531. [DOI] [PubMed] [Google Scholar]
- Premachandra GS, Saneoka H, Ogata S. Cell membrane stability, an indicator of drought tolerance, as affected by applied nitrogen in soyabean. J Agric Sci. 1990;115(1):63–66. doi: 10.1017/S0021859600073925. [DOI] [Google Scholar]
- Sairam RK, Tyagi A. Physiology and molecular biology of salinity stress tolerance in plants. Curr Sci. 2004;86(3):407–421. [Google Scholar]
- Savchenko GE, Klyuchareva EA, Abramchik LM, Serdyuchenko EV. Effect of periodic heat shock on the inner membrane system of etioplasts. Russ J Plant Physiol. 2002;49(3):349–359. doi: 10.1023/A:1015592902659. [DOI] [Google Scholar]
- Singh I, Chikkappa GK, Atkare AP, Shukla PK, Avni, Yadava P. Identification of heat-stress tolerant recombinant inbred lines in maize (Zea mays L.) Maize J. 2017;6:9–21. [Google Scholar]
- Singh M, Chakraborti D, Dass S, Singh DK, Singh N, Singh I. Effect of high temperature and low moisture stress on morpho-physiological and biochemical characters and yield of maize hybrids. Ann Plant Soil Res. 2017;19(1):71–74. [Google Scholar]
- Sinsawat V, Leipner J, Stamp P, Fracheboud Y. Effect of heat-stress on the photosynthetic apparatus in maize (Zea mays L.) grown at control or high temperature. Environ Exp Bot. 2004;52(2):123–129. doi: 10.1016/j.envexpbot.2004.01.010. [DOI] [Google Scholar]
- Srinivasan A, Takeda H, Senboku T. Heat tolerance in food legumes as evaluated by cell membrane thermostability and chlorophyll fluorescence techniques. Euphytica. 1996;88(1):35–45. doi: 10.1007/BF00029263. [DOI] [Google Scholar]
- Steven J, Brandner C, Salvucci M. Sensitivity of photosynthesis in C4 maize plant to heat-stress. Plant Physiol. 2002;129:1773–1780. doi: 10.1104/pp.002170. [DOI] [PMC free article] [PubMed] [Google Scholar]
- Wahid A, Gelani S, Ashraf M, Foolad MR. Heat tolerance in plants: an overview. Environ Exp Bot. 2007;61(3):199–223. doi: 10.1016/j.envexpbot.2007.05.011. [DOI] [Google Scholar]
- Yadava P, Kaur P, Singh I. Exogenous application of ascorbic acid alleviates oxidative stress in maize. Ind J Plant Physiol. 2013;18(4):339–343. doi: 10.1007/s40502-014-0057-z. [DOI] [Google Scholar]
- Yadava P, Kaushal J, Gautam A, Parmar H, Singh I. Physiological and biochemical effects of 24-Epibrassinolide on heat-stress adaptation in maize (Zea mays L.) Nat Sci. 2016;8:171–179. [Google Scholar]
- Yadava P, Thirunavukkarasu N, Kaur P, Shiriga K, Singh I. Salicylic acid alleviates methyl viologen induced oxidative stress through transcriptional modulation of antioxidant genes in Zea mays L. Maydica. 2016;60(3):1–9. [Google Scholar]