MEDICAL SCIENCES Correction for “Regulation of PRMT5–MDM4 axis is critical in the response to CDK4/6 inhibitors in melanoma,” by Shatha AbuHammad, Carleen Cullinane, Claire Martin, Zoe Bacolas, Teresa Ward, Huiqin Chen, Alison Slater, Kerry Ardley, Laura Kirby, Keefe T. Chan, Natalie Brajanovski, Lorey K. Smith, Aparna D. Rao, Emily J. Lelliott, Margarete Kleinschmidt, Ismael A. Vergara, Anthony T. Papenfuss, Peter Lau, Prerana Ghosh, Sue Haupt, Ygal Haupt, Elaine Sanij, Gretchen Poortinga, Richard B. Pearson, Hendrik Falk, David J. Curtis, Paul Stupple, Mark Devlin, Ian Street, Michael A. Davies, Grant A. McArthur, and Karen E. Sheppard, which was first published August 22, 2019; 10.1073/pnas.1901323116 (Proc. Natl. Acad. Sci. U.S.A. 116, 17990–18000).
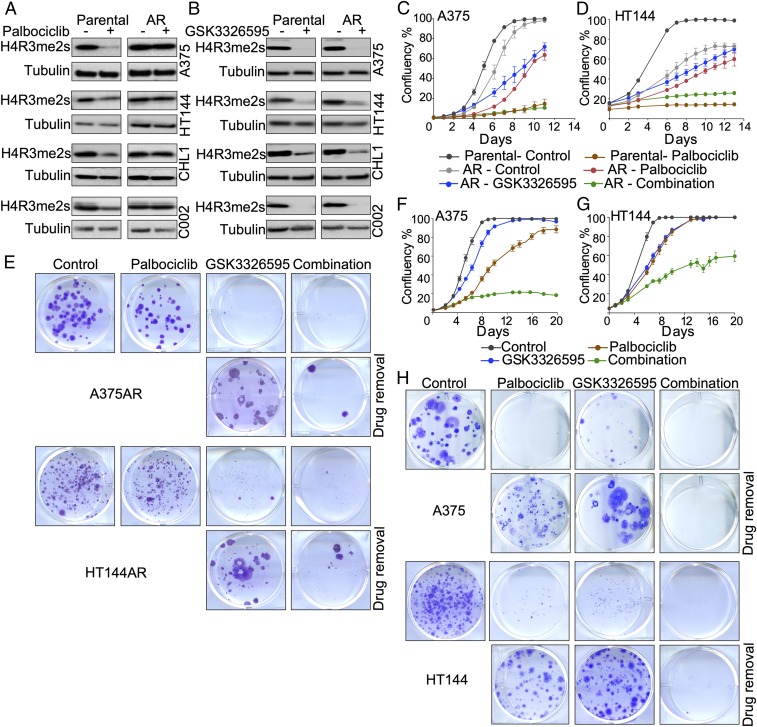
The authors note that Fig. 2H appeared incorrectly due to an accidental transposition and duplication of images. The corrected Fig. 2 and its legend appear below. The corrected version was derived from data collected at the same time as the original experiments. This error does not affect the conclusions of the article.
Fig. 2.
Inhibition of PRMT5 sensitizes melanoma cells to palbociclib. (A) Western blot on melanoma cell lysates after 6-d treatment with 2 μM palbociclib. (B) Western blot on melanoma cell lysates after 6-d treatment with 500 nM GSK3326595 for all cells except HT144, which were treated with 250 nM. (C and D) Proliferation curves of the parental and acquired resistance (AR) cells treated with 2 μM palbociclib, 250 nM (HT144), or 500 nM (A375) GSK3326595, or combination of both drugs. Graphs are representative of three independent experiments. Error bars represent SEM for 3 technical replicates. (E) Images of colony-forming assays of A375AR and HT1441AR cells treated as in C and D for 14 d, and after drug removal for 14 d. Representative of 2 biological replicates with 3 technical replicates each. (F and G) Proliferation curves of the parental A375 and HT144 cells treated with 1 μM (A375) or 250 nM (HT144) palbociclib, 500 nM (A375) or 250 nM (HT144) GSK3326595, or combination of both drugs. Graphs are representative of two independent experiments. Error bars represent SEM for 3 technical replicates. (H) Images of colony-forming assays of A375 treated as in F and G, and after drug removal for 14 d. Representative of 2 biological replicates with 3 technical replicates each.


