

Abstract
CLC chloride/proton exchangers may support acidification of endolysosomes and raise their luminal Cl− concentration. Disruption of endosomal ClC‐3 causes severe neurodegeneration. To assess the importance of ClC‐3 Cl−/H+ exchange, we now generate Clcn3 unc/unc mice in which ClC‐3 is converted into a Cl− channel. Unlike Clcn3 −/− mice, Clcn3 unc/unc mice appear normal owing to compensation by ClC‐4 with which ClC‐3 forms heteromers. ClC‐4 protein levels are strongly reduced in Clcn3 −/−, but not in Clcn3 unc/unc mice because ClC‐3unc binds and stabilizes ClC‐4 like wild‐type ClC‐3. Although mice lacking ClC‐4 appear healthy, its absence in Clcn3 unc/unc/Clcn4 −/− mice entails even stronger neurodegeneration than observed in Clcn3 −/− mice. A fraction of ClC‐3 is found on synaptic vesicles, but miniature postsynaptic currents and synaptic vesicle acidification are not affected in Clcn3 unc/unc or Clcn3 −/− mice before neurodegeneration sets in. Both, Cl−/H+‐exchange activity and the stabilizing effect on ClC‐4, are central to the biological function of ClC‐3.
Keywords: anion transport, anion–proton exchanger, intracellular trafficking, retina, VGLUT1
Subject Categories: Membrane & Intracellular Transport, Neuroscience
ClC‐3 antiporter activity and heterodimerization with ClC‐4 are critical for endolysosomal acidification and central nervous system integrity.

Introduction
Ion homeostasis of intracellular organelles like endosomes, lysosomes, and synaptic vesicles (SVs) is important for luminal enzyme activity, ligand–receptor interactions, transmembrane voltage, transport of neurotransmitters, and other substrates across their limiting membranes, as well as vesicle budding, fusion, and trafficking. To date, most studies concentrated on luminal pH that drops along the endosomal/lysosomal pathway. This acidification is driven by the proton pump activity of V‐type ATPases that need a neutralizing counter current. This current is believed to be carried mainly by chloride ions, although acidification of lysosomes prominently depends on cation channels (Steinberg et al, 2010; Weinert et al, 2010). The Cl−‐dependent shunt was previously thought to be mediated by CLC Cl− channels (Günther et al, 1998; Piwon et al, 2000; Kornak et al, 2001), but the vesicular ClC‐3 to ClC‐7 proteins, in contrast to the plasma membrane Cl− channels (ClC‐1, ClC‐2, and ClC‐K), are rather 2Cl−/H+‐exchangers (Picollo & Pusch, 2005; Scheel et al, 2005; Neagoe et al, 2010; Weinert et al, 2010; Leisle et al, 2011; Rohrbough et al, 2018). Both, CLC channels and exchangers function as dimers with two independent ion permeation pathways that are entirely contained within each CLC monomer (Ludewig et al, 1996; Middleton et al, 1996; Weinreich & Jentsch, 2001; Dutzler et al, 2002; Zdebik et al, 2008; Jentsch & Pusch, 2018).
The physiological importance of vesicular CLCs is highlighted by mouse models and patients carrying CLCN mutations. Their pathologies range from impaired renal endocytosis and kidney stones (ClC‐5) (Lloyd et al, 1996; Piwon et al, 2000; Wang et al, 2000) to severe neurodegeneration (ClC‐3) (Stobrawa et al, 2001), intellectual disability and epilepsy (ClC‐4) (Veeramah et al, 2013; Hu et al, 2016; Palmer et al, 2018), to lysosomal storage disease (ClC‐6) (Poët et al, 2006) or osteopetrosis associated with lysosomal storage and neurodegeneration (ClC‐7) (Kornak et al, 2001; Kasper et al, 2005). A gain‐of‐function mutation in CLCN7 causes lysosomal storage disease and hypopigmentation without osteopetrosis (Nicoli et al, 2019).
Not only Cl− channels, but also electrogenic 2Cl−/H+‐exchangers are able to shunt proton pump currents. Indeed, the 2Cl−/H+‐exchanger ClC‐5 may support the acidification of renal endosomes (Günther et al, 2003; Hara‐Chikuma et al, 2005a; Novarino et al, 2010) and ClC‐7 is required to acidify the resorption lacuna of osteoclast (Kornak et al, 2001). However, more recent experiments demonstrate that the exchange activity, rather than the provision of an electrical shunt, is crucial for most biological roles of ClC‐5 and ClC‐7 (Novarino et al, 2010; Weinert et al, 2010). Clcn5 unc and Clcn7 unc/unc knock‐in mice which carry uncoupling point mutations in the “gating glutamate”, a pore residue critically involved in 2Cl−/H+‐exchange (Accardi & Miller, 2004), revealed that the conversion of 2Cl−/H+‐exchange into a pure Cl− conductance causes similar pathologies as the disruption of Clcn5 and Clcn7, respectively (Novarino et al, 2010; Weinert et al, 2010). Comparable uncoupling mutations in CLCN5 were subsequently identified in patients with Dent's disease (Sekine et al, 2014; Bignon et al, 2018). These observations suggest an important role for proton‐driven endosomal–lysosomal Cl− accumulation. Indeed, lysosomal Cl− concentration, but not luminal pH, was reduced in both Clcn7 −/− and Clcn7 unc/unc mice (Weinert et al, 2010).
The transport properties of ClC‐3 had been highly controversial (for review, see (Jentsch, 2008; Jentsch & Pusch, 2018)), but it is now established that ClC‐3 is a vesicular 2Cl−/H+‐exchanger (Matsuda et al, 2008; Guzman et al, 2013; Jentsch & Pusch, 2018; Rohrbough et al, 2018) like the close homologs ClC‐4 and ClC‐5 (Picollo & Pusch, 2005; Scheel et al, 2005) and the other vesicular CLCs. In addition to its presence on endosomes, ClC‐3 may also be found on SVs (Stobrawa et al, 2001; Salazar et al, 2004; Seong et al, 2005; Grønborg et al, 2010) and synaptic‐like microvesicles (SLMVs) of neuroendocrine cells (Salazar et al, 2004; Maritzen et al, 2008). However, more recent work questioned a significant presence of ClC‐3 on SVs (Schenck et al, 2009). Furthermore, these authors suggested that the reduced acidification of SVs from Clcn3 −/− mice (Stobrawa et al, 2001) rather results from a secondary decrease in the vesicular glutamate transporter VGLUT1 which may also conduct chloride (Schenck et al, 2009).
We now asked whether the biological role of ClC‐3 depends on its Cl−/H+ exchange activity or on its electrical conductance and whether ClC‐3 is important for SV function. In stark contrast to the severe neurodegeneration of Clcn3 −/− mice (Stobrawa et al, 2001; Dickerson et al, 2002; Yoshikawa et al, 2002), newly generated Clcn3 unc/unc mice carrying an uncoupling mutation in ClC‐3 lacked detectable phenotypes. This could be explained by a compensation by ClC‐4 with which ClC‐3 forms heteromers in vivo. Disruption of ClC‐3 leads to increased ER retention and degradation of ClC‐4, suggesting that a reduction of ClC‐4 levels contributes to the severe neurodegeneration of Clcn3 −/− mice. We also demonstrated that ClC‐3 is expressed on a fraction of SVs and that miniature postsynaptic currents and SV acidification were not affected in young Clcn3 −/− mice before the onset of neurodegeneration. Proton‐driven Cl− transport by ClC‐3, if not compensated by ClC‐4, is crucial for the integrity of the CNS. ClC‐3 overwhelmingly localizes to endosomes and apparently has no significant role in SVs.
Results
Clcn3 unc/unc mice do not display neurodegeneration
To elucidate whether the electrical conductance or the Cl−/H+‐exchange activity of ClC‐3 is crucial for its biological role, we generated Clcn3 unc/unc knock‐in mice carrying the E224A mutation in the “gating glutamate” (Appendix Fig S1A–D). When studied in a ClC‐3 construct that partially localizes to the plasma membrane (Zhao et al, 2007) (Fig EV1A), this mutation linearized the normally strongly outwardly rectifying ClC‐3 currents (Fig EV1B and C). As previously observed with the bacterial ecClC exchanger (Accardi & Miller, 2004) and mammalian ClC‐4 through ClC‐7 (Picollo & Pusch, 2005; Scheel et al, 2005; Neagoe et al, 2010; Leisle et al, 2011), this mutation also uncouples Cl− currents from H+ countertransport (Rohrbough et al, 2018). “Uncoupled” CLC exchangers mediate channel‐like Cl− conductances without appreciable transport of H+. Clcn3 unc/unc mice were viable and expressed the mutant ClC‐3unc protein at wild‐type (WT) levels (Appendix Fig S1E). These mice were born at Mendelian ratios, were fertile, and had no obvious phenotype. Even at 20 months of age, they neither displayed the severe degeneration of the CNS nor of the retina (Fig 1A and B) that is observed in Clcn3 −/− mice (Stobrawa et al, 2001; Dickerson et al, 2002; Yoshikawa et al, 2002). This contrasts with findings for Clcn5 unc and Clcn7 unc/unc mice (Novarino et al, 2010; Weinert et al, 2010) which phenotypically largely resemble the respective null mice (Piwon et al, 2000; Kornak et al, 2001). These observations raised the possibility that another vesicular CLC protein might compensate for the loss of ClC‐3 2Cl−/H+‐exchange in Clcn3 unc/unc, but not in Clcn3 −/− mice.
Figure EV1. Currents of partially plasma membrane directed “WT” ClC‐3 and its E224A mutant.
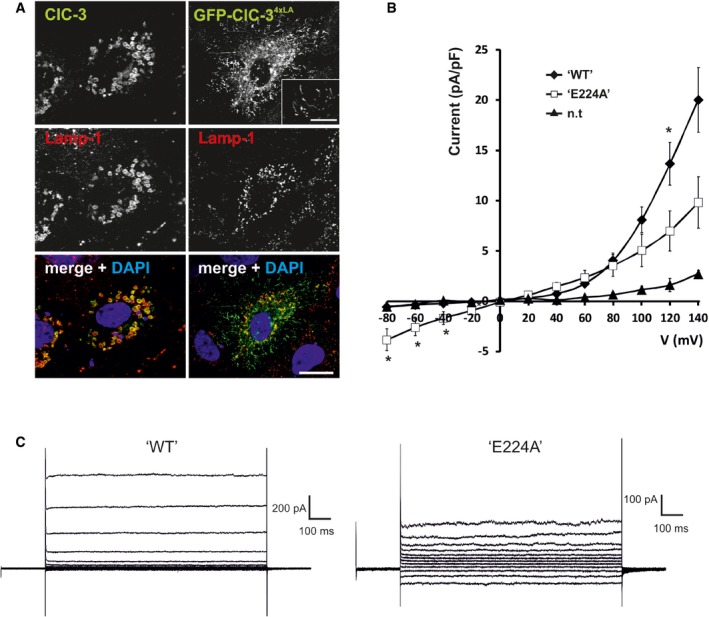
- When transfected into HeLa cells, wild‐type ClC‐3 (green) localized to enlarged Lamp‐1‐positive (red) late endosomes/lysosomes, GFP‐ClC‐34xLA (green) co‐localizes with Lamp‐1 (red) in normal sized vesicular structures, but is also partially redirected to the plasma membrane. DNA stained with DAPI [scale bar at bottom: 20 μm (for all panels); scale bar in inset: 5 μm].
- Current–voltage relationships of HeLa cells, either non‐transfected controls or transiently transfected with GFP‐ClC‐34xLA (“WT”) and GFP‐ClC‐34xLA E224A (“E224A”). Cells were examined 48–72 h post‐transfection by whole‐cell patch‐clamp using 1‐s voltage pulses and 20‐mV increments from −80 to +140 mV. n.t., not transfected. Mean values ± SEM “WT”, n = 8; “E224A”, n = 4; n.t., n = 4, *P < 0.05, MW test. Currents of surface‐directed GFP‐ClC‐34xLA were strongly outwardly rectifying and similar to ClC‐3 currents reported by others (Li et al, 2002; Picollo & Pusch, 2005; Matsuda et al, 2008; Guzman et al, 2013) and as described for a ClC‐5/ClC‐3 chimera (Rohrbough et al, 2018). They resembled currents of ClC‐4 and ClC‐5 (Steinmeyer et al, 1995; Friedrich et al, 1999) but were only barely above background. Mutating the “gating glutamate” E224 to alanine abolished rectification, as reported for ClC‐3 (Li et al, 2002; Matsuda et al, 2008; Rohrbough et al, 2018), ClC‐4, and ClC‐5 (Friedrich et al, 1999) and ClC‐7 (Leisle et al, 2011). These low expression levels precluded measurements of H+‐transport, but recent studies using ClC‐5/3 chimeras convincingly demonstrate that ClC‐3 is a Cl−/H+‐antiporter which can be uncoupled by the E224A (“unc”) mutation (Rohrbough et al, 2018).
- Example traces of GFP‐ClC‐34xLA (“WT”) and GFP‐ClC‐34xLA E224A (“E224A”).
Figure 1. Hippocampal morphology and expression of intracellular CLC proteins of Clcn3 mouse models.

- Nissl‐stained sagittal brain sections reveal no change in hippocampal morphology between Clcn3 unc/unc and Clcn3 +/+ mice at P45 or after 20 months. In contrast, the hippocampus was absent (indicated by asterisk) in 3‐month‐old Clcn3 −/− mice (scale bar: 200 μm).
- Nissl‐stained paraffin sections show intact retinal layers in 20‐month‐old Clcn3 unc/unc mice. Neurodegeneration in Clcn3 −/− mice, however, results in a loss of retinal structure already at 11 weeks of age (scale bar: 100 μm). GCL, ganglion cell layer; INL, inner nuclear layer; IPL, inner plexiform layer; IS, photoreceptor inner segments; ONL, outer nuclear layer; OPL, outer plexiform layer; OS, photoreceptor outer segments; RPE, retinal pigment epithelium.
- Immunoblots for ClC‐3, ClC‐4, and CIC‐5 of membrane fractions of WT (+/+), Clcn3 unc/unc (unc/unc), Clcn3 unc/+ (unc/+), and Clcn3 −/− (−/−) mice. β‐Actin, loading control.
- Representative Western blot for ClC‐4 of membrane fractions from brain and kidney of WT (+/+), Clcn3 +/− (+/−), and Clcn3 −/− (−/−) mice. β‐Actin, loading control.
- Quantification of ClC‐4 immunoblots including those shown in (C, D) (normalized to actin). Mean values ± SEM. Average from ≥ 5 animals per genotype and at ≥ 2 immunoblots per animal. ***P < 0.0005, **P < 0.005, *P < 0.05 (two‐tailed unpaired t‐test).
Source data are available online for this figure.
ClC‐4 levels are reduced in Clcn3 −/−, but not in Clcn3 unc/unc mice
We therefore examined the expression levels of ClC‐4 and ClC‐5, the closest homologs of ClC‐3 (~ 76% identity), in tissues of Clcn3 unc/unc and Clcn3 −/− mice. Although ClC‐4 mRNA levels are not changed in the brain of Clcn3 −/− mice (Stobrawa et al, 2001), ClC‐4 protein levels were strongly and more moderately decreased in brain and kidney of Clcn3 −/− mice, respectively (Fig 1C–E). Depending on the tissue and experimental conditions, the ClC‐4 band often appeared as doublet in Clcn3 −/− mice (Fig EV2B). Western blot quantifications of the upper band, which likely reflects the mature glycosylated form of ClC‐4 (see below), revealed that it was reduced down to 30 and 60% in brain and kidney of Clcn3 −/− mice, respectively (Fig 1E). In heterozygous Clcn3 +/− mice, ClC‐4 protein amounts were reduced down to ~ 65% in brain and ~ 80% in kidney (Fig 1C and D). Expression of ClC‐5, which is found in kidney but is almost absent from brain, appeared unchanged upon Clcn3 disruption (Fig 1C). ClC‐4 protein levels were markedly reduced in all other Clcn3 −/− tissues examined, including liver, pancreas, adrenal gland, spleen, lung, skeletal muscle, and heart (Fig EV2B). Treatment with PNGase F, which removes all N‐linked glycans, showed that differences in size of ClC‐4 were due to differential glycosylation (Fig EV2C). In contrast to the larger ClC‐4 species, the lower band, which was much more prominent in most Clcn3 −/− tissues, was sensitive to digestion with Endo H that cleaves oligosaccharides of core‐glycosylated ER‐resident membrane proteins (Fig EV2D). This indicated that in Clcn3 −/− mice, a sizeable portion of ClC‐4 does not leave the ER, where it is subject to degradation. Importantly, no reduction of ClC‐4 protein levels was observed in brain or kidney of Clcn3 unc/unc mice (Figs 1C and EV2A) which express an “uncoupled”, but otherwise intact ClC‐3 protein. Importantly, whereas ClC‐4 levels depended on ClC‐3, ClC‐3 levels were unchanged in both brain and kidney of Clcn4 −/− mice (Fig EV2A).
Figure EV2. Effect of ClC‐3 on ClC‐4 levels and glycosylation in various tissues.

- Western blots for ClC‐3, ClC‐4, and ClC‐5 of membrane fractions isolated from brain and kidney from mice of the indicated genotypes. Whereas ClC‐4 protein levels depend on ClC‐3, ClC‐3 levels do not depend on ClC‐4. β‐Actin served as a loading control.
- Immunoblots for ClC‐3 and ClC‐4 of membrane fractions isolated from indicated organs of WT and Clcn3 −/− mice (indicated by +/+ and −/−). β‐Actin, loading control. The different sizes of ClC‐4‐positive bands most likely result from differences in glycosylation between tissues. Disruption of ClC‐3 leads to the appearance, or increase in intensity, of the lowest band that represents the immature protein. The ratio between ClC‐3 and ClC‐4 proteins apparently differs between tissues.
- Effect of PNGase F on ClC‐4 in brain and liver membrane fractions of WT (+/+) and Clcn3 −/− (−/−) mice. Removal of N‐linked glycans by PNGase F reveals that apparent size differences of ClC‐4 between WT and Clcn3 −/− tissues are owed to less glycosylation of ClC‐4 in the absence of ClC‐3.
- Treatment of brain and liver membranes with EndoH reveals that a large portion of ClC‐4 in Clcn3 −/− tissue has not left the ER. The arrows are pointing to the fractions of ClC‐4 protein that are sensitive to endoglycosidase H treatment, i.e., has not been modified in the Golgi.
ClC‐3 and ClC‐3unc heteromerize with ClC‐4
CLC proteins function as dimers (Ludewig et al, 1996; Middleton et al, 1996; Dutzler et al, 2002). With the exception of ClC‐6 and ClC‐7, heterodimers have been observed upon heterologous co‐expression of members of the same homology branch (Lorenz et al, 1996; Weinreich & Jentsch, 2001; Mohammad‐Panah et al, 2003; Suzuki et al, 2006; Guzman et al, 2017). We therefore suspected that ClC‐3 stabilizes ClC‐4 by forming heterodimers in vivo. Indeed, ClC‐3 antibodies co‐immunoprecipitated ClC‐4 from both WT and Clcn3 unc/unc brain and vice versa (Fig 2A). These results were corroborated by Förster resonance energy transfer (FRET) measurements with fluorescently tagged ClC‐3 and ClC‐4 in transfected COS‐7 cells (Fig 2B). Agreeing with previous results obtained with overexpressing HEK cells (Okkenhaug et al, 2006; Guzman et al, 2017), ClC‐4 showed typical ER‐like reticular staining when expressed in COS‐7 cells (Fig 2C). In contrast, ClC‐3 localized to vesicular structures, which were partially positive for the late endosomal/lysosomal marker Lamp‐1 (Fig 2C). When both CLCs were co‐transfected, ClC‐4 co‐localized with ClC‐3 in vesicles (Fig 2D) (Guzman et al, 2017). A similar change in ClC‐4 localization was observed upon co‐expression with the ClC‐3unc mutant (Fig 2D), as expected from our observation that the mutant ClC‐3 protein retains its physical interaction with ClC‐4 (Fig 2A). Hence, both WT ClC‐3 and ClC‐3unc associate with ClC‐4 and thereby promote the transport of ClC‐4 from the ER to endosomal–lysosomal compartments and protects it from degradation.
Figure 2. Formation of ClC‐3/ClC‐4 heteromers.

- Co‐immunoprecipitation reveals a ClC‐3–ClC‐4 complex. Ten percent of solubilized brain membranes of WT and Clcn3 unc/unc mice were directly loaded on the gel (input, or first immunoprecipitated (IP) with antibodies against ClC‐3 or ClC‐4). Western blots were probed for ClC‐3 and ClC‐4. Equivalent amounts of lysates and precipitates were loaded. * unspecific band/contamination.
- FRET experiments show homo‐ and heteromerization of ClC‐3 and ClC‐4 constructs [fused to yellow fluorescent protein (YFP) and cyan fluorescent protein (CFP)] overexpressed in COS‐7 cells. Co‐expressed constructs are indicated. Graph represents energy transfer efficiencies from acceptor photobleaching, depicted as bleach corrected values (subtraction of ClC‐4CFP alone). Mean values ± SEM. N = 20 (ClC‐3YFP/ClC‐4CFP); 33 (ClC‐3YFP/ClC‐3CFP); 26 (ClC‐4YFP/ClC‐4CFP); 42 (ClC‐3YFP/Lamp‐1CFP) cells. ***P < 0.0005 (two‐tailed unpaired t‐test).
- Immunolabeling shows subcellular localization of hClC‐4 (top, green in merge), hClC‐3 (middle, green in merge), and hClC‐3unc (bottom, green in merge) of transiently transfected COS‐7 cells, in comparison with either PDI or Lamp‐1 (both red) as marker for the ER and late endosomes/lysosomes, respectively.
- Co‐localization of hClC‐3 and hClC‐4 in cytoplasmic vesicles of COS‐7 cells transfected with hClC‐4 cDNA [hemagglutinin (HA) tagged] together with either hClC‐3 or hClC‐3unc. Immunostaining used antibodies against ClC‐3 and HA tag (green and red in merge, respectively).
Severe neurodegeneration in Clcn3 unc/unc/Clcn4 −/− mice
The above experiments suggested that ClC‐4 may compensate for a loss of ClC‐3 function in Clcn3 unc/unc, but not in Clcn3 −/− mice in which brain ClC‐4 levels are decreased to ~ 30% of WT (Fig 1E). To completely eliminate this potential compensation, we crossed Clcn3 unc/unc mice with Clcn4 −/− mice. Although Clcn4 −/− mice appear to be normal (Rickheit et al, 2010), we reassessed potential effects of Clcn4 disruption because mutations in CLCN4 were recently associated with X‐linked intellectual disability and epileptic encephalopathy (Veeramah et al, 2013; Hu et al, 2016; Palmer et al, 2018). However, Clcn4 −/− mice neither displayed discernible anatomical changes in the brain (Appendix Fig S2), nor obvious behavioral abnormalities.
Clcn3 unc/unc/Clcn4 −/− mice were born at Mendelian ratio. Similar to Clcn3 −/− mice (Stobrawa et al, 2001; Dickerson et al, 2002; Yoshikawa et al, 2002), they were growth‐retarded. Most died within 5 weeks after birth and only ~ 20% became older than 10 weeks (Fig 3A). Brains from Clcn3 unc/unc/Clcn4 −/− mice displayed severe neurodegeneration (Fig 3B). Like in Clcn3 −/− mice (Stobrawa et al, 2001), degeneration became first apparent in the hippocampus, but progressed much faster. Whereas the hippocampus began to show mild degeneration at P21 and almost totally disappeared at 10 weeks of age in Clcn3 −/− mice (Stobrawa et al, 2001), Clcn3 unc/unc/Clcn4 −/− mice showed severe hippocampal degeneration at P21 and mice had lost their hippocampi already 4 weeks after birth (Fig 3B). Again similar to Clcn3 −/− mice, neurodegeneration in Clcn3 unc/unc/Clcn4 −/− mice was accompanied by an activation of astrocytes as indicated by GFAP staining. Clcn3 unc/unc/Clcn4 −/− mice showed severe retinal degeneration (Fig 3C), similar to Clcn3 −/− mice (Stobrawa et al, 2001).
Figure 3. Life span and neurodegeneration of Clcn3/Clcn4 mouse models.

- Clcn3 unc/unc/Clcn4 −/− and Clcn3 −/− mice died within 3–4 weeks after birth. Approximately 20% of the animals survived in either line (Clcn3 unc/unc/Clcn4 −/−, n = 136, and Clcn3 −/−, n = 187). All Clcn3 −/−/Clcn4 −/− mice (n = 4) died within 1–2 weeks after birth.
- Nissl‐stained paraffin sections show progressive neuronal cell loss (arrows) that begins in hippocampal CA1 region of P14 Clcn3 unc/unc/Clcn4 −/− mice and results in a complete loss of the hippocampus at P28. Neurodegeneration progresses slower in Clcn3 −/− mice (Stobrawa et al, 2001) (scale bar: 200 μm).
- Semi‐thin sections of P28 retinae revealed degeneration of photoreceptor cells in the outer nuclear layer and outer and inner segment of Clcn3 unc/unc/Clcn4 −/−, but not of Clcn3 unc/unc or Clcn4 −/− mice (scale bar: 50 μm). GCL, ganglion cell layer; INL, inner nuclear layer; IPL, inner plexiform layer; IS, photoreceptor inner segments; ONL, outer nuclear layer; OPL, outer plexiform layer; OS, photoreceptor outer segments; RPE, retinal pigment epithelium.
Source data are available online for this figure.
The more severe phenotype of Clcn3 unc/unc/Clcn4 −/− compared to Clcn3 −/− mice suggested that the severity of neurodegeneration depends on the expression levels of ClC‐4. Clcn3 unc/unc/Clcn4 +/− mice, in which ClC‐4 protein levels are reduced to 75% of normal, did not show neurodegeneration even at 12 weeks of age (Appendix Fig S3A). Likewise, on a Clcn4 −/− background, heterozygous Clcn3 unc alleles did not cause pathologies (Appendix Fig S3B). In contrast, only very few Clcn3 −/−/Clcn4 −/− mice were born and then died shortly after birth (Fig 3A). Hence, ClC‐3 and ClC‐4 have partially overlapping functions. The occurrence of neurodegeneration in Clcn3 −/−, but not Clcn4 −/− mice might be largely explained by the fact that ClC‐4 levels are strongly decreased in Clcn3 −/− mice, whereas ClC‐3 abundance does not depend on ClC‐4. As revealed only in the absence of ClC‐4, the pure Cl− conductance of ClC‐3unc cannot functionally replace the 2Cl−/H+‐exchange of WT ClC‐3. However, this conductance may substitute for some aspect of ClC‐3 function as revealed by the milder phenotype of Clcn3 unc/unc/Clcn4 −/− compared to Clcn3 −/−/Clcn4 −/− mice. However, we cannot exclude that the more severe phenotype of the double knock‐out is in part owed to the lack of the ClC‐3 protein that might bind to unknown interaction partners.
Subcellular localization of ClC‐3 and ClC‐4 in brain
Because available ClC‐3 antibodies are of limited use for immunohistochemistry (IHC) of native tissue, we generated knock‐in mice in which we epitope‐tagged ClC‐3 (Appendix Fig S4A and B). We opted for a Venus tag (ven), a fast‐maturing and brightly fluorescent variant of the green fluorescent protein (GFP) (Nagai et al, 2002), which we fused to the N‐terminus of ClC‐3. Homozygous Clcn3 ven/ven mice were born at Mendelian ratio, had a normal life expectancy and did not show neurodegeneration even at 10 weeks of age (Appendix Fig S4C). Clcn3 ven/ven/Clcn4 −/− mice did not display hippocampal degeneration either (Appendix Fig S4C), suggesting that the VenusClC‐3 fusion protein functions normally. VenusClC‐3 protein levels were undistinguishable from ClC‐3 levels in WT mice (Appendix Fig S4D). Since low fluorescence intensities precluded direct imaging of VenusClC‐3 fluorescence in tissue sections, we used anti‐GFP antibodies in IHC. In brain, VenusClC‐3 was most prominently expressed in the hilus and stratum lucidum of the hippocampus and in the cerebellum (Appendix Fig S5A and B). IHC for ClC‐4 revealed a similar distribution (Appendix Fig S5C). The absence of signals for VenusClC‐3 and ClC‐4 in tissue from WT and Clcn4 −/− mice, respectively, validated the specificity of our labeling (Appendix Figs S5B and C, and Fig 4A).
Figure 4. Subcellular localization of VenusClC‐3 and ClC‐4 in neurons.

-
AGFP antibodies immunolabel VenusClC‐3 (green) in the somata of CA1 pyramidal neurons of Clcn3 ven/ven, but not Clcn3 +/+ brain sections. sp, stratum pyramidale (scale bar: 20 μm).
-
BCo‐immunolabeling of VenusClC‐3 (green) with ClC‐4 (red) in the CA3 region of Clcn3 ven/ven mice (scale bar: 20 μm). sl, stratum lucidum; sp, stratum pyramidale.
-
CCo‐immunostaining of VenusClC‐3 (green) with EEA1 (red, left panel), Lamp‐1 (red, middle panel), or synaptophysin (red, right panel) in either CA1 or CA3 region of Clcn3 ven/ven mice. Arrows indicate structures of overlap (scale bar: 5 μm).
-
DGFP antibody immunolabels VenusClC‐3 (green) in neurites of cultured neurons. EEA1 and VGLUT1 are co‐stained (both in red; left and right panel, respectively). The dendritic marker MAP2 is stained in blue (right panel; scale bars: 10 μm). DNA stained with DAPI.
-
EImmunoblot analysis of fractions collected during preparation of SVs from brain of Clcn3 ven/ven mice. VenusClC‐3 (detected with GFP antibody) co‐purified with SV marker protein synaptophysin.
-
FFluorescence of immobilized Venus‐tagged SVs imaged with TIRF microscopy. Scale bar, 2 μm.
-
G, HCo‐localization between the Venus‐tagged vesicles with antibodies against VGLUT1 and synaptophysin was analyzed. (G) 11.4 ± 0.6 (SD) of VGLUT1‐labeled SVs and 8.2 ± 2 (SD) of synaptophysin‐labeled SVs showed Venus fluorescence (n = 6). (H) 65 ± 5.4 (SD) and 79.4 ± 3.8 (SD) of Venus‐tagged SVs showed co‐localization with VGLUT1 and synaptophysin, respectively (n = 6).
-
ICo‐immunolabeling of VenusClC‐3 (green) with synaptophysin (red) of immobilized SVs imaged with TIRF microscopy. Vesicle in quadrant delimited by dashed line is shown in higher magnification in merge. Scale bar, 2 μm.
Source data are available online for this figure.
Compatible with the formation of ClC‐3/4 heteromers in vivo, VenusClC‐3 and ClC‐4 co‐localized in punctate pattern in cell bodies and neurites of hippocampal pyramidal neurons (Fig 4B). Both in brain sections and in cultured hippocampal neurons of Clcn3ven/ven mice, ClC‐3 localized to compartments that were positive for the endosomal marker EEA1 or for Lamp‐1, a marker of late endosomes and lysosomes (Fig 4C and D). Roughly 30, 20, and 10% of VenusClC‐3‐positive structures in somata of cultured hippocampal neurons were co‐labeled for transferrin receptor (TfR), EEA1, and Lamp‐1, respectively (Appendix Fig S6). We also found VenusClC‐3 in astrocytes and oligodendrocytes (Fig EV3A) where it co‐localized with rab4, EEA1, and TfR, but not significantly with Lamp‐1 (Fig EV3B). Neither VGLUT1 nor synaptophysin, both markers for SVs, showed significant co‐localization with ClC‐3 (Fig 4C and D).
Figure EV3. Expression and subcellular localization of VenusClC‐3 in cultured glial cells.

- Primary cultured glial cells were labeled for VenusClC‐3 (green) and GFAP or APC (red, left and right panel, respectively), markers for astrocytes and oligodendrocytes, respectively (scale bar: 10 μm for main panels; scale bar in insets: 5 μm).
- Primary cultured astrocytes were labeled for VenusClC‐3 (green) and rab4 (i, red), EEA1 (ii, red), TfR (iii, red), and Lamp‐1 (iv, red) (scale bars: 20 μm in i, iii, and iv; 10 μm in ii). The inlays depict magnified views of boxed sections. DNA stained with DAPI.
However, ClC‐3 was described to also localize to SVs (Stobrawa et al, 2001; Salazar et al, 2004; Seong et al, 2005; Grønborg et al, 2010) and SLMVs (Salazar et al, 2004; Maritzen et al, 2008) and to affect synaptic physiology (Wang et al, 2006; Riazanski et al, 2011; Guzman et al, 2014). Based on comparisons of ClC‐3 with VGLUT1 levels in quantitative Western blots, however, Schenck et al (2009) reported that ClC‐3 was present on only every 2,000th SV. We therefore re‐examined this important issue. Immunoblots detected ClC‐3 and ClC‐4 in the LP2 fraction of brain membranes, which is enriched for SVs as indicated by the accumulation of synaptophysin (Fig EV4A and B) and the virtual absence of postsynaptic PSD95 (Fig EV4A). Using our KO‐controlled ClC‐3 antibody (Stobrawa et al, 2001) and a VGLUT1 construct that was epitope‐tagged at the N‐terminus for antibody calibration, quantitative Western blot analysis suggested that the copy number ratio of ClC‐3/VGLUT1 in the LP2 fraction is ~ 1/250 (Fig EV4C–E). This value is much higher than the ClC‐3/VGLUT1 ratio of ~ 1/5,000 in the SV fraction reported by Schenck et al who have used a similar approach but had tagged VGLUT1 at the C‐terminus. Taking into account the typical SV content of the LP2 fraction (~ 50%) (Huttner et al, 1983) and the number of VGLUT1 on SVs (~ 10) (Takamori et al, 2006), our results yielded the rough estimate of one ClC‐3 protein on every 25th SV (Fig EV4C–E). The expression of ClC‐3 on endosomes, the presence of endosomal structures in synaptic boutons (Watanabe et al, 2014; Milosevic, 2018), and the presence of the endosomal marker rab4 and lysosomal cathepsin D in LP2 fractions (Fig EV4B) suggest that the abundance of ClC‐3 on SVs might even be lower.
Figure EV4. Characterization and quantification of ClC‐3 in LP2 fraction.

-
A, BCharacterization of SV‐enriched LP2 fraction. (A) Western blots for ClC‐3, ClC‐4, synaptophysin, and PSD95 (postsynaptic marker) of fractions obtained during synaptic vesicle‐enriched fraction (LP2) preparation using differential centrifugation as described (Huttner et al, 1983; Takamori et al, 2000). (B) Immunoblots for different cellular markers comparing whole lysate (H) and synaptic vesicle‐enriched fraction (LP2) (GM130, Golgi marker; PDI, ER marker; rab4, early endosomes and SV; cathepsin D, lysosomal marker; synaptophysin, SV marker).
-
C–EQuantification of ClC‐3 in LP2 fractions (C) Western blot of lysates from HEK cells transiently overexpressing either mVGLUT1 or hClC‐3, which were both fused at their N terminus to GFP. Probing for the GFP tag allows to directly compare the relative amount of ClC‐3 and VGLUT1 in the lysate for its use as calibration standards for anti‐ClC‐3 and anti‐VGLUT1 antibodies in Western blots of tissue standards [as in (D) and (E)]. (n = 3 independent transfections, horizontal lines and error bars represent mean values SEM). The standard contains about 4.33 × more ClC‐3 molecules than the standard for VGLUT1. (D) Example immunoblot for VGLUT1 in which the GFP‐VGLUT1 standard [same lysate as in (A)] is compared to different amounts of LP2 fraction. Below, example plot in which WB signals are plotted against rising amounts of the LP2 fraction, quantified by protein contents. The standard for VGLUT1 roughly corresponds to 2.5 μg of LP2 fraction (averaged from n = 6 Western blots). (E) Same as shown in (D) but for ClC‐3. The standard for ClC‐3 roughly corresponds to 140 μg of the LP2 fraction (n = 7). From (A) and (B), we calculated a molecular ratio for ClC‐3/VGLUT1 ≈ 2.5/(140*4.33) = 4.12 × 10−3 = 1/243 in our LP2 fraction. Considering that ClC‐3 may form not only hetero‐ but also homodimers and that SVs are ˜ 2‐fold enriched in the SV compared to the LP2 fraction (Huttner et al, 1983) and that there are ˜ 10 copies of VGLUT1 per vesicle (Takamori et al, 2006), our data yield an upper limit of one ClC‐3‐containing transporter on roughly every 25th SV. This upper limit assumes that in LP2 fractions ClC‐3 is only present on SVs. Any contamination with other ClC‐3‐containing compartments like endosomes, as found in this work, will lower this estimate. The ˜ 20‐fold lower value for the ClC‐3/VGLUT1 ratio given by (Schenck et al, 2009) may have been caused by their calibration of the VGLUT1 antibody (Synaptic Systems) that recognizes an epitope at the C terminus of VGLUT1. It might have been shielded by the GFP, which these authors fused directly to the carboxy terminus of VGLUT1, thereby overestimating the number of VGLUT1 molecules in their preparation (S. Takamori, personal communication).
We further examined the presence of ClC‐3 on SVs by single‐vesicle imaging (Farsi et al, 2016). Venus‐tagged SVs purified from brain of Clcn3 ven/ven mice (Fig 4E) were immobilized on coated glass cover slips at low density and imaged using total‐internal reflection fluorescence (TIRF) microscopy (Fig 4F). The well‐separated vesicles allowed to correlate the expression of ClC‐3 with those of the SV marker proteins synaptophysin or VGLUT1 by immunofluorescence (IF). Roughly 10% of vesicles stained for either VGLUT1 or synaptophysin showed Venus‐ClC‐3 fluorescence (Fig 4G). This value may underestimate the proportion of SVs containing ClC‐3 since the procedures needed to detect VGLUT1 and synaptophysin by IF affected Venus fluorescence. Sixty and eighty percent of Venus‐ClC‐3 containing vesicles were labeled for VGLUT1 or synaptophysin, respectively (Fig 4H and I), suggesting that the remainder might represent GABAergic SVs or endosome‐like vesicles.
Collectively, these data show that ClC‐3 is present on a considerably larger fraction of SVs than reported by Schenck et al (2009). Although both types of experiments (Figs EV4 and 4F–H) gave quantitatively different results, they suggest that maybe 5–15% of SVs contain ClC‐3. As indicated by IHC of brain sections, however, the bulk of ClC‐3 is rather found on endosomes.
Acidification of synaptic vesicles and neuronal endosomes
ClC‐3 was reported to support the acidification of endosomes (Yoshikawa et al, 2002; Hara‐Chikuma et al, 2005b; Weylandt et al, 2007) and SVs (Stobrawa et al, 2001; Riazanski et al, 2011) by providing an electric shunt for proton pumping. However, more recent work (Schenck et al, 2009) suggested that impaired SV acidification in Clcn3 −/− mice may rather be due to the observed reduction in the levels of VGLUT1 (Stobrawa et al, 2001), which, in addition to its role as glutamate transporter, may also conduct Cl− (Schenck et al, 2009; Preobraschenski et al, 2014; Eriksen et al, 2016; Martineau et al, 2017).
Since the impairment of SV acidification in Clcn3 −/− mice may be age‐dependent (Schenck et al, 2009), expression levels of ClC‐3, ClC‐4, and key synaptic proteins in the brain of WT and Clcn3 −/− mice were examined as function of age (Fig 5A). In WT mice, ClC‐3 and ClC‐4 expression remained constant over the time span investigated (2–12 weeks), as did the changes in ClC‐4 observed in Clcn3 −/− mice (Figs 1C–E and 5A). Protein levels of the vesicular GABA transporter VGAT, the α1 subunit of the GABAA receptor, and the GluR4 subunit of the glutamate receptor did not change with age and were not affected by Clcn3 disruption. By contrast, VGLUT1 expression markedly increased between 2 and 6 weeks of age, whereas VGLUT2 levels declined over the entire time span. In line with our previous observations (Stobrawa et al, 2001), VGLUT1 levels were markedly reduced compared to WT in 6‐ and 12‐week‐old Clcn3 −/− mice (Fig 5A) which already display overt neurodegeneration (Stobrawa et al, 2001).
Figure 5. ATP‐induced acidification of synaptic vesicle‐enriched LP2 fraction derived from different Clcn3 and Clcn4 mouse models.

- Immunoblots for ClC‐3, ClC‐4, VGLUT1, VGLUT2, VGAT, GluR4, and GABAA‐R‐α1 of whole lysates from brain of Clcn3 +/+ and Clcn3 −/− mice at 2, 6, and 12 weeks of age.
- Acidification of synaptic vesicle LP2 fractions from Clcn3 unc/unc and Clcn3 +/+ mice at 1 year of age (upper panel, n = 2 animals each and ≥ 3 measurements per animal), 10‐week‐old Clcn4 −/− and WT mice (middle panel, n = 3 animals each and ≥ 3 measurements per animal), and 4‐ to 6‐week‐old Clcn3 unc/unc/Clcn4 −/− and control mice (lower panel, six animals each with ≥ 2 measurements per animal). A decrease in fluorescence reflects acidification. The protonophore FCCP dissipated the pH gradient. Mean values ± SEM.
- Quantification of ATP‐induced acidification of LP2 fractions derived from 2, 6, and 10‐ to 12‐week‐old Clcn3 −/− compared to wild‐type mice. Acidification measured by acridine orange fluorescence in the presence of 60 mM KCl. At least two animals in at least two independent experiments were pooled. Each measurement was performed at least three times. Mean ± SEM is shown.*P < 0.05, ***P < 0.0005 (two‐tailed unpaired t‐test).
- Immunoblot revealed strong reduction of VGLUT1 levels in the homogenate (H) and LP2 fraction of Clcn3 unc/unc/Clcn4 −/− mice.
- Endosomal pH of Clcn3 +/+ and Clcn3 −/− primary hippocampal neurons determined with a pH‐sensitive transferrin conjugate. N = 5 independent cell lines with at least two live cell dishes per cell line with about 10 images each and ≥ 10 Tfn‐positive compartments per image and genotype were analyzed. Mean ± SEM is shown.
Source data are available online for this figure.
ATP‐driven luminal acidification of SV‐enriched LP2 fractions was assessed by acridine orange quenching (Fig 5B). Correlating with the decrease of VGLUT1, Clcn3 disruption decreased ATP‐driven acidification of LP2 vesicles at 6 and 12, but not at 2 weeks of age (Fig 5C). LP2 fractions from either Clcn3 unc/unc or Clcn4 −/− mice, which do not show neurodegeneration, exhibited normal ATP‐driven acidification. However, acidification of vesicles obtained from Clcn3 unc/unc/Clcn4 −/− mice with fast progressing neurodegeneration and strong reduction of VGLUT1 levels (Fig 5D) was markedly reduced even at 4–6 weeks of age when compared to control littermates (Fig 5B).
We also determined luminal pH of TfR‐positive endosomal compartments in cultured neurons by ratiometric imaging. pH‐sensitive and pH‐insensitive transferrin‐coupled conjugates Tfn‐FITC and Tfn‐546, respectively, were chased into recycling endosomes after endocytosis. Immunolabeling showed that roughly 80% of TfR‐expressing compartments contained VenusClC‐3 (Appendix Fig S6). There was no significant difference in average pH between WT [5.36 ± 0.07 (SEM)] and Clcn3 −/− endosomes (pH 5.48 ± 0.11; Fig 5E), suggesting that ClC‐3 does not provide the main shunt conductance for the acidification of TfR‐positive neuronal compartments.
Effect of ClC‐3 on synaptic function and structure
The failure of Clcn3 disruption to impair SV acidification before the onset of neurodegeneration questioned a role of ClC‐3 in loading SVs with neurotransmitters. Indeed, in our previous work (Stobrawa et al, 2001), Clcn3 disruption did not affect the amplitude or frequency of miniature inhibitory postsynaptic currents (mIPSCs) which are elicited by spontaneous exocytosis of GABA‐containing SVs. We had only detected marginal effects on miniature excitatory (glutamatergic) postsynaptic currents (mEPSCs), which, however, may have been caused by incipient neurodegeneration at P13–P15, the time window of our experiments (Stobrawa et al, 2001). By contrast, Nelson and co‐workers more recently reported markedly reduced frequencies and amplitudes of mIPSCs in Clcn3 −/− mice (Riazanski et al, 2011) and Fahlke's group stated that Clcn3 disruption increased frequencies and amplitudes of mEPSCs in primary neuronal cultures (Guzman et al, 2014). We re‐investigated mIPSCs and mEPSCs in CA1 hippocampal pyramidal neurons at P14–16, now including also Clcn3 unc and Clcn4 − alleles (Fig 6A–G). Again no differences in mIPSCs between Clcn3 −/− and Clcn3 +/+ mice were found (Fig 6A and B). We neither observed differences in mIPSCs between Clcn3 unc/unc and Clcn3 +/+ mice (Fig 6C), nor between Clcn4 +/+ and Clcn4 −/− mice (Fig 6D). Compared to Clcn4 −/− mice, the mIPSC interevent intervals, but not amplitudes, appeared longer in Clcn3 unc/unc/Clcn4 −/− mice (Fig 6E). However, these mice have the most severe neurodegeneration among the investigated genotypes. In these mice, there also appeared to be a marginal increase in mEPSC frequency, but not amplitudes, when compared to Clcn4 mice (Fig 6F and G). Guzman et al (2014) reported that the area of SVs was increased by ~ 30% in Clcn3 −/− versus WT mice. However, we did not observe significant changes either in the number nor the size of SVs and endosome‐like vacuoles of glutamatergic spine synapses in Clcn3 −/− compared to WT brain sections (Fig EV5).
Figure 6. Impact of Clcn3 and Clcn4 genotypes on synaptic vesicle exocytosis.

-
A–EMiniature inhibitory postsynaptic currents (mIPSCs) measured in CA1 pyramidal neurons in different mouse models at P14–P16. (A) Example mIPSCs of WT (left) and Clcn3 −/− neurons. (B–E) Mean values ± SEM and cumulative histogram of amplitude (top) and frequency/interevent–interval (bottom) of mIPSCs in different mouse models as indicated. Several cells of three mice of each genotype were analyzed. Compared genotypes were siblings. No difference in amplitude or frequency/interevent–interval distribution of mIPSCs was found in (B) Clcn3 −/− and Clcn3 +/+ (Clcn3 +/+: 16 cells, Clcn3 −/−: 15 cells; mean amplitude: P > 0.8, t‐test; mean frequency: P > 0.4, MW test), in (C) Clcn3 unc/unc and Clcn3 +/+ (Clcn3 +/+: 21 cells, Clcn3 unc/unc: 13 cells; mean amplitude: P > 0.7; mean frequency: P = 0.3, t‐test), and in (D) Clcn4 −/− and Clcn3 +/+ (Clcn3 +/+: 18 cells, Clcn4 −/−: 18 cells; mean amplitude: P > 0.3, t‐test; mean frequency: P = 0.6, MW test). (E) No difference in mean amplitude (P > 0.5, t‐test), in cumulative amplitude and mean frequency of mIPSCs (P > 0.1, t‐test) was found in Clcn3 unc/unc/Clcn4 −/− and Clcn3 +/+/Clcn4 −/−. The interevent–interval distribution was shifted to the right, indicating a reduced frequency of mIPSCs in Clcn3 unc/unc/Clcn4 −/− (KS test, P < 0.05; Clcn3 +/+/Clcn4 −/−: 16 cells, Clcn3 unc/unc/Clcn4 −/−: 12 cells).
-
F, GMiniature excitatory postsynaptic currents (mEPSCs). (F) Example traces of mEPSCs in WT and Clcn3 −/− neurons. (G) No significant difference between Clcn3 unc/unc/Clcn4 −/− and Clcn3 +/+/Clcn4 −/− mEPSCs in mean amplitudes (P > 0.9, t‐test) or in the distribution of amplitudes (Clcn4 −/−: 12 cells, 2 mice; Clcn3 unc/unc/Clcn4 −/−: eight cells, two mice).
-
HPrimary hippocampal neurons co‐transfected with ClC‐3 and synaptobrevin (syb2), both luminally tagged with pHluorin or the pH‐sensitive mOrange (Ramirez et al, 2012), respectively, were stimulated by 200 action potentials (APs) at 20 Hz (indicated by bar). Vesicle exocytosis was monitored by fluorescence increase upon exposure to extracellular neutral pH. Note that only Syb2 and not ClC‐3 shows signs of exocytosis. Traces were corrected for photobleaching. The initial decay of the pHluorin signal is probably due to the high light exposure, which forces the fluorophores into a transient dark state (Dean et al, 2011). Averaged fluorescence traces (n = 10), error bars, SEM.
Source data are available online for this figure.
Figure EV5. Clcn3 −/− mice display normal synaptic ultrastructure.

- Quantification of SVs and endosome‐like vacuoles (ELVs) of glutamatergic spine synapses from layer 4–5 of secondary visual cortex of P14, P21, and P70 days‐old Clcn3 +/+ and Clcn3 −/− animals. Mean ± SEM is shown. Five animals per genotype, 20–25 boutons/animal.
- Example electron micrographs illustrating normal morphology of the pre‐ and postsynapse of Clcn3 +/+ and Clcn3 −/− mice (scale bar: 250 nm).
- Histogram indicating the distribution of synaptic vesicles sizes of Clcn3 +/+ and Clcn3 −/− mice. Five animals per genotype, around 150 vesicles/animal.
- Cumulative plot represents the SV size distribution in Clcn3 +/+ and Clcn3 −/− mice. Five animals per genotype, around 150 vesicles/animal.
- Mean area of all vesicles is unchanged between Clcn3 +/+ and Clcn3 −/− mice. Mean ± SEM is shown. Five animals per genotype, around 150 vesicles/animal.
We further investigated whether ClC‐3 is exocytosed together with SV markers upon electrical stimulation of primary hippocampal neurons. These neurons were transfected with a construct in which the genetically encoded pH‐sensitive indicator pHluorin (Miesenböck et al, 1998) was fused to a luminal loop of ClC‐3 (ClC‐3‐pHluorin). The fluorescence of the fusion protein is expected to increase upon exocytosis from an acidic SV because it then faces the more alkaline extracellular medium. Subsequent endocytosis and vesicular acidification again reduce fluorescence. pH‐sensitive synaptobrevin 2‐mOrange reported SV exocytosis. In contrast, co‐transfected ClC‐3‐pHluorin fluorescence did not increase in response to action potential firing (Fig 6H), suggesting that exocytosis‐competent SVs express only low amounts of ClC‐3.
Discussion
The biological importance of particular ion transport processes is most impressively demonstrated by phenotypes resulting from their genetic manipulation in animal models, as reported here for ClC‐3 and ClC‐4. Our work demonstrates that the exchange of Cl− for H+, rather than the provision of a conductance, is crucial for the biological role of ClC‐3. This role became only apparent in the absence of ClC‐4 because the exchange activity of ClC‐4 (Picollo & Pusch, 2005; Scheel et al, 2005) compensated for the loss of ClC‐3 Cl−/H+‐exchange in Clcn3 unc/unc mice in which ClC‐3 mediates a Cl− conductance. In vivo, the stability of ClC‐4 depends on ClC‐3 with which it forms heterodimers. The bulk of ClC‐3 resides on endosomes and to a minor degree also on SVs. However, we could not confirm reports suggesting an important role of ClC‐3 in synaptic physiology (Riazanski et al, 2011; Guzman et al, 2014).
Heteromeric CLCs
CLC Cl− channels and transporters (Jentsch, 2008; Jentsch & Pusch, 2018) function as dimers with one permeation pathway per CLC monomer (Ludewig et al, 1996; Middleton et al, 1996; Weinreich & Jentsch, 2001; Dutzler et al, 2002). In addition to homodimers, some CLC proteins can form heterodimers (Lorenz et al, 1996; Mohammad‐Panah et al, 2003; Suzuki et al, 2006; Guzman et al, 2017) which may display novel properties (Lorenz et al, 1996). It has remained unclear whether CLC heterodimers exist in vivo and whether they are biologically important. We found that in vivo a substantial portion of ClC‐4 is found in physical association with ClC‐3. Whereas ClC‐3 reaches endosomes without ClC‐4, the presence of ClC‐4 in endosomes largely depends on ClC‐3. In the absence of the ClC‐3 binding partner, a large fraction of ClC‐4 remains in the ER where it is probably degraded. As indicated by the even more severe pathology of Clcn3 −/−/Clcn4 −/− compared to Clcn3 −/− mice, the reduced ClC‐4 levels in Clcn3 −/− mice likely contribute to their neurodegeneration (Stobrawa et al, 2001; Yoshikawa et al, 2002). The reason for the ER retention of ClC‐4 remains unclear. Several membrane proteins display arginine‐based retention motifs that are shielded by interaction partners to facilitate ER exit (Zerangue et al, 1999; Michelsen et al, 2005). However, no functional arginine‐based or other linear signal sequence could be identified in the N‐terminus of ClC‐4 that reportedly localizes it to the ER (Okkenhaug et al, 2006).
Although both ClC‐3 and ClC‐4 are widely expressed across tissues, their relative expression levels vary (Fig EV2B). Expression databases (https://gtexportal.org/) suggest that both isoforms are expressed to roughly similar levels in brain and muscle, but that the ClC‐3/ClC‐4 mRNA ratio is markedly higher in most other tissues. Cells probably co‐express heteromeric and homomeric ClC‐3 and ClC‐4 exchangers since ClC‐3 does not require ClC‐4 for ER exit, and because a fraction of ClC‐4 can leave the ER without ClC‐3. This is indicated by the mature ClC‐4 band in Western blots of Clcn3 −/− tissue and by robust plasma membrane currents upon ClC‐4 overexpression (Friedrich et al, 1999; Picollo & Pusch, 2005; Scheel et al, 2005).
Transport properties of ClC‐3 and ClC‐3/‐4 heteromers
Due to difficulties in obtaining sizeable plasma membrane currents with ClC‐3, various endogenous and mutually exclusive currents were assigned to ClC‐3 (Kawasaki et al, 1994, 1995; Duan et al, 1997; Huang et al, 2001). However, analysis of splice variants and mutants with increased surface expression have firmly established that ClC‐3 generates strongly outwardly rectifying currents (Li et al, 2000; Picollo & Pusch, 2005; Matsuda et al, 2008; Guzman et al, 2013, 2015; Okada et al, 2014; Rohrbough et al, 2018) resembling those of the closely related ClC‐4 and ClC‐5 exchangers (Steinmeyer et al, 1995; Friedrich et al, 1999). Neutralizing the “gating glutamate” linearizes the current/voltage relationship of ClC‐3 (Fig EV1B) (Matsuda et al, 2008; Okada et al, 2014; Rohrbough et al, 2018) and abolishes the coupling of Cl− flux to H+‐countertransport like in other vesicular CLCs (Friedrich et al, 1999; Picollo & Pusch, 2005; Scheel et al, 2005; Neagoe et al, 2010; Leisle et al, 2011), as convincingly shown for a chimera in which the ClC‐3 N‐terminus was replaced by ClC‐5 (Rohrbough et al, 2018). The hypothesis that ClC‐3 facilitates acidification of endosomes by increasing the capacitance of their membrane (Guzman et al, 2013) is not viable when luminal buffering of H+ is taken into account (Jentsch & Pusch, 2018).
We do not know whether the ion transport properties of ClC‐3/ClC‐4 heteromers differ in detail from a superposition of those from the respective homodimers. Currents elicited by co‐expressing ClC‐3 and ClC‐4 are overwhelmingly mediated by ClC‐4 because ClC‐3 current amplitudes are very low. The Cl−/H+‐exchange of ClC‐4 is almost certainly maintained in a heterodimer with the uncoupled ClC‐3unc protein because ion translocation pathways of CLC proteins are entirely enclosed in each individual subunit (Ludewig et al, 1996; Weinreich & Jentsch, 2001; Dutzler et al, 2002). Protonation of the side chain of the “gating glutamate”, which protrudes into the permeation pathway, is thought to underlie gating of CLC channels and Cl−/H+‐exchange of CLC exchangers like ClC‐3 (Dutzler et al, 2002, 2003; Accardi & Miller, 2004). Hence not only ion selectivity and single channel conductance (Ludewig et al, 1996; Weinreich & Jentsch, 2001), but also other pore properties such as Cl−/H+‐coupling are independent from the other subunit of the dimer, as demonstrated with concatemers linking WT and uncoupled ClC‐5 subunits (Zdebik et al, 2008). The changed properties of ClC‐1/ClC‐2 (Lorenz et al, 1996) and ClC‐0/ClC‐1 (Weinreich & Jentsch, 2001) Cl− channels or ClC‐7/ClC‐7mutant chloride/proton exchangers (Ludwig et al, 2013) are caused by altered common gating that acts on both subunits (Ludwig et al, 2013). Since ClC‐3 and ClC‐4 currents display similar activation kinetics, no effect of heteromerization is expected.
ClC‐3 localizes predominantly to endosomes rather than SVs
Although initially thought to be a plasma membrane Cl− channel (Kawasaki et al, 1994, 1995; Duan et al, 1997; Huang et al, 2001), it is now established that ClC‐3 is a Cl−/H+‐exchanger that resides almost exclusively on intracellular membranes. Upon overexpression in COS‐7 cells, only ~ 6% of the protein was found at the plasma membrane where it was rapidly endocytosed and targeted to endosomes (Zhao et al, 2007). We expect native plasma membrane expression to be even much lower. In any case, ClC‐3 is unlikely to be active at the plasma membrane because its currents are only observed at non‐physiological cytoplasm‐positive voltages.
Most groups now concur that ClC‐3 is expressed on endosomes, but almost all studies relied on heterologous overexpression (e.g., Li et al, 2002; Hara‐Chikuma et al, 2005b; Suzuki et al, 2006; Weylandt et al, 2007; Zhao et al, 2007). Anti‐ClC‐3 antibodies were often used without KO controls and can show significant cross‐reactivity (Jentsch et al, 2010). Our own anti‐ClC‐3 antibody has been validated by using Clcn3 −/− tissue, but gives only faint signals in IHC. To unambiguously localize ClC‐3 in native tissues, we newly generated knock‐in mice expressing a Venus‐ClC‐3 fusion protein. Clcn3 ven/ven mice revealed that native ClC‐3 is found on intracellular punctate structures, which mainly represent early, recycling and partially late endosomes.
Several groups, including our own (Stobrawa et al, 2001; Maritzen et al, 2008), have suggested the presence of ClC‐3 on SVs (Salazar et al, 2004; Seong et al, 2005; Grønborg et al, 2010; Riazanski et al, 2011; Guzman et al, 2014) or synaptic‐like microvesicles of neuroendocrine cells (Salazar et al, 2004; Maritzen et al, 2008). However, it was later reported that only every 2,000th SV may contain a ClC‐3 molecule (Schenck et al, 2009). One proteomic study found ClC‐3 on SVs (Grønborg et al, 2010), whereas three others did not (Takamori et al, 2006; Boyken et al, 2013; Biesemann et al, 2014), and reports concerning effects of ClC‐3 disruption on SV function are contradictory (Stobrawa et al, 2001; Schenck et al, 2009; Riazanski et al, 2011; Guzman et al, 2014).
We therefore used multiple approaches to re‐investigate a potential role of ClC‐3 in SVs. Calibrated Western blots from SV‐enriched LP2 fractions suggested the presence of one ClC‐3 protein per ~ 25 SVs (4%) in mouse brain, considerably higher than 1 ClC‐3 per 2,000 SVs as reported by Schenck et al (2009). These authors have overestimated VGLUT1 levels due to an inadvertent epitope shielding in their antibody calibration procedure that used C‐terminally tagged VGLUT1 (S. Takamori, personal communication). Quantitative single‐vesicle imaging of SVs from Clcn3 ven/ven mice yielded an even higher estimate (≥ 10% ClC‐3 expressing SVs), whereas electrically stimulated exocytosis of SVs from ClC‐3‐phluorin transfected neurons failed to provide evidence for a significant presence of ClC‐3 on SVs. Each of these techniques is fraught with potential pitfalls such as epitope shielding with epitope‐tagged proteins, or effects of epitope addition or overexpression on the trafficking of ClC‐3. With these caveats in mind, our experiments suggest that SVs do express ClC‐3, with about 4–15% of SVs being positive. ClC‐3‐positive SVs may represent a functionally distinct subpopulation of SVs, such as endosomal intermediates in SV reformation after endocytosis. However, we did not observe an impact of the loss of ClC‐3 on synaptic function before the onset of neurodegeneration and the concomitant loss of VGLUT1.
ClC‐3 was proposed to support SV acidification by shunting H+‐ATPase currents (Stobrawa et al, 2001). Indeed, acidification of SV preparations from Clcn3 −/− mice was reduced (Fig 5C) as reported before (Stobrawa et al, 2001; Riazanski et al, 2011). However, one previous study (Riazanski et al, 2011) based this conclusion in part on a so‐called “rat ClC‐3 KO model” in which ClC‐3‐containing vesicles were immuno‐depleted from SV preparations. Obviously, the ClC‐3‐depleted vesicle population is not equivalent to SVs from Clcn3 −/− mice. Our present work supports the suggestion of Takamori and colleagues (Schenck et al, 2009) that the reduced acidification of SVs from Clcn3 −/− mice (Stobrawa et al, 2001) can be attributed to a reduction of the vesicular glutamate transporter VGLUT1 which we had observed earlier (Stobrawa et al, 2001). VGLUT1 appears to operate in several modes which includes a Cl− conductance (Schenck et al, 2009; Preobraschenski et al, 2014; Martineau et al, 2017). The fact that > 65% of purified SVs are glutamatergic (Takamori et al, 2006) is compatible with this hypothesis. The impairment of SV acidification correlated with a reduction of VGLUT1 levels during neurodegeneration in both Clcn3 −/− and Clcn3 unc/unc/Clcn4 −/−mice. Although ClC‐3 and ClC‐4 are expressed from birth on, no acidification defect was observed in Clcn3 −/− mice before the onset of neurodegeneration. Since the loss of VGLUT1 roughly correlated with the degree of neurodegeneration, it might be owed to a preferential loss of mainly glutamatergic hippocampal neurons or, less likely, from a trafficking defect of VGLUT1.
The previously proposed role of ClC‐3 in SV acidification suggested that it might affect SV neurotransmitter uptake. Depending on the particular neurotransmitter transporter, this uptake is driven by ΔpH and/or the transmembrane voltage (Δψ). Glutamate uptake depends mainly on Δψ, whereas the activity of the vesicular GABA transporter VGAT depends on both parameters (Hnasko & Edwards, 2012). If ClC‐3 provides a significant SV conductance, one would expect that Clcn3 disruption increases Δψ and hence glutamate uptake. This should translate into larger miniature excitatory postsynaptic currents (mEPSCs) that are proportional to the vesicular glutamate content. Since disruption of a SV Cl− conductance would not only increase Δψ, but also decrease ΔpH, an effect on GABA loading and mIPSCs is difficult to predict. In general, mPSCs must be interpreted cautiously because degenerative changes in Clcn3 −/− neurons may begin earlier than is apparent from light microscopy and since the lack of the overwhelmingly endosomal ClC‐3 protein may affect intracellular trafficking of key proteins.
We previously measured mIPSCs and mEPSCs in CA1 pyramidal neurons of WT and Clcn3 −/− mice before the onset of neuronal cell loss (P13–P15) (Stobrawa et al, 2001). We found no differences of mIPSC amplitudes or frequencies and only a slight increase in mEPSCs that was apparent in the amplitude distribution, but not in their mean values (Stobrawa et al, 2001). In contrast, Riazanski et al (2011) more recently described significantly lower mIPSC amplitudes and a ~ 40% decrease in their frequency, and Guzman and colleagues reported a 20% increase in mean mEPSC amplitudes and an ~ 80% increase in mEPSC frequencies in hippocampal neurons cultured from WT and Clcn3 −/− mice (Guzman et al, 2014).
We re‐investigated this issue and measured mIPSCs in hippocampal slices from 13‐ to 15‐day‐old mice. mIPSC amplitudes or frequencies were neither changed in Clcn3 −/−, nor in Clcn3 unc/unc or Clcn4 −/− mice. Only Clcn3 unc/unc/Clcn4 −/− mice, which show the strongest neurodegeneration, displayed reduced mIPSC frequencies. The effects reported by Riazanski et al (2011), who studied Clcn3 −/− mice (Dickerson et al, 2002) at P18–P25, might thus be due to incipient neurodegeneration. We examined mEPSCs in Clcn3 unc/unc/Clcn4 −/− mice and again found no differences in mEPSC amplitudes. In conclusion, our data neither support a significant presence of ClC‐3 on SVs, nor a degeneration‐independent role in synaptic transmission. Our data do not support the influence of Clcn3 disruption on SV size described by Guzman et al (2014) either.
Biological roles of ClC‐3 and ClC‐4
The strong reduction of ClC‐4 in Clcn3 −/− mice likely contributes to their severe neurodegeneration although Clcn4 −/− mice lack obvious phenotypes (Rickheit et al, 2010; Hu et al, 2016). In humans, CLCN4 mutations were identified in patients with mental retardation and sometimes seizures (Veeramah et al, 2013; Hu et al, 2016; Palmer et al, 2018), but no overt neurodegeneration was reported. Primary cultures of hippocampal neurons from Clcn4 −/− mice showed borderline reductions in dendritic branching (Hu et al, 2016), but no changes in brain morphology were observed here (Appendix Fig S2).
Our work suggests that the neurodegeneration of Clcn3 −/− mice is owed to a decrease of endosomal Cl−/H+ exchange below a critical threshold which is passed because loss of ClC‐3 also entails a marked decrease of ClC‐4. When endosomal Cl−/H+ exchange is further reduced (and possibly abolished, if no other CLCs are present in the relevant compartments) as in Clcn3 unc/unc/Clcn4 −/− or Clcn3 −/−/Clcn4 −/− mice, the ensuing pathology is even more pronounced (Fig 3A and B). Comparison of Clcn3 unc/unc/Clcn4 −/− with Clcn3 −/−/Clcn4 −/− mice suggests that the uncoupled ClC‐3unc Cl− conductance might partially substitute for cellular functions of ClC‐3 Cl−/H+ exchange. Alternatively or additionally, a lack of ClC‐3 protein interactions, which will be retained with the ClC‐3unc mutant, might account for the more severe phenotype of Clcn3 −/−/Clcn4 −/− mice. Indeed, we previously found partial rescues of Clcn7 −/− phenotypes (Kornak et al, 2001; Kasper et al, 2005) both by the uncoupled conductance of ClC‐7unc in Clcn7 unc/unc mice (Weinert et al, 2010) and by the mere presence of the ClC‐7 protein in Clcn7 td/td mice that express a transport‐deficient mutant (Weinert et al, 2014).
As repeatedly shown for ClC‐5 (Günther et al, 2003; Hara‐Chikuma et al, 2005a; Novarino et al, 2010; Gorvin et al, 2013), endosomal/lysosomal CLCs may support vesicular acidification by neutralizing H+‐ATPase currents. Steady‐state pH (Yoshikawa et al, 2002) and active acidification (Hara‐Chikuma et al, 2005b) of endosomes from Clcn3 −/− hepatocytes were reported to be more alkaline and reduced, respectively. As both ClC‐3 and ClC‐4 are expressed in liver, a reduction of ClC‐4 may have contributed to this effect. A mild alkalinization (pH 6.6 vs. 6.1) was reported for transferrin‐positive compartments of Clcn3 −/− hepatocytes (Hara‐Chikuma et al, 2005b), but we found no significant change in the pH of these compartments in cultured Clcn3 −/− neurons. Acidification of intracellular compartments does not always depend on Cl−. For instance, lysosomes lacking ClC‐7 display normal steady‐state pH (Kasper et al, 2005; Weinert et al, 2010, 2014) because their acidification depends largely on cation counterflux (Steinberg et al, 2010).
Given that Cl−/H+‐exchange accumulates Cl− in acidic vesicles in a secondary active process, we expect that luminal Cl− concentrations in Clcn3 −/− and Clcn3 unc/unc/Clcn4 −/−endosomes are decreased. Lower Cl− concentrations have been measured in lysosomes of cells derived from Clcn7 −/− and Clcn7 unc/unc mice (Weinert et al, 2010, 2014) and in Caenorhabditis elegans lysosomes lacking the ClC‐7 ortholog (Chakraborty et al, 2017). Whereas lysosomes can be easily loaded with dextran‐coupled indicators, we are currently unable to specifically target Cl− sensors to endosomes. ClC‐3 may also influence the voltage across endosomal membranes. Model calculations predict more negative luminal voltages with 2Cl−/H+‐exchangers than with Cl− channels (Weinert et al, 2010), but no reliable methods to quantitatively measure endosomal voltage exist. In conclusion, disruption of ClC‐3 may affect the luminal pH and Cl− concentration and the transmembrane voltage of ClC‐3‐expressing vesicles. However, for Clcn3 unc/unc/Clcn4 −/− mice, which display more severe pathology than Clcn3 −/− mice, no change in luminal pH is expected because the ClC‐3unc Cl− conductance may support acidification as observed in ClC‐5unc mice (Novarino et al, 2010).
Our work suggests that the severe neurodegeneration observed in Clcn3 −/− mice or Clcn3 unc/unc/Clcn4 −/− mice is due to an impairment of endosomal, rather than SV function. The loss of ClC‐3, together with the concomitant substantial reduction of its heteromerization partner ClC‐4, may alter intracellular trafficking as in other neurodegenerative diseases caused by mutations in endolysosomal ion transport proteins (LaPlante et al, 2006; Ouyang et al, 2013). The observation that the replacement of the Cl−/H+‐exchange activity of ClC‐3 by a Cl− conductance leads to severe pathology when not compensated by ClC‐4 generalizes the emerging picture (Jentsch, 2007; Braun et al, 2010; Novarino et al, 2010; Weinert et al, 2010) that the function of endosomes and lysosomes depends on Cl− accumulation or changes in membrane potential brought about by CLC Cl−/H+ exchangers.
Materials and Methods
Mice
The generation of Clcn3 −/− and Clcn4 −/− mice (Stobrawa et al, 2001) has been described. For the generation of Clcn3 unc/unc mice 11.7 kb of mouse genomic sequence extending from exon 2 to 6 of Clcn3 were amplified from R1 ES cells and cloned into pKO Scrambler plasmid 901 (Lexicon Genetics Incorporated) containing a dtA cassette (diphtheria toxin A cassette). A neomycin (neo) resistance cassette flanked by FRT sites was introduced between exon 5 and 6 to select for recombination in embryonic stem (ES) cells. Exon 5 was modified by insertion of the E224A mutation. Targeted R1 ES cells were screened by Southern blot (SB) analysis using EcoRV and an external 1.2‐kb probe. Correctly targeted ES cells were injected into C57Bl/6 blastocysts. Chimeric animals were crossed with FLPe recombinase‐expressing “deleter” mice (Farley et al, 2000) and resulting heterozygous animals (Clcn3 +/unc) were inbred to yield Clcn3 unc/unc. Exon 5 of the genomic Clcn3 unc/unc gene was amplified with intronic primers and sequenced. To obtain double genetically modified Clcn3 unc/unc/Clcn4 −/− mice, heterozygous Clcn3 +/unc/Clcn4 +/− mice were inbred.
To generate Clcn3 ven/ven mice, 14.3 kb of mouse genomic sequence extending from exon 1 to 3 of Clcn3 was subcloned into pKO Scrambler plasmid 901 (Lexicon Genetics) containing a dtA cassette from a murine Clcn3 λ clone 7 isolated from a 129SVJ mouse genomic library cloned into pBlue. A puromycin (puro) resistance cassette flanked by loxP sites was introduced between exon 1 and 2 to select for recombination in ES cells. Venus cDNA was inserted by recombinant PCR onto the start ATG of the Clcn3 ORF which codes for the transcript variant a (NM_007711.3). Additionally, a silent point mutation was introduced to obtain an NcoI restriction site for subsequent SB analysis. The Venus and Clcn3 sequences were separated by a 12‐bp linker. Correctly targeted ES cells were injected into C57Bl/6 blastocysts. Chimeric animals were crossed with Cre‐recombinase‐expressing “deleter” mice (Schwenk et al, 1995), and resulting heterozygous animals (Clcn3 +/ven) were inbred to yield Clcn3 ven/ven. All experiments were performed with mice in a mixed C57Bl/6‐129/Svj genetic background, always using littermates as controls. Animals were housed under standard conditions in the animal facility of the MDC according to institutional guidelines and kept on a 12‐h light/dark cycle. LAGeSo, Berlin, Germany, approved all experimental procedures.
Antibodies
Primary antibodies were as follows: anti‐ClC‐3 and rabbit anti‐ClC‐4 (Maritzen et al, 2008), rabbit anti‐ClC‐5 (Günther et al, 1998), rabbit anti‐synaptophysin (#101 002, Synaptic Systems), chicken anti‐GFP (#1020 Aves lab), mouse anti‐GFP (#A‐11120, Life Technologies), rabbit anti‐GFP (#A‐11122, Life Technologies), rat anti‐Lamp‐1 (#553792, BD Pharmingen; clone 1D4B; BD Biosciences), mouse anti‐Lamp‐1 (clone H4A3, DHSB), rabbit anti‐EEA1 (#PA1‐063A, Thermo Scientific), mouse anti‐EEA1 (#610457, Transduction Laboratories), mouse anti‐TfR (#13‐6890, Zymed), guinea pig anti‐VGLUT1 (#135 304, Synaptic Systems), mouse anti‐VGLUT1 (#135 311, Synaptic Systems), rabbit anti‐VGLUT1 (#135 303, Synaptic Systems), guinea pig anti‐VGLUT2 (#135 404, Synaptic Systems), mouse anti‐VGAT (#131 011, Synaptic Systems), rabbit anti‐clathrin heavy chain (ab21679, Abcam), rabbit anti‐LC3 (#AP1802a, Abgent), rabbit anti‐GluR4 (#06‐308, Millipore), rabbit anti‐GABAA‐receptor α1 (#06‐868, Millipore), mouse anti‐MAP2 (#MAB3418, Millipore), mouse anti‐PSD95 (#MA1‐046/CP35, Thermo Scientific/Calbiochem), mouse anti‐GFAP (#G3893, Roche), mouse anti‐APC (#OP80, Calbiochem), mouse anti‐GM130 (#610823, BD Biosciences), mouse anti‐rab4 (#610889, BD Biosciences), mouse anti‐rab3 (#107 011, Synaptic Systems), mouse anti‐adaptin Ƴ (AP‐1, #610385, BD Transduction) mouse anti‐PDI (#SPA‐891, StressGen), mouse anti‐cathepsin D (#28‐0002, Zymed), rabbit anti‐β‐actin (#A2066, Sigma‐Aldrich), rabbit anti‐α‐tubulin (#ab15246, Abcam), rat anti‐HA (3F10, #118676423001, Roche). Secondary antibodies were coupled to Alexa Fluor 488, 546, 633 (Invitrogen) or HRP (Jackson ImmunoResearch).
Biochemical methods
For membrane preparation, tissues were homogenized in PBS with protease inhibitors (Complete®, Roche) and cleared two times by centrifugation at 1,000 g for 10 min. Membranes were pelleted at 270,000 g for 30 min and subsequently resuspended in PBS supplemented with protease inhibitors and 2% (w/v) SDS. For whole tissue homogenates, organs were homogenized in PBS with 1% (v/v) NP‐40 and protease inhibitors (Complete®, Roche) and incubated for 30 min on ice. After centrifugation for 10 min at 20,800 g, the supernatant was used for SDS–PAGE. Equal amounts of protein were separated by SDS–PAGE and blotted onto nitrocellulose.
For deglycosylation, 60 μg of lysate was denatured at 65°C for 5 min in 0.5% (w/v) SDS for PNGase F (Roche) or in 0.5% SDS, 40 mM DTT and 50 mM Na‐acetate pH 5.2 for EndoH (Roche) treatment. After adjusting to 1% (v/v) NP‐40 and 1.3 mM EDTA, 1 unit of PNGase F and 0.015 units of EndoH were added and samples incubated at 37°C for 2 h. For immunoprecipitation experiments, ClC‐3 and ClC‐4 antibodies were bound to protein A sepharose (GE Healthcare). Brain membranes were pelleted and solubilized in homogenization buffer (150 mM NaCl, 25 mM MES pH 6.5) containing 1% Triton X‐100. Non‐solubilized material was removed by a 20,360 g spin. After incubation with the protein A sepharose–antibody complexes for 12 h at 4°C and washing, samples were eluted in 2× SDS sample buffer at 75°C.
Quantification of ClC‐3/VGLUT1 ratio in LP2 fraction
To estimate ClC‐3 copy number relative to VGLUT1, we transiently expressed mVGLUT1 and hClC‐3 in HEK cells, both of which were N‐terminally tagged with EGFP. The cells were lysed in equal volumes of 1× PBS containing 1% Triton X‐100 and protease inhibitors (Complete®, Roche), and soluble supernatant was used as standard for calibrating VGLUT1 and ClC‐3 antibodies. Probing with GFP allowed us to directly compare the relative amounts of VGLUT1 and ClC‐3 in the lysates. On average, we found that the GFP‐hClC‐3 lysate contained about 4.33 × more ClC‐3 molecules than the GFP‐VGLUT1 lysate contains VGLUT1 molecules. We then compared the two standards with different amounts of LP2 fractions (see below for LP2 preparation) from mouse brain by using our KO‐controlled ClC‐3 antibody and a VGLUT1 antibody directed opposite the GFP tag against the very C*terminus of VGLUT1 (see above). While the standard for VGLUT1 roughly corresponds to 2.5 μg of that LP2 fraction, the signal of the standard for ClC‐3 corresponds to ~ 140 μg. Therefore, the amount of VGLUT1 and ClC‐3 standards compared to LP2 fraction differs by a factor of 56. Given that the standard for ClC‐3 contains 4.33 times more ClC‐3‐molecules than the standard for VGLUT1, the actual copy number of ClC‐3 in the LP2 fraction is about 13 times lower.
Fluorescence resonance energy transfer (FRET) microscopy
COS‐7 cells were transfected as described above. Imaging was performed in physiological solution (in mM: 115 NaCl, 3 KCl, 1 MgSO4, 1 MgCl2, 1 CaCl2, 20 HEPES, 10 glucose, pH 7.4), using a LSM 510 META microscope (Carl Zeiss) equipped with a 40× oil‐immersion objective (numerical aperture = 1.3), an argon laser (λ = 514 nm), and an infrared laser (λ = 810 nm, two photon). Donor (ECFP) emission spectra were recorded at 810 nm (two photon) excitation before and after acceptor photobleaching (EYFP, 514 nm laser).
Förster resonance energy transfer efficiencies were calculated from the donor emission at λ = 436 ‐ 500 nm before and after photobleaching, using the following equation:
E: energy transfer efficiency; I 0 = donor intensity before acceptor photobleaching; I pb = donor intensity after acceptor photobleaching.
LP2 preparations and SV fraction acidification
Crude SVs (LP2) were purified as described (Huttner et al, 1983; Takamori et al, 2000). LP2 were resuspended in homogenization buffer [320 mM sucrose, 4 mM HEPES‐KOH (pH 7.4)]. Acidification was measured with 100 μg LP2 by acridine orange quenching in 0.8 ml of assay buffer (115 mM sucrose, 60 mM KCl, 4 mM K2SO4, 200 μM acridine orange, 1.2 mM K‐ATP, 10 mM MOPS, pH 7.3) in a Safas fluorometer (excitation, 492 nm, emission, 520 nm) at 32°C. The addition of 5 mM MgCl2 after 60 s started the reaction. FCCP (10 μM) addition after 4 min dissipated the H+‐gradient and terminated the reaction. Traces were normalized to the fluorescence at t = 60 s.
Single‐vesicle imaging of venus‐tagged SVs
Synaptic vesicles were purified from the brain of adult Clcn3 ven/ven mice and immobilized on poly‐l‐lysine coated glass cover slips as previously described (Farsi et al, 2016). To perform IF imaging, primary labeled antibodies against VGLUT1 (Oyster‐650 labeled, Cat. #135 303C5, Synaptic Systems) or synaptophysin (Oyster‐650 labeled, Cat. #101 011C5, Synaptic Systems) were used. Prior to IF, immobilized SVs were fixed using 4% paraformaldehyde and blocked by 30‐min incubation with phosphate‐buffered saline (PBS) containing 5% bovine serum albumin (BSA). Imaging of SVs was performed using a Nikon Eclipse Ti‐inverted microscope equipped with iLAS2 TIRF (Visitron Systems) and an EM‐CCD camera (iXon+ DU‐897E‐BV; Andor Technology). Excitation was performed at 488 nm (for Venus imaging) and 640 nm (for IF imaging), and emission of SVs was collected through a quadband (405/488/561/647 nm, Chroma 89902) emission filter.
Histology and electron microscopy
Deeply anesthetized mice were perfused with 4% (w/v) PFA in PBS, and isolated tissues were postfixed overnight at 4°C. Three‐micrometer paraffin sections of retina were used for H&E and Nissl staining, 8‐μm paraffin sections of the brain for Nissl staining, and 8‐μm cryosections for IHC. For IHC, sections were postfixed with 4% (w/v) PFA, permeabilized using 0.2% (v/v) Triton X‐100 in PBS and blocked with 3% (w/v) BSA in PBS. Antibody incubation was in blocking buffer overnight at 4°C. For some ClC‐3 labeling experiments, an antigen retrieval step (10 min in sodium citrate buffer, pH 6.0, at 95°C) was included after fixation.
For DAB peroxidase staining on paraffin sections, HRP‐conjugated secondary antibodies were used (DAKO Envision+ HRP system). The peroxidase reaction was started using 500 mg/ml diaminobenzidine, 10 mM imidazole, 0.3% ammonium nickel sulfate, 0.003% H2O2 in 50 mM Tris; pH 7.6. Sections were washed and mounted in Kaiser's glycerol gelatine (Merck). Sections were then examined with a Zeiss Axiophot.
For electron microscopy, mice were perfused with 4% (w/v) PFA and 2.5% (v/v) glutaraldehyde in 0.1 M phosphate buffer (pH 7.4). Brains were cut in 200‐μm sections with a vibratome, postfixed in 1% osmium tetroxide and 1.5% potassium hexacyanoferrat, and embedded in epoxy resin. Layer 4–5 of secondary visual cortex just above hippocampus was trimmed and ultrathin sectioned. Glutamatergic synapses were identified by presence of their prominent postsynaptic densities and spine heads. Images were done using Zeiss EM 900 microscope and Morada G2 camera. Four pairs of wild‐type and ClCn3 −/− animals were acquired with 20–25 boutons per animals analyzed for vesicle number. Vesicle sizes were analyzed in more than 700 vesicles per genotype.
Clcn3 ven/ven and wild‐type mice were perfused with 4% PFA and 0.1% glutaraldehyde, postfixed overnight at 4°C. CA3 areas of hippocampi were dissected and formed into 1‐mm³ blocks that have been cryoprotected in 2.1 M sucrose solution overnight and frozen in liquid propane on pins. Modified Tokuyasu sectioning was performed as described elsewhere. Sections were blocked with 10% BSA and stained with Invitrogen mouse anti‐GFP antibodies (1:50) and secondary 10 nm gold coupled goat‐anti‐mouse antibodies (1:50; Dianova). Sections were embedded and contrasted using a mix of polyvinyl alcohol/sodium silicotungstate/sodium orthovanadate.
Golgi‐Cox staining
Animals were sacrificed by cervical dislocation; brains were dissected, processed, and stained using FD Rapid Golgi Stain Kit according to the manufacturer's instructions. 100‐μm sections were cut, stained, and examined using a Zeiss Axiophot. Clcn4 +/+ and Clcn4 −/− 8‐week‐old male littermates and 24‐week‐old female littermates were analyzed.
Expression constructs
For cell culture expression, human ClC‐3 (transcript variant a, NM_001243372.1, but N‐terminally lacking 58 amino acids) was cloned into pCIneo (Promega) and an HA epitope was inserted between amino acids Gly406 and Ala407 of hClC‐4 (Friedrich et al, 1999) (extracytosolic loop) by PCR mutagenesis. The point mutation to generate hClC‐3unc (E224A) was introduced by PCR with primers carrying the mutation. For whole‐cell patch‐clamp studies, human ClC‐3 (see above) was cloned into pEGFP‐C1 (Clontech) with the linker sequence SGLRSRE. The point mutations 4xLA (in which all four leucines of the N‐terminal dileucine cluster were mutated to alanine) were introduced by PCR with primers carrying the mutations. All constructs were confirmed by sequencing the complete ORF.
For pHluorin experiments in hippocampal neurons, pHluorin was inserted by recombinant PCR into pCIneo‐hClC‐3 between membrane helices L and M with linker sequences GA and TG N‐ and C‐terminally, respectively.
For FRET experiments, human ClC‐3 and ClC‐4 (see above) were cloned into pECFP‐C1 and pEYFP‐C1 (Clontech). The linker sequences were SGLRSREL and SGLRSRAQASNSVET for ClC‐3 and ClC‐4, respectively.
For antibody calibration, VGLUT1 (NP_892038.2) was amplified from mouse cDNA and cloned into pEGFP‐C3 (Clontech). All constructs mentioned above were confirmed by sequencing the complete ORF.
Expression in cell culture and fluorescence microscopy
Plasmid DNA was transfected into cells using the PEI method (Brissault et al, 2003) or FuGENE6 (Roche Applied Science) according to the manufacturer's instruction. Cells were grown for further 24–48 h before fixation with 4% paraformaldehyde in PBS for 10 min. For immunostaining, cells were incubated with 30 mM glycine in PBS for 5 min and permeabilized with 0.1% saponin in PBS for 10 min. Both primary and AlexaFluor‐coupled secondary (Molecular Probes) antibodies were applied in PBS, 0.05% saponin supplemented with 3% BSA. Images were acquired with an LSM510 laser scanning confocal microscope equipped with a 63× 1.4 NA oil‐immersion lens (Zeiss).
Primary cell culture and transfection
Hippocampi were dissected from P0 to P2 mice, dissociated with papain (20 units/ml) at 37°C for 30 min, and triturated by pipetting. Hippocampal neurons were placed on life cell dishes or six‐well chamber slides coated with poly‐d‐lysine at a cell density of 1 × 10⁵ cells/dish. For neuronal cycling experiments, neurons were transfected at 9–10 days in vitro (DIV) with the respective plasmid DNA using the Calcium Phosphate Transfection Kit (Promega Inc.).
Primary cortical astrocyte cultures were prepared from P0 to P2 mouse pups of mixed sex. After dissection and removal of meninges and blood vessels, cortices were sliced and incubated with trypsin–EDTA (0.05%) for 30–40 min at 37°C. Tissue was triturated and suspended in DMEM (PAN Biotech) supplemented with 10% fetal bovine serum (Invitrogen) and 1× penicillin/streptomycin (Invitrogen). Cells were plated at a density of 1 × 10⁷ cells in a 75‐cm2 flask and maintained in a 5% CO2 incubator at 37°C. The growth medium was exchanged with fresh medium twice a week. At 7DIV or when cells becoming ~ 90% confluent, cell culture container was vortexed at full speed just prior to cell dissociation for further propagation of astrocytes without contaminating oligodendrocytes.
Immunofluorescence of primary neurons and glial cells
On DIV14–18, primary neurons or glial cells were fixed with 4% PFA/PBS for 10 min at room temperature. Fixed cells were washed, incubated with 30 mM glycine in PBS for 5 min, and permeabilized with 0.1% saponin in PBS for 10 min. Both primary and AlexaFluor‐coupled secondary (Molecular Probes) antibodies were applied in PBS, 0.05% saponin supplemented with 3% BSA. Cells were washed again and mounted in ImmunMount (Thermo Scientific).
Electrically stimulated SV exo‐ and endocytosis by pHluorin imaging
Live imaging of primary hippocampal neurons was performed using a sCMOS camera (Neo, Andor) on an inverted microscope (Eclipse Ti, Nikon) with a 40× oil‐immersion objective and a 200‐Watt mercury lamp (Lumen 200, Prior) under the control of μManager (Edelstein et al, 2010). Images were acquired every 2 s with 300 ms excitation using a filter set for pHluorin or mOrange (F36‐526/F26‐518, AHF Analysentechnik). Measurements were conducted at room temperature in physiological buffer [in mM: 170 NaCl, 3.5 KCl, 0.4 KH2PO4, 20 TES (2‐[(2‐hydroxy‐1,1 bis(hydroxylmethyl)ethyl)amino]ethanesulfonic acid), 5 NaHCO3, 5 glucose, 1.2 Na2SO4, 1.2 MgCl2, 1.3 CaCl2 (pH 7.4). Osmolarity was adjusted with mannitol to the osmolarity of the growth medium. Ten micromolar CNQX (6‐cyano‐7‐nitroquinoxaline‐2,3‐dione, Sigma‐Aldrich) and 50 μM APV (2‐amino‐5‐phosphonovalerianacid, Sigma‐Aldrich) were added as specific AMPA and NMDA receptor antagonists, respectively. Neurons were stimulated by electric field stimulation with 200 action potentials (at 20 Hz, 100 mA) in a stimulation chamber (RC‐47FSLP, Warner Instruments), and stimulation‐induced pHluorin and mOrange responses were recorded. Only boutons showing mOrange responses upon electrical stimulation and pHluorin unquenching upon addition of basic buffer (physiological buffer with 50 mM NaCl replaced by NH4Cl) were used for analysis.
Unquenching of mOrange causes a much weaker fluorescence increase than unquenching of pHluorin (mOrange2: 3.5‐fold, superecliptic pHluorin: 50‐fold) (Lin & Schnitzer, 2016). We intentionally fused the stronger pH sensor to ClC‐3, in order to be able to see also weak signs of exocytosis. We used strong illumination schemes and therefore had to correct for photobleaching by fitting a monoexponential decay function (equation (1)) to the signal. Bleach rates were calculated from the lifetime of mOrange decay (equation (2)). Bleach rates were used to correct for bleaching of synaptic mOrange intensity traces (equation (3)).
| (1) |
I(t): intensity at time t; bg : background signal; a: intensity at time 0; τ : lifetime.
| (2) |
λ: bleach rate; τ : lifetime.
| (3) |
Ibc(t): bleach corrected intensity at time t; I(t): intensity at time t; λ: bleach rate; bg: background.
Measurement of endosomal pH
Endosomal pH was measured by ratiometric fluorescence imaging of the pH‐sensitive fluorescein‐conjugated transferrin and the pH‐stable Alexa546‐conjugated transferrin. Primary hippocampal neurons were plated onto live cell dishes. When older than DIV14, they were incubated with 200 μg/ml FITC‐Tfn and 100 μg/ml Alexa546‐Tfn at 37°C for 20 min in growth medium. FITC‐Tfn acts as a pH sensor, whereas the Alexa546‐Tfn acts as an internal standard for uptake. Cells were washed twice with imaging solution (in mM: 140 NaCl, 2.5 KCl, 1.8 CaCl2, 1 MgCl2, 20 HEPES) supplemented with 1% BSA and 20 mM glucose) and imaged using a Zeiss LSM510 confocal laser scanning microscope under 40 × 1.4 NA oil‐immersion lens. Using ImageJ regions of interest (ROI) were defined as areas above a fixed fluorescence threshold. Endosomal pH was calculated from the ratio of fluorescence intensity (Alexa546/FITC). At the end of each experiment, in situ calibration curves were obtained in isotonic K+‐based solution (125 mM KCl, 25 mM NaCl, 20 mM HEPES for pH 7.4, 5.4, and MES for pH 4.4) supplemented with 10 μM of both nigericin and monensin (both Sigma‐Aldrich). Cells were equilibrated for at least 2 min for each pH value. The resulting fluorescence intensity ratio as a function of pH was fit to a sigmoid and used to interpolate pH values from the experimental ratio data.
Hippocampal slice recordings
Horizontal hippocampal slices (300 μm) were prepared from juvenile mice (P14–P16) using standard methods. Recordings of CA1 pyramidal neurons were conducted at 34°C. Extracellular solution was artificial cerebrospinal fluid (ACSF) containing (in mM): NaCl 131, NaHCO3 29, glucose 11, KCl 2.8, CaCl2 2.5, MgSO4 1.3, NaH2PO4 1.1, osmolarity 320 mosml/l, saturated with 95% O2/5% CO2 (pH 7.4). Patch pipettes (2.5–4 MΩ) were filled with (in mM): CsCl 130, HEPES 10, MgATP 2, MgCl2 2, EGTA 0.2, osmolarity 280–290 mosml/l, pH 7.3. Cells were held at −70 mV and miniature IPSCs were isolated by bath application of 1 μM TTX, 10 μM NBQX, and 50 μM D‐AP5. Miniature EPSCs were isolated by 20 μM bicuculline and 1 μM TTX. The low frequency of spontaneous mEPSCs (∼ 1/min) was increased by adding 200 mM sucrose to the bath. The currents were recorded after an equilibration time of 2 min, low‐pass‐filtered at 2 kHz, sampled at 8 kHz, and visualized by pClamp 10.2 (Molecular Devices, Sunnyvale). Recordings were only used as long as regularly applied voltage pulses revealed stable series resistance. pClamp 10.2 and Mini Analysis Program (Synaptosoft, Decatur) were used for data analyses.
Patch‐clamp measurements of transfected cells
Whole‐cell patch‐clamp experiments on HeLa cells used patch pipettes of 3–5 MΩ resistance filled with (in mM) 110 CsCl, 10 NaCl, 0.5 CaCl2, 1 EGTA, 2 MgATP, 40 HEPES, pH 7.4. The bath solution contained (in mM) 130 NaCl, 5 KCl, 1 MgCl2, 1 CaCl2, 10 glucose, 20 HEPES, pH 7.4. Osmolarity was adjusted with sucrose to 280–290 mOsmol/l for the pipette solution and to 300–310 mOsmol/l for the extracellular solution. Cells were held at −30 mV upon reaching the whole‐cell configuration and currents were elicited using 1‐s pulses ranging from −80 mV to +140 mV. Data were acquired with an EPC‐10 double amplifier using Pulse software (HEKA).
Data analysis
Values are presented as mean ± SEM (standard error of the mean). Statistical difference between means was assessed by the two‐tailed t‐test for two groups using the GraphPad Prism software. Specific details are given in the respective figure legends. To evaluate the statistical difference of the miniature inhibitory postsynaptic currents, mean amplitudes and frequencies were first assessed for the presence of a normal distribution using the Shapiro–Wilk test followed by the two‐tailed t‐test for two groups. If the values were not normally distributed, the Mann–Whitney test was applied. The statistical difference between the cumulative amplitudes and cumulative interevent intervals was assessed by the Kolmogorov–Smirnov test. Statistically significant values are indicated by *P < 0.05, **P < 0.01, and ***P < 0.001.
Author contributions
TJJ and SW designed the project and wrote the manuscript. SW generated the Clcn3 unc and Clcn3 ven mouse models. SW, NG, DD, TS, DP, ZF, CFL, GN, KILC, and RPC performed experiments and analyzed data together with TJJ.
Conflict of interest
The authors declare that they have no conflict of interest.
Supporting information
Appendix
Expanded View Figures PDF
Review Process File
Source Data for Figure 1
Source Data for Figure 2
Source Data for Figure 3
Source Data for Figure 4
Source Data for Figure 5
Source Data for Figure 6
Acknowledgements
We thank T. Stauber and T. Breiderhoff for cloning expression constructs; K. Räbel, S. Hohensee, and C. Backhaus for technical assistance; R. Jahn (MPIbpc, Göttingen) for providing the equipment required for SV purification; and A. Woehler (MDC, Berlin) for assistance with SV imaging. Supported, in part, by grants from the Deutsche Forschungsgemeinschaft (JE164/9‐2, SFB740 TP C5, FOR 2625 (JE164/14‐1), NeuroCure Cluster of Excellence), the European Research Council Advanced Grant CYTOVOLION (ERC 294435) and the Prix Louis‐Jeantet de Médecine to TJJ, and Peter and Traudl Engelhorn fellowship to ZF.
The EMBO Journal (2020) 39: e103358
See also: https://doi.org/10.15252/embj.2020104812 (May 2020)
References
- Accardi A, Miller C (2004) Secondary active transport mediated by a prokaryotic homologue of ClC Cl− channels. Nature 427: 803–807 [DOI] [PubMed] [Google Scholar]
- Biesemann C, Grønborg M, Luquet E, Wichert SP, Bernard V, Bungers SR, Cooper B, Varoqueaux F, Li L, Byrne JA et al (2014) Proteomic screening of glutamatergic mouse brain synaptosomes isolated by fluorescence activated sorting. EMBO J 33: 157–170 [DOI] [PMC free article] [PubMed] [Google Scholar]
- Bignon Y, Alekov A, Frachon N, Lahuna O, Doh‐Egueli CJ, Deschenes G, Vargas‐Poussou R, Lourdel S (2018) A novel CLCN5 pathogenic mutation supports Dent disease with normal endosomal acidification. Hum Mutat 39: 1139–1149 [DOI] [PubMed] [Google Scholar]
- Boyken J, Grønborg M, Riedel D, Urlaub H, Jahn R, Chua JJ (2013) Molecular profiling of synaptic vesicle docking sites reveals novel proteins but few differences between glutamatergic and GABAergic synapses. Neuron 78: 285–297 [DOI] [PubMed] [Google Scholar]
- Braun NA, Morgan B, Dick TP, Schwappach B (2010) The yeast CLC protein counteracts vesicular acidification during iron starvation. J Cell Sci 123: 2342–2350 [DOI] [PMC free article] [PubMed] [Google Scholar]
- Brissault B, Kichler A, Guis C, Leborgne C, Danos O, Cheradame H (2003) Synthesis of linear polyethylenimine derivatives for DNA transfection. Bioconjug Chem 14: 581–587 [DOI] [PubMed] [Google Scholar]
- Chakraborty K, Leung K, Krishnan Y (2017) High lumenal chloride in the lysosome is critical for lysosome function. eLife 6: e28862 [DOI] [PMC free article] [PubMed] [Google Scholar]
- Dean KM, Lubbeck JL, Binder JK, Schwall LR, Jimenez R, Palmer AE (2011) Analysis of red‐fluorescent proteins provides insight into dark‐state conversion and photodegradation. Biophys J 101: 961–969 [DOI] [PMC free article] [PubMed] [Google Scholar]
- Dickerson LW, Bonthius DJ, Schutte BC, Yang B, Barna TJ, Bailey MC, Nehrke K, Williamson RA, Lamb FS (2002) Altered GABAergic function accompanies hippocampal degeneration in mice lacking ClC‐3 voltage‐gated chloride channels. Brain Res 958: 227–250 [DOI] [PubMed] [Google Scholar]
- Duan D, Winter C, Cowley S, Hume JR, Horowitz B (1997) Molecular identification of a volume‐regulated chloride channel. Nature 390: 417–421 [DOI] [PubMed] [Google Scholar]
- Dutzler R, Campbell EB, Cadene M, Chait BT, MacKinnon R (2002) X‐ray structure of a ClC chloride channel at 3.0 Å reveals the molecular basis of anion selectivity. Nature 415: 287–294 [DOI] [PubMed] [Google Scholar]
- Dutzler R, Campbell EB, MacKinnon R (2003) Gating the selectivity filter in ClC chloride channels. Science 300: 108–112 [DOI] [PubMed] [Google Scholar]
- Edelstein A, Amodaj N, Hoover K, Vale R, Stuurman N (2010) Computer control of microscopes using microManager. Curr Protoc Mol Biol Chapter 14: Unit14 20. [DOI] [PMC free article] [PubMed] [Google Scholar]
- Eriksen J, Chang R, McGregor M, Silm K, Suzuki T, Edwards RH (2016) Protons regulate vesicular glutamate transporters through an allosteric mechanism. Neuron 90: 768–780 [DOI] [PMC free article] [PubMed] [Google Scholar]
- Farley FW, Soriano P, Steffen LS, Dymecki SM (2000) Widespread recombinase expression using FLPeR (flipper) mice. Genesis 28: 106–110 [PubMed] [Google Scholar]
- Farsi Z, Preobraschenski J, van den Bogaart G, Riedel D, Jahn R, Woehler A (2016) Single‐vesicle imaging reveals different transport mechanisms between glutamatergic and GABAergic vesicles. Science 351: 981–984 [DOI] [PubMed] [Google Scholar]
- Friedrich T, Breiderhoff T, Jentsch TJ (1999) Mutational analysis demonstrates that ClC‐4 and ClC‐5 directly mediate plasma membrane currents. J Biol Chem 274: 896–902 [DOI] [PubMed] [Google Scholar]
- Gorvin CM, Wilmer MJ, Piret SE, Harding B, van den Heuvel LP, Wrong O, Jat PS, Lippiat JD, Levtchenko EN, Thakker RV (2013) Receptor‐mediated endocytosis and endosomal acidification is impaired in proximal tubule epithelial cells of Dent disease patients. Proc Natl Acad Sci USA 110: 7014–7019 [DOI] [PMC free article] [PubMed] [Google Scholar]
- Grønborg M, Pavlos NJ, Brunk I, Chua JJ, Munster‐Wandowski A, Riedel D, Ahnert‐Hilger G, Urlaub H, Jahn R (2010) Quantitative comparison of glutamatergic and GABAergic synaptic vesicles unveils selectivity for few proteins including MAL2, a novel synaptic vesicle protein. J Neurosci 30: 2–12 [DOI] [PMC free article] [PubMed] [Google Scholar]
- Günther W, Lüchow A, Cluzeaud F, Vandewalle A, Jentsch TJ (1998) ClC‐5, the chloride channel mutated in Dent's disease, colocalizes with the proton pump in endocytotically active kidney cells. Proc Natl Acad Sci USA 95: 8075–8080 [DOI] [PMC free article] [PubMed] [Google Scholar]
- Günther W, Piwon N, Jentsch TJ (2003) The ClC‐5 chloride channel knock‐out mouse ‐ an animal model for Dent's disease. Pflügers Arch 445: 456–462 [DOI] [PubMed] [Google Scholar]
- Guzman RE, Grieschat M, Fahlke C, Alekov AK (2013) ClC‐3 is an intracellular chloride/proton exchanger with large voltage‐dependent nonlinear capacitance. ACS Chem Neurosci 4: 994–1003 [DOI] [PMC free article] [PubMed] [Google Scholar]
- Guzman RE, Alekov AK, Filippov M, Hegermann J, Fahlke C (2014) Involvement of ClC‐3 chloride/proton exchangers in controlling glutamatergic synaptic strength in cultured hippocampal neurons. Front Cell Neurosci 8: 143 [DOI] [PMC free article] [PubMed] [Google Scholar]
- Guzman RE, Miranda‐Laferte E, Franzen A, Fahlke C (2015) Neuronal ClC‐3 splice variants differ in subcellular localizations, but mediate identical transport functions. J Biol Chem 290: 25851–25862 [DOI] [PMC free article] [PubMed] [Google Scholar]
- Guzman RE, Bungert‐Plümke S, Franzen A, Fahlke C (2017) Preferential association with ClC‐3 permits sorting of ClC‐4 into endosomal compartments. J Biol Chem 292: 19055–19065 [DOI] [PMC free article] [PubMed] [Google Scholar]
- Hara‐Chikuma M, Wang Y, Guggino SE, Guggino WB, Verkman AS (2005a) Impaired acidification in early endosomes of ClC‐5 deficient proximal tubule. Biochem Biophys Res Commun 329: 941–946 [DOI] [PubMed] [Google Scholar]
- Hara‐Chikuma M, Yang B, Sonawane ND, Sasaki S, Uchida S, Verkman AS (2005b) ClC‐3 chloride channels facilitate endosomal acidification and chloride accumulation. J Biol Chem 280: 1241–1247 [DOI] [PubMed] [Google Scholar]
- Hnasko TS, Edwards RH (2012) Neurotransmitter corelease: mechanism and physiological role. Annu Rev Physiol 74: 225–243 [DOI] [PMC free article] [PubMed] [Google Scholar]
- Hu H, Haas SA, Chelly J, Van Esch H, Raynaud M, de Brouwer AP, Weinert S, Froyen G, Frints SG, Laumonnier F et al (2016) X‐exome sequencing of 405 unresolved families identifies seven novel intellectual disability genes. Mol Psychiatry 21: 133–148 [DOI] [PMC free article] [PubMed] [Google Scholar]
- Huang P, Liu J, Robinson NC, Musch MW, Kaetzel MA, Nelson DJ (2001) Regulation of human ClC‐3 channels by multifunctional Ca2+/calmodulin dependent protein kinase. J Biol Chem 276: 20093–20100 [DOI] [PubMed] [Google Scholar]
- Huttner WB, Schiebler W, Greengard P, De Camilli P (1983) Synapsin I (protein I), a nerve terminal‐specific phosphoprotein. III. Its association with synaptic vesicles studied in a highly purified synaptic vesicle preparation. J Cell Biol 96: 1374–1388 [DOI] [PMC free article] [PubMed] [Google Scholar]
- Jentsch TJ (2007) Chloride and the endosomal‐lysosomal pathway: emerging roles of CLC chloride transporters. J Physiol 578: 633– 640 [DOI] [PMC free article] [PubMed] [Google Scholar]
- Jentsch TJ (2008) CLC chloride channels and transporters: from genes to protein structure, pathology and physiology. Crit Rev Biochem Mol Biol 43: 3–36 [DOI] [PubMed] [Google Scholar]
- Jentsch TJ, Maritzen T, Keating DJ, Zdebik AA, Thevenod F (2010) ClC‐3–a granular anion transporter involved in insulin secretion? Cell Metab 12: 307–308; author reply 309‐310 [DOI] [PubMed] [Google Scholar]
- Jentsch TJ, Pusch M (2018) CLC chloride channels and transporters: structure, function, physiology, and disease. Physiol Rev 98: 1493–1590 [DOI] [PubMed] [Google Scholar]
- Kasper D, Planells‐Cases R, Fuhrmann JC, Scheel O, Zeitz O, Ruether K, Schmitt A, Poët M, Steinfeld R, Schweizer M et al (2005) Loss of the chloride channel ClC‐7 leads to lysosomal storage disease and neurodegeneration. EMBO J 24: 1079–1091 [DOI] [PMC free article] [PubMed] [Google Scholar]
- Kawasaki M, Uchida S, Monkawa T, Miyawaki A, Mikoshiba K, Marumo F, Sasaki S (1994) Cloning and expression of a protein kinase C‐regulated chloride channel abundantly expressed in rat brain neuronal cells. Neuron 12: 597–604 [DOI] [PubMed] [Google Scholar]
- Kawasaki M, Suzuki M, Uchida S, Sasaki S, Marumo F (1995) Stable and functional expression of the CIC‐3 chloride channel in somatic cell lines. Neuron 14: 1285–1291 [DOI] [PubMed] [Google Scholar]
- Kornak U, Kasper D, Bösl MR, Kaiser E, Schweizer M, Schulz A, Friedrich W, Delling G, Jentsch TJ (2001) Loss of the ClC‐7 chloride channel leads to osteopetrosis in mice and man. Cell 104: 205–215 [DOI] [PubMed] [Google Scholar]
- LaPlante JM, Sun M, Falardeau J, Dai D, Brown EM, Slaugenhaupt SA, Vassilev PM (2006) Lysosomal exocytosis is impaired in mucolipidosis type IV. Mol Genet Metab 89: 339–348 [DOI] [PubMed] [Google Scholar]
- Leisle L, Ludwig CF, Wagner FA, Jentsch TJ, Stauber T (2011) ClC‐7 is a slowly voltage‐gated 2Cl−/1H+‐exchanger and requires Ostm1 for transport activity. EMBO J 30: 2140–2152 [DOI] [PMC free article] [PubMed] [Google Scholar]
- Li X, Shimada K, Showalter LA, Weinman SA (2000) Biophysical properties of ClC‐3 differentiate it from swelling‐activated chloride channels in Chinese hamster ovary‐K1 cells. J Biol Chem 275: 35994–35998 [DOI] [PubMed] [Google Scholar]
- Li X, Wang T, Zhao Z, Weinman SA (2002) The ClC‐3 chloride channel promotes acidification of lysosomes in CHO‐K1 and Huh‐7 cells. Am J Physiol Cell Physiol 282: C1483–C1491 [DOI] [PubMed] [Google Scholar]
- Lin MZ, Schnitzer MJ (2016) Genetically encoded indicators of neuronal activity. Nat Neurosci 19: 1142–1153 [DOI] [PMC free article] [PubMed] [Google Scholar]
- Lloyd SE, Pearce SH, Fisher SE, Steinmeyer K, Schwappach B, Scheinman SJ, Harding B, Bolino A, Devoto M, Goodyer P et al (1996) A common molecular basis for three inherited kidney stone diseases. Nature 379: 445–449 [DOI] [PubMed] [Google Scholar]
- Lorenz C, Pusch M, Jentsch TJ (1996) Heteromultimeric CLC chloride channels with novel properties. Proc Natl Acad Sci USA 93: 13362–13366 [DOI] [PMC free article] [PubMed] [Google Scholar]
- Ludewig U, Pusch M, Jentsch TJ (1996) Two physically distinct pores in the dimeric ClC‐0 chloride channel. Nature 383: 340–343 [DOI] [PubMed] [Google Scholar]
- Ludwig CF, Ullrich F, Leisle L, Stauber T, Jentsch TJ (2013) Common gating of both CLC transporter subunits underlies voltage‐dependent activation of the 2Cl−/1H+ exchanger ClC‐7/Ostm1. J Biol Chem 288: 28611–28619 [DOI] [PMC free article] [PubMed] [Google Scholar]
- Maritzen T, Keating DJ, Neagoe I, Zdebik AA, Jentsch TJ (2008) Role of the vesicular chloride transporter ClC‐3 in neuroendocrine tissue. J Neurosci 28: 10587–10598 [DOI] [PMC free article] [PubMed] [Google Scholar]
- Martineau M, Guzman RE, Fahlke C, Klingauf J (2017) VGLUT1 functions as a glutamate/proton exchanger with chloride channel activity in hippocampal glutamatergic synapses. Nat Commun 8: 2279 [DOI] [PMC free article] [PubMed] [Google Scholar]
- Matsuda JJ, Filali MS, Volk KA, Collins MM, Moreland JG, Lamb FS (2008) Overexpression of ClC‐3 in HEK293T cells yields novel currents that are pH‐dependent. Am J Physiol Cell Physiol 294: C251–C262 [DOI] [PubMed] [Google Scholar]
- Michelsen K, Yuan H, Schwappach B (2005) Hide and run. Arginine‐based endoplasmic‐reticulum‐sorting motifs in the assembly of heteromultimeric membrane proteins. EMBO Rep 6: 717–722 [DOI] [PMC free article] [PubMed] [Google Scholar]
- Middleton RE, Pheasant DJ, Miller C (1996) Homodimeric architecture of a ClC‐type chloride ion channel. Nature 383: 337–340 [DOI] [PubMed] [Google Scholar]
- Miesenböck G, De Angelis DA, Rothman JE (1998) Visualizing secretion and synaptic transmission with pH‐sensitive green fluorescent proteins. Nature 394: 192–195 [DOI] [PubMed] [Google Scholar]
- Milosevic I (2018) Revisiting the role of clathrin‐mediated endocytosis in synaptic vesicle recycling. Front Cell Neurosci 12: 27 [DOI] [PMC free article] [PubMed] [Google Scholar]
- Mohammad‐Panah R, Harrison R, Dhani S, Ackerley C, Huan LJ, Wang Y, Bear CE (2003) The chloride channel ClC‐4 contributes to endosomal acidification and trafficking. J Biol Chem 278: 29267–29277 [DOI] [PubMed] [Google Scholar]
- Nagai T, Ibata K, Park ES, Kubota M, Mikoshiba K, Miyawaki A (2002) A variant of yellow fluorescent protein with fast and efficient maturation for cell‐biological applications. Nat Biotechnol 20: 87–90 [DOI] [PubMed] [Google Scholar]
- Neagoe I, Stauber T, Fidzinski P, Bergsdorf EY, Jentsch TJ (2010) The late endosomal CLC‐6 mediates proton/chloride countertransport in heterologous plasma membrane expression. J Biol Chem 285: 21689–21697 [DOI] [PMC free article] [PubMed] [Google Scholar]
- Nicoli ER, Weston MR, Hackbarth M, Becerril A, Larson A, Zein WM, Baker PR 2nd, Burke JD, Dorward H, Davids M et al (2019) Lysosomal storage and albinism due to effects of a de novo CLCN7 variant on lysosomal acidification. Am J Hum Genet 104: 1127–1138 [DOI] [PMC free article] [PubMed] [Google Scholar]
- Novarino G, Weinert S, Rickheit G, Jentsch TJ (2010) Endosomal chloride‐proton exchange rather than chloride conductance is crucial for renal endocytosis. Science 328: 1398–1401 [DOI] [PubMed] [Google Scholar]
- Okada T, Akita T, Sato‐Numata K, Islam MR, Okada Y (2014) A newly cloned ClC‐3 isoform, ClC‐3d, as well as ClC‐3a mediates Cd‐sensitive outwardly rectifying anion currents. Cell Physiol Biochem 33: 539–556 [DOI] [PubMed] [Google Scholar]
- Okkenhaug H, Weylandt KH, Carmena D, Wells DJ, Higgins CF, Sardini A (2006) The human ClC‐4 protein, a member of the CLC chloride channel/transporter family, is localized to the endoplasmic reticulum by its N‐terminus. FASEB J 20: 2390–2392 [DOI] [PubMed] [Google Scholar]
- Ouyang Q, Lizarraga SB, Schmidt M, Yang U, Gong J, Ellisor D, Kauer JA, Morrow EM (2013) Christianson syndrome protein NHE6 modulates TrkB endosomal signaling required for neuronal circuit development. Neuron 80: 97–112 [DOI] [PMC free article] [PubMed] [Google Scholar]
- Palmer EE, Stuhlmann T, Weinert S, Haan E, Van Esch H, Holvoet M, Boyle J, Leffler M, Raynaud M, Moraine C et al (2018) De novo and inherited mutations in the X‐linked gene CLCN4 are associated with syndromic intellectual disability and behavior and seizure disorders in males and females. Mol Psychiatry 23: 222–230 [DOI] [PMC free article] [PubMed] [Google Scholar]
- Picollo A, Pusch M (2005) Chloride/proton antiporter activity of mammalian CLC proteins ClC‐4 and ClC‐5. Nature 436: 420–423 [DOI] [PubMed] [Google Scholar]
- Piwon N, Günther W, Schwake M, Bösl MR, Jentsch TJ (2000) ClC‐5 Cl−channel disruption impairs endocytosis in a mouse model for Dent's disease. Nature 408: 369–373 [DOI] [PubMed] [Google Scholar]
- Poët M, Kornak U, Schweizer M, Zdebik AA, Scheel O, Hoelter S, Wurst W, Schmitt A, Fuhrmann JC, Planells‐Cases R et al (2006) Lysosomal storage disease upon disruption of the neuronal chloride transport protein ClC‐6. Proc Natl Acad Sci USA 103: 13854–13859 [DOI] [PMC free article] [PubMed] [Google Scholar]
- Preobraschenski J, Zander JF, Suzuki T, Ahnert‐Hilger G, Jahn R (2014) Vesicular glutamate transporters use flexible anion and cation binding sites for efficient accumulation of neurotransmitter. Neuron 84: 1287–1301 [DOI] [PubMed] [Google Scholar]
- Ramirez DM, Khvotchev M, Trauterman B, Kavalali ET (2012) Vti1a identifies a vesicle pool that preferentially recycles at rest and maintains spontaneous neurotransmission. Neuron 73: 121–134 [DOI] [PMC free article] [PubMed] [Google Scholar]
- Riazanski V, Deriy LV, Shevchenko PD, Le B, Gomez EA, Nelson DJ (2011) Presynaptic CLC‐3 determines quantal size of inhibitory transmission in the hippocampus. Nat Neurosci 14: 487–494 [DOI] [PMC free article] [PubMed] [Google Scholar]
- Rickheit G, Wartosch L, Schaffer S, Stobrawa SM, Novarino G, Weinert S, Jentsch TJ (2010) Role of ClC‐5 in renal endocytosis is unique among CLC exchangers and does not require PY‐motif‐dependent ubiquitylation. J Biol Chem 285: 17595–17603 [DOI] [PMC free article] [PubMed] [Google Scholar]
- Rohrbough J, Nguyen HN, Lamb FS (2018) Modulation of ClC‐3 gating and proton/anion exchange by internal and external protons and the anion selectivity filter. J Physiol 596: 4091–4119 [DOI] [PMC free article] [PubMed] [Google Scholar]
- Salazar G, Love R, Styers ML, Werner E, Peden A, Rodriguez S, Gearing M, Wainer BH, Faundez V (2004) AP‐3‐dependent mechanisms control the targeting of a chloride channel (ClC‐3) in neuronal and non‐neuronal cells. J Biol Chem 279: 25430–25439 [DOI] [PubMed] [Google Scholar]
- Scheel O, Zdebik A, Lourdel S, Jentsch TJ (2005) Voltage‐dependent electrogenic chloride proton exchange by endosomal CLC proteins. Nature 436: 424–427 [DOI] [PubMed] [Google Scholar]
- Schenck S, Wojcik SM, Brose N, Takamori S (2009) A chloride conductance in VGLUT1 underlies maximal glutamate loading into synaptic vesicles. Nat Neurosci 12: 156–162 [DOI] [PubMed] [Google Scholar]
- Schwenk F, Baron U, Rajewsky K (1995) A cre‐transgenic mouse strain for the ubiquitous deletion of loxP‐flanked gene segments including deletion in germ cells. Nucleic Acids Res 23: 5080–5081 [DOI] [PMC free article] [PubMed] [Google Scholar]
- Sekine T, Komoda F, Miura K, Takita J, Shimadzu M, Matsuyama T, Ashida A, Igarashi T (2014) Japanese Dent disease has a wider clinical spectrum than Dent disease in Europe/USA: genetic and clinical studies of 86 unrelated patients with low‐molecular‐weight proteinuria. Nephrol Dial Transplant 29: 376–384 [DOI] [PubMed] [Google Scholar]
- Seong E, Wainer BH, Hughes ED, Saunders TL, Burmeister M, Faundez V (2005) Genetic analysis of the neuronal and ubiquitous AP‐3 adaptor complexes reveals divergent functions in brain. Mol Biol Cell 16: 128–140 [DOI] [PMC free article] [PubMed] [Google Scholar]
- Steinberg BE, Huynh KK, Brodovitch A, Jabs S, Stauber T, Jentsch TJ, Grinstein S (2010) A cation counterflux supports lysosomal acidification. J Cell Biol 189: 1171–1186 [DOI] [PMC free article] [PubMed] [Google Scholar]
- Steinmeyer K, Schwappach B, Bens M, Vandewalle A, Jentsch TJ (1995) Cloning and functional expression of rat CLC‐5, a chloride channel related to kidney disease. J Biol Chem 270: 31172–31177 [DOI] [PubMed] [Google Scholar]
- Stobrawa SM, Breiderhoff T, Takamori S, Engel D, Schweizer M, Zdebik AA, Bösl MR, Ruether K, Jahn H, Draguhn A et al (2001) Disruption of ClC‐3, a chloride channel expressed on synaptic vesicles, leads to a loss of the hippocampus. Neuron 29: 185–196 [DOI] [PubMed] [Google Scholar]
- Suzuki T, Rai T, Hayama A, Sohara E, Suda S, Itoh T, Sasaki S, Uchida S (2006) Intracellular localization of ClC chloride channels and their ability to form hetero‐oligomers. J Cell Physiol 206: 792–798 [DOI] [PubMed] [Google Scholar]
- Takamori S, Riedel D, Jahn R (2000) Immunoisolation of GABA‐specific synaptic vesicles defines a functionally distinct subset of synaptic vesicles. J Neurosci 20: 4904–4911 [DOI] [PMC free article] [PubMed] [Google Scholar]
- Takamori S, Holt M, Stenius K, Lemke EA, Gronborg M, Riedel D, Urlaub H, Schenck S, Brugger B, Ringler P et al (2006) Molecular anatomy of a trafficking organelle. Cell 127: 831–846 [DOI] [PubMed] [Google Scholar]
- Veeramah KR, Johnstone L, Karafet TM, Wolf D, Sprissler R, Salogiannis J, Barth‐Maron A, Greenberg ME, Stuhlmann T, Weinert S et al (2013) Exome sequencing reveals new causal mutations in children with epileptic encephalopathies. Epilepsia 54: 1270–1281 [DOI] [PMC free article] [PubMed] [Google Scholar]
- Wang SS, Devuyst O, Courtoy PJ, Wang XT, Wang H, Wang Y, Thakker RV, Guggino S, Guggino WB (2000) Mice lacking renal chloride channel, CLC‐5, are a model for Dent's disease, a nephrolithiasis disorder associated with defective receptor‐mediated endocytosis. Hum Mol Genet 9: 2937–2945 [DOI] [PubMed] [Google Scholar]
- Wang XQ, Deriy LV, Foss S, Huang P, Lamb FS, Kaetzel MA, Bindokas V, Marks JD, Nelson DJ (2006) CLC‐3 channels modulate excitatory synaptic transmission in hippocampal neurons. Neuron 52: 321–333 [DOI] [PubMed] [Google Scholar]
- Watanabe S, Trimbuch T, Camacho‐Pérez M, Rost BR, Brokowski B, Söhl‐Kielczynski B, Felies A, Davis MW, Rosenmund C, Jorgensen EM (2014) Clathrin regenerates synaptic vesicles from endosomes. Nature 515: 228–233 [DOI] [PMC free article] [PubMed] [Google Scholar]
- Weinert S, Jabs S, Supanchart C, Schweizer M, Gimber N, Richter M, Rademann J, Stauber T, Kornak U, Jentsch TJ (2010) Lysosomal pathology and osteopetrosis upon loss of H+‐driven lysosomal Cl− accumulation. Science 328: 1401–1403 [DOI] [PubMed] [Google Scholar]
- Weinert S, Jabs S, Hohensee S, Chan WL, Kornak U, Jentsch TJ (2014) Transport activity and presence of ClC‐7/Ostm1 complex account for different cellular functions. EMBO Rep 15: 784–791 [DOI] [PMC free article] [PubMed] [Google Scholar]
- Weinreich F, Jentsch TJ (2001) Pores formed by single subunits in mixed dimers of different CLC chloride channels. J Biol Chem 276: 2347–2353 [DOI] [PubMed] [Google Scholar]
- Weylandt KH, Nebrig M, Jansen‐Rosseck N, Amey JS, Carmena D, Wiedenmann B, Higgins CF, Sardini A (2007) ClC‐3 expression enhances etoposide resistance by increasing acidification of the late endocytic compartment. Mol Cancer Ther 6: 979–986 [DOI] [PubMed] [Google Scholar]
- Yoshikawa M, Uchida S, Ezaki J, Rai T, Hayama A, Kobayashi K, Kida Y, Noda M, Koike M, Uchiyama Y et al (2002) CLC‐3 deficiency leads to phenotypes similar to human neuronal ceroid lipofuscinosis. Genes Cells 7: 597–605 [DOI] [PubMed] [Google Scholar]
- Zdebik AA, Zifarelli G, Bergsdorf E‐Y, Soliani P, Scheel O, Jentsch TJ, Pusch M (2008) Determinants of anion‐proton coupling in mammalian endosomal CLC proteins. J Biol Chem 283: 4219–4227 [DOI] [PubMed] [Google Scholar]
- Zerangue N, Schwappach B, Jan YN, Jan LY (1999) A new ER trafficking signal regulates the subunit stoichiometry of plasma membrane KATP channels. Neuron 22: 537–548 [DOI] [PubMed] [Google Scholar]
- Zhao Z, Li X, Hao J, Winston JH, Weinman SA (2007) The ClC‐3 chloride transport protein traffics through the plasma membrane via interaction of an N‐terminal dileucine cluster with clathrin. J Biol Chem 282: 29022–29031 [DOI] [PubMed] [Google Scholar]
Associated Data
This section collects any data citations, data availability statements, or supplementary materials included in this article.
Supplementary Materials
Appendix
Expanded View Figures PDF
Review Process File
Source Data for Figure 1
Source Data for Figure 2
Source Data for Figure 3
Source Data for Figure 4
Source Data for Figure 5
Source Data for Figure 6