Abstract
Expression of inflammatory (interleukin-6 [IL-6]) and vascular homeostatic (angiopoietin-2 [AP-2], endothelin-1 [ET-1], endocan-2 [EC-2] biomarkers in pediatric traumatic brain injury (TBI) was examined in this prospective, observational cohort study of 28 children hospitalized with mild, moderate and severe TBI by clinical measures (age, sex, Glasgow Coma Scale score [GCS], Injury Severity Score [ISS], and cerebral autoregulation status). Biomarker patterns suggest an inverse relationship between GCS and AP-2, GCS and IL-6, ISS and ET-1, but a direct relationship between GCS and ET-1 and ISS and AP-2. Biomarker patterns suggest an inverse relationship between AP-2 and ET-1, AP-2 and EC-2, but a direct relationship between AP-2 and IL-6, IL-6 and EC-2, and IL-6 and ET-1. Plasma concentrations of inflammatory and vascular homeostatic biomarkers suggest a role for inflammation and disruption of vascular homeostasis during the first ten days across the severity spectrum of pediatric TBI. Although not statistically significant, without impact on cerebral autoregulation, biomarker patterns suggest a relationship between inflammation and alterations in vascular homeostasis. The large variation in biomarker levels within TBI severity and age groups, and by sex suggests other contributory factors to biomarker expression.
Keywords: angiopoietin-2, endocan-1, endothelin-1, interleukin-6, children, traumatic, brain injury, endothelium
Introduction
Traumatic brain injury (TBI) is a leading cause of death and disability and affects 47–280 of 100,000 children worldwide.(1) In the United States alone, an estimated 600,000 children under the age of 18 years are hospitalized, of whom 7600 die, and another 5000 are disabled each year.(2, 3) Poor outcomes after TBI are associated with initial injury, as well as secondary injury from inflammation and vascular dysregulation.(4) Secondary brain injury consists of processes that are initiated in response to hypoxia, ischemia, or excitotoxic injury to neurons and astroglial cells, and biomarkers in plasma and cerebrospinal fluid may allow us to study these complex cascades after pediatric TBI.(5–9) However, biomarker expression of vascular homeostatic or inflammatory processes is not well characterized in children with TBI.
Angiopoietin-2(AP-2) is a member of a family of vascular growth factors that plays a role in angiogenesis, and in controlling microvascular permeability, vasodilation, and vasoconstriction by signaling vascular smooth muscle cells.(10) Increase in AP-2 promotes inflammation, and changes in AP-2 occur during illnesses(11), (12) including after cerebral ischemia.(13, 14) Angiopoietin also modulates BBB breakdown and endothelial apoptosis,(15) and early phase of post-injury BBB breakdown is associated with a reduction in angiopoietin-1 and upregulation of AP-2.(15) However, patterns of expression after pediatric TBI have not been reported. Endothelin-1 (ET-1) is an endogenous vasoconstrictor peptide that plays a role in vascular homeostasis.(16–18) Endothelin-1 is implicated in developmental outcomes of very low birth weight newborns with hypoxic encephalopathy,(19) blast-induced TBI in rats,(20) delayed cerebral hypoperfusion after global ischemia,(21) and overexpression of ET-1 may contribute to dementia associated with ischemic stroke by exaggerating astrocyte-derived amyloid secretion, (22) but its role in pediatric TBI is unknown. Endocan-2 (EC-2), also known as endothelial cell-specific molecule-1 may play a role during neoangiogenesis, and levels of endocan are increased in the presence of pro-angiogenic growth factors such as vascular endothelial growth factor or fibroblast growth factor. While endocan has been studied in cancer and pre-eclampsia,(23, 24) there are no reports in TBI.
Cerebral inflammatory stimuli such as hypoxia and ischemic-reperfusion may stimulate biosynthesis of interleukins such as interleukin-6 (IL-6) in endothelium, glia, and leukocytes. Interleukins increase vascular permeability, modify the blood-brain barrier, and lead to leukocyte accumulation. Interleukin 6 activity has been implicated in preclinical and adult models of TBI (25),(26),(27) and may be expressed in the cerebrospinal fluid (4, 7, 28, 29) as well as the serum.(7, 30, 31) The expression of IL-6 in the serum may decrease at the end of one week after TBI (31), and may be associated with both, favorable (31) and unfavorable outcomes after pediatric TBI. (7)
Given prior work in preclinical models of TBI (32) as well as the paucity of such information in pediatric TBI, we sought to understand the plasma levels, patterns and relationships between inflammatory and vascular homeostatic biomarker expression in pediatric TBI.
Methods
Study center and data sources
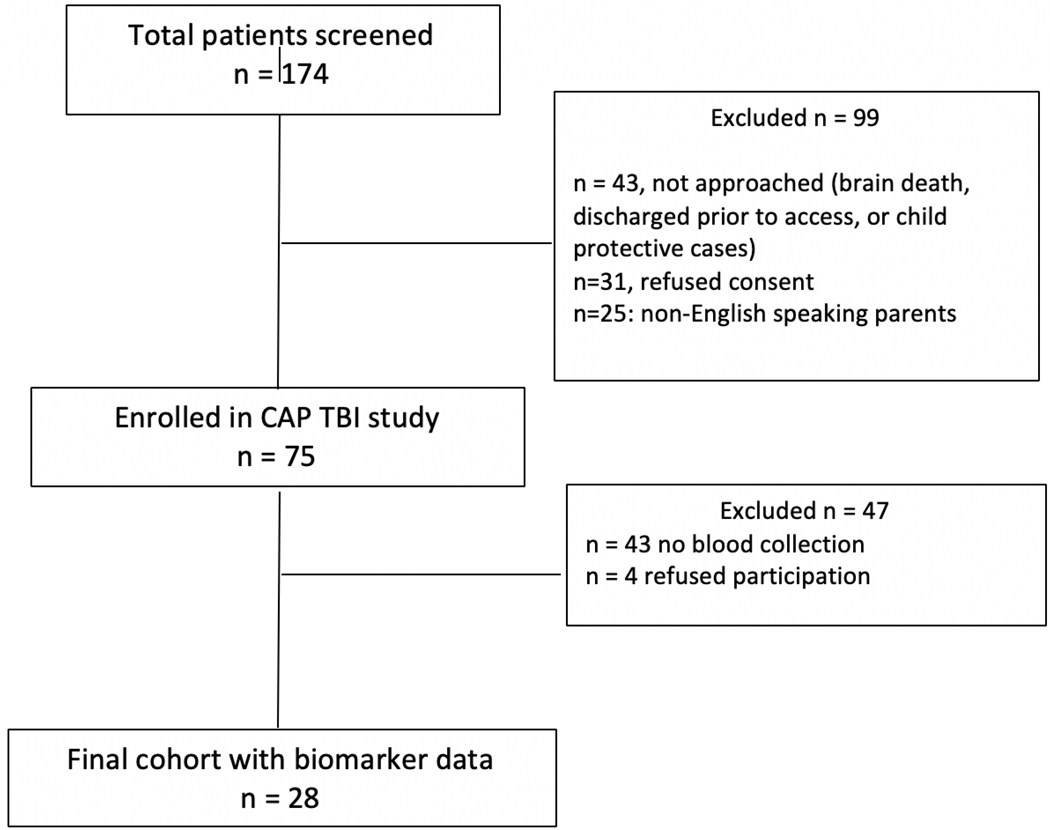
A prospective observational cohort study was performed between on a convenience sample at Harborview Medical Center, which is a level I pediatric trauma center. This study was conducted between September 2016 and September 2018. Only hospitalized children under 18 years with a history of trauma, with evidence of TBI on computerized tomography (CT) of the head were eligible for inclusion. Pregnant minors, children under child protective services, patients with ongoing cardiopulmonary resuscitation, or patients with brain death were excluded per suggestion of the Institutional Review Board and anticipated challenges with obtaining blood samples. Research coordinators screened admission logs daily for eligible subjects. Informed consent was obtained from the patient’s legally authorized representative, and assent was obtained from patients as appropriate, and as soon as possible from the time of hospital admission (Figure 1). Data from some patients in cohort presented in this study have been previously published.(33) The study was approved by the Institutional Review Board at the University of Washington.
Figure 1.
Flow Diagram for Patient Selection for Biomarker Assays after Pediatric Traumatic Brain Injury
Data collection
Biomarker assay
In tandem with venipuncture performed for clinical care, blood was collected for the study into 6 mL vacutainers (BD K2EDTA, 10.8 mg/tube, City, State) and after inverting ten times, it was immediately placed on ice. Blood samples were then centrifuged at 2380 RPM for 11 minutes within two hours of the draw. Plasma was removed from the tube after centrifugal fractionation and aliquoted into 0.5 mL cryovials and frozen at −80 C in a freezer for long-term storage. EMD Millipore’s MILLIPLEX MAP assays were used to quantify Endocan-1,(34) Angiopoietin-2, Endothelin-1,(35) and IL-6.(36) Plasma biomarker levels are expressed in pg/ml.
Clinical data
Demographic and clinical data were abstracted from the hospital electronic medical record. Admission head computerized tomography (CT) imaging reports were reviewed to classify radiographic characteristics of TBI (i.e., subdural hematoma, epidural hematoma, subarachnoid hemorrhage, intraparenchymal hemorrhage, cerebral edema, cerebral herniation, skull fracture, subgaleal hematoma, pneumocephalus or intraventricular hemorrhage).
TBI versus Other Pediatric Conditions
We reviewed published studies in pediatric TBI, other pediatric disease states, in healthy children and adolescents. Using PubMed, a search was conducted using the following search words: angiopoietin-2, endothelin-1, endocan-2, and interleukin-6. The search was restricted between 1975 and 2018, and to studies including patients between 0 and 18 years of age.
Statistical Analysis
Based on admission Glasgow Coma Score (GCS), TBI severity was categorized as mild (GCS 13–15), moderate (GCS 9–12), and severe (GCS 3–8). Patients were grouped by age: (1) 0–4 years, (2) 5–9 years, (3) 10–14 years, and (4) 15–18 years. Lesions on head CT were grouped as isolated and mixed (more than one lesion). Further, these were divided into extra-axial hemorrhage (SDH/ EDH), and intra-axial hemorrhage (SAH, IPH, IVH). Details on cerebral autoregulation testing on this cohort have been previously described (33). Patients who had TCDs were defined with impaired (ARI < 0.4) and normal cerebral autoregulation (ARI >=0.4).
Since data were not normally distributed, Wilcoxon rank-sum was used to examine the relationship between the four biomarkers (AP-2, ET-1, EC-2, IL-6), as well as relationship of each biomarker and a) TBI severity, b) age groups, c) head CT lesions, and 4) sex. Individual concentrations and patterns of the relationships between the four biomarkers were examined in relation to GCS and ISS and tested using the nonparametric Spearman’s (rho) rank correlation analysis. We examined biomarker concentrations by age group, and in comparison, to healthy controls, and specific disease types.
P-values < 0.05 were considered significant. Summary data and the relationship between biomarker levels and TBI characteristics are presented as n (%), median [IQR]. Multivariable linear regression was conducted to examine the impact of impaired autoregulation on levels of each of the four biomarkers, adjusting for TBI severity. Data are presented as coefficients with 95% confidence intervals. Analysis was conducted using Stata 13.1(College Station, TX).(37)
Results
Patient Characteristics
Table 1 summarizes demographics and illness severity of the 28 participants, who were 11[IQR: 5 – 15.5] years old, mostly male (64.3%), with ISS 25[IQR: 17 – 27 10], with median admission GCS 11[IQR: 6 – 15]. Upon hospital admission, 14 children had mild TBI, 3 children had moderate TBI, and 11 children had severe TBI. Overall, intensive care unit length of stay was 1.9[IQR: 1.1 – 5.6] days, hospital length of stay was 6.5[IQR: 1.7 – 11.5] days, discharge Glasgow Coma Score (GCS) was 15[IQR: 15 – 15]. Twenty (71.4%) patients were discharged home, 7(25%) patients were discharged to in-patient rehabilitation facility, and 1(3.6%) expired.
Table 1.
Characteristics of Children (n = 28) with Mild* (n =14), Moderate**(n=3) and Severe ***(n =11) Traumatic Brain Injury (TBI)
| Parameter | All Patients (n = 28) |
Mild TBI (n = 14) |
Moderate TBI (n =3) |
Severe TBI (n =11) |
|---|---|---|---|---|
| Age in years median [IQR] | 11[5, 15.5] | 12[9, 15] | 3[1, 7] | 11[5, 16] |
| Age groups | ||||
| 0–4 years | 6(21.4%) | 2(14.3%) | 2(66.7%) | 2(18.2%) |
| 5–9 years | 6(21.4%) | 2(14.3%) | 1(33.3%) | 3(27.3%) |
| 10–14 years | 8(28.6%) | 6(42.8%) | 0 | 2(18.2%) |
| 15–18 years | 8(28.6%) | 4(28.6%) | 0 | 4(36.3%) |
| Male | 18 (64.3%) | 9(64.3%) | 2(66.7%) | 7(63.7%) |
| Injury Severity Score (ISS), median [IQR] | 25[17, 27] | 17.5[11, 26] | 41[26, 41] | 21.5[17, 27] |
| Admission Glasgow Coma Score (GCS), median [IQR] | 13[6, 15] | 15[14, 15] | 9[9, 9] | 4.5[3, 6] |
| Mechanism of Injury | ||||
| Motor Vehicle crash | 10(35.7%) | 2(14.3%) | 1(33.3%) | 7(63.6%) |
| Fall | 10(35.7%) | 7(70%) | 0 | 3(30%) |
| Struck by or against | 6(21.4%) | 5(83.3%) | 0 | 1(16.7%) |
| Other | 2(7.1%) | 0 | 2(100%) | 0 |
| Intracranial Lesion on CT head | ||||
| Isolated Skull fracture Skull fracture + |
0 15(53.6%) |
9(64.3%) | 2(66.7%) | 4(36.4%) |
| Isolated Subgaleal hematoma Subgaleal hematoma + |
0 13(46.4%) |
6(42.9%) | 1(33.3%) | 6(53.6%) |
| Isolated Subdural hematoma Subdural hematoma + |
2(7.1%) 12(42.9%) |
1(7.1%) 8(57.1%) |
1(33.3%) 0 |
4(36.4%) |
| Isolated Subarachnoid hemorrhage Subarachnoid hemorrhage + |
0 12(42.9%) |
6(42.9%) | 0 | 6(54.6%) |
| Isolated Epidural hematoma Epidural hematoma + |
1(3.6%) 7(25%) |
4(28.6%) | 1(33.3%) | 1(9.1%) 2(18.2%) |
| Isolated Pneumocephalus Pneumocephalus + |
0 7(25%) |
3(21.4%) | 2(66.7%) | 2(18.2%) |
| Isolated Intraparenchymal hemorrhage Intraparenchymal hemorrhage + |
1(3.6%) 3(10.7%) |
1(7.1%) 2(14.3%) |
0 | 1(9.1%) |
| Isolated Cerebral edema Cerebral edema + |
0 4(14.3%) |
1(7.1%) | 0 | 3(27.3%) |
| Isolated Cerebral herniation Cerebral herniation + |
0 1(3.6%) |
0 | 0 | 1(9.1%) |
| Isolated Diffuse axonal injury Diffuse axonal injury + |
0 1(3.6%) |
0 | 0 | 1(9.1%) |
| Isolated Intraventricular hemorrhage Intraventricular hemorrhage + |
0 1(3.6%) |
0 | 0 | 1(9.1%) |
|
Intensive care unit length of stay, days, median [IQR] |
1.9[1.1, 5.6] | 1.6[1, 1.8] | 4.1[1, 5.8] | 4.6[2.1, 10.3] |
|
Hospital length of stay, days, median [IQR] |
6.5[1.7, 11.5] | 1.8[1, 5.5] | 8.7[7.1, 13] | 10.9[7.5, 16.1] |
| Discharge GCS, median [IQR] | 15[15, 15] | 14.5[15, 15] | 15[14, 15] | 15[12, 15] |
| Discharge disposition | ||||
| Home | 20(71.4%) | 14(100%) | 2(66.7%) | 4(36.4%) |
| In-patient Rehabilitation facility | 7(25%) | 0 | 1(33.3%) | 6(54.5%) |
| Death | 1(3.6%) | 0 | 0 | 1(9.1%) |
Abbreviations:
SD: standard deviation; IQR: interquartile range; CT: computerized tomography
Mild TBI: Admission GCS: 13–15,
Moderate TBI: Admission GCS: 9–12,
Severe TBI: Admission GCS: 3–8 + Indicates mixed lesion on CT
Participants underwent a total of 64 blood draws between hospital days 1 and 10 as follows: day 1 (n=7), day 2 (n=14), day 3 (n=13), day 4 (n=5), day 5 (n=10), day 6 (n=5), day 7 (n=3), day 8 (n= 4), day 9 (n= 2), and day 10 (n= 1). Seventeen children had repeat sampling between days 1 and 10.
Plasma Biomarker Levels
Overall, Initial and Temporal Trends
Table 2 shows that for the full cohort of children, median biomarker levels over the first 10 days were: AP-2 (2610.7; range 1282.36–10392.66pg/ml), ET-1 (92.97; range 25.86–502.5 pg/ml), EC-2 (2032.76; range 511.07–5625.63 pg/ml), and IL-6 (23.37; range 6.26–180.54 pg/ml).
Table 2.
Reference values for Plasma Biomarkers in Children (n = 28) with Traumatic Brain Injury
| Angiopoietin (AP-2) |
|---|
| AP-2 median(minimum-maximum) pg/ml | |||||
|---|---|---|---|---|---|
| Overall | Overall | Mild | Moderate | Severe | |
| n = 28 | n = 28 | n = 14 | n = 3 | n = 11 | |
| AP-2 | 2610.695(1282.355,10392.66) | 2409.44(1282.355,4555.11) | 2563.66(1488.87,4565.39) | 2998.84(1892.22,10392.66) | |
| Age groups | |||||
| 0–4 years | n=6 | 3157.425(2137.015,4654.32) | 3065.42(2379.65,3751.19) | 3564.525(2563.66,4565.39) | 3395.6675(2137.015,4654.32) |
| 5–9 years | n=6 | 1966.21(1488.87,2998.84) | 2420.55(1990.59,2850.51) | 1488.87(na) | 1941.83(1892.22,2998.84) |
| 10–14 years | n=8 | 1958.18(1282.355,2657.73) | 1674.505(1282.355,2439.23) | 0 | 2456.13(2254.53,2657.73) |
| 15–18 years | n=8 | 4137.63(2899.59,10392.66) | 4137.63(2899.59,4555.11) | 0 | 5656.055(3382.03,10392.66) |
| Sex (male) | |||||
| Female | n=10 | 2103.372(1478.58,3382.03) | 1990.59(1478.58,2439.23) | 2563.66(na) | 2195.773(1941.83,3382.03) |
| Male | n=18 | 3286.425(1282.355,10392.66) | 2899.59(1282.355,4555.11) | 3027.13(1488.87,4565.39) | 3574.01(1892.22,10392.66) |
| Abnormalities on CT head | |||||
| Subdural hematoma (SDH) n =14 |
Isolated n = 2 Mixed n = 12 |
2501.445(2439.23,2563.66) 3300.85(1478.58,10392.66) |
2439.23(na) 3300.85(1478.58,4555.11) |
2563.66(na) 0 |
0 4937.557(,10392.66) |
| Epidural hematoma (EDH) n = 8 |
Isolated n = 1 Mixed n = 7 |
3574.01(na) 2137.015(1502.38,4565.39) |
0 2030.16(1502.38,4421.58) |
0 4565.39(na) |
3574.01(na) 2397.372(2137.015,2657.73) |
| Subarachnoid hemorrhage (SAH) n = 12 |
Isolated n = 0 Mixed n = 12 |
0 3190.435(1502.38,10392.66) |
0 3352.095(1502.38,4555.11) |
0 0 |
0 3190.435(2137.015,10392.66) |
| Intraparenchymal hemorrhage (IPH) n = 4 |
Isolated n =1 Mixed n = 3 |
1282.355(na) 4421.58(2998.84,4555.11) |
1282.355(na) 4488.345(4421.58,4555.11) |
0 0 |
0 2998.84(na) |
| Cerebral edema n = 4 |
Isolated n = 0 Mixed n = 4 |
0 3140.81(1892.22,10392.66) |
0 2899.59(na) |
0 0 |
0 3382.03(1892.22,10392.66) |
| Cerebral herniation n = 1 |
Isolated n = 0 Mixed n = 1 |
0 1892.22(na) |
0 0 |
0 0 |
0 1892.22(na) |
| Diffuse axonal injury n =1 |
isolated n=1 Mixed n = 0 |
2254.53(na) 0 |
0 0 |
0 0 |
2254.53(na) 0 |
| Skull fracture n = 15 |
Isolated n = 0 Mixed n=15 |
0 2137.015(1478.58,10392.66) |
0 2069.73(1478.58,4421.58) |
0 3027.13(1488.87,4565.39) |
0 2567.9275(1941.83,10392.66) |
| Subgaleal hematoma n = 13 |
Isolated n = 0 Mixed n=13 |
0 2850.51(1478.58,10392.66) |
0 2224.69(1478.58,2899.59) |
0 4565.39(na) |
0 4018.175(1941.83,10392.66) |
| Pneumocephalus n = 7 |
Isolated n = 0 Mixed n=7 |
0 2069.73(1478.58,10392.66) |
0 1846.63(1478.58,2069.73) |
0 3027.13(1488.87,4565.39) |
0 6695.75(2998.84,10392.66) |
| Intraventricular hemorrhage (IVH) n = 1 |
Isolated n = 0 Mixed n=1 |
0 7738.1(na) |
0 0 |
0 0 |
0 7738.1(na) |
| Endothelin-1(ET-1) |
|---|
| Endohelin-1 median(minimum-maximum) pg/ml | |||||
|---|---|---|---|---|---|
| Overall | Overall | Mild | Moderate | Severe | |
| n = 28 | n = 28 | n = 14 | n = 3 | n = 11 | |
| ET-1 | 92.9675(25.86,502.5) | 91.945(31.3115,502.5) | 87.72(49.34,105.68) | 94.565(25.86,126.23) | |
| Age groups | |||||
| 0–4 years | n=6 | 101.265(49.34,261.12) | 157.0125(52.905,261.12) | 77.51(49.34,105.68) | 101.265(97.81,104.72) |
| 5–9 years | n=6 | 100.3275(87.72,502.5) | 304.295(106.09,502.5) | 87.72(na) | 94.565(91.37,126.23) |
| 10–14 years | n=8 | 97.075(31.3115,176.35) | 73.58(31.3115,176.35) | 0 | 103.52(98.37,108.67) |
| 15–18 years | n=8 | 70.905(25.86,132.55) | 85.175(68.08,132.55) | 0 | 63.895(25.86,73.73) |
| Sex (male) | |||||
| Female | n=10 | 96.795(41.745,502.5) | 95.78(41.745,502.5) | 49.34(na) | 98.09(60.64,126.23) |
| Male | n=18 | 89.74(25.86,261.12) | 88.11(31.3115,261.12) | 96.7(87.72,105.68) | 91.37(25.86,108.67) |
| Abnormalities on CT head | |||||
| SDH n =14 |
Isolated n = 2 Mixed n = 12 |
72.56(49.34,95.78) 90.025(51.38,261.12) |
95.78(na) 94.165(51.38,261.12) |
49.34(na) 0 |
0 85.77(67.15,126.23) |
| EDH n = 8 |
Isolated n = 1 Mixed n = 7 |
25.86(na) 105.68(41.745,502.5) |
0 91.965(41.745,502.5) |
0 105.68(na) |
25.86(na) 103.24(97.81,108.67) |
| SAH n = 12 |
Isolated n = 0 Mixed n = 12 |
0 94.59(51.38,132.55) |
0 94.165(51.38,132.55) |
0 0 |
0 94.59(60.64,108.67) |
| IPH n = 4 |
Isolated n =1 Mixed n = 3 |
31.3115(na) 91.37(82.24,132.55) |
31.3115(na) 107.395(82.24,132.55) |
0 0 |
0 91.37(na) |
| Cerebral edema n = 4 |
Isolated n = 0 Mixed n = 4 |
0 80.92(60.64,94.565) |
0 88.11(na) |
0 0 |
0 73.73(60.64,94.565) |
| Cerebral herniation n = 1 |
Isolated n = 0 Mixed n = 1 |
0 94.565(na) |
0 0 |
0 0 |
0 94.565(na) |
| Diffuse axonal injury n =1 |
isolated n=1 Mixed n = 0 |
98.37(na) 0 |
0 0 |
0 0 |
98.37(na) 0 |
| Skull fracture n = 15 |
Isolated n = 0 Mixed n=15 |
0 97.81(41.745,502.5) |
0 106.09(41.745,502.5) |
0 96.7(87.72,105.68) |
0 94.59(73.73,126.23) |
| Subgaleal hematoma n = 13 |
Isolated n = 0 Mixed n=13 |
0 97.81(41.745,261.12) |
0 97.1(41.745,261.12) |
0 105.68(na) |
0 85.77(60.64,126.23) |
| Pneumocephalus n = 7 |
Isolated n = 0 Mixed n=7 |
0 91.37(41.745,176.35) |
0 122.63(41.745,176.35) |
0 96.7(87.72,105.68) |
0 82.55(73.73,91.37) |
| IVH n = 1 |
Isolated n = 0 Mixed n=1 |
0 67.15(na) |
0 0 |
0 0 |
0 67.15(na) |
| Endocan (EC-2) |
|---|
| EC-2 median(minimum-maximum) pg/ml | |||||
|---|---|---|---|---|---|
| Overall | Overall | Mild | Moderate | Severe | |
| n = 28 | n = 28 | n = 14 | n = 3 | n = 11 | |
| EC-2 | 2032.755(511.07,5625.625) | 2072.01(511.07,2573.95) | 1500.41(1024.84,2125.91) | 2011.74(528.79,5625.625) | |
| Age groups | |||||
| 0–4 years | n=6 | 1136.685(511.07,2200.9) | 1355.985(511.07,2200.9) | 1575.375(1024.84,2125.91) | 1136.685(1032.58,1240.79) |
| 5–9 years | n=6 | 1172.355(528.79,2490.365) | 1172.355(976.28,1368.43) | 1500.41(na) | 919.06(528.79,2490.365) |
| 10–14 years | n=8 | 1998.91(978.53,2573.95) | 2019.925(978.53,2573.95) | 0 | 1664.295(1316.85,2011.74) |
| 15–18 years | n=8 | 2389.375(2090.25,5625.625) | 2175.815(2090.25,2305.86) | 0 | 2891.0825(2472.89,5625.625) |
| Sex (male) | |||||
| Female | n=10 | 1852.568(978.53,2490.365) | 1719.055(978.53,2278.45) | 2125.91(na) | 1894.87(1032.58,2490.365) |
| Male | n=18 | 2072.01(511.07,5625.625) | 2095.89(511.07,2573.95) | 1262.625(1024.84,1500.41) | 2011.74(528.79,5625.625) |
| Abnormalities on CT head | |||||
| SDH n =14 |
Isolated n = 2 Mixed n = 12 |
2055.995(1986.08,2125.91) 2148.395(511.07,3272.335) |
1986.08(na) 2093.07(511.07,2278.45) |
2125.91(na) 0 |
0 2500.0975(1032.58,3272.335) |
| EDH n = 8 |
Isolated n = 1 Mixed n = 7 |
5625.625(na) 1719.055(1024.84,2278.45) |
0 1987.3975(1368.43,2278.45) |
0 1024.84(na) |
5625.625(na) 1522.16(1032.58,2011.74) |
| SAH n = 12 |
Isolated n = 0 Mixed n = 12 |
0 2072.01(528.79,3272.335) |
0 2093.07(976.28,2278.45) |
0 0 |
0 1626.265(528.79,3272.335) |
| IPH n = 4 |
Isolated n =1 Mixed n = 3 |
2573.95(na) 2095.89(528.79,2255.74) |
2573.95(na) 2175.815(2095.89,2255.74) |
0 0 |
0 528.79(na) |
| Cerebral edema n = 4 |
Isolated n = 0 Mixed n = 4 |
0 2389.375(919.06,3272.335) |
0 2305.86(na) |
0 0 |
0 2472.89(919.06,3272.335) |
| Cerebral herniation n = 1 |
Isolated n = 0 Mixed n = 1 |
0 919.06(na) |
0 0 |
0 0 |
0 919.06(na) |
| Diffuse axonal injury n =1 |
isolated n=1 Mixed n = 0 |
1316.85(na) 0 |
0 0 |
0 0 |
1316.85(na) 0 |
| Skull fracture n = 15 |
Isolated n = 0 Mixed n=15 |
0 1719.055(528.79,3272.335) |
0 2053.77(976.28,2278.45) |
0 1262.625(1024.84,1500.41) |
0 1761.4725(528.79,3272.335) |
| Subgaleal hematoma n = 13 |
Isolated n = 0 Mixed n=13 |
0 1719.055(511.07,3272.335) |
0 1348.7925(511.07,2305.86) |
0 1024.84(na) |
0 2481.6275(1032.58,3272.335) |
| Pneumocephalus n = 7 |
Isolated n = 0 Mixed n=7 |
0 1500.41(528.79,3272.335) |
0 1719.055(978.53,2053.77) |
0 1262.625(1024.84,1500.41) |
0 1900.5625(528.79,3272.335) |
| IVH n = 1 |
Isolated n = 0 Mixed n=1 |
0 2509.83(na) |
0 0 |
0 0 |
0 2509.83(na) |
| Interleukin-6 (IL-6) |
|---|
| IL-6 median(minimum-maximum) pg/ml | ||||||
|---|---|---|---|---|---|---|
| Overall | Overall | Mild | Moderate | Severe | ||
| n = 28 | n = 28 | n = 14 | n = 3 | n = 11 | ||
| IL-6 | 23.3675(6.26,180.54) | 23.825(6.26,92.12) | 19.42(10.96,22.02) | 32.1(11.32,180.54) | ||
| Age groups | ||||||
| 0–4 years | n=6 | 31.07(10.96,95.17) | 65.0275(37.935,92.12) | 15.19(10.96,19.42) | 59.6875(24.205,95.17) | |
| 5–9 years | n=6 | 20.6275(15.68,32.1) | 20.84(19.15,22.53) | 22.02(na) | 19.235(15.68,32.1) | |
| 10–14 years | n=8 | 13.895(6.26,37.645) | 10.32(6.26,31.47) | 0 | 29.1775(20.71,37.645) | |
| 15–18 years | n=8 | 36.395(11.32,180.54) | 28.105(25.12,43.84) | 0 | 85.81(11.32,180.54) | |
| Sex (male) | ||||||
| Female | n=10 | 19.1925(6.26,97.09) | 11.71(6.26,31.47) | 10.96(na) | 57.94(19.235,97.09) | |
| Male | n=18 | 26.19(7.65,180.54) | 27.26(7.65,92.12) | 20.72(19.42,22.02) | 32.1(11.32,180.54) | |
| Abnormalities on CT head | ||||||
| SDH n =14 |
Isolated n = 2 Mixed n = 12 |
9.945(8.93,10.96) 30.21(11.32,95.17) |
8.93(na) 30.21(11.71,92.12) |
10.96(na) 0 |
0 46.88(11.32,95.17) |
|
| EDH n = 8 |
Isolated n = 1 Mixed n = 7 |
180.54(na) 19.42(6.26,95.17) |
0 15.43(6.26,25.12) |
0 19.42(na) |
180.54(na) 66.408(37.645,95.17) |
|
| SAH n = 12 |
Isolated n = 0 Mixed n = 12 |
0 27.035(11.71,97.09) |
0 23.825(11.71,43.84) |
0 0 |
0 56.09(15.68,97.09) |
|
| IPH n = 4 |
Isolated n =1 Mixed n = 3 |
7.65(na) 25.12(15.68,43.84) |
7.65(na) 34.48(25.12,43.84) |
0 0 |
0 15.68(na) |
|
| Cerebral edema n = 4 |
Isolated n = 0 Mixed n = 4 |
0 53.315(27.26,97.09) |
0 27.26(na) |
0 0 |
0 74.53(32.1,97.09) |
|
| Cerebral herniation n = 1 |
Isolated n = 0 Mixed n = 1 |
0 32.1 (na) |
0 0 |
0 0 |
0 32.1 (na) |
|
| Diffuse axonal injury n =1 |
isolated n=1 Mixed n = 0 |
20.71(na) 0 |
0 0 |
0 0 |
20.71(na) 0 |
|
| Skull fracture n = 15 |
Isolated n = 0 Mixed n=15 |
0 22.02(6.26,95.17) |
0 22.53(6.26,37.935) |
0 20.72(19.42,22.02) |
0 46.8825(15.68,95.17) |
|
| Subgaleal hematoma n = 13 |
Isolated n = 0 Mixed n=13 |
0 24.205(6.26,97.09) |
0 24.895(6.26,92.12) |
0 19.42(na) |
0 49.3675(11.32,97.09) |
|
| Pneumocephalus n = 7 |
Isolated n = 0 Mixed n=7 |
0 19.42(6.26,74.53) |
0 16.08(6.26,31.47) |
0 20.72(19.42,22.02) |
0 45.105(15.68,74.53) |
|
| IVH n = 1 |
Isolated n = 0 Mixed n=1 |
0 11.32(na) |
0 0 |
0 0 |
0 11.32(na) |
|
Median (minimum – maximum) level calculated for each biomarker
Median (minimum – maximum) level calculated separately for isolated or mixed lesion on CT (na) indicates only one case included in analysis
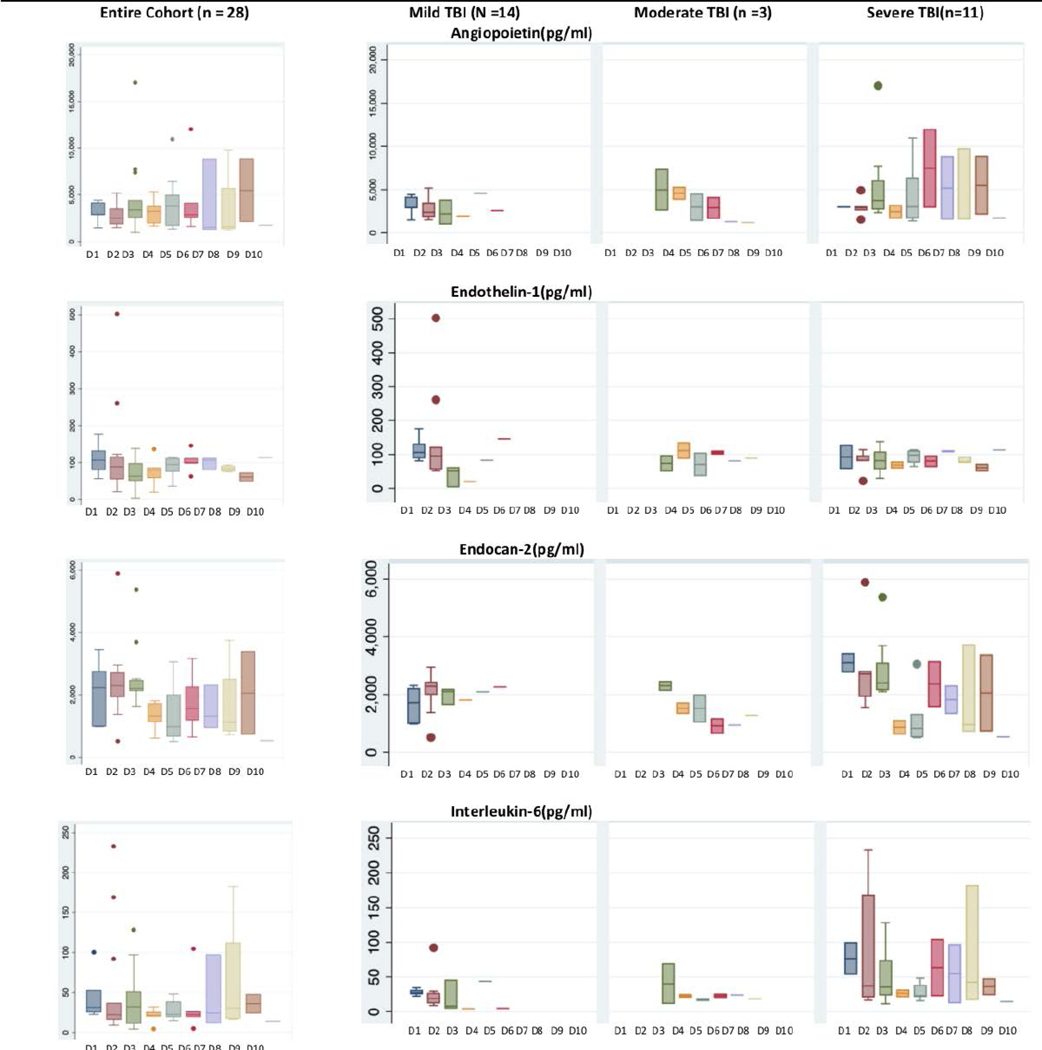
Although there were no statistically significant differences in biomarker expression either between day 1-day 3 vs. day 4-day 10 or between day 1-day 7 vs. day 8-day 10, Figure 2 suggests that compared to mild and moderate TBI, patients with severe TBI have higher levels of AP-2, IL-6, and EC-2 through day 10 after admission.
Figure 2.
Patterns of Plasma Biomarker Expression in 28 Children by Day of Admission by Severity of Traumatic Brain Injury and by Day of Admission Mild TBI: Admission GCS 13–15, Moderate TBI: Admission GCS: 9–12, Severe TBI: Admission GCS: 3–8 D1 = Admission day one, D10 = Admission day ten Data suggest that compared to mild and moderate TBI, patients with severe TBI have higher levels of AP-2, IL-6, and EC-2 through day 10 after admission
Patterns in Biomarker Expression
Clinical Characteristics and Biomarker Expression
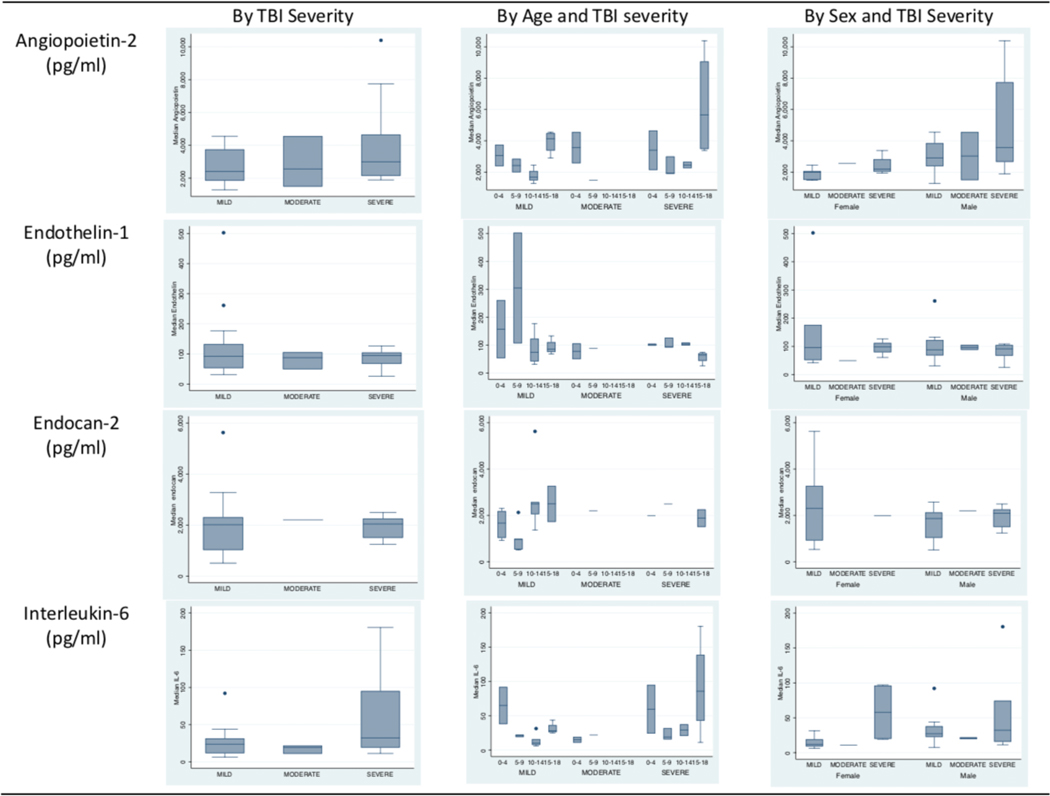
Biomarker levels were comparable across the TBI severity spectrum (Figure 3) across all four biomarkers. Table 2 shows large variation in median AP-2, median ET-1, median EC-2 and median IL-6 levels within TBI severity groups and no significant difference byTBI severity (Figure 3).
Figure 3.
Patterns of Plasma Biomarkers in 28 Children by and Traumatic Brain Injury (TBI) Severity, Age, and Sex Mild TBI: Admission Glasgow Coma Score (GCS): 13 −15, n = 11, Moderate TBI: Admission GCS: 9–12, n = 3, Severe TBI: Admission GCS: 3–8, n = 14 Age groups 0–4 years, 5–9 years, 10–14 years and 15–18 years Median biomarker levels did not vary significantly by TBI severity, age group, or sex
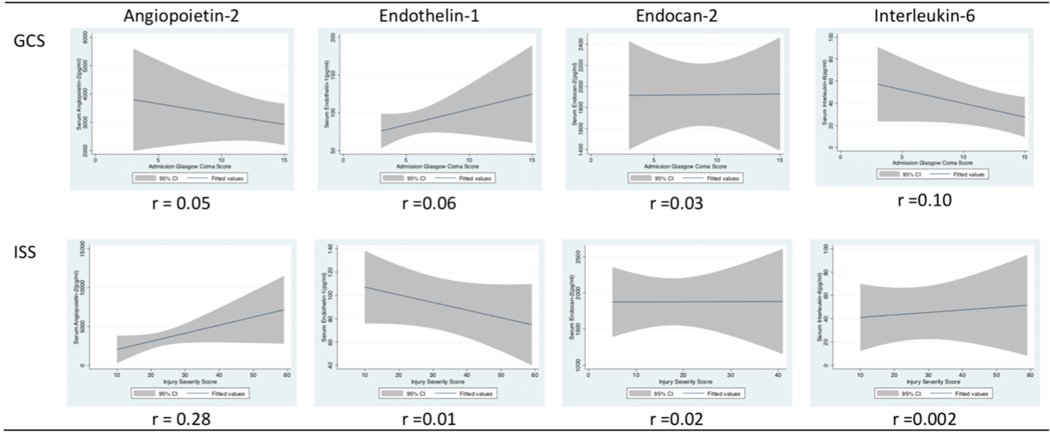
Median biomarker levels did not vary significantly by TBI severity, age group, or sex; (Figure 3, and Table 2) However, biomarker patterns suggest an inverse relationship between GCS and AP-2, GCS and IL-6, ISS and ET-1, but a direct relationship between GCS and ET-1 and ISS and AP-2. (Figure 4). However, none of these relationships were statistically significant.
Figure 4.
Patterns of Plasma Biomarkers in 28 Children with Traumatic Brain Injury (TBI) by Glasgow Coma Score (GCS) and Injury Severity Score (ISS) Biomarker patterns suggest an inverse relationship between GCS and AP-2, GCS and IL-6, ISS and ET-1, but a direct relationship between GCS and ET-1 and ISS and AP-2.
Biomarker Levels and CT lesions
Five (18%) patients had isolated lesion on CT: subdural hematoma (n = 2), epidural hematoma (n = 1), intraparenchymal hemorrhage (n =1), and diffuse axonal injury (n = 1). Seventeen patients had extra-axial hemorrhage while nine patients had extra and intra-axial hemorrhage. Levels of AP-2, ET-1, EC-2, and IL-6 associated with isolated and mixed CT lesions are presented in Table 2. There was no difference in biomarker levels by head CT lesion type.
Relationship between Plasma Biomarkers
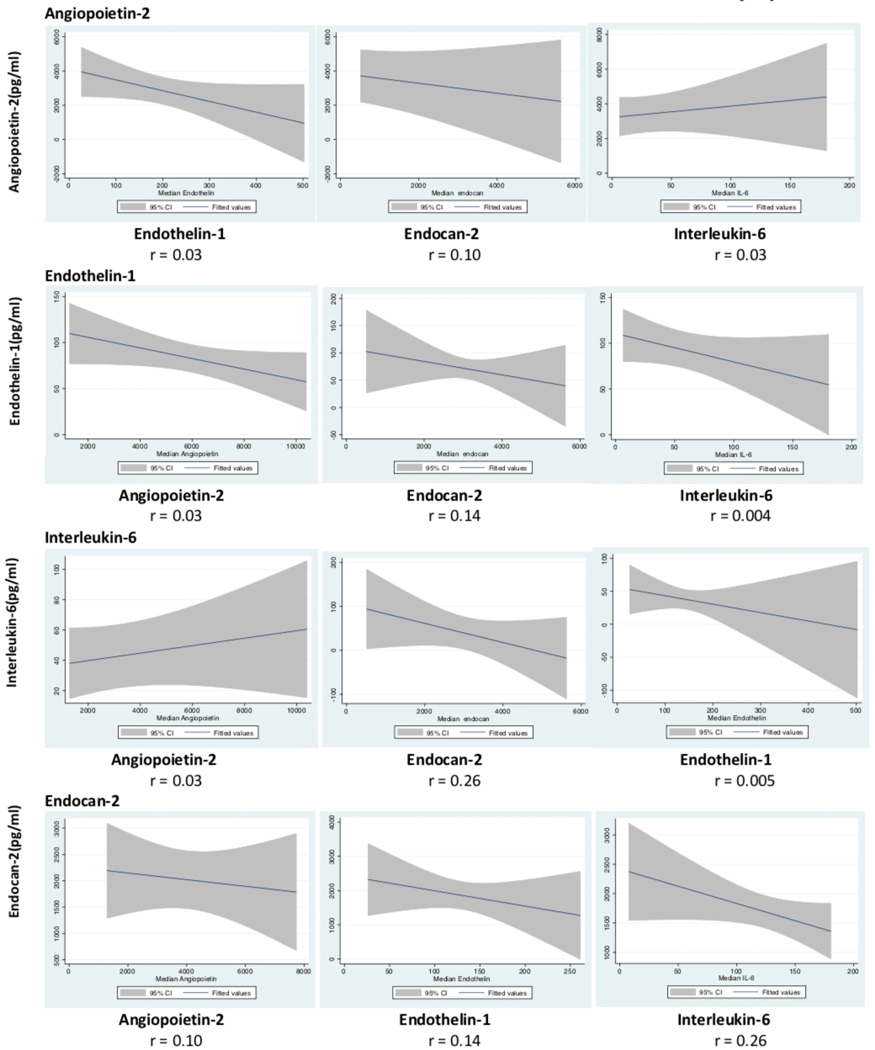
Biomarker patterns suggest an inverse relationship between AP-2 and ET-1, AP-2 and EC-2, but a direct relationship between AP-2 and IL-6, IL-6 and EC-2, and IL-6 and ET-1(Figure 5).
Figure 5.
The Interplay between Plasma Angiopoietin-2, Endothelin-1, Endocan-2 and Interleukin-6 Notes: Weighted by TBI Severity Biomarker patterns suggest an inverse relationship between AP −2 and ET-1, AP-2 and EC-2, but a direct relationship between AP-2 and IL-6, IL-6 and EC-2, and IL-6 and ET-1.
Association between Plasma Biomarkers and Cerebral autoregulation
As shown in Table 3, after adjusting for TBI severity, we found no statistically significant association between biomarker expression and cerebral autoregulation status.
Table 3.
Association between Plasma Biomarkers and Cerebral autoregulation in Hospitalized Children (n = 25) with Traumatic Brain Injury
| Angiopoietin-2* | Endothelin-1* | Endocan-2* | Interleukin-6* | |||||
|---|---|---|---|---|---|---|---|---|
| Coefficient | 95% CI | Coefficient | 95% CI | Coefficient | 95% CI | Coefficient | 95% CI | |
| Cerebral autoregulation | ||||||||
| Normal | Reference | Reference | Reference | Reference | ||||
| Impaired | 350.63 | (−1498.11, 2199.38) | −31.02 | (−118.62, 56.57) | −316.66 | (−1304.84, 671.51) | −13.29 | (−48.98, 22.39) |
| TBI severity | ||||||||
| Mild | Reference | Reference | Reference | Reference | ||||
| Moderate | −950.67 | (−5407.32, 3505.99) | −58.42 | (−269.59, 152.75) | −413.99 | (−2796.14, 1968.14) | −10.02 | (−96.04, 75.99) |
| Severe | 1271.21 | (−577.53, 3119.95) | −37.29 | (−124.89, 50.3) | 445.06 | (−543.12, 1433.24) | 32.92 | (−2.76, 68.6) |
Values expressed as pg/ml
Comparison of Biomarker Expression to Other Conditions:
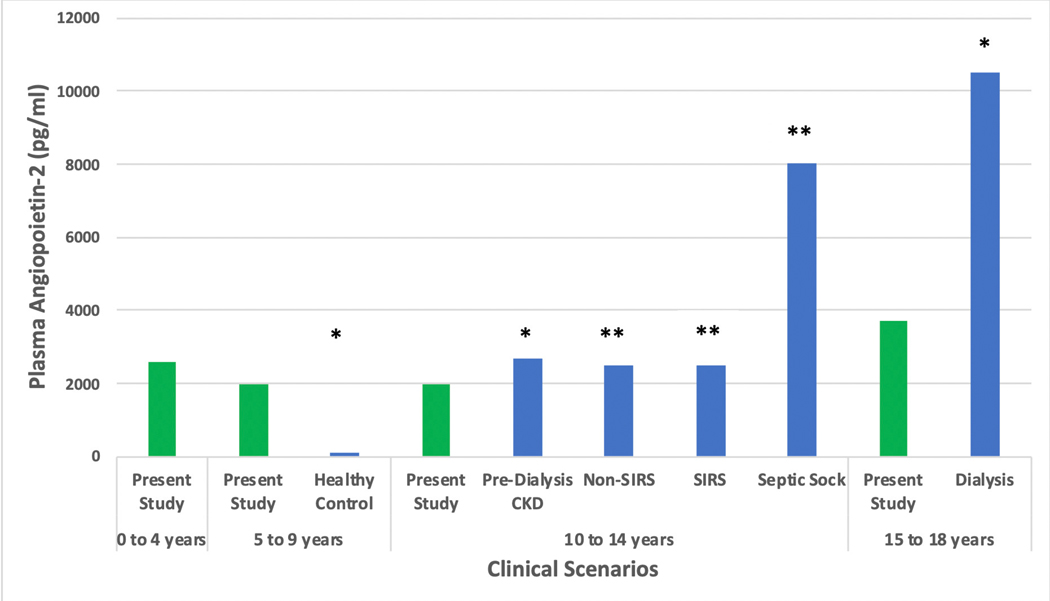
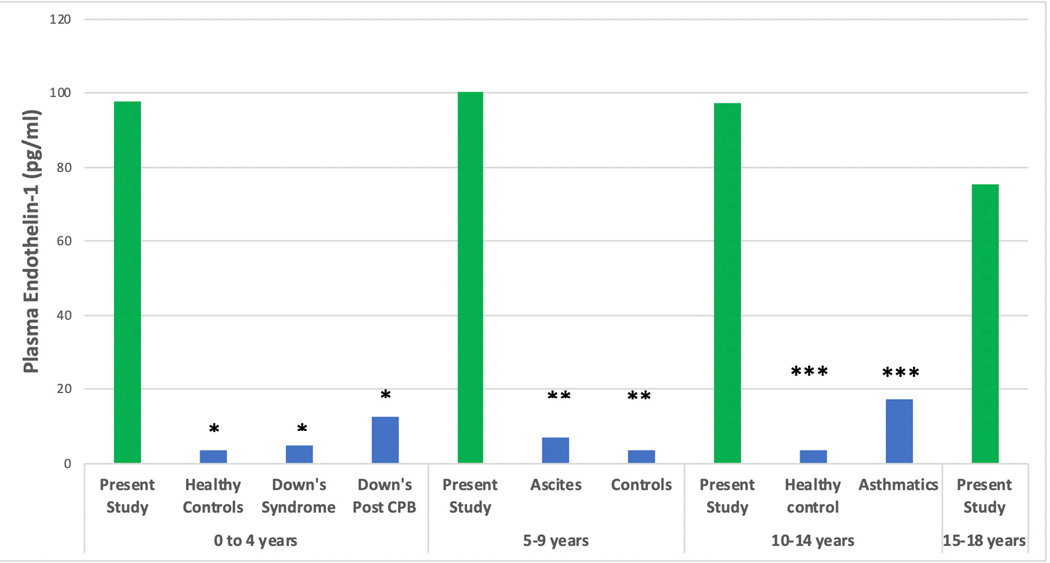
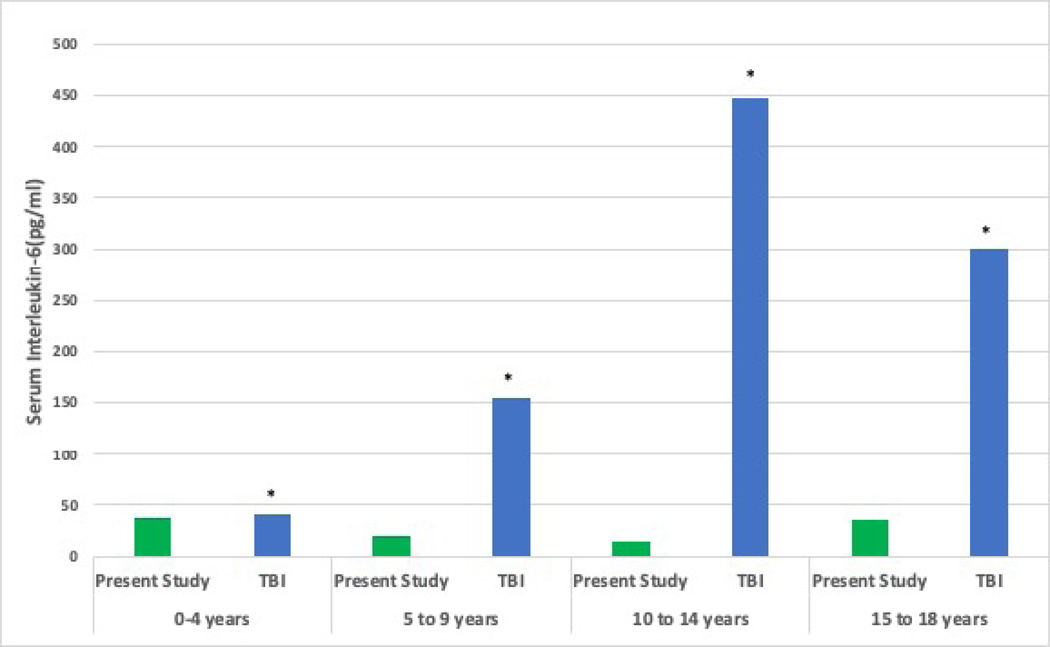
Figure 6 shows an overlap between AP-2, ET-1 and IL-6 biomarker levels and published data from non-TBI cohorts and age-matched controls. No reports of EC-2 levels were found.
Figure 6.
Comparison of Median Plasma Biomarker Levels with Prior Work in Traumatic Brain Injury (TBI) and non-TBI cohorts a Plasma Angiopoietin-2 Comparison studies * 2013, PLoS One. 2013;8(2): e56273. ** 2007, Shock. Dec; 28(6): 650–654 Notes: CKD: chronic kidney disease, SIRS: systemic inflammatory response syndrome b Plasma Endothelin-1 Comparison studies * 2007, Paediatr Anaesth 17(11): 1071–1077. ** 2002, J Pediatr Gastroenterol Nutr 35(2): 149–153. *** 2002, Ann Allergy Asthma Immunol 88(4): 370–373. Notes: CPB: cardiopulmonary bypass c Plasma Interleukin-6 Comparison study: * 2005, Childs Nerv Syst 21(3): 185–193; discussion 194. TBI: traumatic brain injury In the present study, number of patients per age group were; 0–4 years: n=6, 5–9 years: n=6, 10–14 years: n=8, 15–19 years: n =8.
Discussion
The purpose of this preliminary study was to explore the expression of inflammatory and vascular homeostatic plasma biomarkers in children hospitalized with TBI. While IL-6 has been studied to a limited extent, this is the first study to report on AP-2, ET-1, and EC-2, and to examine the levels, patterns, and the interplay between these biomarkers in pediatric TBI. Our findings are that: (1) Although not statistically significant, levels of inflammatory and vascular homeostatic biomarker expression suggests abnormalities in inflammation and vascular homeostasis during the first 10 days related to TBI severity, (2) Patterns of biomarker expression suggest an interplay between inflammation and vascular homeostasis, (3) The variation in biomarker levels within TBI severity, age, and by sex suggests other contributory factors to biomarker expression, and (4) There is no relationship between biomarker expression and cerebral autoregulation status.
Broadly, biomarkers relevant to TBI can be categorized as related to inflammatory(interleukins, marinobufagenin), traumatic neuronal/ axonal (tau protein, neurofilaments, neuron-specific enolase[NSE], glial fibrillary acid protein[GFAP]), myelin basic protein[MBP], ubiquitin carboxyl-terminal hydrolase isoenzyme L1[UCHL1]), spectrin breakdown products, neutrophil gelatinase-associated lipocalin (NGAL), blood-brain barrier integrity (angiopoietin-1, angiopoietin-2,(15) cerebrospinal fluid/ plasma albumin ratio, tight junction proteins, NSE, S100B, GPAP), and genetic biomarkers such as apolipoprotein-E [APO-E], and brain-derived neurotrophic factor [BDNF].(9)
We targeted the four biomarkers to examine inflammatory and vascular homeostatic pathways because of prior work showing alterations in these pathways and because these complex secondary TBI pathways may be related and or differentially expressed in pediatric TBI. Results from this study imply that EC-2 may not be expressed and be as representative of vascular homeostatic processes as perhaps AP-2, and ET-1 but these results need to be further confirmed.
Although not statistically significant, this study suggests that compared to mild TBI, there may be greater upregulation of inflammation and vascular homeostatic processes in severe TBI. A prior study on children with TBI by Chiaretti et.al. reported increases in plasma IL-6 levels with worsening TBI severity.(7) The pattern similarities between AP-2 and IL-6 suggests that both inflammation and blood-brain-barrier breakdown occurs with worsening TBI severity, and AP-2 may be considered as a surrogate marker of injury severity, similar to previous studies reporting higher levels of AP-2 in septic shock compared to sepsis,(38, 39) and as reported with IL-6.(4) Present results imply that AP-2 and IL-6 may also be surrogate markers of pediatric TBI severity, but this will require confirmation in larger cohort of children with pediatric TBI. Despite the lack of significance, the present study is the first to report on the relationship between AP-2, ET-1, EC-2 by and across TBI severity.
Results of this study suggest no relationship between levels of AP-2 and IL-6 with TBI severity, age, and sex. However, age-related increases in NSE, S100B, and MBP have been described previously,(40) and we cannot exclude age-dependent increase in biomarker levels due to an age-dependent increase in blood-brain barrier permeability. Prior work by van Engelen et.al. examining S100B, NSE, and MBP in a study of 79 specimens of CSF showed no sex differences in TBI, (40) and there is no study examining the relationship with IL-6.(7) Present results suggest that interpretation of plasma biomarker data in pediatric TBI may be incomplete without knowledge of age, and sex of the population studied. Since clinical outcomes after pediatric TBI may be influenced by age and sex,(41) future studies should validate our findings in a larger population of children with TBI that includes sufficient numbers of males, females and age groups. We speculate that inflammatory and vascular homeostatic processes extend beyond the initial critical period after severe pediatric TBI (i.e. the first 72 hours), implying that these children may continue to remain at high risk for secondary brain insults from these processes beyond the first week after injury
Mechanistically, IL-6 is an inflammatory biomarker, and AP-2 and ET-1 are markers of blood-brain-barrier breakdown(15) and endothelial dysfunction,(12) respectively. Thus, the interplay between these biomarkers deserves some discussion. Whether the biomarkers follow direct or inverse relationships, and whether and how they interact to impact cerebral autoregulation is unknown. Future work is needed to confirm these biomarker relationships and effects.
Limitations
This preliminary study has some limitations. Although we examined biomarker expression across the TBI severity spectrum for initial assessment, we did not collect data from age-matched healthy controls. Due to the small sample size, our data are primarily descriptive, and although children in the moderate TBI group are very few, we felt it important to present biomarker levels for this group of patients separately. Despite these limitations, we provide new data on patterns of plasma biomarker expression reflecting inflammation and vascular homeostasis in children hospitalized with TBI.
Conclusions
Plasma concentrations of inflammatory and vascular homeostatic biomarkers suggest a role for inflammation and disruption of vascular homeostasis during the first 10 days across the severity spectrum of pediatric TBI. Although not statistically significant, and without impact on cerebral autoregulation, biomarker patterns suggest a relationship between inflammation and alterations in vascular homeostasis. The large variation in biomarker levels within TBI severity and age groups, and by sex suggests other contributory factors to biomarker expression.
Acknowledgments
This study was conducted at Harborview Medical Center
Funding mechanism: National Institutes of Neurological Diseases and Stroke (R21NS095321-02: Vavilala)
Footnotes
The authors report no conflict of interest relevant to this study
Contributor Information
Abhijit V. Lele, Department of Anesthesiology and Pain Medicine, Harborview Injury Prevention and Research Center, Harborview Medical Center, Seattle, WA
Bhunyawee Alunpipatthanachai, Department of Anesthesiology and Pain Medicine, Harborview Injury Prevention and Research Center, University of Washington, Seattle, WA
Qian Qiu, Department of Pediatrics, Harborview Injury Prevention and Research Center, Harborview Medical Center, Seattle, WA.
Crystalyn Clark Bell, Research Coordinator, Department of Anesthesiology and Pain Medicine, University of Washington, Seattle, WA
Arraya Watanitanon, Department of Anesthesiology and Pain Medicine, Harborview Injury Prevention and Research Center, Seattle, WA
Anne Moore, Department of Neurological Surgery, Harborview Medical Center, Seattle, WA
Randall M. Chesnut, Department of Neurological Surgery and Orthopedics, Harborview Medical Center, Seattle, WA
William Armstead, Research Professor of Anesthesiology and Critical Care, University of Pennsylvania, Philadelphia, PA
Monica S. Vavilala, Department of Anesthesiology and Pain Medicine and Pediatrics, Harborview Injury Prevention and Research Center, Harborview Medical Center, Seattle, WA
References
- 1.Dewan MC, Mummareddy N, Wellons JC 3rd, Bonfield CM. Epidemiology of Global Pediatric Traumatic Brain Injury: Qualitative Review. World Neurosurg. 2016;91:497–509 e1. [DOI] [PubMed] [Google Scholar]
- 2.Stanley RM, Bonsu BK, Zhao W, Ehrlich PF, Rogers AJ, Xiang H. US estimates of hospitalized children with severe traumatic brain injury: implications for clinical trials. Pediatrics. 2012;129(1):e24–30. [DOI] [PubMed] [Google Scholar]
- 3.Schneier AJ, Shields BJ, Hostetler SG, Xiang H, Smith GA. Incidence of pediatric traumatic brain injury and associated hospital resource utilization in the United States. Pediatrics. 2006;118(2):483–92. [DOI] [PubMed] [Google Scholar]
- 4.Chiaretti A, Antonelli A, Mastrangelo A, Pezzotti P, Tortorolo L, Tosi F, et al. Interleukin-6 and nerve growth factor upregulation correlates with improved outcome in children with severe traumatic brain injury. Journal of neurotrauma. 2008;25(3):225–34. [DOI] [PubMed] [Google Scholar]
- 5.Beers SR, Berger RP, Adelson PD. Neurocognitive outcome and serum biomarkers in inflicted versus non-inflicted traumatic brain injury in young children. J Neurotrauma. 2007;24(1):97–105. [DOI] [PubMed] [Google Scholar]
- 6.Berger RP, Beers SR, Richichi R, Wiesman D, Adelson PD. Serum biomarker concentrations and outcome after pediatric traumatic brain injury. J Neurotrauma. 2007;24(12):1793–801. [DOI] [PubMed] [Google Scholar]
- 7.Chiaretti A, Genovese O, Aloe L, Antonelli A, Piastra M, Polidori G, et al. Interleukin 1beta and interleukin 6 relationship with paediatric head trauma severity and outcome. Child’s nervous system : ChNS : official journal of the International Society for Pediatric Neurosurgery. 2005;21(3):185–93; discussion 94. [DOI] [PubMed] [Google Scholar]
- 8.Lo TY, Jones PA, Minns RA. Combining coma score and serum biomarker levels to predict unfavorable outcome following childhood brain trauma. J Neurotrauma. 2010;27(12):2139–45. [DOI] [PubMed] [Google Scholar]
- 9.Kim HJ, Tsao JW, Stanfill AG. The current state of biomarkers of mild traumatic brain injury. JCI Insight. 2018;3(1). [DOI] [PMC free article] [PubMed] [Google Scholar]
- 10.Maisonpierre PC, Suri C, Jones PF, Bartunkova S, Wiegand SJ, Radziejewski C, et al. Angiopoietin-2, a natural antagonist for Tie2 that disrupts in vivo angiogenesis.Science. 1997;277(5322):55–60. [DOI] [PubMed] [Google Scholar]
- 11.Liu XW, Ma T, Liu W, Cai Q, Wang L, Song HW, et al. Sustained increase in angiopoietin-2, heparin-binding protein, and procalcitonin is associated with severe sepsis. J Crit Care. 2018;45:14–9. [DOI] [PubMed] [Google Scholar]
- 12.Gozal D, Khalyfa A, Qiao Z, Smith DL, Philby MF, Koren D, et al. Angiopoietin-2 and soluble Tie-2 receptor plasma levels in children with obstructive sleep apnea and obesity. Obesity (Silver Spring). 2017;25(6):1083–90. [DOI] [PMC free article] [PubMed] [Google Scholar]
- 13.Zan L, Wu H, Jiang J, Zhao S, Song Y, Teng G, et al. Temporal profile of Src, SSeCKS, and angiogenic factors after focal cerebral ischemia: correlations with angiogenesis and cerebral edema. Neurochem Int. 2011;58(8):872–9. [DOI] [PMC free article] [PubMed] [Google Scholar]
- 14.Schonmann SM, Iyer J, Laeng H, Gerber HA, Kaser H, Blaser K. Production and characterization of monoclonal antibodies against human neuroblastoma. Int J Cancer. 1986;37(2):255–62. [DOI] [PubMed] [Google Scholar]
- 15.Chittiboina P, Ganta V, Monceaux CP, Scott LK, Nanda A, Alexander JS. Angiopoietins as promising biomarkers and potential therapeutic targets in brain injury. Pathophysiology : the official journal of the International Society for Pathophysiology. 2013;20(1):15–21. [DOI] [PubMed] [Google Scholar]
- 16.Fujimura M, Joo JY, Kim JS, Hatta M, Yokoyama Y, Tominaga T. Preventive Effect of Clazosentan against Cerebral Vasospasm after Clipping Surgery for Aneurysmal Subarachnoid Hemorrhage in Japanese and Korean Patients. Cerebrovascular diseases (Basel, Switzerland). 2017;44(1–2):59–67. [DOI] [PMC free article] [PubMed] [Google Scholar]
- 17.Ozawa T, Sugiyama S, Tanaka M, Hattori K. Mitochondrial DNA mutations and disturbances of energy metabolism in myocardium. Jpn Circ J. 1991;55(11):1158–64. [DOI] [PubMed] [Google Scholar]
- 18.Rong WL, Xiao X, Zhao JL, Yang XW, Hu ZL, Li MH. Different Doses of Clazosentan for Aneurismal Subarachnoid Hemorrhage: A Meta-Analysis of Randomized Controlled Trials. Am J Ther. 2016. [DOI] [PubMed] [Google Scholar]
- 19.Huseynova SA, Panakhova NF, Hajiyeva AS, Orujova PA, Mukhtarova SN, Agayeva GT. Endothelial dysfunction and developmental outcomes of very low birth weight newborns with hypoxic encephalopathy. J Pak Med Assoc. 2017;67(12):1857–63. [PubMed] [Google Scholar]
- 20.Gu M, Kawoos U, McCarron R, Chavko M. Protection against Blast-Induced Traumatic Brain Injury by Increase in Brain Volume. Biomed Res Int. 2017;2017:2075463. [DOI] [PMC free article] [PubMed] [Google Scholar]
- 21.Spray S, Johansson SE, Radziwon-Balicka A, Haanes KA, Warfvinge K, Povlsen GK, et al. Enhanced contractility of intraparenchymal arterioles after global cerebral ischaemia in rat - new insights into the development of delayed cerebral hypoperfusion. Acta Physiol (Oxf). 2017;220(4):417–31. [DOI] [PubMed] [Google Scholar]
- 22.Hung VK, Yeung PK, Lai AK, Ho MC, Lo AC, Chan KC, et al. Selective astrocytic endothelin-1 overexpression contributes to dementia associated with ischemic stroke by exaggerating astrocyte-derived amyloid secretion. Journal of cerebral blood flow and metabolism : official journal of the International Society of Cerebral Blood Flow and Metabolism. 2015;35(10):1687–96. [DOI] [PMC free article] [PubMed] [Google Scholar]
- 23.Chang X, Bian Y, Wu Y, Huang Y, Wang K, Duan T. Endocan of the maternal placenta tissue is increased in pre-eclampsia. International journal of clinical and experimental pathology. 2015;8(11):14733–40. [PMC free article] [PubMed] [Google Scholar]
- 24.Hentschke MR, Lucas LS, Mistry HD, Pinheiro da Costa BE, Poli-de-Figueiredo CE. Endocan-1 concentrations in maternal and fetal plasma and placentae in pre-eclampsia in the third trimester of pregnancy. Cytokine. 2015;74(1):152–6. [DOI] [PubMed] [Google Scholar]
- 25.Jiang L, Hu Y, He X, Lv Q, Wang TH, Xia QJ. Breviscapine reduces neuronal injury caused by traumatic brain injury insult: partly associated with suppression of interleukin-6 expression. Neural Regen Res. 2017;12(1):90–5. [DOI] [PMC free article] [PubMed] [Google Scholar]
- 26.Jiang L, Xia QJ, Dong XJ, Hu Y, Chen ZW, Chen K, et al. Neuroprotective effect of breviscapine on traumatic brain injury in rats associated with the inhibition of GSK3beta signaling pathway. Brain research. 2017;1660:1–9. [DOI] [PubMed] [Google Scholar]
- 27.Wagner N, Akbarpour A, Mors K, Voth M, Stormann P, Auner B, et al. Alcohol Intoxication Reduces Systemic Interleukin-6 Levels and Leukocyte Counts After Severe TBI Compared With Not Intoxicated TBI Patients. Shock. 2016;46(3):261–9. [DOI] [PubMed] [Google Scholar]
- 28.Kumar RG, Diamond ML, Boles JA, Berger RP, Tisherman SA, Kochanek PM, et al. Acute CSF interleukin-6 trajectories after TBI: associations with neuroinflammation, polytrauma, and outcome. Brain Behav Immun. 2015;45:253–62. [DOI] [PubMed] [Google Scholar]
- 29.Amick JE, Yandora KA, Bell MJ, Wisniewski SR, Adelson PD, Carcillo JA, et al. The Th1 versus Th2 cytokine profile in cerebrospinal fluid after severe traumatic brain injury in infants and children. Pediatric critical care medicine : a journal of the Society of Critical Care Medicine and the World Federation of Pediatric Intensive and Critical Care Societies. 2001;2(3):260–4. [DOI] [PubMed] [Google Scholar]
- 30.Berger RP, Ta’asan S, Rand A, Lokshin A, Kochanek P. Multiplex assessment of serum biomarker concentrations in well-appearing children with inflicted traumatic brain injury. Pediatric research. 2009;65(1):97–102. [DOI] [PubMed] [Google Scholar]
- 31.Park SH, Hwang SK. Prognostic Value of Serum Levels of S100 Calcium-Binding Protein B, Neuron-Specific Enolase, and Interleukin-6 in Pediatric Patients with Traumatic Brain Injury. World Neurosurg. 2018;118:e534–e42. [DOI] [PubMed] [Google Scholar]
- 32.Armstead WM, Riley J, Vavilala MS. TBI sex dependently upregulates ET-1 to impair autoregulation, which is aggravated by phenylephrine in males but is abrogated in females. Journal of neurotrauma. 2012;29(7):1483–90. [DOI] [PMC free article] [PubMed] [Google Scholar]
- 33.Lele AV, Watanitanon A, Lakireddy V, Clark-Bell C, Moore A, Zimmerman JJ, et al. Prevalence, Evolution, and Extent of Impaired Cerebral Autoregulation in Children Hospitalized With Complex Mild Traumatic Brain Injury. Pediatric critical care medicine : a journal of the Society of Critical Care Medicine and the World Federation of Pediatric Intensive and Critical Care Societies. 2018. [DOI] [PubMed] [Google Scholar]
- 34.Millipore Sigma. Millipex MAP Human Cardiovascular Disease(CVD) Magnetic Bead Panel 1: Merck KGaA; 2018. [Available from: http://www.emdmillipore.com/US/en/product/MILLIPLEX-MAP-Human-Cardiovascular-Disease-CVD-Magnetic-Bead-Panel-1-Cardiovascular-Disease-Multiplex-Assay,MM_NF-HCVD1MAG-67K. [Google Scholar]
- 35.Millipore Sigma. Millipex MAP Human Angiogenesis/Growth Factor Magnetic bead Panel: Merck GaA; 2018. [Available from: http://www.emdmillipore.com/US/en/product/MILLIPLEX-MAP-Human-Angiogenesis/Growth-Factor-Magnetic-Bead-Panel-Cancer-Multiplex-Assay,MM_NF-HAGP1MAG-12K. [Google Scholar]
- 36.Sigma M. Millipex MAP Human Cytokin/Chemokine Magnetic Bead Panel: Merck KGaA; 2018. [Available from: http://www.emdmillipore.com/US/en/product/MILLIPLEX-MAP-Human-Cytokine/Chemokine-Magnetic-Bead-Panel-Immunology-Multiplex-Assay,MM_NF-HCYTOMAG-60K. [Google Scholar]
- 37.StataCorp. Stata/IC. 15.1 ed College Station, TX: StataCorp LP; 2017. [Google Scholar]
- 38.Giuliano JS Jr., Lahni PM, Harmon K, Wong HR, Doughty LA, Carcillo JA, et al. Admission angiopoietin levels in children with septic shock. Shock. 2007;28(6):650–4. [PMC free article] [PubMed] [Google Scholar]
- 39.Giuliano JS Jr., Tran K, Li FY, Shabanova V, Tala JA, Bhandari V. The temporal kinetics of circulating angiopoietin levels in children with sepsis. Pediatric critical care medicine : a journal of the Society of Critical Care Medicine and the World Federation of Pediatric Intensive and Critical Care Societies. 2014;15(1):e1–8. [DOI] [PMC free article] [PubMed] [Google Scholar]
- 40.van Engelen BG, Lamers KJ, Gabreels FJ, Wevers RA, van Geel WJ, Borm GF. Age-related changes of neuron-specific enolase, S-100 protein, and myelin basic protein concentrations in cerebrospinal fluid. Clin Chem. 1992;38(6):813–6. [PubMed] [Google Scholar]
- 41.Bazarian JJ, Blyth B, Mookerjee S, He H, McDermott MP. Sex differences in outcome after mild traumatic brain injury. J Neurotrauma. 2010;27(3):527–39. [DOI] [PMC free article] [PubMed] [Google Scholar]


