

Abstract
Recent work provides the first method to measure the relative fitness of genomic variants within a population that scales to large numbers of genomes. A key component of the computation involves finding conserved haplotype blocks, which can be done in linear time. Here, we extend the notion of conserved haplotype blocks to pangenomes, which can store more complex variation than a single reference genome. We define a maximal perfect pangenome haplotype block and give a linear-time, suffix tree based approach to find all such blocks from a set of pangenome haplotypes. We demonstrate the method by applying it to a pangenome built from yeast strains.
Keywords: Population genomics, Haplotype block, Pangenomics
Introduction
Given the availability of sequenced genome data for many individuals of the same species, it is now possible to study population genetics and evolution at a level of detail not before possible. An established method for quantifying the relative fitness of two genetic variants uses the selection coefficient [6, Chapter 5.3]. Recent work by Cunha et al. [4] describes a method to scale the computation of selection coefficients across an entire genome, even when the number of individuals being analyzed is large. They adopt the maximum-likelihood based method from Chen et al. [3] for computing the selection coefficient for a maximally conserved portion of the genome. These conserved portions of the genome can be identified using haplotypes: sequences of single nucleotide polymorphism (SNP) sites defined with respect to a reference sequence for the population. However, Cunha et al. note that, prior to their work, no efficient method existed to compute all maximally conserved blocks from a set of haplotypes. They give an algorithm for locating the blocks that is quadratic in the length of the haplotypes. More recently, Alanko et al. [1] give a method for finding haplotype blocks in linear time. However, both haplotype block location algorithms assume that all genomes under consideration have been aligned to the same reference genome.
A pangenome allows us to consider more complex variation in multiple individuals or organisms from a related group or species [10]. Pangenomic sequence data are often studied using graphs, where each sequence in a data set is represented by a path in the graph. In this work, we reformulate the problem of finding maximal haplotype blocks in the context of pangenomics. We give a method for finding pangenome SNPs in a De Bruijn graph in Sect. 3, define the pangenome maximal perfect haplotype block problem in Section 4, and describe a suffix tree approach to find all blocks in linear time relative to the input in Sect. 5. Finally, we find maximal perfect pangenome haplotype blocks in a ten-strain yeast pangenome and report results in Sect. 6.
Background
Given a set of binary sequences representing the presence (or absence) of SNPs in a chromosome, the authors of [4] define a maximal perfect haplotype block as follows:
Definition 1
Given k sequences  of length n, a maximal perfect haplotype block is a triple (K, i, j) with
  ,
,  , and
, and  such that
 for all
  (equality),
 or
or  for some
  (left-maximality),
 or
or  for some
  (right-maximality),
 with
with  such that
  for all
  (row-maximality).
Then, the maximal perfect haplotype block (MPHB) problem is to find all maximal perfect haplotypes in a given set of sequences. For example, Fig. 1 shows a set of three sequences containing five MPHBs.
Fig. 1.

The five maximal perfect haplotype blocks in this set of sequences are  , and
, and  .
.
In the case of pangenomic data it may not be possible to align each chromosome to a reference so we consider a generalized setting of the problem in which the SNPs occur in an arbitrary directed graph, rather than a linear sequence.
Building the SNP Graph
We assume that a compressed De Bruijn graph (cDBG) has been built for the pangenomic data set we wish to study [2]. In this case the data set consists of a set of pangenomic sequences and the cDBG graph G consists of a set of nodes representing specific k-mers (or  -mers if the graph has been compressed). The parameter k must be specified. An edge (u, v) is present in G provided the last
  nucleotides of u match the first
  nucleotides of v. Each pangenomic sequence is associated with a path in G, where each path node appends all non-overlapping characters from the previous node in the path. Let P denote the collection of sequence paths in G.
We identify pangenomic SNPs by looking for “bubbles” in G. Bubbles, as shown in Fig. 2, occur when paths diverge into exactly two subpaths and then rejoin, and no additional edges enter or leave the interior of the bubble. We view one side of the bubble as a ‘0’ and the other as a ‘1’. Some bubbles will be longer than one nucleotide, but we still refer to them as SNPs for simplicity of notation. All SNPs can be found in O(|G|) time, since bubble nodes in a cDBG can be recognized in O(1) time. We form the SNP graph by retaining only those vertices of the cDBG graph that correspond to the ‘0’ and ‘1’ branches for each identified SNP. The paths P in G induce new SNP paths by deleting the non-SNP nodes in each path. The resulting SNP path sequences are used as input to maximal perfect perfect pangenome haplotype block problem, defined in the next section.
Fig. 2.
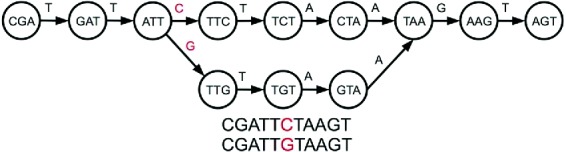
A bubble in a De Bruijn graph that represents a SNP; we arbitrarily consider one side of the bubble to be the ‘0’ path and the other to be the ‘1’ path. In the compressed De Bruijn graph, the ‘0’ and ‘1’ paths are each a single node.
Problem Definition
Given a SNP graph and a sequence, a pangenome haplotype is the list of nodes that the sequence follows through the SNP graph. Due to large structural variations such as strain-specific genes, segmental deletions, insertions, and rearrangements, certain regions of the pangenome may be missed by some sequences but followed by others. Thus, not all pangenome haplotypes have the exact same set of SNPs, and the position of a node within the path does not indicate which SNP the node corresponds to as it does in the single-reference case. Instead, the node labels indicate both the SNP identifier and the call (either a ‘0’ or a ‘1’). Figure 3 lists four example pangenome haplotypes.
Fig. 3.

Three pangenome sequences represented as paths through a SNP graph containing ten SNPs. The subpath [2:0 3:1] and sequences {1, 2} represent one maximal perfect pangenome haplotype block. Subpath [6:1, 7:0, 8:0] and sequences {2, 3} is another.
We define a maximal perfect pangenome haplotype block.
Definition 2
Given a set of k paths  through graph
  , where each path is a sequence of nodes in V, a maximal perfect pangenome haplotype block is a set
  and a path of m nodes s such that:
s is a subpath of
 for all
  (equality),
There is no in-neighbor u of s[1] such that u, s is a subpath of
 for all
  (left maximality),
There is no out-neighbor v of s[m] such that s, v is a subpath of
 for all
  (right maximality),
There is no
 such that
  and s is a subpath of
  for all
  (path set maximality).
Just as in the standard MPHB problem, the maximal perfect pangenome haplotype block (MPPHB) problem is to find all maximal perfect pangenome haplotype blocks among the k paths.
We note that if n is the length of the longest path in P, then there are no more than  MPPHBs in any set of paths P. A proof is given in Sect. 5.
Linear Time Method Based on Suffix Trees
As in [1], we can use a suffix tree to solve the MPPHB problem in linear time.
Alanko et al. [1] note that all MPHBs in a set of sequences  correspond to maximal repeats (repeated substrings that cannot be extended; see [7, Section 7.12]) in the string
  . However, not all maximal repeats in
  are MPHBs, since any
  may contain repeated substrings and a pair
  and
and  may contain the same substring beginning at different positions. Neither of these is a MPHB.
They propose adding  unique “index characters” to each sequence, alternating with the existing characters. This way, substrings can only match to other substrings if they occur in exactly the same position in two different sequences. This process creates the string
  so that there is a maximal repeat in
  if and only if there is a MPHB in S. It is possible to find all maximal repeats in a string using a suffix tree in linear time and space [7, Section 7.12].
In the pangenome case, the suffix tree approach can still be applied. Because haplotype blocks need not begin at the same position in the path, the index characters are not needed. If the SNP graph contains cycles, then there may be maximal repeats within a single path; we can mark and ignore all internal suffix tree nodes that contain only a single haplotype path sequence in linear time using a standard method [9]. Thus, a simple procedure for locating pangenome haplotype blocks is as follows:
Build the string
 , where each
  is a distinct character not used in the
  strings.
Build a suffix tree on
 .
.Use the suffix tree to find all maximal repeats (K, S) in
 . The SNP path and the set of sequences K are represented implicitly by the suffix tree node.
Building a suffix tree can be done in O(nk) time and space [5], and, as noted above, finding all maximal repeats in the suffix tree is also linear time. Thus, each step of the procedure takes linear time and space.
Since the MPPHBs correspond to internal nodes in the suffix tree on  , we can give a bound on the number of MPPHB in P.
Lemma 1
Given a set of k pangenome paths P with maximum length n, there are at most  MPPHBs in P.
Proof
As argued above, every MPPHB in P corresponds to a maximal repeat in  . Because each path in P contains no more than n nodes,
  . Then, because the maximal repeats of a string are the internal nodes in the suffix tree of that string [7, Theorem 7.12.1], there are at most
  maximal repeats in
  , and thus at most
  MPPHBs in P.
Experimental Results
We tested our method for finding MPPHBs using a moderately-sized pangenomic yeast data set. Yeast is a well-studied model system with a genome size of approximately 12 Mb. We created a yeast data set using assemblies from 10 yeast strains from the Saccharomyces Genome Database1 used in either wine or bread-making. To investigate the maximal perfect pangenome haplotype blocks present in the data set, we construct a compressed De Bruijn graph for  using the cdbg package [2] and extract SNPs from each using the method described in Sect. 3. Each yeast sequence then corresponds to a path through the SNP graph
  ; that is, a sequence of pangenome SNP calls. Then, as in Sect. 5, we find maximal repeats in the string
  in order to find MPPHBs. We use repeat-match from MUMmer 4.0 [8] to compute maximal repeats and identify all maximal pangenomic haplotype blocks using these reported repeats.
Compressed De Bruijn graph and SNP graph generation takes a few minutes on a moderate workstation2 for this data set. In order to find maximal repeats using MUMmer, we encode SNP nodes using 19 alphabet characters. When running repeat-match, we use the -f flag to find forward repeats only and the -n flag to return only encoded repeats long enough to represent full SNP nodes (in our case, 19 characters). For all k values, repeat-match took at most a few seconds to run. We then use a simple Python script to decode the output back to SNP labels and process it into haplotype blocks. For  and
and  , this takes a few minutes; for the other two values tested, it takes a few seconds or less.
Table 1 shows the number of SNPs found in each experiment, as well the number of haplotype blocks found and their average number of sequences and SNP path length. When  fewer SNPs are found since there are fewer bubbles in the cDB graph and the blocks are smaller in size. As the number of bubbles in the cDB graph increases, more blocks are found. We leave a more thorough investigation of the relationship between k, the number of bubbles, and the number of blocks to future work.
Table 1.
Summary statistics for different k values. Decreasing k from 1000 to to 25 results in a larger SNP graph and more and bigger blocks found.
| k | # SNPs | # blocks | avg. |K| | avg. |S| |
|---|---|---|---|---|
| 1000 | 1,985 | 146 | 2.12 | 1.47 |
| 500 | 4,759 | 1,458 | 2.46 | 1.68 |
| 100 | 38,489 | 39,036 | 3.46 | 3.61 |
| 25 | 117,792 | 79,154 | 3.41 | 4.24 |
We compare the distributions of these data for  and
and  in Fig. 4.
Fig. 4.
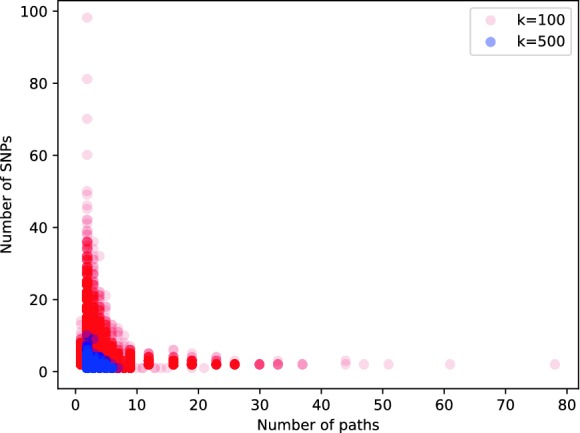
Scatterplot showing each distribution of maximal perfect pangenome haplotype sizes for  and
and  .
.
In Fig. 5 we show a plot of several of the maximal haplotype blocks found in the  graph. The graph shows an introgressed region of SNPs that occurs in approximately half of the sequences that traverse the region shown.
Fig. 5.

Sample haplotype block paths from a pangenomic data set comprised of 10 yeast genomes. Each colored path represents a haplotype block and the line thickness is proportional to the number of sequences in the block. SNPs 7778, 8174 and 25508 represent an introgressed region. (Color figure online)
Conclusion
In this work, we define the maximal perfect pangenome haplotype block problem and give a linear time method to solve it. Single-reference haplotype blocks can be used to compute a selection coefficient measuring the relative fitness of two genetic variants in a population; a natural next step in the pangenome case is to precisely define a pangenomic selection coefficient based on MPPHBs, or to explore other applications of MPPHBs in population genetics.
We note that the positional Burrows-Wheeler Transform approach from [1] cannot be directly adapted for pangenome haplotype blocks since the SNP graph is not generally linear and paths may skip SNPs or contain cycles, etc. However, we are interested in extending both the pangenome and single-reference maximal perfect haplotype block problem to include inputs with SNPs that are not called, in order to include genomes with low coverage in some regions.
Acknowledgements
Support provided by US National Science Foundation grants DBI-1759522 and DBI-1661530. We thank the anonymous reviewers for their thoughtful feedback and questions.
Footnotes
http://www.yeastgenome.org The strains used were AWRI796 (Wine), BC187 (Wine), CLIB215 (Bakery), CLIB324 (Bakery), DBVPG6044 (Wine), L1528 (Wine), LalvinQA23 (Wine), Red Star (Bakery), VL3 (Wine), YS9 (Bakery).
An 8-core 3.40 GHz Intel i7 CPU with 16 Gb of RAM.
Contributor Information
Carlos Martín-Vide, Email: carlos.martin@urv.cat.
Miguel A. Vega-Rodríguez, Email: mavega@unex.es
Travis Wheeler, Email: travis.wheeler@umontana.edu.
Lucia Williams, Email: lucia.williams@montana.edu.
References
- 1.Alanko, J., Bannai, H., Cazaux, B., Peterlongo, P., Stoye, J.: Finding all maximal perfect haplotype blocks in linear time. In: 19th International Workshop on Algorithms in Bioinformatics, WABI 2019. Schloss Dagstuhl-Leibniz-Zentrum fuer Informatik (2019)
- 2.Beller T, Ohlebusch E. A representation of a compressed de Bruijn graph for pan-genome analysis that enables search. Algorithms Mol. Biol. 2016;11(1):20. doi: 10.1186/s13015-016-0083-7. [DOI] [PMC free article] [PubMed] [Google Scholar]
- 3.Chen H, Hey J, Slatkin M. A hidden markov model for investigating recent positive selection through haplotype structure. Theoret. Popul. Biol. 2015;99:18–30. doi: 10.1016/j.tpb.2014.11.001. [DOI] [PMC free article] [PubMed] [Google Scholar]
- 4.Cunha L, Diekmann Y, Kowada L, Stoye J. Identifying maximal perfect haplotype blocks. In: Alves R, editor. Advances in Bioinformatics and Computational Biology; Cham: Springer; 2018. pp. 26–37. [Google Scholar]
- 5.Farach, M.: Optimal suffix tree construction with large alphabets. In: Proceedings 38th Annual Symposium on Foundations of Computer Science, pp. 137–143. IEEE (1997)
- 6.Gillespie JH. Population Genetics: a Concise Guide. Baltimore: JHU Press; 2004. [Google Scholar]
- 7.Gusfield D. Algorithms on Strings, Trees, and Sequences: Computer Science and Computational Biology. Cambridge: Cambridge University Press; 1997. [Google Scholar]
- 8.Marçais G, Delcher AL, Phillippy AM, Coston R, Salzberg SL, Zimin A. MUMmer4: a fast and versatile genome alignment system. PLoS Comput. Biol. 2018;14(1):e1005944. doi: 10.1371/journal.pcbi.1005944. [DOI] [PMC free article] [PubMed] [Google Scholar]
- 9.Sung WK. Algorithms in Bioinformatics: A Practical Introduction. Boca Raton: CRC Press; 2009. [Google Scholar]
- 10.Tettelin H, et al. Genome analysis of multiple pathogenic isolates of streptococcus agalactiae: implications for the microbial “pan-genome". Proc. Natl. Acad. Sci. 2005;102(39):13950–13955. doi: 10.1073/pnas.0506758102. [DOI] [PMC free article] [PubMed] [Google Scholar]