

Summary
Eukaryotic transcription factors (TFs) form complexes with various partner proteins to recognize their genomic target sites. Yet, how the DNA sequence determines which TF complex forms at any given site is poorly understood. Here we demonstrate that high-throughput in vitro DNA binding assays coupled with unbiased computational analysis provides unprecedented insight into how different DNA sequences select distinct compositions and configurations of homeodomain TF complexes. Using inferred knowledge about minor groove width readout, we design targeted protein mutations that destabilize homeodomain binding both in vitro and in vivo in a complex-specific manner. By performing parallel SELEX-seq, ChIP-seq, RNA-seq and Hi-C assays, we not only classify the majority of in vivo binding events in terms of complex composition, but also infer complex-specific functions by perturbing the gene regulatory network controlled by a single complex.
eTOC
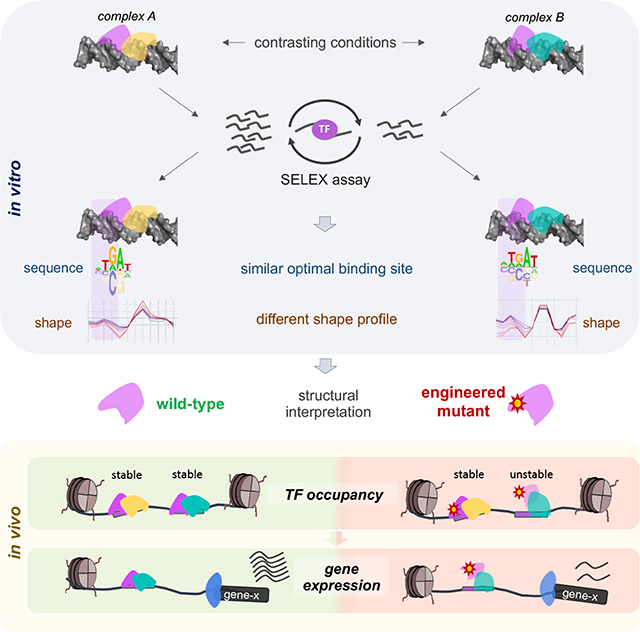
High throughput in vitro DNA binding assays reveal DNA shape readout by homeodomain transcription factors. Mutations that impair this readout are used to selectively destabilize specific homeodomain complexes both in vitro and in vivo.
Graphical Abstract
INTRODUCTION
Gene regulatory networks are controlled by transcription factors (TFs) that target distinct gene sets by binding to specific DNA sequences. To determine which genes are regulated by a given TF, the genome-wide pattern of TF binding must be assayed and interpreted. The current standard approach is to profile in vivo TF occupancy using ChIP-seq or related methods (Cheetham et al., 2018; Johnson et al., 2007; Skene et al., 2018; Southall et al., 2013; Tosti et al., 2018). However, because these assays are blind to which co-factors a TF uses to bind any particular locus, it is difficult to infer how the DNA sequence determines the composition and configuration of TF complexes.
A complementary approach to identify TF binding sites involves probing the DNA binding specificity of TFs using high-throughput in vitro assays (Lambert et al., 2018). Binding preferences derived from such experiments are typically summarized by a position weight matrix (PWM) (Stormo, 2000). Despite their popularity, PWMs typically fail to explain a large fraction of in vivo TF binding events in higher eukaryotes (Wang et al., 2012). There are several possible explanations for this: For one, low-affinity binding sites, which may not harbor a clear motif match, can be bound and functional in vivo (Crocker et al., 2016; Kribelbauer et al., 2019). Second, a TF may bind its genomic target sites cooperatively with other TFs (Jolma et al., 2015; Rodriguez-Martinez et al., 2017; Slattery et al., 2011; Spivak and Stormo, 2016; Stefflova et al., 2013) or with nucleosomes (Zhu et al., 2018). Finally, indirect pull-down at highly accessible sites (Consortium, 2012) or experimental artifacts (Baranello et al., 2016) may also contribute to our inability to fully explain TF binding in vivo.
Yet another approach to analyzing TF binding specificity is to obtain atomic-resolution structural information of protein-DNA complexes. To date, the structures of several thousands of protein-nucleic acid complexes have been determined (Berman et al., 2000), including representatives for all major TF families (Morgunova and Taipale, 2017). However, as with PWM models, the majority of these structures were obtained using only the DNA binding domain (DBD) bound to a single DNA ligand and, as a result, provide little structural insight into the range of binding modes exhibited by combinations of full-length TFs in vivo. Because DNA structure has been shown to play a role in TF-DNA recognition (Rohs et al., 2009), computational methods have been developed that allow high-throughput DNA structure prediction for a variety of features such as minor groove width (Chiu et al., 2019; Yang et al., 2014). In addition, several studies have found that TFs prefer specific DNA shape profiles that are not captured by canonical PWMs (Mathelier et al., 2016; Samee et al., 2019), suggesting that PWMs may miss these aspects of TF binding. However, since DNA shape is a consequence of DNA sequence, it is challenging to cleanly separate the contributions of DNA shape recognition from canonical base readout (i.e. a direct hydrogen bond) in TF binding. In one approach, structural information guided the design of mutant TFs that were impaired in shape readout, which were then used in high-throughput DNA binding experiments to assess the contribution of DNA shape to binding (Abe et al., 2015). Although the reverse — using DNA shape signatures derived from SELEX data to infer TF readout mechanisms in the absence of structural information — should in principle be feasible, there is to date no study that has systematically explored this approach.
Here we show that without prior structural information high-throughput in vitro binding data and DNA shape signatures can be used to infer DNA shape readout mechanisms that are missed by canonical sequence motif analysis. In contrast to previous studies, we use this insight to design engineered TFs that can elucidate important principles underlying gene regulatory networks. By comparing the behavior of wild-type and engineered versions of the same TF in vivo, we obtain detailed information on TF complex-specific gene control and function. To illustrate this approach, we focused on a system of three interacting homeodomain (HD) transcription factors from D. melanogaster – one of the eight Hox proteins in complex with the homeodomain cofactors Homothorax (Hth) and Extradenticle (Exd). This trimeric TF system exhibits many of the complexities that exist for most eukaryotic TFs, including overlapping binding specificities within large TF families (Burglin and Affolter, 2016; Merabet and Mann, 2016), the existence of multiple TF isoforms (Crist et al., 2011; Noro et al., 2006), cooperativity and latent DNA binding specificities (Slattery et al., 2011), and distinct biological functions that depend on different TF complex compositions (Moens and Selleri, 2006; Morata and Sanchez-Herrero, 1998; Noro et al., 2006; Yao et al., 1999).
We show that, as with Hox homeodomains (Abe et al., 2015; Joshi et al., 2007), basic amino acids within the N-terminal arms of both Hth and Exd homeodomains select DNA sequences with minor groove width (MGW) minima. Thus, the Hox-Exd-Hth trimer prefers DNA sequences with a complex DNA shape that includes multiple optimally spaced MGW minima. We also find that the dependency on Exd’s ability to recognize its MGW minimum differs between Exd-containing complexes. We use this insight to design protein mutations that selectively reduce the stability of some, but not all Exd complexes. Deploying this differential sensitivity as a tool in vivo, we classify each Exd binding site according to the specific homeodomain complex that it binds and infer complex-specific biological functions by linking distinct complexes to the set of target promoters they physically interact with. Finally, by combining information on 3D chromatin interactions with the variable dependency on DNA shape readout by Exd, we provide evidence that binding sites lacking a clear sequence motif are indirectly ChIPed as a consequence of interactions with sites bound in a sequence-specific manner.
RESULTS
Hox, Hth, and Exd form complexes with distinct sequence and conformation preferences
The TALE-family homeobox protein Exd can form a heterodimer with each of the eight D. melanogaster Hox factors (Slattery et al., 2011). Nuclear localization of Exd is dependent on Hth (Berthelsen et al., 1999; Rieckhof et al., 1997), a second TALE-family homeodomain TF that exists in two major isoforms (Noro et al., 2006): a full-length, homeodomain (HD) containing isoform, HthFL, and a shorter, HD-less isoform, HthHM (Homothorax-Meis domain). Since the tight Exd-Hth protein-protein interaction occurs between the HM domain and Exd’s PBC domain (Ryoo et al., 1999) (Figure 1A), both isoforms are sufficient for the nuclear localization of Exd. In addition to acting as a Hox cofactor, HthFL-Exd carries out Hox-independent functions such as patterning the proximal-distal axes of the appendages and specifying antennal identity (Abu-Shaar and Mann, 1998; Casares and Mann, 1998; Mann and Morata, 2000). As a result, a variety of Exd-containing complexes are present in vivo – HthFL-Exd-Hox, with three HDs, HthHM-Exd-Hox or HthFL-Exd, each with two HDs – as well as HthFL binding as a monomer or homodimer without direct Exd-DNA contact (Figure 1B). Structural information, however, is largely limited to the HDs of heterodimeric Exd-Hox and homodimeric MEIS1 (the human ortholog of Hth) (Figure 1B). Thus, it remains unclear how the assembly of different complexes is promoted by the DNA sequence, or how the combinatorial nature of homeodomain binding contributes to gene regulation.
Figure 1: Probing the diversity of multi-homeodomain complex binding using SELEX-seq.

See also Figure S1.
(A) Schematic gene structures for three homeodomain TFs: Homothorax (Hth; pink), Extradenticle (Exd; green), Hox (Hox; blue). Arrows indicate protein interactions: PBC-domain (PBC); Homothorax-Meis domain (HM); YPWM (Exd interaction motif). (B) Existing 3D structures and schematic diagrams showing various possible complexes formed by Hth, Exd, and/or Hox. Arrows indicate Hth binding site (BS) orientation (forward, F = TGACAG and reverse, R = CTGTCA). (C) SELEX-seq library design and derived sequence motifs (shown as energy logos). Arrows indicate protein binding site orientation with respect to the consensus NNAY homeodomain motif.
To characterize in vitro binding preferences, we designed SELEX-seq libraries (Kribelbauer et al., 2017; Riley et al., 2014; Slattery et al., 2011) whose randomized region can accommodate the entire footprint of each respective complex (Figure 1C). Since inferring TF binding motifs of TF complexes with multiple potential configurations and flexible spacing is computationally challenging, we designed two libraries in which a fixed Hth binding site immediately precedes a 21-bp randomized region: (i) Lib-Hth-F, with an Hth site (TGACAG) designed to bind Hth in forward orientation, and (ii) Lib-Hth-R, with a reverse orientation (CTGTCA) (Figure 1C). We carried out SELEX-seq experiments for all individual complexes and constructed position-specific affinity matrices (PSAMs) and energy logos (Foat et al., 2006) based on the relative enrichment of oligomers of a given length (Figure 1C; see STAR Methods). This analysis indicates that in the absence of Hox, Exd-HthFL prefers to bind as a head-to-tail dimer analogous to Exd-Hox (Figure 1C). Introducing a Hox protein to the HthFL-Exd complex results in the formation of a dominant Exd-Hox subcomplex, similar to when orientation-agnostic libraries are used (Figure S1A,B). Sequences suggestive of Exd-HthFL (dark blue) and HthFL–HthFL dimer binding (dark pink) are also observed (Figure S1B).
Relative position and orientation preferences of a ternary protein-DNA complex
Characterizing the binding preferences of the ternary HthFL-Exd-Hox complex requires taking into consideration both the orientation and position of the HthFL binding site relative to the Exd-Hox heterodimer binding site. To infer this information from the SELEX-seq data, we first computed the relative enrichment of all DNA 12-mers both for HthFL-Exd-Hox and HthHM-Exd-Hox (Figure S1A,B). Using the PSAM for Exd-Hox to assign binding orientation, we find that in the absence of a Hth homeodomain, similar enrichments are observed for the forward ([Exd-Hox]F) and reverse ([Exd-Hox]R) orientations. However, when the homeodomain-containing isoform HthFL is used, the configuration [HthFL]F[Exd-Hox]F is preferred over [HthFL]F[Exd-Hox]R (Figure S1A, B and C).
Next, we estimated the contribution to the total binding free energy of complex binding associated with the “full configuration” (i.e., the relative position and orientation of the Hth and Exd-Hox subunits) by fitting a generalized linear model (GLM) that uses the intrinsic Exd-Hox binding affinity (for each 12-mer) and a configurational term simultaneously as predictors (see STAR Methods) (Figure 2A). For both fixed Hth binding site orientations (F and R), the configuration in which Hth binds on the Exd side of the Exd-Hox dimer was favored (top rows of estimates; Figure 2A). In addition, a preference for shorter spacers was observed for the Hth-F library compared to the Hth-R library (Figure 2A and Figure S1D). This preference suggests that the N-terminus of Hth’s HD faces Exd in Lib-Hth-R, shortening the distance between Hth’s HM and Exd’s PBC domains and thus allowing for a longer DNA spacer, while facing away in Lib-Hth-F, requiring the Exd-Hox subcomplex to be closer to the Hth binding site. The proposed structural configuration is consistent with the MEIS1 crystal structure (the human Hth ortholog; PDB-ID: 4XRM) (Figure 2B) (Jolma et al., 2015).
Figure 2: Dissecting DNA minor groove width readout by a ternary homeodomain complex.

See also Figures S1 and S2.
(A) Systematic analysis of binding configurations of the ternary HthFL-Exd-Hox complex. SELEX probe counts after two rounds of affinity-based selection were analyzed using a generalized linear model that estimates the free energy associated with each configuration (i.e., the length of DNA spacer between the Hth and Exd-Hox sites, and their orientation with respect to each other) while accounting for the dependence on DNA sequence based on the enrichment of 12-mers observed for the simpler HthHM-Exd-Hox complex. Heatmaps show ΔΔG coefficients (in units of RT) for each particular configuration; red indicates stronger binding. (B) Superposition of Meis1 (human ortholog of Hth; PDB-ID: 4XRM) and Exd-Hox (PDB-ID: 2R5Y) crystal structures onto B-DNA templates (http://structure.usc.edu/make-na/) consisting of a Hth-F (TGACAG) or Hth-R (CTGTCA) binding site, followed by a 4-bp spacer (indicated by “ssss”) and an Exd-Hox site (2R5Y). Arrows indicate the relative positioning of the N-terminal domain of each HD (Hth: pink; Exd: green). (C-D) Average minor groove width (MGW) profiles at increasingly stringent SELEX binding affinity cutoffs, for (C) HthFL-Exd-Hox (Lib-Hth-R) and three different spacer lengths (3–5 bp), (D) HthFL-Exd-Hox for a 4 bp spacer, contrasting all wild-type (top), shape-defective Exd (middle) or shape-defective Hth (bottom). Arrows indicate the position of N-terminal arm MGW readout, color saturation and arrow size indicate the loss or gain of specific MGW minima respectively.
To validate that the GLM-derived configurational free energy estimates recapitulate true differences in binding free energy, we performed competition electromobility shift assays (EMSAs) on binding sites with identical HthFL and Exd-Hox sequences (orientation = [HthFL]R[Exd-Hox]F), but different DNA spacer lengths. Two of the three tested spacers (3 bp and 7 bp) had similar predicted configurational energy in our model (blue and green curves in Figure S1E), whereas one (0 bp) was less favorable for binding (red curve in Figure S1E). These experiments indeed confirm the predicted effect of spacer length variability on binding affinity.
Optimal binding by the ternary HthFL-Exd-Hox complex relies on minor grove shape readout by all three homeodomains
The currently available structures of homeodomain-DNA complexes suggest that the spacer DNA separating the HthFL and Exd-Hox binding sites is not directly contacted by any of these proteins. However, since DBDs were used rather than full-length proteins, the contacts observed in these structures may not capture all relevant contributions to complex assembly. To determine whether the sequence of the DNA spacer might contribute to the thermodynamic stability of the complex, we computed oligomer enrichment over the first four nucleotide positions downstream of the fixed Hth site in Lib-Hth-R, retaining only those probes that matched the 12-bp PSAM for Exd-Hox over positions 5–16. A preference for AT-rich sequences observed in the most highly enriched spacers (Figure S1F) suggested that the spacer may influence binding affinity via DNA minor-groove shape readout, which has been shown to play a critical role in DNA recognition for many TFs (Abe et al., 2015; Jolma et al., 2015; Rohs et al., 2009; Slattery et al., 2014; Zhou et al., 2015).
To analyze the relationship between spacer sequence preference and DNA shape readout, we fit a mechanism-agnostic generalized linear model (GLM) using base identities over the first 15 nucleotide positions of the variable region (3-bp spacer and a 12-bp Exd-Hox site) as predictors, while keeping the first two base pairs within the Exd-Hox site fixed (Figure S1G,H; see STAR Methods for details). Consistent with recent analyses (Rube et al., 2018), spacer preferences derived from a GLM that neglects dependencies between nucleotide positions agreed well with a GLM in which each spacer oligonucleotide was scored separately (R2=0.81, Figure S1I). By taking subsets of sequences defined by an increasingly stringent cutoff of their GLM-based affinity and computing their average minor groove width (MGW) profile using pentamer tables (Zhou et al., 2013), we visualized the relationship between intrinsic DNA shape and probe selection in the SELEX-seq assay (Figure 2C and Figure S1G). In addition to the two known MGW minima preferred by anterior Hox TFs (Abe et al., 2015; Joshi et al., 2007) (blue arrows, Figure 2C), we observed a strong preference for a narrow minor groove within the 3-bp spacer region separating the Hth and Exd-Hox binding sites. Notably, when we used the same approach to examine spacers longer than 3 bp, this broad MGW minimum split into two narrow ones that were adjacent to the Hth and Exd binding sites, respectively (pink and green arrows, Figure 2C).
These observations suggest that both Hth and Exd can take advantage of local narrowing of the DNA minor groove by inserting positively charged amino acid side chains from their N-terminal arms into the minor groove of the spacer (Figure 2C). To experimentally test this hypothesis, we made mutations in the positively charged amino acids within Hth’s and Exd’s N-terminal arm, similar to those designed previously for Hox proteins (Abe et al., 2015). For Hth we mutated all 3 positively charged amino acids to alanine (HthK3A,K4A,R5A, which we will refer to as Hth–shape, Figure S2C,D) and for Exd we chose the double arginine mutant with the strongest apparent impact on binding (Figure S2C,D, ExdR2A,R5A, which we will refer to as Exd–shape). Generating new SELEX data using the mutant proteins and repeating the analysis of Figure 2C for a spacer of 4bp revealed that the mutant HthFL-Exd-Hox complex lost the ability to select sequences containing the corresponding MGW minimum (translucent arrows, Figure 2D). In addition, Exd–shape blunted one of the previously observed (Abe et al., 2015; Joshi et al., 2007; Slattery et al., 2011) preferences for a narrow minor groove by anterior Hox proteins, suggesting that shape-readout by Exd promotes Hox shape readout.
The stability of Exd-containing complexes depends to different degrees on MGW readout by Exd
Given that ternary HthFL-Exd-Hox complex binding relies on MGW readout by Exd’s N-terminal arm, we tested whether this shape readout was required for all identified Exd-containing complexes: (i) Exd plus Hox-HthHM (the HD-less soform of Hth), (ii) Exd plus Hox-HthFL, and (iii) Exd plus HthFL alone. When we compared sequence logos, all three ExdWT-containing complexes selected for a similar Exd half site with a shared optimal sequence (ATGAT – green shaded area, Figure 3A). In contrast, the MGW readout profiles revealed large differences in the extent to which Exd selects for a narrow minor groove (green shaded area, Figure 3B): The strongest MGW minimum is selected by HthHM-Exd-Hox while there is hardly any selection for a MGW minimum by the Exd-HthFL complex.
Figure 3: Exd deploys latent shape readout depending on complex composition.

See also Figure S2.
(A) Energy logos derived from SELEX-seq data are shown (where possible) for both ExdWT and Exd–shape for the three type of complexes, HthHM-Exd-Dfd (top), HthFL-Exd-Dfd (middle), and Exd- HthFL- (bottom). Green and red shaded areas indicate the part of the motif that is contributed to either wild-type or mutant Exd. (B) Average MGW profiles of sequences partitioned by increasingly stringent cutoffs on their total binding free energy (SELEX) are shown (where possible) for ExdWT and Exd–shape for all three complexes under (A). Color scheme shows relative ΔΔG/RT values, in reference to the SELEX probe with highest overall binding affinity. Green shaded areas indicate the position at which MGW selection of Exd varies among complexes. Red areas show to what extent this shape readout is lost. Middle panels (MGW preferences for HthFL-ExdWT-Dfd and HthFL-Exd−shape-Dfd) are repeated from Figure 2C and D, respectively, for comparison. (C) Electromobility shift assay (EMSA) results for both ExdWT (reference lane) and single and double amino-acid point mutations of Exd are shown for all three complexes. Red arrowheads indicate binding loss.
These observations reveal that analyzing the sequence preferences of SELEX-seq experiments in terms of DNA shape features can uncover structural readout mechanisms that differ between TF complexes that are not revealed by standard PWMs. To verify the complex-specific differences in Exd MGW readout and to probe the extent to which they are relevant for complex stability, we performed SELEX and EMSA assays using several Exd N-terminal arm mutants (Figure 3B and Figure S2A–D). Strikingly, two single substitutions within Exd’s N-terminal arm (ExdR2A and ExdR5A) were each sufficient to abrogate binding of the HthHM-Exd-Hox complex to the same extent as a key hydrogen bonded residue in the α3 recognition helix of Exd (ExdN51A; for numbering of amino acids see (Burglin and Affolter, 2016); red arrows in top panel, Figure 3C and Figure S2A). By contrast, when the same R-to-A mutations in Exd were tested in the context of HthFL-Exd-Hox or Exd-HthFL, binding stability was only mildly affected (Figure 3C and Figure S2C,D). Moreover, for both HthFL-Exd-Hox and Exd-HthFL, the preference for Exd’s MGW minimum was no longer detectable in the SELEX-seq experiments using the Exd–shape mutant (red shaded area, Figure 3B), even though the optimal Exd half site was still preferred (TGAT - red shaded area, Figure 3A). Together these findings demonstrate that although Exd’s N-terminal arm minor grove contacts are not visible in existing crystal structures (Figure 2B and Figure S2E) and cannot be deduced by canonical motif analyses (Figure 3A), they can make large contributions to the binding free energy (Figure 3C). Second, the requirement for Exd’s MGW readout is complex-specific: The three HD HthFL-Exd-Hox and the two HD Exd-HthFL complexes can tolerate mutations in Exd’s N-terminal arm, while the two HD HthHM-Exd-Hox complex cannot. Third, the dependency on MGW shape readout can be revealed by high-throughput binding data.
Differential sensitivity to shape readout impairment changes the rank order of homeodomain complex binding
To determine the extent to which the Exd shape-readout mutant differentially impacts complex formation, we systematically compared the sequences selected by the mix of HthFL-Exd-Hox with those selected by HthFL-Exd–shape-Hox complexes in our SELEX-seq experiments using the 21-bp libraries (Figure 4A and Figure S3D). This analysis revealed a large variation in the extent to which binding to a particular DNA sequence is affected by the Exd−shape mutant. To interpret these observations, we used the PSAMs derived from the SELEX experiments on each complex individually (cf. Figure 1C, i.e., the Exd-HthFL only library) to assign the bound complex for each DNA sequence (colored points in Figure 4A and Figure S3D,G). This analysis confirmed that in addition to discriminating between Hth-Exd-Hox complexes containing either the HthFL or HthHM isoforms, Hox-containing complexes are more sensitive to this mutation than non-Hox-containing complexes (Figure 4A and Figure S3D, G). Binding of HthFL homodimers was not impacted, binding of Exd-HthFL heterodimers was slightly impaired, and binding of HthFL-Exd-Hox ternary complexes was affected the most. As a result, Exd-HthFL and HthFL-only sites, which are relatively low affinity in the wild-type data set, emerged as the highest affinity sites in the Exd–shape data set (Figure 4A and Figure S3D).
Figure 4: A shape readout mutant distinguishes between TF complexes in vitro and in vivo.

See also Figure S3.
(A) Classification of 12-mer DNA sequences in terms of their observed in vitro relative enrichment (Lib-Hth-R) in the presence of HthFL, Hox, and either ExdWT or Exd–shape. Points/sequences are colored according to which particular HD complex best explains their enrichment: Hth dimers (purple), Exd-HthFL (dark blue), or HthFL-Exd-Hox (low-affinity: Y5=C, NTGACNNAYNNN, coral red; or high-affinity: Y5=T, NTGATNNAYNNN; green). (B) Schematic illustrating the context dependence of binding loss due to the Exd–shape mutation. (C) To perform in vivo validation, transgenes carrying either ExdWT or Exd–shape tagged with V5 were inserted into the attp40 landing site on chromosome II in the background of endogenous Exd. (D) Tracks showing, at the Antp locus, the result of anti-V5 ChIP-seq experiments performed on third instar larval wing discs of flies homozygous for tub>exdWT-V5 (green) or tub>exd–shape-V5 (red) transgenes and endogenous Exd. Hth (orange) and Hox (Antp; blue) ChIP-seq, as well as ATAC-seq (gray) tracks are also shown for reference. Background shading indicates peaks that are strongly lost (red), mostly unaffected (gray), or partially lost (yellow) by the Exd–shape mutation. (E) Raw coverage tracks around the ExdWT-V5 ChIP-seq peak summit for IP signals from ExdWT-V5, Exd–shape-V5, Hox, and Hth, along with binding site (BS) affinity scores for Exd-Antp, and ATAC-seq signal. Peaks are ordered by the ExdWT-V5 over Exd–shape-V5 IP-signal ratio (“Exd–shape binding loss”).
Unexpectedly, this analysis also revealed a change in sequence selectivity for the trimeric HD complex containing Exd–shape: binding was less affected when the Y5 base-pair in the Exd-Hox heterodimer site (NTGAY5NNAYNNN) was C-G instead of T-A (Figure 4A and Figure S3D). Taking a closer look at the mutant motifs for the ternary complex (cf. Figure 3A) also reveals the increased preference for a cytosine base at position Y5. Interestingly, the change in base identity at Y5 only impacted the ternary HthFL-Exd-Hox complex, as no such difference was observed when SELEX-seq was performed with the Exd–shape-HthFL complex alone (Figure S3D and motif in Figure 3A), further supporting the notion that the interaction of Exd’s N-terminal arm with the minor groove differs depending on its binding partner. Notably, the T5-to-C5 transition is predicted to widen the minor groove at the position where the Hox spacer interacts with the DNA (Figure S3J). A smaller differential effect was observed at the N1 position (N1TGAYNNAYNNN) (Figure S3A,B,C,E,F,H), which can also be explained by a change in intrinsic MGW, yet is not specific to the Exd-Hox subcomplex (Figure S3I).
Taken together, these observations suggest that in parallel to optimized hydrogen-bonds with the 3 recognition helices, high-affinity binding sites for multi-protein TF complexes have an optimized DNA shape characterized by a set of MGW minima at specific positions. Losing the ability to interact with individual MGW minima affects the stability of some complexes more than others (Figure 4B).
Homeodomain complex binding behavior in vitro is recapitulated in vivo
If in vivo occupancy is governed by the same binding rules and composition-dependent sequence preferences as in vitro, we might be able to explain more of the observed in vivo binding patterns by using mutant TFs tailored to lose binding free energy contributions from a specific minor groove interaction. To test this idea, we generated transgenic fly lines that ubiquitously express a V5-tagged version of ExdWT or Exd–shape (Figure 4C; see STAR Methods). Ubiquitous expression of ExdWT-V5, but not Exd–shape-V5, fully rescued an exd null mutant, demonstrating that the two N-terminal-arm arginines are critical for viability (Figure S4A). Because the nuclear localization and therefore the activity of Exd depends on its interaction with Hth (Rieckhof et al., 1997), we confirmed that nuclear import of Exd–shape-V5 was not compromised (Figure S4B). To investigate whether lethality in Exd–shape-V5 is linked to a selective loss of distinct Exd-containing complexes, we carried out whole-genome ChIP-seq assays against the V5 tag of both ExdWT-V5 and Exd–shape-V5 (in the presence of endogenous Exd) in wing imaginal discs (Figure 4D). We also used ChIP-seq to characterize the genome-wide binding patterns of Hth and the Hox protein Antp (see STAR Methods), which is the dominant Hox protein expressed in wing discs. Visual inspection of the raw IP coverage tracks for ExdWT-V5, Exd–shape-V5, Hth, and Antp at the Antp gene locus revealed that some Exd peaks are more sensitive to the Exd shape-readout mutation than others (Figure 4D). Strikingly, the binding signal loss (defined as the ratio of ExdWT-V5 to Exd–shape-V5 coverage at each ExdWT peak summit) correlated (r = 0.37, p < 2.2×10⁻¹⁶) with predicted relative affinity for HthHM-Exd-Antp (Rastogi et al., 2018), despite the fact that multiple homeodomain complexes likely contribute to the overall Exd IP signal. This correlation confirms that selective MGW readout is also exploited in vivo. By contrast, ATAC-seq data from wing discs did not show an obvious correlation (Figure 4E).
We next focused on the subset of ExdWT-V5 peaks that contain a match to the TGAYNNAY Exd-Hox consensus site (~20% or 752 peaks total). Recapitulating our in vitro findings, the 30% of these where occupancy is reduced the most by the Exd–shape mutant are significantly more likely to have a high predicted affinity for Exd-Hox compared to the remaining 70% (p = 2.0×10⁻⁹; T-test; Figure S4C). At the same time, these peaks are significantly less likely to contain strong Hth-monomer sites (p = 3.6×10⁻³; T-test; Figure S4C), suggesting that HthFL can also stabilize Exd-Hox binding in vivo. Even more strikingly, when comparing between low-affinity Y5=C and high-affinity Y5=T for NTGAY5NNAY binding sites, the altered sequence selectivity for Exd–shape identified in vitro was recapitulated in vivo, with Antp and ExdWT preferring Y5=T over Y5=C sites, with the opposite binding preference observed for Exd–shape (p < 2.2×10⁻¹⁶ (Antp); p = 0.01 (ExdWT); p = 8.2×10−04 (Exd–shape); t-test; Figure S4D). That the difference between these two classes is more pronounced for the Antp profile than for the ExdWT profile suggests that while Exd-Hox binding is the dominant mode, Exd-Hth complexes might compete for these same sites in vivo (cf. Figure S1A), potentially contributing to the overall ExdWT IP signal and reducing the effect size.
Identification of complex composition in vivo on a genome-wide scale
Given that the stability of each type of HD complex is impacted to a different degree by the Exd–shape mutation (cf. Figure 3A,B), we reasoned that using the mutant binding loss as a diagnostic feature, along with relative affinities predicted from wild-type in vitro SELEX data, might allow us to categorize ExdWT peaks (~3,700) in terms of a particular homeodomain complex (see STAR Methods).
Using a combination of three ChIP enrichment values and three predicted binding affinity scores, each Exd peak was assigned to one of eight clusters (Figure 5A). Interpretable and distinct clusters were only obtained when ChIP coverage for both Exd–shape-V5 and Hox was included among the features (Figure S4E). Based on the average IP and binding site (BS) scores, we assigned each cluster to a particular type of complex and whether the BS was low or high affinity (Figure 5A). Importantly, the order of average Exd–shape binding loss per cluster closely recapitulated the one derived from our in vitro data in Figure 4B.
Figure 5: Attribution of binding complex composition in vivo using the Exd–shape mutant.

See also Figure S4.
(A) Classification of all ExdWT-V5 peaks based on ChIP-seq enrichment for ExdWT-V5, GFP-Antp, and Exd–shape-V5 and predicted binding site affinity for Exd-Antp, Hth-monomer, and Exd-Hth. The heatmap shows average Z-scores across all six input features for each cluster. Average Z-scores for Exd–shape binding loss and ATAC-seq signal (the latter not used for the clustering) are shown using orange-green and yellow-black color scales, respectively. The number of peaks per cluster and the assigned complex are indicated on the left. (B) Comparison of length preferences for the spacer between the Exd-Hox and Hth binding sites between in vitro and in vivo context. Estimated binding free energy for all four possible Hth configurations centered around the [Exd-Hox]F site derived from SELEX data is shown in the top panel (red-black color scheme). The middle and bottom panel indicate the 4-bp moving average binding site score for Hth centered around the highest-scoring Exd-Hox site for either the 129 trimer (middle) or 273 high-affinity Exd-Hox cases (bottom). (C) Raw tracks for IP coverage and binding affinity centered around each peak summit for all six input features, along with the ATAC-seq signal. The deduced identity of the bound complex for each cluster is indicated on the left and affinities are shown on the right.
One cluster, comprising only 129 peaks, showed high mean values for all features, indicative of the ternary HthFL-Exd-Hox complex (Figure 5A). Having identified potential trimer sites in vivo, we tested whether the differences in spacer preference we observed in vitro (cf. Figure 2A) could also be seen in vivo. To this end, we aligned all 129 trimer peaks by their highest-affinity Exd-Hox site, scored HthFL binding affinity in either orientation up- and downstream of that site, and averaged over a 4-bp moving window. Indeed, distinct spatial and orientation preferences were observed, which paralleled the in vitro trends (Figure 5B). As expected, an enhanced Hth-monomer binding affinity score was not observed for the 273 high-affinity Exd-Hox peaks (Figure 5B).
Interestingly, even though ATAC-seq signal intensity was not included as a feature in the clustering, it correlated with complex composition and configuration: Sites where Exd directly contributes to DNA binding in a head-to-tail orientation (i.e. HthHM-Exd-Hox and Exd-Hth) were less accessible than sites that contain a Hth binding site bound independently of Exd (i.e. Hth-only and HthFL-Exd-Hox; Figure 5A). This observation suggests that different TF-complexes or configurations might have opposing effects on DNA accessibility and gene expression. However, further studies will be required to rule out that tissue complexity and expression heterogeneity might contribute to the observed differences.
To estimate how many Exd peaks within each cluster of Figure 5A can be explained by one of the three distinct binding affinity models, (Exd-Antp, Exd-Hth, or Hth-monomer), we visualized the raw input features used in our unbiased clustering (Figure 5C). For 7 out of 8 clusters (comprising almost 80% of all peaks), we observed significant enrichment for at least one complex-specific sequence motif around the peak summit. Only a single cluster of peaks remained unclassified, which we refer to as motifless sites. This last cluster was also not enriched in any other sequence-specific motif when analyzed by the de novo motif discovery algorithm MEME-ChIP (see STAR Methods) (Machanick and Bailey, 2011).
The Exd–shape mutant reveals distinct biological functions for different complexes
Since the Exd–shape mutant predominantly impacts the binding of Exd-Hox complexes, we should in principle be able to identify the gene network directly controlled by Exd-Hox. To circumvent the lethality caused by the Exd–shape mutation, we tagged the endogenous Exd C-terminally with Green Fluorescent Protein (Exd-GFP) and used the deGradFP method to deplete endogenous ExdGFP protein (Caussinus and Affolter, 2016) (Figure 6A and Figure S5A). After expressing the deGradFP system for 24 hr, we performed RNA-seq on third instar imaginal wing discs of male flies that carried either a copy of tub>exdWT or of tub>exd–shape (Figure 6A). At a false discovery rate of 5% we detected 392 genes upregulated in Exd–shape relative to ExdWT, and 322 downregulated genes (Figure 6B). Among the former were exd and hth, which showed mild upregulation suggestive of an autoregulatory feedback loop for Exd-containing complexes.
Figure 6: Using Exd–shape to perturb complex-specific gene networks.

See also Figures S5 and S6.
(A) Using the Exd–shape mutation as a genetic tool to dissect the gene expression response of Exd-Hox binding loss in vivo. CRISPR-Cas9 based tagging of the endogenous Exd locus with GFP allows time-controlled removal of endogenous Exd protein using the deGradFP system in the background of either tub>exdWT-V5 or tub>exd–shape-V5 transgenes. (B) Volcano plot of the false discovery rate (FDR) versus the log2-expression-fold change in Exd–shape compared to ExdWT (reference) is shown. Genes upregulated in Exd–shape are shown in green; downregulated genes in red. (C) Using Hi-C data to assign peaks to the promoter they contact the most. Shown is a region on chromosome 2L encompassing the mid gene locus. ExdWT-V5 IP coverage track is shown above the Hi-C map at 5-kbp resolution. Promoter regions (orange) and different HD complex types are shown as colored boxes. Arrows indicate examples of contacts in 3d space between enhancers (peaks) and promoters. (D) Cumulative promoter to Exd-peak contact frequency is significantly correlated with expression log2-fold-change for upregulated (green), but not downregulated genes (red). (E) Hi-C contact maps of wild-type (including tub>exdWT-V5 transgene) wing discs for chromosome 2L showing either all chromatin contacts (left; binned at 25 Kb resolution), a selection based on the set of all Exd peaks (middle; binned at 5Kb resolution), or one based on a size-matched random sample of ATAC-seq peaks (right; binned at 5Kb resolution). Color bars above and next to each plot show the type of chromatin bin. The gene structure and raw ExdWT IP signal of the highlighted area on the Hi-C maps (yellow box) is shown below.
To map individual TF peaks to their gene promoters and identify direct targets, we generated in situ chromatin capture (Hi-C) data from wing discs (Monahan et al., 2019; Rao et al., 2014) (Figure 6C and 6E) and asked whether the cumulative contact frequency between Exd peaks and a gene promoter (within 50 kbp) might be a predictor for how the expression of a given gene responds to the Exd–shape mutation. Indeed, we observed a positive correlation between cumulative peak-promoter contact frequency and expression log-fold-change for all upregulated genes (Pearson correlation = 0.13; p = 9.4*10−13) (Figure 6D). Among downregulated genes, the same correlation was not significant ( = 0.03; p = 0.11). Upregulated but not downregulated genes also had significantly more contacts with the motif-dependent Exd peaks, regardless of complex composition (Figure S5B), suggesting that many target gene promoters may be contacted by both Hox-containing and Hox-free Exd peaks. Similar to what has been reported for Hox proteins, Exd-containing complexes might recognize their in vivo target sites by forming 3D local microenvironments with high TF concentrations, also referred to as “transcriptional hubs” (Alberti et al., 2019; Furlong and Levine, 2018; Tsai et al., 2017). Such larger molecular assemblies that can contain multiple peaks would explain the apparent overlap in regulatory networks among different Exd-containing complexes. To explore this hypothesis, we generated Hi-C maps of third-instar imaginal wing discs at 5-kbp resolution (Durand et al., 2016) (Figure 6E; see STAR Methods). Chromatin interaction frequencies for all pairs of Exd peaks extracted from these data revealed a surprising level of structure (Figure 6E). Indeed, Hi-C bins that contained Exd peaks were significantly more likely to contact each other than those containing randomly sampled and size-matched reference sets of ATAC-seq peaks (p-value = 4.9×10−54), even when the set of binned peak interactions is limited to non-duplicated genomic bins (p-value = 2.6×10⁻³², Figure S6A; see STAR Methods). This substructure in Exd-peak-derived Hi-C maps is also retained when normalizing for expected local contact frequencies using the method of (Rao et al., 2014) (Figure S6A, insets). Together, these analyses suggest that Exd-containing chromatin-bound complexes co-localize within pre-defined contact domains significantly more often than expected by chance. A prominent example of this behavior is found on chromosome 2L, where many Exd peaks cluster within a region of about 200 kbp (Figure 6E), containing genes such as no ocelli and elbow B, which are involved in eye-antennae development (Luque and Milan, 2007), and genes related to neuronal function such as pickpocket (an ion channel) and Partner of Bursicon, part of the Bursicon neurohormone dimer (Luo et al., 2005).
Despite the apparent lack of a clean spatial separation between different Exd-containing complexes and the resulting overlap of the respective gene regulatory networks they control (cf. Figure 6E), we reasoned that since Exd-Hox binding is most strongly affected by the Exd−shape mutation, changes in gene expression should be driven by the loss of this particular complex. To test this, we used our Hi-C data to identify the most frequently contacted promoter for each peak. Analyzing Gene Ontology (GO) associations showed that the genes directly contacted by Exd-Hox peaks are indeed enriched for several distinct functions that are missed when no discrimination is made among the various Exd-containing complexes (Figure 7). Among those functions were several neuronal categories, such as axon guidance, chemotaxis, and cell projection/cell morphogenesis related ones. Accordingly, the same GO categories scored significantly when taking the overlap between upregulated genes in Exd−shape and genes more highly expressed in the wild type central nervous system (CNS) compared to wild type wing discs (Figure 7). As expected, no enrichment for particular GO categories was observed for Exd-HthFL peaks, suggesting that they predominantly occur as a byproduct of overlapping gene networks. Only when the subset of genes contacted by both an Exd peak classified as “Hth-only” and one classified as “Exd-Hox” was considered, categories related to biosynthesis and metabolism emerged as enriched (Figure 7).
Figure 7: Harnessing the Exd–shape mutant to decipher complex-specific biological functions.

Contact-based promoter-peak type assignment reveals distinct functions for Exd-Antp target genes. Significance of enrichment for specific Gene Ontology (GO) categories is shown either based on all upregulated genes associated with any Exd peak (X-axis) or only those associated with a specific Exd complex. Dotted lines indicate the p-value threshold at which significance is met after accounting for multiple hypothesis testing. Bottom panel shows whether the same GO categories are significantly enriched among genes both upregulated in the Exd–shape mutant and specifically expressed in the central nervous system (CNS, dark blue) or wing disc (khaki) based on a transcriptome analysis comparing wild-type larval CNS and wing. “missed by all” highlights GO categories that were not identified when the entire set of Exd peaks was analyzed.
Surprisingly, when analyzing the gene set contacted by motifless Exd peaks we found the same functions enriched as when all Exd peaks were used without distinction (Figure 7). Taking a closer look at the raw ChIP-seq signals at motifless peaks, we found that they nevertheless displayed a wide variation in Exd–shape IP signal loss (Figure S6B), suggesting that the degree to which they are occupied by Exd might be driven by a particular Exd-containing complex, and thus depend on MGW readout to different degrees (Figure S6B). Given the high degree of spatial association among Exd-containing peaks genome-wide, we speculated that the similarity in GO category enrichment of “motifless” and “all Exd” target genes (cf. Figure 7), as well as the variable Exd–shape IP signal loss, might be a consequence of motifless sites being crosslinked to those containing a motif, perhaps as part of a nuclear hub. Supporting this notion, the IP signal loss at motifless Exd sites correlates with that at motif-dependent sites they are in contact with (Figure S6C). This correlation was improved when more than just the most contacted motif-containing peak was used in the analysis (Figure S6C). Importantly, a correlation of Exd–shape IP signal loss between randomly assigned pairs of motifless and motif-dependent peaks was not detected (Figure S6D). Together, these data are consistent with the idea that motifless sites are ChIPed because they are in close proximity to and crosslinked with motif-containing sites as part of larger molecular assemblies of Exd-containing complexes. Why and how they are recruited in the absence of a clear sequence signature should be of interest for future studies.
DISCUSSION
Accurate prediction of which DNA sequences a given TF or TF complex will bind in vivo is a hard and still unsolved problem, despite the availability of many complementary high-throughput datasets. A major reason why we fall short of this goal is that any one TF can bind a wide variety of DNA sequences with different partners. Thus, the assumption that a single binding mode captures the full range of binding behaviors in vivo is likely to be an oversimplification.
In this study we showcase how insights into this problem can be obtained by inferring structural features of multi-TF complexes from high-throughput in vitro binding data and then using this information to perturb the system in a complex-specific manner. Importantly, the mechanistic insights we obtain challenge several currently held views on the nature of TF binding, including the subordinate role that structurally ill-defined protein regions and DNA sequences lacking readily defined motifs play in TF binding site recognition and stability. Our biophysically motivated analysis of SELEX-seq data revealed that both Hth and Exd rely on DNA shape readout when they bind with other homeodomain TFs. The reliance on DNA shape recognition by Exd’s N-terminal arm in some, but not all, Exd-containing complexes is reminiscent of latent sequence specificity, where Hox proteins gain specificity when they dimerize with Exd (Slattery et al., 2011). In the observations described here, latent shape readout occurs when Exd binds with Hox but not with HthFL. Thus, in contrast to studies that use shape features to improve the prediction of genomic binding patterns (Mathelier et al., 2016; Samee et al., 2019), our approach provides insight into structural readout mechanisms that can be leveraged to design TFs with predictable binding properties – here, a TF that selectively destabilizes a particular complex both in vitro and in vivo.
Because quantitative information about any readout mechanism that contributes to DNA sequence specificity is captured in high-throughput binding assays, it is likely that this approach can be used to infer structural mechanisms and molecular configurations for other TF systems as well. As illustrated by our analysis of different Exd-containing complexes, it is possible to demonstrate causality by comparing differences in shape profiles across TF binding partners even in the absence of mutant TF data (cf. Figure 3B). Naturally occurring amino acid variations among closely related paralogs may represent another way to delineate sequence and shape readout from high-throughput binding data.
Our insight that a part of a TF that samples many configurations can differentially affect the assembly of distinct TF complexes in vitro ultimately allowed us to infer the bound complex for ~80% of all Exd ChIP-seq peaks, a significant improvement over what can typically be achieved using just a single motif. According to the current literature, the remaining 20% of sites, which lack a clear binding motif but display high accessibility, would likely be considered an artifact of ChIP-seq experiments (Baranello et al., 2016; Consortium, 2012). However, the observation that the loss of ChIP-seq signal in the Exd–shape mutant at motifless sites parallels the loss at motif-dependent sites suggests that, at least for Exd, motifless sites do not occur independently of sequence-specific binding, but may inherit their binding loss through direct interaction with other sites. Although we do not know the mechanism by which motifless sites are recruited, we speculate that intrinsic DNA properties such as increased negative electrostatic potential, DNA bending capacity, or the ability to keep regions free of nucleosomes might contribute to this phenomenon – aspects that might generally apply to TF binding in vivo.
Because the Exd–shape mutant selectively perturbs Exd-Hox gene targets, we were able to reveal complex-specific functions that are missed when all Exd peaks are analyzed (cf. Figure 7). For Exd-Hox, we found a repressive role that appears to limit the expression of genes that are normally active in the nervous system. This finding may provide an explanation for previous observations showing that although the Hox gene Antp is dispensable for wing formation, removing its activity often results in morphological abnormalities (Struhl, 1982). We also identified a common gene set controlled by Exd-Antp and Hth-only complexes – genes associated with metabolic function and biosynthesis. This finding may be relevant to the further investigation of the seemingly contradicting roles that Hox proteins and their cofactors play in the onset of cancer (Jia et al., 2018).
Lastly, the latent shape readout mechanism also appears to apply to vertebrates: The human genome encodes four highly conserved orthologs of Exd, namely Pbx1–4 (Merabet and Mann, 2016). In the mouse, where knockouts have been studied, all four pbx genes are essential for viability (Hisa et al., 2004; Machon et al., 2015; Moens and Selleri, 2006; Stankunas et al., 2008). Consequently, a complete loss-of-function (null) allele of pbx would be unlikely to contribute to human disease unless the gene was haplo-insufficient for a specific function. In contrast, a subtler perturbation of Pbx activity, analogous to the shape-defective mutation of Exd described here, could in principle contribute to human disease by interfering with the binding of specific Pbx-containing TF complexes. With this in mind, we examined several human genetics databases. Notably, missense mutations in Pbx1–3 homeodomains are underrepresented in healthy populations [http://gnomad.broadinstitute.org; (Lek et al., 2016)], consistent with the essential function of these DBDs. An interesting exception are de novo mutations of N-terminal arm arginines of Pbx1 that are present in several patients diagnosed with congenital anomalies of the kidney and urinary tract syndrome (CAKUTHED; (https://www.omim.org/) (Heidet et al., 2017; Slavotinek et al., 2017): Three patients had a mutation in either the R2 (1x) or R3 (2x) arginines of Pbx1, equivalent to the ones mutated here in Exd. These Pbx1 mutants were also defective in their ability to activate a reporter gene harboring a perfect Exd-Hth binding site (Slavotinek et al., 2017). We speculate that these human pbx1 alleles are essentially DNA shape readout defective mutants of Pbx1 and, as a result, are compromised in the binding of a particular subset of Pbx1-containing TF complexes to their respective binding sites, resulting in the highly specific CAKUTHED syndrome.
STAR Methods
LEAD CONTACT AND MATERIALS AVAILABILITY
Further information and request for resources and reagents should be directed to the Lead Contact Richard S. Mann (rsm10@columbia.edu). All fly lines and protein plasmids generated in this study are available from the Lead Contact without restrictions.
EXPERIMENTAL MODEL AND SUBJECT DETAILS
Bacteria Growth Conditions
For recombinant protein purification BL21 (DE3) competent cells were inoculated and grown for 2 hours at 37° C before IPTG induction. Cells were harvested 4–5 hours after induction.
All electromobility shift assays (EMSAs) were performed using 2 nM radiolabeled DNA and protein concentration between 75–900 nM. Purified proteins were incubated for at least 30 min prior to loading in binding buffer (final concentration: 2% Glycerol, 30 μg/μl polydIdC, 40 mM NaCl, 40 mM Tris pH=8.0, 0.4 mM MgCl2, 1mM DTT, 0.5 mM EDTA). After loading onto a 5% TBE gel, gels were run at 4°C for 2h in 0.5x Tris-running buffer.
Fly husbandry
For ChIP-seq, ATAC-seq and Hi-C experiments, transgenic or wild-type fly lines were kept at 25°C on molasses fly food. For deGradGP RNA-seq experiments, flies were raised at 18°C and shifted to 29° C for 24 hours before wing disc dissection.
METHOD DETAILS
Protein purification and mutagenesis
Fly proteins were obtained and purified as described in (Slattery, 2011). Briefly, PET-expression vectors containing coding regions for full-length hth (Uniprot-ID: O46339), exd (Uniprot-ID: P40427), dfd (Uniprot-ID: P07548) and Hth HM-domain (amino acids 1–242; (Uniprot-ID: O46339) with hexa-histidine tags (except for Exd, which was co-purified with full-length Hth or HM-domain-only Hth) were transformed into Bl21 cells. Cells were grown for 5–7 hours, lysed, and proteins extracted with affinity purification using Cobalt-Talon beads (Clontech). Site-directed mutagenesis for Exd and Hth was performed by amplifying the original plasmid with primers harboring single amino acid replacements (arginine to alanine) using Taq-polymerase (NEB). Double and triple mutations were generated sequentially. See Key Resources Table for all generated mutations.
Binding and competition assays
Protein concentrations in Electromobility shift assays (EMSAs) were as follows: Dfd was kept constant at 150 nM; wild-type HthFL-Exd and HthHM-Exd was used at 100 nM; mutant proteins were increased from 75 nM to 300 nM (two lanes) or up to 900 nM (three lanes) (Figure 3C and Figure SF2). For competition assays, a radio-labeled probe was competed out with increasing concentrations of unlabeled competitor DNA while keeping protein concentrations constant (100 nM). Dose-response curves and IC50 values were obtained using the R package drc. Spacers with zero, three and seven bases between the Hth and Exd-Dfd sites were tested (see Key Resources Table).
SELEX Library Design
The Lib-16 library contained a 16-mer random flank without fixed binding sites and data for HthHM-Exd-Dfd were taken from Slattery et al. (Slattery et al., 2011). The data for the HthFL-Exd SELEX-experiment were generated using a Lib-16 library as well, but following the design described in (Kribelbauer et al., 2017). The Lib-Hth-F and Lib-Hth-R libraries contained a fixed Hth site –TGACAG in forward (F) and CTGTCA in reverse (R) orientation – immediately followed by a 21-bp random region. Library Lib-30 had a 30-bp random region and no fixed binding sites. Full library sequences are listed in (Key Resources Table). Libraries of different length and with fixed Hth binding sites were designed to facilitate the inference of binding models for TF complexes with variable configurations and large DNA footprints (>12bp). The high complexity of the 30-mer library, where all complexes can form freely, prevents direct analysis of shape preferences for individual complexes due to insufficient counts per complex composition and complex configuration.
SELEX experiments
For Lib-Hth-F, Lib-Hth-R, and Lib-30, SELEX experiments were carried out using wild-type or mutant homeodomain proteins following the experimental procedures described in (Riley et al., 2014; Slattery et al., 2011). In brief, TFs were incubated with SELEX libraries and loaded onto EMSA gels. The TF-bound fraction was isolated from the gel, amplified and either subjected to another round of enrichment or prepared for sequencing. Two rounds of enrichment were performed for each set of experiments. For the HthFL-Exd and HthFl-Exd–shape SELEX-experiments using Lib-16, a single round of selection was performed using the library design described in (Kribelbauer et al., 2017) (see Key Resources Table for library sequence). Data for HthHM-Exd-Hox were obtained from a previous study (Slattery, 2011). For each experiment, proteins of a final concentration of ~50 nM were assembled and incubated with excess DNA (10–20 fold) for 30 minutes. After each round of selection, the DNA was extracted from the gel amplified by either using Ilumina’s small RNA primer sets or the set of primers described in (Kribelbauer et al., 2017). Sequencing barcodes were added in a five cycle PCR step and the final library was gel-purified using a native TBE-gel before sequencing.
Sequencing and data processing
Libraries for HthFL-Exd and HthFL-ExdR2A,R5A (Lib-16) were sequenced using a v2 75-cycle high-output kit on an Illumina NEXTSeq Series desktop sequencer at the Genome Center at Columbia University. Libraries Lib-Hth-F and Lib-Hth-R with either Hth or Exd shape-readout mutant in complex with the respective other wild-type protein and Dfd, as well as the Lib-30 HthFL-Exd-Dfd experiment were all sequenced at the New York Genome Center using separate lanes on an Illumina HiSeq 2000 sequencing machine. Libraries Lib-Hth-F and Lib-Hth-R with wild-type proteins were also sequenced on a HiSeq instrument at a different facility. Libraries were trimmed to remove Illumina- and library-internal adapter sequences using the FASTX toolkit (Hanon lab) and loaded into the R environment using the R package named SELEX (http://bioconductor.org/packages/SELEX) (Riley, 2014).
Computational analysis of complex configuration
Relative enrichment tables for all libraries were generated using the SELEX package. To color the individual oligomers based on the complex composition most likely explaining their enrichment, position-specific-affinity matrices were generated for HthHM-Exd-Dfd using a 12-mer seed sequence from Lib-16 (12-mer with highest enrichment), for HthFL-Exd using a 10-mer or 12-mer seed (TGATTGACAG or TTGATTGACAGC), and for dimeric HthFL using a 12-mer seed (TGACAGCTGTCA; Lib-30). Each sequence from each respective library was then scored with the different PSAMs and complex composition assigned based on the PSAM achieving the highest score. To remove shifted binding sites that do not encompass the full TF footprint, only sequences with a relative affinity score > 0.01 for one of the three PSAMs were retained.
To test for preferences in complex orientation with respect to the fixed Hth site in the Lib-Hth-(F/R) libraries, overall 12-mer relative enrichment tables were generated as described above and forward or reverse-complement orientation assigned by comparing the relative enrichment of each 12-mer to that of its reverse complement. Sequences with a higher score for the forward strand (as obtained from the sequencing run) were designated as [Exd-Hox]F and sequences with a higher score for their reverse complement as [Exd-Hox]R. Average F/R ratios for Lib-16 (HthHM-Exd-Dfd) and Lib-Hth(F/R) were shown as boxplots (Figure S1C).
To account for varying offsets of the Exd-Hox binding site, 12-mer enrichment tables were generated for each offset respectively (using the SELEX function selex.affinities(…, offset=x) with x=0 to 9) and F and R orientation assigned as described above. To test for sequence preferences within the DNA spacer connecting the Hth and Exd binding sites, 16-mer enrichments of sequences right downstream of the fixed Hth site of Lib-Hth(F/R) (offset = 0) were computed and sequences isolated that matched the top Exd-Hox binding site (ATGATTAATGAC) at position 5–16. A+T content of the variable 4bp spacer sequence was computed and compared to the relative enrichment of each 16-mer (spacer) sequence (Figure S1F).
For the comparison of k-mer based relative enrichment plots between wild-type and shape-readout-mutant SELEX libraries, each sequence was assigned an F or R orientation as described above, as well as a representative complex that best explained the sequence signature (using PSAMs, see above). In addition, Exd-Hox type sequences were split based on the Y5 (C or T) or the N1 (A,C,G,T) base identity within the consensus 12-mer binding sites (NTGAYNNAYNNN; Figure 4A and Figure S3). For representation purposes, only sequences in F orientation and with a PSAM score > 0.005 were shown. Sequences that had similar scores (less than 3-fold difference) for more than one PSAM, or that did not match the respective Y5 pattern (e.g. due to a partial motif), were labeled ambiguous and colored separately (grey).
Feature-based modeling using GLM
To model the relative orientation and offset preferences for the Exd-Hox subcomplex within the HthFL-Exd-Hox ternary complex quantitatively in a unified model, each 21-bp probe sequence (including 2 bp of flanking sequence) was first scored on both strands with a PSAM obtained from the HthHM-Exd-Dfd data set from Lib-16. Only probes for which a single binding site solely accounted for >95% (the “confidence” value) of the probe selection were retained. A similar procedure was described in (Zhang et al., 2018). Probes with identical 12-mer Exd-Hox sequences, spacer length, and assigned orientation were collapsed to one entry in the design matrix and their individual counts were added up. The collapsed R2 counts were used as dependent variables in the generalized linear model, log-transformed corresponding R1 counts were used as an offset and both log-transformed Lib-16 derived relative enrichments for the Exd-Hox subcomplex and the overall configuration, as defined by the combination of spacer length and the orientation of Exd-Hox ([Exd-Hox]F or [Exd-Hox]R) were used as predictors/features in the model. The model was fit using the R function glm(…, family=poisson) based on the following model, where Si represents the sequence of the Exd-Hox 12-mer with a specific configuration:
Here is an indicator function that is implicitly dependent on the Exd-Hox binding model and takes on the value of 1 if probe sequence S corresponds to configuration c and equals 0 otherwise; is the corresponding coefficient that models the binding free energy contribution for configuration c; furthermore represents the predicted binding free energy of the optimal 12-bp Exd-Hox binding sites within probe S; the expected value of the corresponding coefficient βExdHox equals 1.
Oligomer-based models for sequence preferences within the spacer were obtained using the same modeling framework. The full set of confidence-filtered probes was first partitioned by offset (spacer length) and orientation. Choosing a specific offset L (e.g. spacer of length L=4) and orientation (e.g. Hth-spacer-[Exd-Hpx]R), sequences identical over L+12 bases where first collapsed and the total R2 occurrence was used as the response variable in the model. The log-transformed Markov model predictions for the R0 initial bias of each (L+12)-mer was used as an offset and the spacer sequence and the relative enrichment value for each 12-mer, were used as predictors, resulting in 4L + 1 model predictors.
For the mononucleotide models, the oligomers were represented by 4∗(L+12) base identity indicators, reducing the parameter space:
Here Ij,b(Sprobe) = 0,1 is an indicator function for the presence of base b at nucleotide position j within the probe variable region. Model comparisons were performed by computing the R2 (based on a linear model) between the spacer coefficients from the oligomer model and the sum of the base coefficient covering the analogous spacer sequence in the mononucleotide model (Figure S1I).
Models with fixed N1N2 base identity were obtained by further subsetting the probes, such that the Exd-Hox binding site would start with AT (see optimal 12-mer sequence). Fixing the first two positions allows isolating shape-dependent sequence selection within the spacer from effects due to readout occurring within the core Exd-Hox binding site. Mononucleotide models were fit for different spacer lengths as described above, while excluding the first two base positions within the Exd-Hox site from the feature set.
Affinity-shape correlation
To identify whether shape might be responsible for the observed spacer selection, we first computed the mononucleotide-model-based prediction of ΔΔG(Sprobe)/RT for each possible sequence of a spacer of length L followed by a 12-bp Exd-Hox site (requiring a confidence value > 90% this time). We next used a pentamer table (Zhou et al., 2015) to predict the profile of minor groove width along each sequence. Note that in all plots the first two bases within the Exd binding site (N1N2) were fixed to AT – the optimal choice – to isolate TF shape preferences within the spacer/flanks from those within the Exd-Hox partial binding site. This is necessary as shape features are computed using pentamer tables, which means that any shape readout within the spacer is conditioned on the identity of upstream bases. A change in neighboring base identity might result in a new protein conformation with a distinct shape preference. For that reason, we also extended spacer sequences 5’ of the fixed Hth binding site present in the flanks of Lib-Hth-(F/R). The resulting MGW profiles for all sequences were ranked by their ΔΔG(Sprobe)/RT and average MGW profiles were obtained along sets of sequences. To test for a role of MGW in selection, we first computed the average MGW profile including all spacers, setting a reference point of random or no selection. We then subsequently increased the threshold for spacers included in the analysis based on their ΔΔG(spacer)/RT ranking and recomputed the average MGW profile on the reduced set. Sequentially removing “bad” spacers from the pool should reveal any preference for a specific MGW profile, as it mimics the underlying, biophysical selection process. Since no meaningful flank is present for the HthHM-Exd-Hox and Exd-HthFL complexes, mononucleotide feature models were also obtained from the R2 or R1 counts of sequences with the core binding site extended by 6bp (HthHM-Exd-Hox; including the library flank) or 4bp (Exd-HthFL; limited by sequencing depth) up- or downstream (Figure 3B).
Structural interpretation
Structural representations (superimpositions) were obtained with the align function in pymol, using the DNA or one of the proteins (Figure 2C and Figure S2E) as the template. Extended B-DNA with sequences accommodating the respective homeodomains and spacers were generated with the Nucleic Acid Builder webserver (Macke, 1998) (http://structure.usc.edu/make-na/server.html).
Generation of transgenic and CRISPR-Cas9 fly lines
The full-length cDNA sequence for either the wild type or the R2A,R5A mutant Exd (obtained by PCR from the protein-expression vectors), followed 3’ (C-terminally to the protein) by the sequence coding for the small V5 peptide, was ligated into the multiple cloning site (MSC) of a vector with attB sites for ϕC31-mediated integration. The vector contained a tubulin (Tub) promoter and a poly-adenylation signal surrounding the MSC. Purified vectors were sent for injection into the attp40 site on chromosome 2L, additionally marked with w+. The resulting flies were crossed with respective balancer males or females (sp/CyO; MKRS/TM2) and transgenes were tested for their ability to rescue an exd null allele.
For Antp ChIP-seq experiments, a GFP-tag was fused in frame into the endogenous Antp locus at its N-terminus (details upon request; Feng et al., in preparation), resulting in homozygous viable GFP-Antp flies.
Fly lines carrying endogenous Exd with a C-terminal Green Fluorescent Protein (GFP) tag were ordered from Rainbow, using their CRISPR-based protein tagging service. The final line harbors a GFP directly fused to the last coding amino acid of Exd, followed by an SV40-poly(A) signal and a DsRed Express cassette for easy screening. Progeny obtained from the initial red fluorescent screen were homozygous viable. Fly lines used for RNA-seq experiments were the result of a cross between i) female flies homozygous for both Exd-GFP (X chromosome) and a temperature-sensitive Tub-GAL80ts-UAS-deGradFP (Caussinus and Affolter, 2016) (2nd chromosome) and ii) male flies carrying either Tub-ExdWT-V5 or Tub-Exd−shape -V5 transgene on the second and an enhancer-trap into the headcase locus driving Gal4 (hdc-G4) on the third chromosome over C(2L;3R),Tb. Flies selected for RNA-seq were males of the following genotype: Exd-GFP/Y; Tub-Gal80ts-UAS-DeGrad/Tub-ExdWT or -shape-V5; hdc-G4/+.
Immunohistochemistry
The following antibodies for immunohistochemistry were used: rabbit anti-Exd (Abu-Shaar and Mann, 1998), mouse anti-V5 (Invitrogen, R960–25), guinea-pig anti-Hth (Ryoo et al., 1999), mouse anti-Antp (DDHB. C811), rabbit anti-GFP (Invitrogen, A-11122). Imaginal wing discs were collected from third instar larva, fixed in 4% formaldehyde for 25 minutes and stained with the antibody overnight in a 1:500 dilution. Discs were imaged at 20x magnification using confocal microscopy and processed using ImageJ software.
ChIP-seq
The following antibodies were used in ChIP-seq experiments: mouse anti-V5 (Invitrogen, R960–25), rabbit anti-GFP (Invitrogen A-11122) for Antp-GFP, guinea-pig anti-Hth (raised against the N-terminus of Hth; GP52)(Ryoo et al., 1999). About ~ 100 third instar larval wing discs were used for each ChIP-seq sample. All buffers contained protease inhibitor (cOmplete, Roche). Inverted larvae were cross-linked at room temperature (RT) for 10 min in 10 ml 1% formaldehyde solution buffered with 50mM HEPES (pH=8.0), immediately quenched with 1 ml 2.5M Glycine and washed for 5 minutes in quench-solution (125 mM glycine, in 1X PBS and 0.01% Triton X-100). Inverted and cross-linked larvae were washed twice with Buffer A (10mM HEPES, pH=8.0; 10mM EDTA, pH=8.0, 0.5mM EGTA, pH=8.0; 0.025 % Triton-X) and twice with Buffer B (10mM HEPES, pH=8.0; 200mM NaCl, 1mM EDTA, pH=8.0; 0.5mM EGTA, 0.01 % Triton X-100). Wing discs were detached on ice in Buffer B and transferred into a final volume of 1 ml Buffer C (10mM HEPES, pH=8.0; 1mM EDTA, pH=8.0; 0.5mM EGTA, pH=8.0). Chromatin was sheared into fragments by using a probe sonicator at 15 % amplitude (total time: 12 min with 15 seconds on and 40 second off intervals) and flash-frozen in liquid nitrogen for storage at −80°C until further processing (no more than one week). Sheared chromatin was diluted in 5X RIPA dilution buffer (1x RIPA: 140mM NaCl; 10mM HEPES, pH=8.0; 1mM EDTA, pH=8.0; 1 % Glycerol; 1% Triton X-100; 0.1% DOC) and blocked with 10 μg of the respective IgG-coated magnetic beads (Dynabeads, ThermoFisher) for 1h at 4°C. Beads were removed with a magnetic stand and supernatant was transferred into a new, lowbinding tube. At this point, 10 % of the sample was set aside to serve as an input control. Specific antibody (10 μg for mouse anti-V5, 8 μg for rabbit anti-GFP and 3–4 μg for the Hth antibody) and 1% of Bovine Serum Albumine (BSA) was added to the remaining chromatin and incubated overnight (o/n) at 4°C. The next day, ~30 μg of IgG-coated and pre-blocked (with 1 % BSA) Dynabeads were added to each chromatin antibody solution and incubated for another 2 hours at 4°C. Antibody-bound TF-chromatin complexes were isolated by magnetic separation (5 min on a magnetic stand) and beads were washed twice with 1x RIPA, once with high salt RIPA (500mM NaCl), once with LiCl-Buffer and once with TE (10 mM Tris-Base, pH=8.0; 1mM EDTA, pH=8.0). Bead-bound chromatin and the input sample were redissolved in 0.5 ml Elution-Buffer (TE with 0.5 % Sodium Dodecyl Sulfate (SDS) and 50mM NaCl) and incubated for 30 min at 37°C with RNase, followed by 2 hours at 55°C with proteinase K (ThermoFisher). Remaining DNA-protein complexes were decrosslinked by incubating for 16 hours at 65°C. DNA was separated from the Dynabeads by magnetic separation and purified by phenol:chloroform extraction and DNA precipitation using 1x volume of isopropanol in 100 mM ammonium acetate and adding 1 μl glycogen. Precipitated DNA was redissolved in 30 μl TE.
ATAC-seq
Wing imaginal discs of third instar larvae were dissected from a lab stock of yw genotype in Phosphate-Buffered-Saline. Discs were washed in nuclear extraction buffer (NEB, 10nM HEPES pH. 7.5, 2.5mM MgCL2, 10mM KCl) and placed in a 1mL dounce homogenizer (Wheaton) on ice. Discs were treated with 15 strokes of the loose pestle, followed by a 10-minute incubation on ice, then 20 strokes of the tight pestle. Nuclei were counted using a hemocytometer, and 50,000 nuclei were transferred to a fresh Eppendorf containing 1mL of NEB buffer +0.1% tween-20. Following a brief mixing the nuclei were immediately pelleted for 10 min at a speed of 1000xg. The pellet was re-suspended in ATAC transposition buffer as in (Buenrostro et al., 2015) and tagmentation was carried out as previously described (Buenrostro et al., 2015). Amplified libraries were purified, and size-selected using double-sided ampureXP (Beckman) size selection.
In situ Hi-C
Wing imaginal discs of third instar larvae homozygous for both endogenous and tub>exdWT-V5 were dissected in PBS (with 0.5% Bovine Serum Albumin (BSA)). Discs were transferred to 1x Schneider’s Drosophila medium (Gibco) and pelleted at 300g. A single-cell suspension was generated by incubating the discs for 15 min at RT in 200 μl of Schneider’s medium containing 1 μg/ml of papain enzyme. The dissociation reaction was quenched by adding 800 μl of Schneider’s medium with 10% Fetal Bovine Serum (FBS) and pipetting up and down at least 10 times. The cell suspension was pelleted at 600g (5 min at 4°C). Immediately after the dissociation, cells were cross-linked for 10 min (RT) in 1% methanol-free formaldehyde solution. For all subsequent steps, the protocol described in (Monahan et al., 2019) was followed using the restriction enzyme DpnII and Ovation’s Ultralow System V2 for library preparation.
RNA-seq
Crosses to obtain flies with transgenic Exd being the dominant source of Exd were set up as described above and raised at 18°C. 24 hours before RNA isolation, larvae were shifted to 29°C. 2–4 wing discs of third instar, male, wandering, non-Tb larvae were obtained for each deGradFP RNA-seq experiment. For wild-type, larval central nervous system and wing disc RNA-seq samples, flies were raised at 25°C and 4–5 third instar wandering larvae were used per sample (3 replicates each). Discs were dissected on ice in BPS with 0.5% BSA and transferred to 350 μl of RLT buffer (Qiagen) with 1% β-mercaptoethanol (BME). Discs were homogenized with a plastic pestle and frozen at −20°C (no more than 1 week). To each sample 100 μl PBS and 250 μl Ethanol was added, and RNA was purified using the Qiagen RNeasy mini kit (Qiagen 74104). RNA was next treated with DNaseI (NEB) for 30 min at 37 °C, followed by another column purification using Qiagen’s RNeasy micro kit (Qiagen 74004). RNA quality was assessed with a RNA Pico Chip (Agilent) on a Bioanalyzer and only non-degraded samples were used for subsequent library generation. RNA-seq libraries were prepared using NEB’s NEBNext Ultra II Directional RNA Library Prep Kit for Illumina Sequencing (NEB EE7760S) and following the instructions for the poly(A) mRNA magnetic Isolation Module. AMPure XP beads (Beckman Coulter) were used for DNA library size-selection. DNA library quality was assessed with a High Sensitivity DNA ChIP (Agilent) on a Bioanalyzer and quantification was performed using a Qubit fluorometer. Two replicates were obtained for the Exd–shape experiments and three replicates each for the CNS and wing-disc RNA-seq samples.
ChIP-seq Library Preparation
ChIP-seq libraries were constructed using the NEBNext Ultra DNA Library Prep Kit for Illumina with NEBNext Mulitplex Oligos (one separate index per sample) following standard instructions. For the PCR amplification, 13–15 cycles were used depending on the amount of starting material, which was generally between 3–10 ng of precipitated DNA. For the input samples no more than 10 ng of DNA was used to match input and IP samples as closely as possible. For the final size selection, AMPure xp beads (Agencourt) were used and larger (>550bp) and smaller (<150bp) fragments were removed by a double-sided size selection with first 0.6x volume of beads to DNA and retaining the supernatant, followed by a final concentration of 0.9x beads to DNA and retaining the DNA-bound to the beads. Quality control was done by assessing the DNA size distribution with a Bioanalyzer. ChIP-seq, ATAC-seq, RNA-seq and Hi-C libraries were diluted to 2 nM, using a Qubit to verify the final concentration, pooled and sequenced with a v2 75 or a 150 cycle high-output kit using either single-end (ChIP-seq, ATAC-seq) or paired-end (RNA-seq, HiC) settings on an Illumina NEXTSeq Series desktop sequencer at Columbia University.
ChIP-seq and ATAC-seq data processing
The four separate, raw fastq-files (from the four lanes of the sequencing run) were first collapsed into one file and subsequently aligned (bowtie2)(Langmead and Salzberg, 2012) to the D. melanogaster genome version dm6 (2014, GenBank accession: GCA_000001215.4). Sequencing statistics and alignment rates are reported in Table S1. Aligned sam files were next converted into bam files, sorted and cleared from duplicate reads using the samtools functions view, sort and rmdup (Li, 2011; Li et al., 2009). The sorted, unique bam files were indexed and converted into bigwig files using the bamCoverage function in the Deeptools suite with parameters -bs 1 -e 125 (Ramirez et al., 2014). For ChiP-seq, peaks were called using the MACS2 (Zhang et al., 2008) function callpeak using the input samples as control files with parameters -g dm -q 0.01 or 0.05 --nomodel --extsize 125. For further downstream analysis, peak summits from the more deeply sequenced ExdWT-V5 ChIP replicate with a q-value threshold of 0.01 were used.
Hi-C data processing
The four separate, raw fastq-files were first collapsed into one file. For downstream data processing the Juicer Tools Version 1.76 pipeline5 was used (Durand et al., 2016). The DpnII restriction site file was generated using the Drosophila genome version dm6 and the python script provided by Juicer Tools. The highest resolution to create the .hic file was set to 5 Kb. To remove multi-mappers, only reads meeting the MAPQ>30 cutoff were used. The number of sequenced reads and the alignment rate are reported in Table S1. For this study only intrachromosomal contacts were considered. Contacts were dumped using the contact extraction tool Straw (Durand et al., 2016) with normalization method VC (vanilla coverage) at 25 Kb and 5Kb resolution. In addition, the function “dump” from the Juicer Tools toolkit was used to extract contact matrices normalized for pair-wise distance by using the observed/expected option (dump -oe -NONE). Binned Hi-C contacts were loaded into R for further data analysis.
RNA-seq data processing and analysis
The four separate, raw fastq-files (from the four lanes of the sequencing run) were first collapsed into one file and subsequently aligned with hisat2 (Kim et al., 2015) to the D. melanogaster genome version dm6 (2014, GenBank accession: GCA_000001215.4). Sequencing statistics and alignment rates are reported in Table S1. To obtain information on preferential promoter usage (across different isoforms), the RNA-seq data were also aligned to the most recent transcript assembly (ENSEMBL) using the program Salmon (Patro et al., 2017). Differential gene expression was analyzed in R using packages Rsubread (Liao et al., 2019) and DESeq2 (Love et al., 2014). Only genes with at least 50 counts in either ExdWT or Exd-shape sample were used (total of ~ 8500 genes). Volcano plots were generated by using a false discovery rate (FDR) of 5% for differentially expressed genes and using the DESeq2 empirical bayes shrinkage method for fold-change estimation (Love et al., 2014). For the association of contact frequency and fold change expression the same method was used.
Coverage Plots and Downstream Peak Analysis
Heatmaps for the raw IP coverage of the four ChIP-seq samples and ATAC-seq sample (ExdR2A,R5A-V5, ExdWT-V5, Antp-GFP, Hth, ATAC-seq) were generated on the Exd peak set sorted by the ExdWT-V5/Exd–shape-V5 IP-ratio using the Deeptools functions computeMatrix and plotHeatmap (parameters: --sortRegions “no” --refPointLabel --missingDataColor 1). Raw read coverage was extracted at the Exd peak summits (-q-value = 0.01) from the bigwig files for all ChIP samples. Further comparisons between ExdWT-V5 and Exd–shape-V5 were based on the combined coverage of both replicates. For each Exd peak, sequences surrounding the peak summit (±50bp) were extracted. Each peak sequence was then scanned with i) an Exd-Antp binding model (obtained by fitting a No Read Left Behind (NRLB) model (Rastogi et al., 2018) to the Lib-16 data set for HthHM-Exd-Antp, ii) an Exd-Hth model (obtained by fitting a NRLB model to the Lib-16 data for HthFL-Exd), and iii) a Hth-only model (PSAM model derived from Lib-30, using TTGACAGC as a seed). For each model view (in total there are [100-(number of positions specified by the model) +1] possible binding sites in each 100bp peak sequence), the score was computed for the “+” and “−“ strand respectively and only the maximum of the two was considered for each view. The cumulative peak score for each model was computed by summing up the scores across all views, with the score for any specific view v in terms of the underlying sequence Sv defined by:
Testing for the stabilizing role of the Hth homeodomain to Exd-Hox sites was done by first considering the subset of peaks with a high confidence Exd-Hox site, a match to the consensus 12-mer NTGAYNNAYNNN (752 peaks). Next the subset of Exd-Hox peaks was split into the 30% of peaks with the strongest loss of Exd–shape binding and the remaining 70% of less lost peaks. Both the cumulative Exd-Hox peak score as well as the affinity of the highest scoring Hth site (excluding the highest scoring Exd-Hox site) were compared between the two sets (t.test; 30% versus 70%). For the comparison between “high affinity” (Y5=T) and “low affinity” (Y5=C) sites, peaks were scanned for motif matches for NTGAY5NNAYNNN (752 peaks) and subdivided based on the identity of the Y5 position (T or C). The t-distribution was used to test for significant differences in the IP-coverage for Antp-GFP, ExdWT-V5, and Exd–shape-V5 between the two affinity classes.
For de novo motif discovery using MEME-ChIP, 300 bp centered around the summits of all 852 motifless sites were used as input together with 852 control regions that were taken 1kb away from the original peak coordinates. MEME-ChIP was run in “differential enrichment mode” using the combined Drosophila datasets and default settings.
Clustering and peak to gene assignment
To cluster peaks based on their potential complex composition, 6 input features were considered: (i-iii) raw IP enrichment for ExdWT-V5, Exd–shape-V5, AntpGFP, and (iv-vi) peak scores for Exd-Antp, Exd-Hth (both NRLB models), and Hth-only (PSAM model). The resulting peak by feature table, was then transformed into standard scores (Z-scores) prior to cluster analysis. To cluster peaks on the 6 input features, the R package ‘flexclust’ was used with function cclust (method = “neuralgas”, k = 8). Eight clusters were chosen to allow for capturing of all possible complexes in addition to affinity differences and potentially unknown modes or accessibility driven, non-specific binding. Complex composition was assigned based on considering the average feature score for each cluster, as well as the degree of signal loss and peak accessibility (ATAC-seq; not included in the clustering).
Hi-C data analysis
To visualize Hi-C contacts among Exd peak sets, all 5Kb genomic bins containing a peak were extracted, and analyzed in two distinct ways: i) a 5kb bin was assigned to each Exd peak, resulting in duplicate Hi-C bins whenever multiple peaks fell within the same bin, yet maintaining one interaction per peak (Figure 6E); ii) only unique Hi-C bins were retained, regardless of how many Exd peaks were associated with them (Figure S6A). In the same manner, random, size matched controls were generated by sub-sampling from the entire set of ATAC-seq peaks (~20,000). To compute p-values, at least 50 such random size-matched samples were generated. Average Hi-C contact frequencies were obtained by simply taking the mean across all 5Kb binned Hi-C contacts for a particular peak set. In addition, normalized Hi-C contact maps were generated using the observed over expected method reported by (Rao et al., 2014) (Figure S6A, insets). To generate an average Exd–shape binding loss for motifless Exd binding sites based on their connectivity with motif-dependent Exd binding sites, three approaches were used: i) the Exd–shape binding loss at the site with the highest interaction frequency with each specific motifless site was used; ii) the average Exd–shape binding loss was computed from all sites that had a Vanilla Coverage corrected Hi-C interaction frequency of at least 10 (including contacts below this threshold results in continuously decreasing correlations). Averaging of Exd–shape IP signal loss was done by taking the log2 value of the interaction frequency between motif-dependent and motifless sites as a weight; iii) the average Exd–shape binding loss was computed from random associations of motifless and motif-dependent sites on the same chromosome. In this last approach, the number of motif-dependent peaks for each motifless site was kept identical to that of approach ii). Correlations between the Exd–shape IP signal loss at a motifless sites and those computed under i), ii), or iii) were calculated with the R function cor.test using method=”spearman”. The computation of p-values for correlations under approach i) and ii) compared to those under iii) was done by repeating step iii) 100 times to generate a distribution of expected random correlations.
To assign peaks to a promoter the vanilla coverage (VC) normalized contact frequency for each peak across all promoters in the RNA-seq data set was computed. To simplify the analysis, only one promoter per gene (in case of multiple isoforms) was considered; the choice of promoter is based on whether a specific isoform was itself differentially expressed or (if not) whichever isoform had highest expression levels. The highest scoring peak-promoter interactions were then taken as the most likely target gene for each peak. To determine whether an individual promoter is significantly contacted by any of the five Exd peak types, the cumulative peak-promoter contact frequency within ± 50 Kb of the promoter was computed for each peak type separately. To determine which promoter had above expected contact frequency, p-values were computed based on a Wilcoxon test using the cumulative promoter-peak type contacts.
To test for a general connection between promoter-Exd peak interactions, the cumulative Exd peak- promoter VC contact frequency within ± 50 Kb of the promoter was extracted from the Hi-C data. Pearson correlation was next computed between the log2-gene-expression-fold change and the cumulative contact frequency. For visualization, promoters were split into equally sized bins (in 5 percent increments) based on the cumulative contact frequency (Figure 6D).
Gene Ontology analysis
Gene Ontology (GO) analysis was performed using the R package goseq (Young et al., 2010). Tests were performed using the set of promoters that were both upregulated (5% FDR) and had an associated Exd peak, based on the maximum contact peak-to-promoter method described above. To test for contributions of individual complexes, only those promoters associated with a specific complex were used. Only GO categories with less than 1500 genes that scored significant in at least one of the complex-specific or all Exd gene sets (after correcting for multiple hypothesis testing) were considered for visualization. To test whether the enriched GO categories overlap with central nervous system (CNS)- or wing-specific functions, GO analysis was also performed on the intersection between upregulated genes in Exd–shape and i) the geneset upregulated in the CNS or ii) in wing discs from a transcriptome comparison of wild-type tissues (for genotype information see above). If a GO category scored significant in one of the two latter genesets it was colored as CNS- or wing-specific respectively.
QUANTIFICATION AND STATISTICAL ANALYSIS
Image quantification competition assays
Raw images were quantified using ImageJ and the fraction bound (normalized to no competitor lane) plotted against the log protein concentration. IC50 values with standard deviations are shown in Figure SF 1E and represent the protein concentration (in nM) at which the initial bound fraction is reduced in half.
Configurational free energy estimates
The Hth-Exd-Dfd configurational free energy estimates displayed in Figure 2A represent the coefficients as obtained from the GLM fit. P-values for energy estimate as obtained by the GLM fit were significant defined by a p.val < 0.05.
Statistical analysis of in vivo results
Correlation estimates and p-values are provided in each figure. For Figure SF4C and SF4D, the statistical test was based on a standard student t-test. For Figure S5B a Wilcox test was performed, with p-values indicated by pwc. For RNA-seq data the threshold for significantly up- or down-regulated genes was set at a 5% False Discovery Rate. The null distribution for the correlation of ExdWT/Exd–shape IP signal ratios between motifless and motif-dependent Exd peaks was generated as follows: For each motifless peak one or more motif-dependent peaks (matched to the true number of interacting peaks) located on the same chromosome were randomly assigned and the correlation for ExdWT/Exd–shape IP signal loss across all pairs was computed. In total, 100 such sampled correlations were generated. The distribution of randomly sampled correlations was then used to determine the probability of observing the true correlation between motifless and motif-dependent pairs (using the Hi-C contacts; VC normalized threshold set to either i) the highest contact, or ii) all contacts with Hi-C contacts > 10; see Figure SF6C).
DATA AND CODE AVAILABILITY
The raw sequencing data for both in vitro (SELEX-seq) and in vivo (ChIP-seq, ATAC-seq, RNA-seq and Hi-C) experiments as well as the Exd peak set used for downstream analyses have been deposited with the NCBI Gene Expression Omnibus under accession number GSE125604.
Supplementary Material
Highlights.
DNA shape readout by homeodomain TF complexes is revealed using SELEX-seq assays
A shape readout-impaired homeodomain mutant destabilizes specific TF complexes
This mutant was exploited to map TF complex composition and function genome-wide
The same mutation in an orthologous homeodomain is associated with a human disease
Acknowledgments
We thank the members of the Lomvardas lab for sharing their experience in performing Hi-C experiments, Remo Rohs and members of the Bussemaker, Mann, and Rohs labs for valuable discussions, and David Beck and Molly Przeworski for advice analyzing human genome sequence databases.
Funding
This work was supported by an HHMI International Student Research Fellowship (J.F.K.) and NIH grants R35 GM118336 to R.S.M. and R01 HG003008 to H.J.B. Columbia University’s Shared Research Computing Facility is supported by NIH grant G20RR030893 and NYSTAR contract C090171.
Footnotes
Competing interests
None of the authors declare a conflict of interest.
Publisher's Disclaimer: This is a PDF file of an unedited manuscript that has been accepted for publication. As a service to our customers we are providing this early version of the manuscript. The manuscript will undergo copyediting, typesetting, and review of the resulting proof before it is published in its final form. Please note that during the production process errors may be discovered which could affect the content, and all legal disclaimers that apply to the journal pertain.
References
- Abe N, Dror I, Yang L, Slattery M, Zhou T, Bussemaker HJ, Rohs R, and Mann RS (2015). Deconvolving the recognition of DNA shape from sequence. Cell 161, 307–318. [DOI] [PMC free article] [PubMed] [Google Scholar]
- Abu-Shaar M, and Mann RS (1998). Generation of multiple antagonistic domains along the proximodistal axis during Drosophila leg development. Development 125, 3821–3830. [DOI] [PubMed] [Google Scholar]
- Alberti S, Gladfelter A, and Mittag T (2019). Considerations and Challenges in Studying Liquid-Liquid Phase Separation and Biomolecular Condensates. Cell 176, 419–434. [DOI] [PMC free article] [PubMed] [Google Scholar]
- Baranello L, Kouzine F, Sanford S, and Levens D (2016). ChIP bias as a function of cross-linking time. Chromosome Res 24, 175–181. [DOI] [PMC free article] [PubMed] [Google Scholar]
- Berman HM, Westbrook J, Feng Z, Gilliland G, Bhat TN, Weissig H, Shindyalov IN, and Bourne PE (2000). The Protein Data Bank. Nucleic Acids Res 28, 235–242. [DOI] [PMC free article] [PubMed] [Google Scholar]
- Berthelsen J, Kilstrup-Nielsen C, Blasi F, Mavilio F, and Zappavigna V (1999). The subcellular localization of PBX1 and EXD proteins depends on nuclear import and export signals and is modulated by association with PREP1 and HTH. Genes Dev 13, 946–953. [DOI] [PMC free article] [PubMed] [Google Scholar]
- Buenrostro JD, Wu B, Chang HY, and Greenleaf WJ (2015). ATAC-seq: A Method for Assaying Chromatin Accessibility Genome-Wide. Curr Protoc Mol Biol 109, 21 29 21–29. [DOI] [PMC free article] [PubMed] [Google Scholar]
- Burglin TR, and Affolter M (2016). Homeodomain proteins: an update. Chromosoma 125, 497–521. [DOI] [PMC free article] [PubMed] [Google Scholar]
- Casares F, and Mann RS (1998). Control of antennal versus leg development in Drosophila. Nature 392, 723–726. [DOI] [PubMed] [Google Scholar]
- Caussinus E, and Affolter M (2016). deGradFP: A System to Knockdown GFP-Tagged Proteins. Methods Mol Biol 1478, 177–187. [DOI] [PubMed] [Google Scholar]
- Cheetham SW, Gruhn WH, van den Ameele J, Krautz R, Southall TD, Kobayashi T, Surani MA, and Brand AH (2018). Targeted DamID reveals differential binding of mammalian pluripotency factors. Development 145. [DOI] [PMC free article] [PubMed] [Google Scholar]
- Chiu TP, Xin B, Markarian N, Wang Y, and Rohs R (2019). TFBSshape: an expanded motif database for DNA shape features of transcription factor binding sites.. Nucleic Acids Research. [DOI] [PMC free article] [PubMed] [Google Scholar]
- Consortium EP (2012). An integrated encyclopedia of DNA elements in the human genome. Nature 489, 57–74. [DOI] [PMC free article] [PubMed] [Google Scholar]
- Crist RC, Roth JJ, Waldman SA, and Buchberg AM (2011). A conserved tissue-specific homeodomain-less isoform of MEIS1 is downregulated in colorectal cancer. PLoS One 6, e23665. [DOI] [PMC free article] [PubMed] [Google Scholar]
- Crocker J, Noon EP, and Stern DL (2016). The Soft Touch: Low-Affinity Transcription Factor Binding Sites in Development and Evolution. Curr Top Dev Biol 117, 455–469. [DOI] [PubMed] [Google Scholar]
- Durand NC, Shamim MS, Machol I, Rao SS, Huntley MH, Lander ES, and Aiden EL (2016). Juicer Provides a One-Click System for Analyzing Loop-Resolution Hi-C Experiments. Cell Syst 3, 95–98. [DOI] [PMC free article] [PubMed] [Google Scholar]
- Foat BC, Morozov AV, and Bussemaker HJ (2006). Statistical mechanical modeling of genome-wide transcription factor occupancy data by MatrixREDUCE. Bioinformatics 22, e141–149. [DOI] [PubMed] [Google Scholar]
- Furlong EEM, and Levine M (2018). Developmental enhancers and chromosome topology. Science 361, 1341–1345. [DOI] [PMC free article] [PubMed] [Google Scholar]
- Heidet L, Moriniere V, Henry C, De Tomasi L, Reilly ML, Humbert C, Alibeu O, Fourrage C, Bole-Feysot C, Nitschke P, et al. (2017). Targeted Exome Sequencing Identifies PBX1 as Involved in Monogenic Congenital Anomalies of the Kidney and Urinary Tract. J Am Soc Nephrol 28, 2901–2914. [DOI] [PMC free article] [PubMed] [Google Scholar]
- Hisa T, Spence SE, Rachel RA, Fujita M, Nakamura T, Ward JM, Devor-Henneman DE, Saiki Y, Kutsuna H, Tessarollo L, et al. (2004). Hematopoietic, angiogenic and eye defects in Meis1 mutant animals. EMBO J 23, 450–459. [DOI] [PMC free article] [PubMed] [Google Scholar]
- Jia Y, Bleicher F, and Merabet S (2018). A systematic survey of HOX and TALE expression profiling in human cancers. Int J Dev Biol 62, 865–876. [DOI] [PubMed] [Google Scholar]
- Johnson DS, Mortazavi A, Myers RM, and Wold B (2007). Genome-wide mapping of in vivo protein-DNA interactions. Science 316, 1497–1502. [DOI] [PubMed] [Google Scholar]
- Jolma A, Yin Y, Nitta KR, Dave K, Popov A, Taipale M, Enge M, Kivioja T, Morgunova E, and Taipale J (2015). DNA-dependent formation of transcription factor pairs alters their binding specificity. Nature 527, 384–388. [DOI] [PubMed] [Google Scholar]
- Joshi R, Passner JM, Rohs R, Jain R, Sosinsky A, Crickmore MA, Jacob V, Aggarwal AK, Honig B, and Mann RS (2007). Functional specificity of a Hox protein mediated by the recognition of minor groove structure. Cell 131, 530–543. [DOI] [PMC free article] [PubMed] [Google Scholar]
- Kim D, Langmead B, and Salzberg SL (2015). HISAT: a fast spliced aligner with low memory requirements. Nat Methods 12, 357–360. [DOI] [PMC free article] [PubMed] [Google Scholar]
- Kribelbauer JF, C., R., Bussemaker HJ, and Mann RS (2019). Low-Affinity Binding Sites and the Transcription Factor Specificity Paradox in Eukaryotes. Annual Review of Cell and Developmental Biology in press. [DOI] [PMC free article] [PubMed] [Google Scholar]
- Kribelbauer JF, Laptenko O, Chen S, Martini GD, Freed-Pastor WA, Prives C, Mann RS, and Bussemaker HJ (2017). Quantitative Analysis of the DNA Methylation Sensitivity of Transcription Factor Complexes. Cell Rep 19, 2383–2395. [DOI] [PMC free article] [PubMed] [Google Scholar]
- Lambert SA, Jolma A, Campitelli LF, Das PK, Yin Y, Albu M, Chen X, Taipale J, Hughes TR, and Weirauch MT (2018). The Human Transcription Factors. Cell 172, 650–665. [DOI] [PubMed] [Google Scholar]
- Langmead B, and Salzberg SL (2012). Fast gapped-read alignment with Bowtie 2. Nat Methods 9, 357–359. [DOI] [PMC free article] [PubMed] [Google Scholar]
- Lek M, Karczewski KJ, Minikel EV, Samocha KE, Banks E, Fennell T, O’Donnell-Luria AH, Ware JS, Hill AJ, Cummings BB, et al. (2016). Analysis of protein-coding genetic variation in 60,706 humans. Nature 536, 285–291. [DOI] [PMC free article] [PubMed] [Google Scholar]
- Li H (2011). A statistical framework for SNP calling, mutation discovery, association mapping and population genetical parameter estimation from sequencing data. Bioinformatics 27, 2987–2993. [DOI] [PMC free article] [PubMed] [Google Scholar]
- Li H, Handsaker B, Wysoker A, Fennell T, Ruan J, Homer N, Marth G, Abecasis G, Durbin R, and Genome Project Data Processing, S. (2009). The Sequence Alignment/Map format and SAMtools. Bioinformatics 25, 2078–2079. [DOI] [PMC free article] [PubMed] [Google Scholar]
- Liao Y, Smyth GK, and Shi W (2019). The R package Rsubread is easier, faster, cheaper and better for alignment and quantification of RNA sequencing reads. Nucleic Acids Res. [DOI] [PMC free article] [PubMed] [Google Scholar]
- Love MI, Huber W, and Anders S (2014). Moderated estimation of fold change and dispersion for RNA-seq data with DESeq2. Genome Biol 15, 550. [DOI] [PMC free article] [PubMed] [Google Scholar]
- Luo CW, Dewey EM, Sudo S, Ewer J, Hsu SY, Honegger HW, and Hsueh AJ (2005). Bursicon, the insect cuticle-hardening hormone, is a heterodimeric cystine knot protein that activates G protein-coupled receptor LGR2. Proc Natl Acad Sci U S A 102, 2820–2825. [DOI] [PMC free article] [PubMed] [Google Scholar]
- Luque CM, and Milan M (2007). Growth control in the proliferative region of the Drosophila eye-head primordium: the elbow-noc gene complex. Dev Biol 301, 327–339. [DOI] [PubMed] [Google Scholar]
- Machanick P, and Bailey TL (2011). MEME-ChIP: motif analysis of large DNA datasets. Bioinformatics 27, 1696–1697. [DOI] [PMC free article] [PubMed] [Google Scholar]
- Machon O, Masek J, Machonova O, Krauss S, and Kozmik Z (2015). Meis2 is essential for cranial and cardiac neural crest development. BMC Dev Biol 15, 40. [DOI] [PMC free article] [PubMed] [Google Scholar]
- Macke TJCDA (1998). Modeling unusual nucleic acid structures. Molecular Modeling of Nucleic Acids ACS Symposium Series, 379–393. [Google Scholar]
- Mann RS, and Morata G (2000). The developmental and molecular biology of genes that subdivide the body of Drosophila. Annu Rev Cell Dev Biol 16, 243–271. [DOI] [PubMed] [Google Scholar]
- Mathelier A, Xin B, Chiu TP, Yang L, Rohs R, and Wasserman WW (2016). DNA Shape Features Improve Transcription Factor Binding Site Predictions In Vivo. Cell Syst 3, 278–286 e274. [DOI] [PMC free article] [PubMed] [Google Scholar]
- Merabet S, and Mann RS (2016). To Be Specific or Not: The Critical Relationship Between Hox And TALE Proteins. Trends Genet 32, 334–347. [DOI] [PMC free article] [PubMed] [Google Scholar]
- Moens CB, and Selleri L (2006). Hox cofactors in vertebrate development. Dev Biol 291, 193–206. [DOI] [PubMed] [Google Scholar]
- Monahan K, Horta A, and Lomvardas S (2019). LHX2- and LDB1-mediated trans interactions regulate olfactory receptor choice. Nature 565, 448–453. [DOI] [PMC free article] [PubMed] [Google Scholar]
- Morata G, and Sanchez-Herrero E (1998). Developmental biology. Pulling the fly’s leg. Nature 392, 657–658. [DOI] [PubMed] [Google Scholar]
- Morgunova E, and Taipale J (2017). Structural perspective of cooperative transcription factor binding. Curr Opin Struct Biol 47, 1–8. [DOI] [PubMed] [Google Scholar]
- Noro B, Culi J, McKay DJ, Zhang W, and Mann RS (2006). Distinct functions of homeodomain-containing and homeodomain-less isoforms encoded by homothorax. Genes Dev 20, 1636–1650. [DOI] [PMC free article] [PubMed] [Google Scholar]
- Patro R, Duggal G, Love MI, Irizarry RA, and Kingsford C (2017). Salmon provides fast and bias-aware quantification of transcript expression. Nat Methods 14, 417–419. [DOI] [PMC free article] [PubMed] [Google Scholar]
- Ramirez F, Dundar F, Diehl S, Gruning BA, and Manke T (2014). deepTools: a flexible platform for exploring deep-sequencing data. Nucleic Acids Res 42, W187–191. [DOI] [PMC free article] [PubMed] [Google Scholar]
- Rao SS, Huntley MH, Durand NC, Stamenova EK, Bochkov ID, Robinson JT, Sanborn AL, Machol I, Omer AD, Lander ES, et al. (2014). A 3D map of the human genome at kilobase resolution reveals principles of chromatin looping. Cell 159, 1665–1680. [DOI] [PMC free article] [PubMed] [Google Scholar]
- Rastogi C, Rube HT, Kribelbauer JF, Crocker J, Loker RE, Martini GD, Laptenko O, Freed-Pastor WA, Prives C, Stern DL, et al. (2018). Accurate and sensitive quantification of protein-DNA binding affinity. Proc Natl Acad Sci U S A 115, E3692–E3701. [DOI] [PMC free article] [PubMed] [Google Scholar]
- Rieckhof GE, Casares F, Ryoo HD, Abu-Shaar M, and Mann RS (1997). Nuclear translocation of extradenticle requires homothorax, which encodes an extradenticle-related homeodomain protein. Cell 91, 171–183. [DOI] [PubMed] [Google Scholar]
- Riley TR, Slattery M, Abe N, Rastogi C, Liu D, Mann RS, and Bussemaker HJ (2014). SELEX-seq: a method for characterizing the complete repertoire of binding site preferences for transcription factor complexes. Methods Mol Biol 1196, 255–278. [DOI] [PMC free article] [PubMed] [Google Scholar]
- Rodriguez-Martinez JA, Reinke AW, Bhimsaria D, Keating AE, and Ansari AZ (2017). Combinatorial bZIP dimers display complex DNA-binding specificity landscapes. Elife 6. [DOI] [PMC free article] [PubMed] [Google Scholar]
- Rohs R, West SM, Sosinsky A, Liu P, Mann RS, and Honig B (2009). The role of DNA shape in protein-DNA recognition. Nature 461, 1248–1253. [DOI] [PMC free article] [PubMed] [Google Scholar]
- Ryoo HD, Marty T, Casares F, Affolter M, and Mann RS (1999). Regulation of Hox target genes by a DNA bound Homothorax/Hox/Extradenticle complex. Development 126, 5137–5148. [DOI] [PubMed] [Google Scholar]
- Samee MAH, Bruneau BG, and Pollard KS (2019). A De Novo Shape Motif Discovery Algorithm Reveals Preferences of Transcription Factors for DNA Shape Beyond Sequence Motifs. Cell Syst 8, 27–42 e26. [DOI] [PMC free article] [PubMed] [Google Scholar]
- Skene PJ, Henikoff JG, and Henikoff S (2018). Targeted in situ genome-wide profiling with high efficiency for low cell numbers. Nat Protoc 13, 1006–1019. [DOI] [PubMed] [Google Scholar]
- Slattery M, Riley T, Liu P, Abe N, Gomez-Alcala P, Dror I, Zhou T, Rohs R, Honig B, Bussemaker HJ, et al. (2011). Cofactor binding evokes latent differences in DNA binding specificity between Hox proteins. Cell 147, 1270–1282. [DOI] [PMC free article] [PubMed] [Google Scholar]
- Slattery M, Zhou T, Yang L, Dantas Machado AC, Gordan R, and Rohs R (2014). Absence of a simple code: how transcription factors read the genome. Trends Biochem Sci 39, 381–399. [DOI] [PMC free article] [PubMed] [Google Scholar]
- Slavotinek A, Risolino M, Losa M, Cho MT, Monaghan KG, Schneidman-Duhovny D, Parisotto S, Herkert JC, Stegmann APA, Miller K, et al. (2017). De novo, deleterious sequence variants that alter the transcriptional activity of the homeoprotein PBX1 are associated with intellectual disability and pleiotropic developmental defects. Hum Mol Genet 26, 4849–4860. [DOI] [PMC free article] [PubMed] [Google Scholar]
- Southall TD, Gold KS, Egger B, Davidson CM, Caygill EE, Marshall OJ, and Brand AH (2013). Celltype-specific profiling of gene expression and chromatin binding without cell isolation: assaying RNA Pol II occupancy in neural stem cells. Dev Cell 26, 101–112. [DOI] [PMC free article] [PubMed] [Google Scholar]
- Spivak AT, and Stormo GD (2016). Combinatorial Cis-regulation in Saccharomyces Species. G3 (Bethesda) 6, 653–667. [DOI] [PMC free article] [PubMed] [Google Scholar]
- Stankunas K, Shang C, Twu KY, Kao SC, Jenkins NA, Copeland NG, Sanyal M, Selleri L, Cleary ML, and Chang CP (2008). Pbx/Meis deficiencies demonstrate multigenetic origins of congenital heart disease. Circ Res 103, 702–709. [DOI] [PMC free article] [PubMed] [Google Scholar]
- Stefflova K, Thybert D, Wilson MD, Streeter I, Aleksic J, Karagianni P, Brazma A, Adams DJ, Talianidis I, Marioni JC, et al. (2013). Cooperativity and rapid evolution of cobound transcription factors in closely related mammals. Cell 154, 530–540. [DOI] [PMC free article] [PubMed] [Google Scholar]
- Stormo GD (2000). DNA binding sites: representation and discovery. Bioinformatics 16, 16–23. [DOI] [PubMed] [Google Scholar]
- Struhl G (1982). Genes controlling segmental specification in the Drosophila thorax. Proc Natl Acad Sci U S A 79, 7380–7384. [DOI] [PMC free article] [PubMed] [Google Scholar]
- Tosti L, Ashmore J, Tan BSN, Carbone B, Mistri TK, Wilson V, Tomlinson SR, and Kaji K (2018). Mapping transcription factor occupancy using minimal numbers of cells in vitro and in vivo. Genome Res 28, 592–605. [DOI] [PMC free article] [PubMed] [Google Scholar]
- Tsai A, Muthusamy AK, Alves MR, Lavis LD, Singer RH, Stern DL, and Crocker J (2017). Nuclear microenvironments modulate transcription from low-affinity enhancers. Elife 6. [DOI] [PMC free article] [PubMed] [Google Scholar]
- Wang J, Zhuang J, Iyer S, Lin X, Whitfield TW, Greven MC, Pierce BG, Dong X, Kundaje A, Cheng Y, et al. (2012). Sequence features and chromatin structure around the genomic regions bound by 119 human transcription factors. Genome Res 22, 1798–1812. [DOI] [PMC free article] [PubMed] [Google Scholar]
- Yang L, Zhou T, Dror I, Mathelier A, Wasserman WW, Gordan R, and Rohs R (2014). TFBSshape: a motif database for DNA shape features of transcription factor binding sites. Nucleic Acids Res 42, D148–155. [DOI] [PMC free article] [PubMed] [Google Scholar]
- Yao LC, Liaw GJ, Pai CY, and Sun YH (1999). A common mechanism for antenna-to-Leg transformation in Drosophila: suppression of homothorax transcription by four HOM-C genes. Dev Biol 211, 268–276. [DOI] [PubMed] [Google Scholar]
- Young MD, Wakefield MJ, Smyth GK, and Oshlack A (2010). Gene ontology analysis for RNA-seq: accounting for selection bias. Genome Biol 11, R14. [DOI] [PMC free article] [PubMed] [Google Scholar]
- Zhang L, Martini GD, Rube HT, Kribelbauer JF, Rastogi C, FitzPatrick VD, Houtman JC, Bussemaker HJ, and Pufall MA (2018). SelexGLM differentiates androgen and glucocorticoid receptor DNA-binding preference over an extended binding site. Genome Res 28, 111–121. [DOI] [PMC free article] [PubMed] [Google Scholar]
- Zhang Y, Liu T, Meyer CA, Eeckhoute J, Johnson DS, Bernstein BE, Nusbaum C, Myers RM, Brown M, Li W, et al. (2008). Model-based analysis of ChIP-Seq (MACS). Genome Biol 9, R137. [DOI] [PMC free article] [PubMed] [Google Scholar]
- Zhou T, Shen N, Yang L, Abe N, Horton J, Mann RS, Bussemaker HJ, Gordan R, and Rohs R (2015). Quantitative modeling of transcription factor binding specificities using DNA shape. Proc Natl Acad Sci U S A 112, 4654–4659. [DOI] [PMC free article] [PubMed] [Google Scholar]
- Zhou T, Yang L, Lu Y, Dror I, Dantas Machado AC, Ghane T, Di Felice R, and Rohs R (2013). DNAshape: a method for the high-throughput prediction of DNA structural features on a genomic scale. Nucleic Acids Res 41, W56–62. [DOI] [PMC free article] [PubMed] [Google Scholar]
- Zhu F, Farnung L, Kaasinen E, Sahu B, Yin Y, Wei B, Dodonova SO, Nitta KR, Morgunova E, Taipale M, et al. (2018). The interaction landscape between transcription factors and the nucleosome. Nature 562, 76–81. [DOI] [PMC free article] [PubMed] [Google Scholar]
Associated Data
This section collects any data citations, data availability statements, or supplementary materials included in this article.
Supplementary Materials
Data Availability Statement
The raw sequencing data for both in vitro (SELEX-seq) and in vivo (ChIP-seq, ATAC-seq, RNA-seq and Hi-C) experiments as well as the Exd peak set used for downstream analyses have been deposited with the NCBI Gene Expression Omnibus under accession number GSE125604.