

Abstract
A major function of sensory processing is to achieve neural representations of objects that are stable across changes in context and perspective. Small changes in exploratory behavior can lead to large changes in signals at the sensory periphery, thus resulting in ambiguous neural representations of objects. Overcoming this ambiguity is a hallmark of human object recognition across sensory modalities. Here, we investigate how the perception of tactile texture remains stable across exploratory movements of the hand, including changes in scanning speed, despite the concomitant changes in afferent responses. To this end, we scanned a wide range of everyday textures across the fingertips of rhesus macaques at multiple speeds and recorded the responses evoked in tactile nerve fibers and somatosensory cortical neurons (from Brodmann areas 3b, 1, and 2). We found that individual cortical neurons exhibit a wider range of speed-sensitivities than do nerve fibers. The resulting representations of speed and texture in cortex are more independent than are their counterparts in the nerve and account for speed-invariant perception of texture. We demonstrate that this separation of speed and texture information is a natural consequence of previously described cortical computations.
Keywords: neural coding, invariance, touch, neural computation, neural manifolds
Introduction
We are endowed with a remarkable ability to identify objects across a wide range of contexts and perspectives. For example, we can visually identify objects in a fraction of a second, even over broad changes in lighting, distance, or viewing angle. Similarly, we can auditorily identify the timbre of voices and musical instruments across a wide range of loudness and pitches (Handel and Erickson 2001; Marozeau et al. 2003). In both vision and audition, these perceptual invariances are achieved despite sensory representations at the periphery (the retina, the cochlea) that are highly dependent on perspective and context (Enroth-Cugell and Robson 1966; Sachs and Young 1979; Croner and Kaplan 1995; Joris et al. 2011). Indeed, a signature of sensory processing is a progression of object representations that become increasingly robust to changes in context (Avidan et al. 2002; Finn et al. 2007; Sadagopan and Wang 2008; Walker et al. 2011; Cadieu et al. 2014; Metzen et al. 2016).
In touch, the best known instance of perceptual invariance is for texture: tactile texture perception has been shown to be nearly independent of the force exerted on the surface (Lederman and Taylor 1972; Lederman 1981) or the speed at which it is scanned across the skin (Lederman 1974; Meftah et al. 2000; Boundy-Singer et al. 2017). Remarkably, this perceptual invariance is achieved despite responses in the somatosensory nerves that are strongly modulated by exploratory parameters such as scanning speed (Goodwin and Morley 1987a; Phillips et al. 1992; DiCarlo and Johnson 1999; Weber et al. 2013) and, to a lesser degree, force (Goodwin and Morley 1987b; Phillips et al. 1992; Saal et al. 2018). The effect of scanning speed on texture coding in the nerve is particularly pronounced for fine textures, which are encoded in precisely timed, texture-specific spiking sequences that contract or dilate multiplicatively with increases and decreases in speed, respectively (Weber et al. 2013). Thus, to achieve an invariant percept of texture, texture-specific information must be extracted from peripheral signals that are highly dependent on exploratory parameters.
As texture representations ascend the somatosensory neuraxis toward somatosensory cortex, precisely timed patterns of spatiotemporal activity are processed by canonical sensory transformations, such as differentiating filters that calculate spatial (DiCarlo and Johnson 2000; Sripati et al. 2006; Bensmaia et al. 2008) and temporal (DiCarlo and Johnson 2000; Sripati et al. 2006; Saal et al. 2015) variation across the peripheral signal. These filters extract perceptually relevant stimulus information that may not be present in the firing rates of peripheral afferents (Connor et al. 1990). It thus stands to reason that these same mechanisms could extract a speed-invariant representation of texture that was not present in the peripheral response. Indeed, previous work suggests that a subpopulation of neurons in somatosensory cortex may exhibit speed-invariant responses to texture (Sinclair and Burton 1991; DiCarlo and Johnson 1999; Dépeault et al. 2013; Bourgeon et al. 2016). However, these studies only characterized cortical responses to parametrically defined dot patterns and gratings that span a narrow range of tangible textures (Skedung et al. 2013) and focused primarily on the speed-sensitivity of cortical neurons without comparing these effects with those seen in peripheral afferents.
In the present study, we seek to fill this gap by recording the responses of neurons in somatosensory cortex—including Brodmann’s areas 3b, 1, and 2—to natural textures scanned over the skin at various speeds, spanning the range used in natural texture exploration (Morley et al. 1983; Gamzu and Ahissar 2001; Libouton et al. 2010; Tanaka et al. 2014; Callier et al. 2015). Using these data, we then directly compare how neuronal firing rate responses are modulated by speed in the nerve and in cortex. We find that while speed modulation is generally weaker in cortical firing rates than in afferent firing rates, this effect does not typically confer a speed-invariant texture code to individual cortical neurons. Rather, we find that speed-invariant texture perception is best explained by an untangling of information about speed and texture across the responses of neuronal populations. The resulting cortical population response better accounts for speed-invariant texture perception than does its peripheral counterpart.
Methods
Experimental Methods
Overview
We combined data from 2 separate experiments to compare texture responses of tactile nerve fibers with those of neurons in somatosensory cortex and assess the dependence of these responses on scanning speed. In the peripheral nerve experiment (Weber et al. 2013; Lieber et al. 2017), 55 different textures were scanned across the fingertips of 6 anesthetized macaques (at 80 mm/s) while we recorded the responses evoked in 39 afferents. For a subset of nerve fibers, we were able to maintain isolation long enough to record texture responses at 2 additional speeds (40 and 120 mm/s, 21 afferents: 9 slowly adapting type 1—SA1—fibers, 9 rapidly adapting—RA—fibers, and 3 Pacinian—PC—fibers, see Supplementary Table 1). The neurophysiological approach is described in more detail in previously published articles describing studies that used a subset of these data (Weber et al. 2013; Lieber et al. 2017). In the cortical experiment (Lieber et al. 2017; Delhaye et al. 2019), 59 different textures were scanned across the fingertips of 3 awake macaques (at 80 mm/s) while we recorded the responses of 141 neurons. Twenty-four of the textures were shared between the main peripheral and cortical experiments. For a subset of cortical neurons (49 total, area 3b: 14, area 1: 26, area 2: 9), we were able to maintain isolation long enough to record responses to a subset of 10 textures at 4 different speeds (40, 60, 80, and 120 mm/s, 49 neurons, see Supplementary Table 1). The neurophysiological approach is described in more detail in a previously published article describing a study that used a subset of these data (Lieber and Bensmaia 2019). Four of the 10 textures (satin, chiffon, denim, and hucktowel) and 2 of the speeds (80 and 120 mm/s) were shared between the peripheral and cortical experiments. Different textures were used in the 2 neurophysiological experiments because emphasis was placed on fine textures in the peripheral nerve experiment to fill a gap in the literature. This emphasis was turned back in the cortical experiments to include a more even spread of fine and coarse texture. A different set of speeds was used in the cortical experiment after we discovered that 40 mm/s, used in the peripheral experiment, fell outside the range of scanning speeds used in texture exploration (Callier et al. 2015). All peripheral and cortical experimental procedures complied with the National Institutes of Health Guide for the Care and Use of Laboratory Animals and were approved by the Animal Care and Use Committee of the University of Chicago. Further details on experimental methods are available in the Supplementary Methods.
Throughout the article, we analyze 2 distinct sets of texture-driven neural responses in both nerve fibers and cortical neurons: 1) a single-speed protocol, comprising the responses to 24 different textures, all presented only at 80 mm/s (Supplementary Table 2) and 2) a multiple-speed protocol, comprising the responses to 10 different textures (not identical, but similar, between the peripheral and cortical experiments, see Supplementary Table 3 and the section entitled “Matching peripheral and cortical texture sets”) presented at multiple speeds (3 speeds at the periphery, 4 speeds in cortex).
To characterize the speed-sensitivity of single afferents and cortical neurons, we quantified 1) the relative increase in firing rate due to changes in scanning speed and 2) the relative sensitivity of firing rate to changes in speed versus changes in surface texture (see below, “Calculating speed-sensitivity, speed/texture ratio, and response heterogeneity”). To characterize the relative texture- and speed-sensitivity of the 2 neural populations, we used dimensionality reduction techniques to characterize the extent to which population-wide texture and speed responses were independent (see below, “Neural population analyses”).
To evaluate whether peripheral and cortical population representations could explain human perception of texture roughness, we reanalyzed perceptual reports (Lieber and Bensmaia 2019) from 6 human subjects (5 m, 1f, ages 18–24), who freely rated the perceived roughness of the 59 textures used in the cortical experiment (scanned at 80 mm/s). Thus, 24 of the textures were shared between the perceptual and peripheral experiments. All procedures were approved by the Institutional Review Board of the University of Chicago, and all subjects provided informed consent. Further details on experimental methods are available in the Supplementary Methods. Using these data, we determined whether a simple linear readout of each population’s response could yield a prediction of perceived roughness that simultaneously met 2 goals: 1) accuracy and 2) invariance to changes in speed (see below, “Predicting roughness from neural responses”).
Finally, we sought to evaluate whether differences in speed-sensitivity between the peripheral and cortical populations could be explained by previously described aspects of cortical receptive fields. To this end, we developed a simple model of the transformation from peripheral signals to cortical ones, then evaluated whether this model reproduced cortical-like representations of texture and speed (see below, “Modeling neural computations”).
Analysis
Firing Rates and Speed Effects
For the multiple-speed protocol, peripheral firing rates were calculated over windows of 2, 1, and 0.5 s for textures presented at 40, 80, and 120 mm/s, respectively. Cortical firing rates were calculated over windows of 2.3, 1.7, 1.4, and 1.2 s for textures presented at 60, 80, 100, and 120 mm/s, respectively. All cortical firing rates were corrected for baseline firing. For each neuron, the firing rate over a 500-ms period before each trial was averaged over all trials to obtain the baseline firing rate, which was then subtracted from the neuron’s texture-evoked firing rates.
Matching Peripheral and Cortical Texture Sets
To minimize any systematic biases due to differences in texture sets across the peripheral and cortical experiments, we selected a subset of 10 textures used in the peripheral multiple-speed experiment to match the 10 textures used in the cortical multiple-speed experiment. As 4 textures were used in both (multiple-speed) experiments, we sought appropriate matches for the remaining 6. To this end, we examined the subset of 20 textures for which we had obtained cortical responses in the single-speed experiment (at 80 mm/s) and peripheral responses in the multiple-speed experiment (i.e., at all 3 speeds). To assess similarity between the cortical multiple-speed set of 6 textures and the cortical single-speed set of 20 textures, we calculated the Euclidian distance between each texture pair based on trial-averaged firing rates across the cortical population (6 × 20 = 120 pairs) and then selected the 6 pairs with the shortest distance (Supplementary Table 3). That is, we chose the 6 textures from the single-speed set (20 textures) that evoked the most similar cortical population responses to the 6 textures in the multiple-speed set. We then used these 6 textures to round out the peripheral set. The underlying assumption is that if 2 textures evoke similar patterns of responses across cortical neurons, they would also evoke similar responses across peripheral afferents. For all analyses in the article, we achieved qualitatively similar results when we used peripheral responses to the full set of 55 textures or to the 4 shared textures.
Calculating Speed-sensitivity, Speed/Texture Ratio, and Response Heterogeneity
We wished to quantify the relative effect of speed and texture on each afferent and neuron. To this end, we calculated 3 quantities for each cell. First, we defined speed-sensitivity as the slope of the linear regression between the log (base 2) of speed and firing rate, normalized by the mean firing rate at 80 mm/s evoked by all 10 textures (to correct for overall firing rate differences across neurons). We chose to use log speed rather than linear speed after establishing that a logarithmic function better captures the effect of speed on firing rate than does a linear one (compare [Essick and Edin 1995; DiCarlo and Johnson 1999]). Second, we defined texture-sensitivity as the across-texture coefficient of variation: that is, the standard deviation across the single-speed firing rate responses to a set of 24 textures used in both experiments (presented at 80 mm/s, see [Lieber and Bensmaia 2019]), normalized by the firing rate averaged over those same 24 textures. Finally, we defined the speed/texture ratio as the ratio of speed-sensitivity to texture-sensitivity.
Because this ratio metric becomes unstable if texture-sensitivity is near zero, we verified that all neurons exhibited sufficiently large values of texture-sensitivity (all peripheral afferents > 0.37, all cortical neurons > 0.28). Note further that, for all neurons, texture-sensitivity was significantly greater than that expected by chance, based on a permutation test that compares the measured texture-sensitivity with that obtained when single-trial responses are shuffled across texture labels (P < 0.05). We report that the cortical population contains a significant proportion of neurons with a smaller speed/texture ratio than any peripheral afferent. To test the reliability of this effect, we randomly shuffled the cortex/periphery labels on the combined population of afferents and cortical neurons and recomputed the number of “neurons” with smaller speed/texture ratios than “afferents”. From this simulation, we could characterize the relative distribution of speed/texture ratios expected by chance.
Neural Population Analyses
We sought to evaluate the extent to which representations of texture and speed in the neural populations were either overlapping or well-separated. This required a 3-step process: 1) identify the texture representation in each population, 2) identify the speed representation in each population, and 3) determine the amount of overlap between the 2 representations.
To identify the major axes of each population’s texture response, we applied a principal components analysis (PCA) to peripheral and cortical population responses in the single-speed experiment, that is, using the responses to the set of 24 textures (presented at 80 mm/s) shared between the 2 data sets. This allowed us to identify the first D dimensions in each population that captured the majority of the texture response variance, which we refer to as  . To identify the main speed-related axis in each population, we applied demixed PCA (dPCA) (Kobak et al. 2016) to the full set of trial-averaged texture responses in the multiple-speed experiment (periphery: 10 textures at 3 speeds, cortex: 10 textures at 4 speeds). Specifically, we first created a speed marginalization of the population response by subtracting out each texture’s average firing rate (across all speeds) from the full response matrix. Thus, the full response matrix can be expressed as:
 |
where  is the full texture response,
  is the texture marginalization (each texture’s average firing rate), and
  is the speed marginalization (the residual, which, in the terminology of [Kobak et al. 2016], contains both the pure speed marginalization and speed–texture interaction marginalization). Next, we found the best linear mapping from the full texture response to the speed marginalization using least squares regression:
 |
where  is a regularization parameter (set to 10−6, as in [Kobak et al. 2016]) and
  is each neuron’s variance across all speed and texture conditions. Finally, we used PCA on the best linear approximation of the speed marginalization,
  , to find its primary axis of variation, which we refer to as
  . In the terminology of (Kobak et al. 2016), this corresponds to the primary encoder axis for the speed marginalization.
We validated each population’s primary speed axis using 2 metrics. First, we confirmed that the projection of any given population response onto the speed axis covaried with the actual speed (in log units) by measuring the coefficient of determination (R2) between the 2 variables (periphery: 10 × 3 = 30 conditions, cortex: 10 × 4 = 40 conditions). Second, we quantified the extent to which the primary speed-axis accounted for speed-driven neural responses by computing the ratio of the variance captured by the single speed axis to the total variance in the speed marginalization (summed across neurons).
To determine the amount of overlap between the texture space and the speed dimension, we calculated an alignment index (Elsayed et al. 2016; Gallego et al. 2018), defined as the amount of speed-driven variance captured by the texture space, normalized by the total amount of speed-related variance in the population response. Specifically, we define the alignment index as:
 |
where  is defined as the principal axes of the texture space. We emphasize that, by construction, this metric is insensitive to the raw magnitude of speed-related fluctuations in the population response. We verified with simulations that when the speed/texture ratio of the population response is doubled or halved, the alignment index stays constant. In this sense, the alignment index is more similar to a relative angle between the representations than to a measurement of raw speed-sensitivity. For Figure 3, we recomputed the texture-space, speed-axis, and alignment index for 500 different subsamples of 21 neurons from the cortical population (to control for systematic biases due to sample size), for either individual dimensions of
  (Fig. 3A) and for a range of the first D dimensions of
  (Fig. 3B). Cortical subsamples were randomly sampled, each without replacement, from the full population of 49 neurons.
Figure 3.
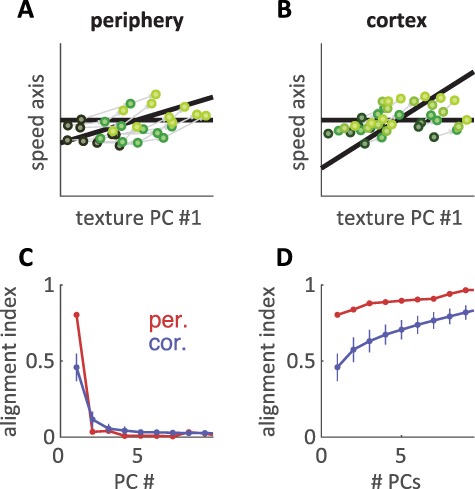
Texture and speed signals are more independent in cortex than at the periphery. (A,B) Texture population responses are projected to a 2D plane. One dimension (plotted on the abscissa and also as a horizontal black line) corresponds to the first PC of the texture space (found by applying PCA to texture responses at 80 mm/s). A second dimension (corresponding to the oblique black line) corresponds to the primary speed axis (found by applying dPCA to texture responses at multiple speeds). The primary texture and speed axes are not orthogonal to each other, and a more acute angle between the two black lines indicates greater overlap in the representations of texture and speed. Accordingly, the ordinates of the plots correspond to the component of the speed axis orthogonal to the primary texture axis. Texture responses are plotted at 3 speeds (PCs for 10 different textures plotted at different speeds, low speeds: dark green, high speeds: light green). Speed-driven changes in firing rate are less aligned to the primary texture axis in cortex than at the periphery. (C) Alignment index between the primary speed axis and individual texture axes for the peripheral (red) and cortical (blue) populations. The alignment index measures the proportion of speed-related variance captured by each texture dimension (see Methods). Error bars for the cortical population (blue) are standard deviations across 500 randomly sampled subpopulations of 21 neurons. (D) Alignment index between the primary speed axis and the multidimensional texture space for the peripheral (red) and cortical (blue) populations. On the abscissa, “# PCs” refers to the dimensionality of the texture space. That is, “5 PCs” refers to the alignment index between 1) the primary speed axis and 2) the first 5 PCs of the texture space. Error bars for the cortical population (blue) are standard deviations across 500 randomly sampled subpopulations of 21 neurons.
Texture Discriminability Across Changes in Speed
We sought to quantify how well populations of neurons could discriminate pairs of textures and to what extent discrimination was impaired by changes in speed. For an individual neuron responding to any pair of textures and pair of speeds, we define a signal-to-noise ratio (SNR):
 |
where  is the response (firing rate) of the neuron to texture
  at speed
  . We added
  (=1) to the denominator to avoid the instability in SNR caused by neurons that do not respond under some stimulus conditions. To compute the SNR for populations of neurons, we first collapsed the multidimensional, population-wide firing rates to a single discriminant value. To this end, we defined a population vector of firing rates
  for a given texture
  scanned at speed
  . We then found the line connecting the 2 textures’ average population response:
  . This line defines the texture-relevant axis in neural space. Next, we found the projections of the 4 population vectors onto this line, resulting in 4 scalar values, each corresponding to a (texture, speed) pair. To the extent that speed has no impact along the texture axis, the projections onto this line of the response vectors to each texture at different speeds will be identical. Finally, we computed the SNR on these projections in place of the full population vectors of rates. For any given subpopulation size, this procedure was repeated across 1000 subsamples, each without replacement, of the full population.
Predicting Roughness From Neural Responses
We sought to evaluate how well neural population responses could predict human judgments of surface roughness (55 and 59 textures for periphery and cortex, respectively, all presented at 80 mm/s). To this end, we implemented 3 distinct models using texture responses from the single-speed protocol: a mean firing rate regression model, a multiple regression model and a second multiple regression model constrained to be speed-invariant. The mean firing rate model comprised a single regressor, the mean firing rate across a full population of neurons (either the full set of 21 afferents or 100 subsets of 21 cortical neurons, each sampled randomly without replacement). The multiple regression model included the first N principal components (PCs) of the texture representation. For Figure 5, we chose a number of PCs where regression performance began to saturate (N = 5), though the results were stable over different numbers of components (Supplementary Fig. 5). For the constrained multiple regression model, we first used texture responses to the multiple-speed protocol to find the primary speed axis in each population using dPCA (described above). Next, we found the projection of the single-speed protocol responses onto this speed-axis and removed it from the full set of population firing rates. Finally, we performed the multiple regression as described before. This methodology ensured that the final regression weights were orthogonal to the primary speed axis in each population and that the roughness predictions of the model were almost entirely speed-invariant.
Figure 5.
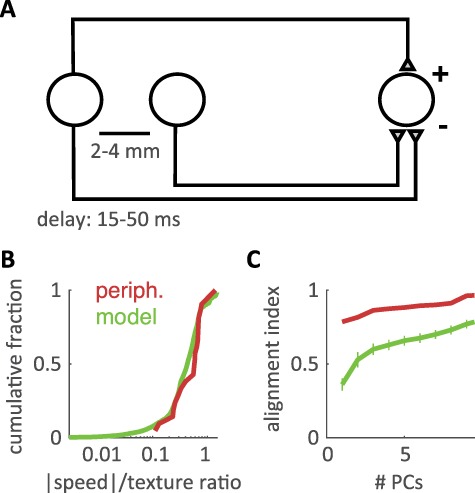
Known cortical computations account for the untangling of speed and texture information. (A) Cartoon of the variation model. The texture response of a single afferent is combined with a spatial variation signal, modeled as an inhibitory response stemming from an afferent whose receptive field is located 2–4 mm away along the scanning direction, and a temporal variation signal, modeled as an inhibitory copy of the original afferent’s response delayed by 15–50 ms. (B) Cumulative distribution of the ratio between the speed effect and texture effect for tactile fibers (red) and simulated cortical neurons (green). (C) Alignment index (as in Figure 3) between the primary speed axis and multidimensional texture space for small populations (N = 21 units) of tactile fibers (red) and simulated neurons (green), shown for texture spaces of different dimensionalities (i.e., using between 1 and 9 PCs of the texture space). Error bars denote the standard deviation across 5000 subsamples of simulated responses. The variation model exhibits a greater separation of speed and texture information than does the afferent population.
For all 3 models, we used leave-one-out cross-validation to compute an equivalent of the coefficient of determination (R2). Specifically, for each texture in the set, we first fit the model using the other 54/58 texture responses as training data. We then applied the resulting model to obtain a prediction of roughness magnitude  for the final, left-out texture. Across all textures, we computed the coefficient of determination as:
 |
where  is the reported roughness.
To test the speed-invariance of these models, we applied each regression model to texture responses in the multiple-speed experiment (10 textures in each set, 3 and 4 speeds for peripheral and cortical experiments, respectively). We computed speed-sensitivity of the roughness predictions in a manner similar to that used for the neural data. First, we computed the slope of roughness (averaged across textures) versus log2(speed). Then, we normalized the slopes by the average predicted roughness magnitude at 80 mm/s. As with the neuronal data, then, we report the speed-sensitivity of the roughness predictions as a percentage increase per doubling of speed.
Modeling Neural Computations
As somatosensory information ascends from the periphery to cortex, spatiotemporal patterns of peripheral population activity are subject to spatial and temporal differentiation (variation) computations (Connor and Johnson 1992; DiCarlo and Johnson 2000; Saal et al. 2015). We built a simple model of these variation filters and applied them to the responses of peripheral afferents to textures presented at multiple speeds.
First, we aligned—for each texture and speed—spike trains in the population (between 21 and 39 neurons, depending on the speed) to correct for phase differences in the response caused by (slight) shifts—along the scanning direction—in the swath of texture that was delivered across experimental blocks. To this end, we found the strongest cross-correlation between any 2 pairs of spike trains smoothed with a 5-ms filter (within a maximum shift of 300 ms), averaged them at their optimal lag, and then found the strongest cross-correlation between this new trace and any of the remaining traces. This procedure was repeated until the full population was aligned. As we only had 1 2-s trace for any given texture at 40 mm/s, these traces were split in half and then aligned to create 2 1-s traces.
Then, we temporally smoothed the aligned afferent spiking responses using a filter designed to mimic an postsynaptic potential (PSP) (Bengtsson et al. 2013):
 |
where  is the time of each spike,
  is the decay time, set to 5 ms for excitatory and spatially offset inhibitory PSPs and 9 ms for temporally lagging inhibitory PSPs (since the integration time of temporally lagged inhibition is generally longer than that of excitation [DiCarlo and Johnson 2000; Sripati et al. 2006]),
  is the Heaviside step function, and
  is a normalization constant such that
  . The resulting aligned traces simulated the peripheral input to cortex—expressed as PSPs—given a texture and speed.
Next, we computed pseudopopulations of “downstream” neurons that implement both spatial and temporal variation computations on these inputs. We implemented temporal variation by subtracting from an excitatory postsynaptic potential (EPSP) (with  = 5 ms) a delayed inhibitory postsynaptic potential (IPSP) corresponding to the same input (but with
  = 9 ms). Each simulated neuron implemented this computation with a random delay (sampled evenly between 15 and 50 ms) and inhibitory weight (0–50% of the excitatory weight), the ranges of which were selected based on previously documented spatial-temporal receptive fields of cortical neurons (DiCarlo and Johnson 1999, 2000; Sripati et al. 2006; Saal et al. 2015). We implemented spatial variation by subtracting from one response trace (EPSP) the IPSP (derived from a different, randomly selected afferent of the same type (SA1, RA, or PC). We simulated the relative spatial location of the inhibitory subfield as trailing (along the axis defined by the scanning direction) 2–4 mm (randomly selected) behind the excitatory subfield at a random weight (0–50% of the excitatory weight), again inspired by previous findings (DiCarlo and Johnson 1999, 2000; Sripati et al. 2006). In practice, this meant subtracting out the spatial inhibition at a temporal delay that shifted for different speeds. After subtracting out the temporal and spatial inhibition, we half-wave rectified each trace and summed it to obtain the “output” of that simulated neuron. This procedure was repeated for 2 trials of every texture response at every speed and then repeated 200 times for each afferent, each time with a different set of randomized parameters. From the responses of each afferent, then, we simulated the responses of a set of neurons that each reflected an idiosyncratic variation computation.
We then computed the correlation between each simulated cortical response and the true, single-speed response averaged across the population (24 shared textures, 80 mm/s, all 141 neurons). We also computed the speed/texture ratio from the simulated responses of each neuron (as defined above). The median correlation reported in the text and the cumulative distribution in Figure 5A were computed across all permutations and afferents. To compute the alignment index for the simulated population, we first randomly selected a simulated neuron derived from each of the 21 afferents. We then computed the alignment index on this pseudopopulation as described above. We repeated this procedure over 5000 random selections of simulated neurons.
Results
We have previously reported the texture-evoked responses of 39 tactile afferents from 6 anesthetized macaque monkeys (Weber et al. 2013) and 141 neurons from the somatosensory cortices of 3 awake macaque monkeys (Lieber and Bensmaia 2019), as many different textures were scanned over the skin. For a subset of these neurons, we were able to maintain isolation quality long enough to run a second protocol of textures presented at multiple speeds. This protocol was run on 21 tactile fibers—9 SA1, 9 RA, and 3 PC fibers—and 49 neurons in somatosensory cortex—14 from Brodmann’s area 3b, 26 from area 1, and 9 from area 2—with receptive fields on the distal fingertip. For the peripheral nerve experiments, each of 55 different textures was scanned over the skin at 3 different speeds (40, 80, and 120 mm/s) using a rotating drum stimulator. For the cortical experiments, each of 10 different textures was scanned over the skin at 4 different speeds (60, 80, 100, and 120 mm/s), which spans the range of speeds spontaneously used to explore tactile textures (typically 50–120 mm/s, compare [Morley et al. 1983; Gamzu and Ahissar 2001; Libouton et al. 2010; Tanaka et al. 2014; Callier et al. 2015]). We sought to determine the effect of scanning speed on the neural representation of texture and how these representations change between periphery and cortex.
Texture Responses Are Modulated by Scanning Speed
At all scanning speeds, textures drove robust firing in both peripheral afferents (Fig. 1A) and cortical neurons (Fig. 1B). We found that, for both tactile nerve fibers and cortical neurons, increasing the speed at which a texture is scanned across the skin typically drove an increase in the firing rate response (Fig. 2A,B). This effect was significant for nearly every tactile nerve fiber (20/21, P < 0.05, permutation test) and for a majority of neurons in cortex (37/49). For consistency, we only included in the analysis the responses to textures that were either shared across the peripheral and cortical experiments or evoked similar firing rate responses (Supplementary Fig. 1A, see Methods). Using this matched set of textures, we compared the speed-sensitivity of peripheral afferents with that of cortical neurons by expressing sensitivity as a percentage increase in firing rate per doubling in speed (Supplementary Fig. 1B–D). Using this metric, we found that peripheral afferents exhibited more speed-sensitivity than did cortical neurons (Fig. 2C) (median across cells ± median absolute deviation: periphery: 28.7% ± 5.1%, cortex: 20.0% ± 11.5%, P < 0.05 Wilcoxon rank-sum test; also see Supplementary Figure 1E and Supplementary Table 4). This difference was almost entirely driven by a subpopulation of cortical cells with highly speed-invariant responses (13/49 with speed-sensitivity < 10% increase/doubling, 0/21 peripheral afferents < 10%). While we did observe significant differences in speed-sensitivity across different afferent classes (Delhaye et al. 2019), every submodality trended toward more speed-sensitivity than that was observed in cortex (RA: 29.3% ± 3.3% and PC: 35.0% ± 5.4%, P < 0.05, SA1: 23.8% ± 6.2%, P = 0.18, see Supplementary Figure 2A,B). The speed-sensitivities of cortical neurons were largely similar across areas, though responses in area 3b trended toward smaller values than did responses from areas 1 and 2 (area 3b: 12.9% ± 9.8% < area 1: 23.1% ± 7.5% at P < 0.05 and area 2: 24.4% ± 24.9%, P = 0.33, see Supplementary Figure 2A,B), consistent with previous reports (Dépeault et al. 2013; Bourgeon et al. 2016).
Figure 1.
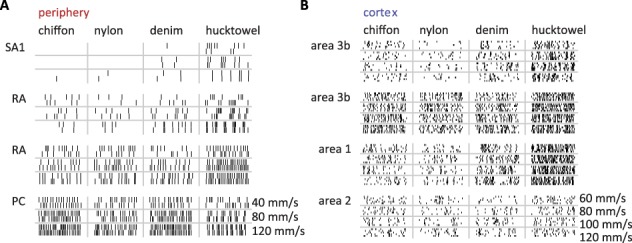
Afferent and cortical spiking responses to textures scanned across the fingertip at different speeds. (A,B) Spiking responses over a 200-ms interval from (A) 4 tactile nerve fibers and (B) 4 cortical neurons (arranged in rows) to 4 different textures (arranged in columns) presented at 3/4 different speeds, respectively (arranged in rows).
Figure 2.
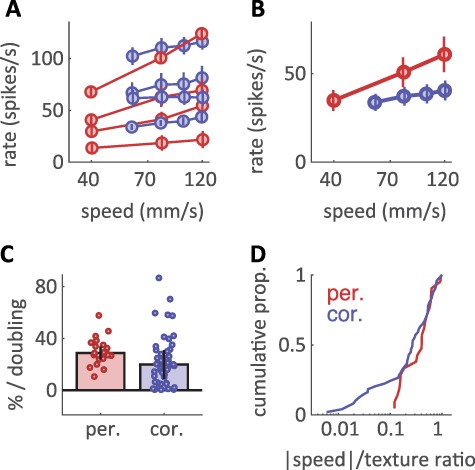
Texture responses are modulated by scanning speed. (A) Mean firing rate for the 4 afferents (red) and 4 cortical neurons (blue) shown in Figure 1. Rates are averaged across the set of 10 matched textures for each population. Error bars are standard errors of the mean across textures and trials. Speed is on a log scale. Most afferents and cortical neurons exhibit increasing firing rates for increasing scanning speeds. (B) Average firing rate across all textures and cells at the periphery (red) and in cortex (blue) versus scanning speed. Error bars denote standard errors across cells, textures, and trials. (C) Median speed effect, reported as the percentage increase in mean population firing rate per doubling in speed (normalized to the firing rate at 80 mm/s). Different points denote different neurons. Error bars are median absolute deviations across cells. (D) Cumulative distribution of the ratio between the speed effect and texture effect for peripheral afferents (red) and cortical neurons (blue). While the medians of the distributions are similar, the distribution derived from cortex contains a large proportion of neurons whose responses to texture are strongly speed-independent.
Next, we assessed whether the decreased speed-sensitivity in cortex resulted in a more speed-invariant representation of texture. To this end, we computed the ratio between the texture-dependence of firing rates and their speed dependence (Fig. 2D). The resulting speed/texture ratio, lower for more speed-invariant texture coding, was only marginally lower in cortex than at the periphery (median ratio of speed-to-texture-sensitivity, periphery: 0.59, cortex: 0.47, P = 0.287 Wilcoxon rank-sum test), suggesting that cortical texture representations are only slightly more speed invariant in cortex than at the periphery. Indeed, while speed-sensitivity tends to decrease in cortex, so does texture-sensitivity. To directly test the ability of individual neurons to discriminate between textures, we computed a SNR as a metric of discriminability for texture pairs (see Methods). We found that, for any given speed difference, SNR values were largely similar for individual peripheral and cortical neurons (Supplementary Fig. 3A). Thus, at the single-cell level, speed had a largely similar effect on peripheral and cortical texture responses.
Given that median speed-sensitivity was similar between the peripheral and cortical populations, we next considered whether speed-invariance might be achieved by a specialized subpopulation of cortical neurons. As signals ascend the somatosensory hierarchy, the tuning of individual neurons becomes increasingly heterogeneous (Lieber and Bensmaia 2019). We might thus expect subpopulations of cortical neurons to show specialization for speed or texture coding (Dépeault et al. 2013; Bourgeon et al. 2016). Indeed, we found a significant proportion of cortical cells exhibited speed/texture ratios weaker than any observed in peripheral afferents (Fig. 2D) (12/49 with ratio < 0.12, P < 0.05, permutation test, see Methods), an effect that was present in all 3 cortical fields (Supplementary Fig. 2C). Therefore, somatosensory processing does not simply extinguish speed-sensitivity as signals ascend from the periphery to somatosensory cortex but rather creates a wide range of response properties in cortex that could potentially represent information about both texture and scanning speed.
Texture and Speed Signals Are More Independent in Cortex Than at the Periphery
The diverse tuning of individual cortical neurons suggests that the population representations of texture and speed may be more independent in cortex than at the periphery. To test this, we identified linear combinations of neurons within each population (combined across afferent types/cortical areas for the periphery and cortex, respectively) that best captured either texture-driven or speed-driven modulations of firing rate.
To identify the most texture-sensitive dimensions in the peripheral and cortical populations, we applied PCA to each population’s response at one speed: 24 textures presented at a single speed (80 mm/s). The PCA yielded PCs, ordered by how much variance in the texture response they accounted for. To identify the speed-sensitive dimension in each neural representation, we applied dPCA (Kobak et al. 2016) to each population’s response to 10 textures scanned at multiple speeds. Although this analysis identified multiple speed-sensitive dimensions in each population response, a single dimension captured most of the speed-related response variance (peripheral: 87.6%, cortical: 63.9%, see Methods) and significantly tracked speed magnitude across different textures (R2 to log2 speed, periphery: 0.64, cortex: 0.24, P < 0.01, F-test).
To examine the relationship between the texture and speed representations, we assessed the extent to which the texture and speed subspaces were orthogonal. That is, to what degree do changes in speed affect the speed representation but not the texture representation and vice versa? To this end, we computed the proportion of speed-related variance that was captured by each dimension of the texture representation (Fig. 3C), a quantity we refer to as the alignment index (Elsayed et al. 2016; Gallego et al. 2018) (see Methods). We found that speed-driven changes were primarily captured by the first PC of the texture representation, and this relationship was far stronger in the periphery than in cortex (average alignment index, peripheral: 0.80, cortical: 0.46). This effect was robust across the full texture space (Fig. 3D), where the peripheral representations of texture and speed were still more closely aligned than were their cortical counterparts. Surprisingly, this effect was not simply a consequence of a subpopulation of particularly speed-invariant neurons. Rather, we found that the increased separation of speed and texture was robustly present even when the most speed-invariant cortical neurons were removed (Supplementary Fig. 4). We surmized that the increased independence of the cortical texture response could endow it with an increased ability to support speed-independent texture discrimination. We extended our SNR analysis to populations of neurons (see Methods) and indeed found that cortical subpopulations showed stronger discriminability of texture pairs than comparably sized populations of tactile fibers (Supplementary Fig. 3B–C), a strong contrast to the largely similar performance seen for individual cortical neurons and afferents. We conclude that, as texture-driven responses ascend the somatosensory hierarchy, populations of neurons encode speed and texture information in increasingly independent representations that support speed-invariant texture discrimination.
Cortical Responses Account for Speed-invariant Texture Perception
Next, we examined the extent to which neuronal responses could account for the well-documented speed-invariance of texture perception (Lederman 1974; Meftah et al. 2000; Boundy-Singer et al. 2017). To this end, we tested the hypothesis that perceived roughness is determined by the population firing rate in somatosensory cortex (Burton and Sinclair 1994; Lieber and Bensmaia 2019) using a previously published set of roughness ratings obtained from human subjects. First, we regressed roughness ratings onto the population firing rate evoked when textures are scanned across the skin at 80 mm/s (Fig. 4A) (cross validated R2, peripheral: 0.81, cortical: 0.77). Next, we assessed how well this linear model could account for the neuronal responses at other speeds (Fig. 4B). We found that roughness predictions estimated from both peripheral and cortical responses were strongly modulated by changes in scanning speed (% increase in roughness per doubling of speed, periphery: 29.9%, cortex: 19.4%) in contrast to the true roughness ratings, which were largely speed-independent. Given the observed heterogeneity of cortical tuning, we next considered that the neural code for roughness might rely more on some neurons than others (Chapman et al. 2002; Bourgeon et al. 2016). To test this hypothesis, we regressed the first 5 texture-related PCs of each population response on perceived roughness (Fig. 4A,B, middle bars). This led to a more accurate prediction of perceived roughness (cross-validated R2, peripheral: 0.87, cortical: 0.81) but only marginally reduced the speed dependence of the roughness predictions (% increase in roughness per doubling of speed, periphery: 25.8%, cortex: 15.3%).
Figure 4.
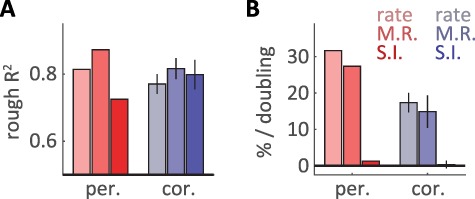
Cortical responses account for speed-invariant texture perception. (A) Cross-validated R2 between the predicted and true roughness, for predictions based on peripheral (red) and cortical (blue) population responses (populations of 21 cells). From left to right, bars represent predictions based on regressions of the population averaged firing rate (light, rate), the best-fit multiple regression of 5 PCs (medium, M.R.), and a best-fit regression constrained to maximize speed independence (dark, S.I.). Error bars denote standard deviations across 100 different subsamples of 21 cells. (B) Speed dependence of the roughness prediction reported as a percentage increase in firing rate per doubling of speed, with color conventions as in (A). Error bars denote standard deviations across 100 different subsamples of 21 cells. The cortical population can support a speed-independent prediction of roughness, while the peripheral population cannot simultaneously support speed-independence and an accurate roughness prediction.
To create fully speed-independent roughness predictions, we next constrained our regression weights to be orthogonal to the primary speed-related dimension (found using dPCA) in each population (Fig. 4A,B, right bars). This approach successfully eliminated the speed-dependence for both sets of roughness predictions (% increase in roughness per doubling of speed, periphery: 1.2%, cortex: 0.2%). However, for the peripheral population, enforcing speed-independence strongly reduced the predictive power of the peripheral model (peripheral cross-validated R2: 0.73, from 0.87). In contrast, enforcing speed independence had essentially no effect on the predictive power of the cortical model (cortical cross-validated R2: 0.79 from 0.81). This difference was robust across a wide range of subpopulation sizes and regression parameters (Supplementary Fig. 5A,B) but was highly variable for different individual subpopulations of peripheral afferents (Supplementary Fig. 5C). That is, while some subpopulations of afferents reached levels of roughness prediction that nearly matched their cortical counterparts, others failed catastrophically. Thus, the cortical population response contains a robust, speed-independent readout of perceived roughness that is not present in the peripheral firing rate response.
Known Cortical Computations Account for the Untangling of Speed and Texture Information
As information ascends any sensory neuraxis, neural representations are repeatedly transformed by a set of canonical computations that shape the feature selectivity of downstream neurons. One well-established transformation in the somatosensory system is the computation of spatial (Connor and Johnson 1992; DiCarlo and Johnson 2000; Lieber and Bensmaia 2019) and temporal (Saal et al. 2015) variation: the extent to which the peripheral neural representation exhibits inhomogeneous (edge-like) structure in space or time. We hypothesized that these differentiation computations could also give rise to an increasingly heterogeneous population response to texture and speed as signals ascend from periphery through cortex. Indeed, increased response heterogeneity has been proposed as an organizing principle for the structure of receptive fields in the visual and auditory systems (Olshausen and Field 1996, 2004; Van Hateren and Ruderman 1998; Lewicki 2002). To test this hypothesis, we built a neurally plausible model of spatial and temporal variation using the responses of peripheral afferents. Specifically, we added 2 subtractive influences to each modeled cell: spatially offset inhibition originating from a separate afferent and temporally offset inhibition tracking the cell’s response but with the sign inverted (Fig. 5A). Using a range of biologically plausible model parameters (see Methods), we investigated whether pseudo-populations of such simulated neurons exhibited speed-invariant texture coding.
We first verified that the outputs of the variation model resembled actual cortical responses to the single-speed texture experiment (median correlation with population-averaged cortical response to 24 textures scanned at 80 mm/s: variation model outputs r = 0.71, individual cortical neurons r = 0.75). Next, we evaluated the speed-sensitivity of individual “downstream” model outputs by calculating their speed/texture sensitivity ratio (as above). Outputs of the variation model showed comparable levels of speed-sensitivity to peripheral afferents (Fig. 5B) (speed/texture ratio, median ± median absolute deviation, model: 0.43 ± 0.18 vs. afferents: 0.59 ± 0.18). However, when we examined population-level representations in model outputs using the texture/speed alignment index (as above), we found that small populations (N = 21 units, see Methods) separated texture and speed more robustly than did peripheral afferents (Fig. 5C). Comparing these results to models built with only spatially or temporally offset inhibition, we found that this separation was most strongly driven by spatial variation mechanisms, although temporal variation mechanisms contributed significantly to the separation as well (Supplementary Fig. 6). Thus, our simulation suggests that the well-established cortical computations of spatial and temporal differentiation contribute to the heterogeneous speed- and texture-sensitivity observed in somatosensory cortex, which in turn underlies the untangling of speed and texture representations.
Discussion
The perception of texture is remarkably tolerant to changes in scanning speed. Indeed, psychophysical ratings along the 3 principal perceptual axes of textures—roughness, hardness, and stickiness—are identical across speeds (Lederman 1974; Meftah et al. 2000; Boundy-Singer et al. 2017). Furthermore, the perceived dissimilarity of a pair of textures—which probes texture perception across all of its dimensions and attributes—is very similar whether the 2 textures are scanned at the same speed or at different speeds (Boundy-Singer et al. 2017). What makes this perceptual invariance so remarkable is that the response of tactile nerve fibers is highly speed dependent. Indeed, in the nerve, texture-elicited firing rates increase with scanning speed, and temporal spiking sequences, which carry critical texture information, also change with speed. The central result of the present study is that the cortical population response exhibits a capacity for speed-invariant coding of texture that exceeds the capabilities of the peripheral population response. Therefore, somatosensory processing between the periphery and cortex yields overlaid representations of texture and speed that are relatively independent and thus much easier to decode independently.
Experimental Caveats
The textures used in the peripheral and cortical experiments were designed to address different scientific questions and only overlap partially. To overcome differences in texture set, we analyzed the neuronal responses to a subset of textures that drives similar patterns of responses in somatosensory cortex (Supplementary Fig. 1A). The speeds used in the cortical experiments spanned a different range than did those in the peripheral experiments to better span the behaviorally relevant range (Callier et al. 2015). To overcome differences in speed range, we selected a metric of speed-sensitivity (change in firing rate per doubling in speed) that is consistent at low and high ranges of speed (see Methods). These features of the analysis address biases based on stimulation paradigm (textures, speeds) that might skew our results. Note that we reach the same conclusions when using the full set of textures and speeds (Supplementary Fig. 1E) and that our measurements of peripheral and cortical speed-sensitivity are consistent with those observed by other groups (Supplementary Table 4).
In the present study, we use neural responses measured in macaques to predict texture perception in a different species, namely humans. Human and macaque hands show very similar patterns of cutaneous innervation (Johansson and Vallbo 1979; Darian-Smith and Kenins 1980; Paré et al. 2003), and the tactile nerve fibers in the 2 species exhibit nearly identical response properties (Johansson et al. 1982; Phillips et al. 1992). Macaques can successfully perform texture discrimination tasks (Chapman and Ageranioti-Bélanger 1991; Tremblay et al. 1996), and human texture perception can be successfully predicted by the responses of macaque nerve fibers (Connor et al. 1990; Connor and Johnson 1992; Blake et al. 1997; Weber et al. 2013; Lieber et al. 2017) and cortical neurons (Bourgeon et al. 2016; Lieber and Bensmaia 2019). The macaque model of texture and speed coding is thus well suited to account for human texture perception.
Previous Work on the Speed Invariance of Texture Representations
We find a continuum of response properties in somatosensory cortex, from neurons that are as sensitive to speed as are peripheral afferents to neurons whose responses are nearly speed-independent. These data are broadly consistent with previous studies that have emphasized that different cortical neurons show responses that are purely texture-selective, purely speed-selective, or responsive to both texture and speed (Tremblay et al. 1996; Dépeault et al. 2013; Bourgeon et al. 2016). However, we emphasize that there exists significant response heterogeneity within these subpopulations as well and that the distribution of speed-sensitivity across cortex is likely better described as a continuum than as a bimodal distribution of texture and speed specialists.
Variation Computations Give Rise to Speed-invariant Representations of Texture
In the above analyses, we compare texture representations in afferent firing rates and cortical firing rates. However, a large body of evidence suggests that stimulus information is not encoded simply in the firing rates of tactile nerve fibers but rather in spatiotemporal patterns of activation (Talbot et al. 1968; LaMotte and Mountcastle 1975; Connor and Johnson 1992; DiCarlo and Johnson 2000; Mackevicius et al. 2012; Weber et al. 2013; Birznieks and Vickery 2017). These putative peripheral neural codes imply computations along the neuraxis where spatiotemporal motifs in the afferent input are converted to firing rate codes downstream. One of the canonical computations is that of differentiation, both spatial and temporal. Indeed, neurons in somatosensory cortex have been shown to exhibit Gabor-like spatial receptive fields, reflecting a spatial differentiation (DiCarlo and Johnson 2000; Sripati et al. 2006; Bensmaia et al. 2008), and bilobed temporal receptive fields, reflecting temporal differentiation (DiCarlo and Johnson 2000; Sripati et al. 2006; Saal et al. 2015). We demonstrate that these computations confer an additional benefit to the cortical code for texture: increased separability of information about texture and speed. This separability likely reflects a broader sensory function, namely to create a basis set that efficiently and sparsely encodes behaviorally relevant features across the breadth of naturally occurring stimuli (Olshausen and Field 2004). In the somatosensory system, Gabor-like spatial and temporal filters transform a largely homogeneous set of peripheral responses into a widely divergent set of cortical responses, as has also been shown in the visual system (Olshausen and Field 1996; Van Hateren and Ruderman 1998).
We emphasize that a single variation filter, by itself, is not sufficient to create response heterogeneity in a neural representation. Consider the receptive field structure of neurons in the lateral geniculate nucleus (LGN). Although these neurons do compute spatial variation, they do so using a spatial receptive field structure (center-surround) that is relatively homogeneous within any local population (Derrington and Lennie 1984). One synapse later, local populations of neurons in primary visual cortex exhibit receptive field structures that vary widely in their spatial extent, spatial frequency, and orientation (De Valois et al. 1982). This expansion in response properties is likely due to the increase in neural representation size between LGN and cortex. A comparable expansion exists between the somatosensory periphery and cortex, an important prerequisite for the observed heterogeneity in cortical responses. As such, we would attribute the separation of speed and texture information not just to the presence of variation filters per se but rather to the wide range of different variation filters implemented along the somatosensory neuraxis. As inhibitory “variation-like” computations have been observed in the cuneate nucleus and ventral posterior thalamus (Bystrzycka et al. 1977; Lee et al. 1994), this separation of speed and texture information may begin to arise at earlier stages of processing and likely continues to progress at later ones.
Invariance as a Canonical Sensory Computation
To produce a stable percept of object identity, the somatosensory system must correct for the influence of speed from the texture representation. However, information about tactile speed is behaviorally relevant and thus ideally would be preserved rather than eliminated. We find that the somatosensory system does not discard speed information but rather partitions texture and speed representations into increasingly separated subspaces. This partitioning is not perfect: the representation of tactile speed in somatosensory cortex is highly contaminated by texture identity, and this influence of texture leads to a predictably nonveridical perception of tactile speed (Delhaye et al. 2019). Nonetheless, the preservation of any speed information speaks to the capacity of the cortical population representation to simultaneously encode many relevant variables.
We find that, at the somatosensory periphery, object information (texture) and information about exploratory parameters (speed) are inextricably tangled together. As this mixed signal ascends the somatosensory hierarchy, it is transformed into 2 independently readable representations of these 2 parameters. This mirrors results from vision and audition, where successive levels of processing lead to a higher fidelity readout of both object identity (Rust and DiCarlo 2010; Town et al. 2018) and exploratory parameters (Hong et al. 2016). These convergent results suggest that separating (or untangling) information about objects and exploratory parameters is a canonical sensory computation (DiCarlo and Cox 2007).
Supplementary Material
Funding
NINDS (grant NS101325).
Notes
We would like to thank Alison Weber and Ju-Wen Cheng for collecting the peripheral nerve data, Zoe Boundy-Singer and Kristine Mclellan for collecting the psychophysical data, and Benoit Delhaye and Katie Long for helpful discussions. Conflict of Interest: None declared.
References
- Avidan G, Harel M, Hendler T, Ben-Bashat D, Zohary E, Malach R. 2002. Contrast sensitivity in human visual areas and its relationship to object recognition. J Neurophysiol. 87:3102–3116. [DOI] [PubMed] [Google Scholar]
- Bengtsson F, Brasselet R, Johansson RS, Arleo A, Jörntell H. 2013. Integration of sensory quanta in cuneate nucleus neurons in vivo. PLoS One. 8:e56630. [DOI] [PMC free article] [PubMed] [Google Scholar]
- Bensmaia SJ, Denchev PV, Dammann JF, Craig JC, Hsiao SS. 2008. The representation of stimulus orientation in the early stages of somatosensory processing. J Neurosci. 28:776–786. [DOI] [PMC free article] [PubMed] [Google Scholar]
- Birznieks I, Vickery RM. 2017. Spike timing matters in novel neuronal code involved in vibrotactile frequency perception. Curr Biol. 27:1485–1490. [DOI] [PubMed] [Google Scholar]
- Blake DT, Johnson KO, Hsiao SS. 1997. Monkey cutaneous SAI and RA responses to raised and depressed scanned patterns: effects of width, height, orientation, and a raised surround. J Neurophysiol. 78:2503–2517. [DOI] [PubMed] [Google Scholar]
- Boundy-Singer ZM, Saal HP, Bensmaia SJ. 2017. Speed invariance of tactile texture perception. J Neurophysiol. 118:2371–2377. [DOI] [PMC free article] [PubMed] [Google Scholar]
- Bourgeon S, Dépeault A, Meftah E-M, Chapman CE. 2016. Tactile texture signals in primate primary somatosensory cortex and their relation to subjective roughness intensity. J Neurophysiol. 115:1767–1785. [DOI] [PMC free article] [PubMed] [Google Scholar]
- Burton H, Sinclair RJ. 1994. Representation of tactile roughness in thalamus and somatosensory cortex. Can J Physiol Pharmacol. 72:546–557. [DOI] [PubMed] [Google Scholar]
- Bystrzycka E, Nail BS, Rowe M. 1977. Inhibition of cuneate neurones: its afferent source and influence on dynamically sensitive “tactile” neurones. J Physiol. 268:251–270. [DOI] [PMC free article] [PubMed] [Google Scholar]
- Cadieu CF, Hong H, Yamins DLK, Pinto N, Ardila D, Solomon EA, Majaj NJ, DiCarlo JJ. 2014. Deep neural networks rival the representation of primate IT cortex for core visual object recognition. PLoS Comput Biol. 10:e1003963. [DOI] [PMC free article] [PubMed] [Google Scholar]
- Callier T, Saal HP, Davis-Berg EC, Bensmaia SJ. 2015. Kinematics of unconstrained tactile texture exploration. J Neurophysiol. 113:3013–3020. [DOI] [PMC free article] [PubMed] [Google Scholar]
- Chapman CE, Ageranioti-Bélanger SA. 1991. Discharge properties of neurones in the hand area of primary somatosensory cortex in monkeys in relation to the performance of an active tactile discrimination task. Exp Brain Res. 87:319–339. [DOI] [PubMed] [Google Scholar]
- Chapman CE, Tremblay F, Jiang W, Belingard L, Meftah EM. 2002. Central neural mechanisms contributing to the perception of tactile roughness. Behav Brain Res. 135:225–233. [DOI] [PubMed] [Google Scholar]
- Connor CE, Hsiao SS, Phillips JR, Johnson KO. 1990. Tactile roughness: neural codes that account for psychophysical magnitude estimates. J Neurosci. 10:3823–3836. [DOI] [PMC free article] [PubMed] [Google Scholar]
- Connor CE, Johnson KO. 1992. Neural coding of tactile texture: comparison of spatial and temporal mechanisms for roughness perception. J Neurosci. 12:3414–3426. [DOI] [PMC free article] [PubMed] [Google Scholar]
- Croner LJ, Kaplan E. 1995. Receptive fields of P and M ganglion cells across the primate retina. Vision Res. 35:7–24. [DOI] [PubMed] [Google Scholar]
- Darian-Smith I, Kenins P. 1980. Innervation density of mechanoreceptive fibres supplying glabrous skin of the monkey’s index finger. J Physiol. 309:147–155. [DOI] [PMC free article] [PubMed] [Google Scholar]
- De Valois RL, Albrecht DG, Thorell LG. 1982. Spatial frequency selectivity of cells in macaque visual cortex. Vision Res. 22:545–559. [DOI] [PubMed] [Google Scholar]
- Delhaye BP, O'Donnell MK, Lieber JD, McLellan K.R, Bensmaia SJ. 2019. Feeling fooled: texture contaminates the neural code for tactile speed. PLoS Biol. 17. [DOI] [PMC free article] [PubMed] [Google Scholar]
- Dépeault A, Meftah EM, Chapman CE. 2013. Neuronal correlates of tactile speed in primary somatosensory cortex. J Neurophysiol. 110:1554–1566. [DOI] [PubMed] [Google Scholar]
- Derrington AM, Lennie P. 1984. Spatial and temporal contrast sensitivities of neurones in lateral geniculate nucleus of macaque. J Physiol. 357:219–240. [DOI] [PMC free article] [PubMed] [Google Scholar]
- DiCarlo JJ, Cox DD. 2007. Untangling invariant object recognition. Trends Cogn Sci. 11:333–341. [DOI] [PubMed] [Google Scholar]
- DiCarlo JJ, Johnson KO. 1999. Velocity invariance of receptive field structure in somatosensory cortical area 3b of the alert monkey. J Neurosci. 19:401–419. [DOI] [PMC free article] [PubMed] [Google Scholar]
- DiCarlo JJ, Johnson KO. 2000. Spatial and temporal structure of receptive fields in primate somatosensory area 3b: effects of stimulus scanning direction and orientation. J Neurosci. 20:495–510. [DOI] [PMC free article] [PubMed] [Google Scholar]
- Elsayed GF, Lara AH, Kaufman MT, Churchland MM, Cunningham JP. 2016. Reorganization between preparatory and movement population responses in motor cortex. Nat Commun. 7:13239. [DOI] [PMC free article] [PubMed] [Google Scholar]
- Enroth-Cugell C, Robson JG. 1966. The contrast sensitivity of retinal ganglion cells of the cat. J Physiol. 187:517–552. [DOI] [PMC free article] [PubMed] [Google Scholar]
- Essick GK, Edin BB. 1995. Receptor encoding of moving tactile stimuli in humans. II. The mean response of individual low-threshold mechanoreceptors to motion across the receptive field. J Neurosci. 15:848–864. [DOI] [PMC free article] [PubMed] [Google Scholar]
- Finn IM, Priebe NJ, Ferster D. 2007. The emergence of contrast-invariant orientation tuning in simple cells of cat visual cortex. Neuron. 54:137–152. [DOI] [PMC free article] [PubMed] [Google Scholar]
- Gallego JA, Perich MG, Naufel SN, Ethier C, Solla SA, Miller LE. 2018. Cortical population activity within a preserved neural manifold underlies multiple motor behaviors. Nat Commun. 9:4233. [DOI] [PMC free article] [PubMed] [Google Scholar]
- Gamzu E, Ahissar E. 2001. Importance of temporal cues for tactile spatial- frequency discrimination. J Neurosci. 21:7416–7427. [DOI] [PMC free article] [PubMed] [Google Scholar]
- Goodwin AW, Morley JW. 1987a. Sinusoidal movement of a grating across the monkey’s fingerpad: representation of grating and movement features in afferent fiber responses. J Neurosci. 7:2168–2180. [DOI] [PMC free article] [PubMed] [Google Scholar]
- Goodwin AW, Morley JW. 1987b. Sinusoidal movement of a grating across the monkey’s fingerpad: effect of contact angle and force of the grating on afferent fiber responses. J Neurosci. 7:2192–2202. [DOI] [PMC free article] [PubMed] [Google Scholar]
- Handel S, Erickson ML. 2001. A rule of thumb: the bandwidth for timbre invariance is one octave. Music Percept An Interdiscip J. 19:121–126. [Google Scholar]
- Hong H, Yamins DLK, Majaj NJ, Dicarlo JJ. 2016. Explicit information for category-orthogonal object properties increases along the ventral stream. Nat Neurosci. 19:613–622. [DOI] [PubMed] [Google Scholar]
- Johansson RS, Landstrom U, Lundstrom R. 1982. Responses of mechanoreceptive afferent units in the glabrous skin of the human hand to sinusoidal skin displacements. Brain Res. 244:17–25. [DOI] [PubMed] [Google Scholar]
- Johansson RS, Vallbo ÅB. 1979. Tactile sensibility in the human hand: relative and absolute densities of four types of mechanoreceptive units in glabrous skin. J Physiol. 286:283–300. [DOI] [PMC free article] [PubMed] [Google Scholar]
- Joris PX, Bergevin C, Kalluri R, Mc Laughlin M, Michelet P, van der Heijden M, Shera CA. 2011. Frequency selectivity in old-world monkeys corroborates sharp cochlear tuning in humans. Proc Natl Acad Sci. 108:17516–17520. [DOI] [PMC free article] [PubMed] [Google Scholar]
- Kobak D, Brendel W, Constantinidis C, Feierstein CE, Kepecs A, Mainen ZF, Qi XL, Romo R, Uchida N, Machens CK. 2016. Demixed principal component analysis of neural population data. Elife. 5:e10989. [DOI] [PMC free article] [PubMed] [Google Scholar]
- LaMotte RH, Mountcastle VB. 1975. Capacities of humans and monkeys to discriminate vibratory stimuli of different frequency and amplitude: a correlation between neural events and psychological measurements. J Neurophysiol. 38:539–559. [DOI] [PubMed] [Google Scholar]
- Lederman SJ. 1974. Tactile roughness of grooved surfaces: the touching process and effects of macro-and microsurface structure. Percept Psychophys. 16:385–395. [Google Scholar]
- Lederman SJ. 1981. The perception of surface roughness by active and passive touch. Bull Psychon Soc. 18:253–255. [Google Scholar]
- Lederman SJ, Taylor MM. 1972. Fingertip force, surface geometry, and the perception of roughness by active touch. Percept Psychophys. 12:401–408. [Google Scholar]
- Lee SM, Friedberg MH, Ebner FF. 1994. The role of GABA-mediated inhibition in the rat ventral posterior medial thalamus. I. Assessment of receptive field changes following thalamic reticular nucleus lesions. J Neurophysiol. 71:1702–1715. [DOI] [PubMed] [Google Scholar]
- Lewicki MS. 2002. Efficient coding of natural sounds. Nat Neurosci. 5:356. [DOI] [PubMed] [Google Scholar]
- Libouton X, Barbier O, Plaghki L, Thonnard JL. 2010. Tactile roughness discrimination threshold is unrelated to tactile spatial acuity. Behav Brain Res. 208:473–478. [DOI] [PubMed] [Google Scholar]
- Lieber JD, Bensmaia SJ. 2019. High-dimensional representation of texture in somatosensory cortex of primates. Proc Natl Acad Sci. 116:3268–3277. [DOI] [PMC free article] [PubMed] [Google Scholar]
- Lieber JD, Xia X, Weber AI, Bensmaia SJ. 2017. The neural code for tactile roughness in the somatosensory nerves. J Neurophysiol. 118:3107–3117. [DOI] [PMC free article] [PubMed] [Google Scholar]
- Mackevicius EL, Best MD, Saal HP, Bensmaia SJ. 2012. Millisecond precision spike timing shapes tactile perception. J Neurosci. 32:15309–15317. [DOI] [PMC free article] [PubMed] [Google Scholar]
- Marozeau J, de Cheveigné A, McAdams S, Winsberg S. 2003. The dependency of timbre on fundamental frequency. J Acoust Soc Am. 114:2946. [DOI] [PubMed] [Google Scholar]
- Meftah EM, Belingard L, Chapman CE. 2000. Relative effects of the spatial and temporal characteristics of scanned surfaces on human perception of tactile roughness using passive touch. Exp Brain Res. 132:351–361. [DOI] [PubMed] [Google Scholar]
- Metzen MG, Hofmann V, Chacron MJ. 2016. Neural correlations enable invariant coding and perception of natural stimuli in weakly electric fish. Elife. 5:e12993. [DOI] [PMC free article] [PubMed] [Google Scholar]
- Morley JW, Goodwin AW, Darian-Smith I. 1983. Tactile discrimination of gratings. Exp Brain Res. 49:291–299. [DOI] [PubMed] [Google Scholar]
- Olshausen BA, Field DJ. 1996. Emergence of simple-cell receptive field properties by learning a sparse code for natural images. Nature. 381:607–609. [DOI] [PubMed] [Google Scholar]
- Olshausen BA, Field DJ. 2004. Sparse coding of sensory inputs. Curr Opin Neurobiol. 14:481–487. [DOI] [PubMed] [Google Scholar]
- Paré M, Behets C, Cornu O. 2003. Paucity of presumptive ruffini corpuscles in the index finger pad of humans. J Comp Neurol. 456:260–266. [DOI] [PubMed] [Google Scholar]
- Phillips JR, Johansson RS, Johnson KO. 1992. Responses of human mechanoreceptive afferents to embossed dot arrays scanned across fingerpad skin. J Neurosci. 12:827–839. [DOI] [PMC free article] [PubMed] [Google Scholar]
- Rust NC, DiCarlo JJ. 2010. Selectivity and invariance (“invariance”) both increase as visual information propagates from cortical area V4 to IT. J Neurosci. 30:12978–12995. [DOI] [PMC free article] [PubMed] [Google Scholar]
- Saal HP, Harvey MA, Bensmaia SJ. 2015. Rate and timing of cortical responses driven by separate sensory channels. Elife. 4:e10450. [DOI] [PMC free article] [PubMed] [Google Scholar]
- Saal HP, Suresh AK, Solorzano LE, Weber AI, Bensmaia SJ. 2018. The effect of contact force on the responses of tactile nerve fibers to scanned textures. Neuroscience. 389:99–103. [DOI] [PubMed] [Google Scholar]
- Sachs MB, Young ED. 1979. Encoding of steady-state vowels in the auditory nerve: representation in terms of discharge rate. J Acoust Soc Am. 66:470. [DOI] [PubMed] [Google Scholar]
- Sadagopan S, Wang X. 2008. Level invariant representation of sounds by populations of neurons in primary auditory cortex. J Neurosci. 28:3415–3426. [DOI] [PMC free article] [PubMed] [Google Scholar]
- Sinclair RJ, Burton H. 1991. Neuronal activity in the primary somatosensory cortex in monkeys (Macaca mulatta) during active touch of textured surface gratings: responses to groove width, applied force, and velocity of motion. J Neurophysiol. 66:153–169. [DOI] [PubMed] [Google Scholar]
- Skedung L, Arvidsson M, Chung JY, Stafford CM, Berglund B, Rutland MW. 2013. Feeling small: exploring the tactile perception limits. Sci Rep. 3:2617. [DOI] [PMC free article] [PubMed] [Google Scholar]
- Sripati AP, Yoshioka T, Denchev P, Hsiao SS, Johnson KO. 2006. Spatiotemporal receptive fields of peripheral afferents and cortical area 3b and 1 neurons in the primate somatosensory system. J Neurosci. 26:2101–2114. [DOI] [PMC free article] [PubMed] [Google Scholar]
- Talbot WH, Darian-Smith I, Kornhuber HH, Mountcastle VB. 1968. The sense of flutter vibration comparison of the human capacity with response patterns of Mechanoreceptive afferents from the monkey hand. J Neurophysiol. 31:301. [DOI] [PubMed] [Google Scholar]
- Tanaka Y, Bergmann Tiest WM, Kappers AML, Sano A. 2014. Contact force and scanning velocity during active roughness perception. PLoS One. 9:e93363. [DOI] [PMC free article] [PubMed] [Google Scholar]
- Town SM, Wood KC, Bizley JK. 2018. Sound identity is represented robustly in auditory cortex during perceptual constancy. Nat Commun. 9:4786. [DOI] [PMC free article] [PubMed] [Google Scholar]
- Tremblay F, Ageranioti-Bélanger S a, Chapman CE. 1996. Cortical mechanisms underlying tactile discrimination in the monkey. I. Role of primary somatosensory cortex in passive texture discrimination. J Neurophysiol. 76:3382–3403. [DOI] [PubMed] [Google Scholar]
- Van Hateren JH, Ruderman DL. 1998. Independent component analysis of natural image sequences yields spatio-temporal filters similar to simple cells in primary visual cortex. Proc R Soc B Biol Sci. 265:2315–2320. [DOI] [PMC free article] [PubMed] [Google Scholar]
- Walker KMM, Bizley JK, King AJ, Schnupp JWH. 2011. Multiplexed and robust representations of sound features in auditory cortex. J Neurosci. 31:14565–14576. [DOI] [PMC free article] [PubMed] [Google Scholar]
- Weber AI, Saal HP, Lieber JD, Cheng J-W, Manfredi LR, Dammann JF, Bensmaia SJ. 2013. Spatial and temporal codes mediate the tactile perception of natural textures. Proc Natl Acad Sci U S A. 110:17107–17112. [DOI] [PMC free article] [PubMed] [Google Scholar]
Associated Data
This section collects any data citations, data availability statements, or supplementary materials included in this article.