

Abstract
Electroencephalogram (EEG) studies suggest an association between beta (13–30 Hz) power and reversal learning performance. In search for direct evidence concerning the involvement of beta oscillations in reversal learning, transcranial alternating current stimulation (tACS) was applied in a double-blind, sham-controlled and between-subjects design. Exogenous oscillatory currents were administered bilaterally to the frontal cortex at 20 Hz with an intensity of 1 mA peak-to-peak and the effects on reward-punishment based reversal learning were evaluated in hundred-and-eight healthy volunteers. Pre- and post-tACS resting state EEG recordings were analyzed. Results showed that beta-tACS improved rule implementation during reversal learning and decreases left and right resting-state frontal theta/beta EEG ratios following tACS. Our findings provide the first behavioral and electrophysiological evidence for exogenous 20 Hz oscillatory electric field potentials administered over to the frontal cortex to improve reversal learning.
Keywords: electroencephalogram, reversal learning, transcranial alternating current stimulation, beta power, theta/beta ratio
Introduction
Learning from reward and punishment feedback signals requires mental flexibility to adapt behavior (Schultz 2015). Evidence from studies using the electroencephalogram (EEG) has shown that neural oscillations play an important role during behavioral adaptation (Fries 2005; Benchenane et al. 2011; Cavanagh and Frank 2014; HajiHosseini and Holroyd 2014). Particularly, frontal cortex oscillatory activity in the theta (4–7 Hz) and beta (13–30 Hz) range is correlated to adjustments following incorrect responses and is predictive for next trial success rate (Van de Vijver et al. 2011). Reversal learning tasks offer a behavioral paradigm to investigate response adaptation based on reward and punishment feedback (Cools et al. 2002; Schutte et al. 2017). On the one hand, it has been suggested that theta activity reflects subcortically mediated approach motivation (Schutter and Van Honk 2005). As such theta activity is involved in reward and punishment processing and arguably subserves a variety of cognitive functions, including action monitoring (Cavanagh et al. 2012; Cohen and Donner 2013) and mental effort (Mussel et al. 2016). Beta power, on the other hand, is more associated with cognitive regulation governed by cortical areas, such as the dorsolateral prefrontal cortex (Engel and Fries 2010; Pennartz et al. 2011; Mas-Herrero and Marco-Pallares 2014; HajiHosseini and Holroyd 2015), and important for mediating between attention and memory requirements in reward and punishment processing (Mas-Herrero et al. 2015). In addition to the above-mentioned functions, theta activity is proposed to be involved in long-range neural communication between subcortical and cortical areas, whereas beta activity is thought to reflect local cortical communication (Donner and Siegel 2011; Fujisawa and Buzsaki 2011; Fries 2015). Local beta oscillations operate in the range of tens of milliseconds and enable top-down control via specific cognitive processes involved in attention and response inhibition (Engel and Fries 2010; Knyazev 2012). Thereby, these processes provide a temporal structure for interactions between more distant areas involving theta activity, which operates in the range of hundreds of milliseconds that integrate information on reward and punishment signals (Donner and Siegel 2011; Siegel et al. 2012; Knyazev 2012).
In recent years, transcranial alternating current stimulation (tACS) is increasingly used to modulate cognitive performance by applying weak oscillatory currents on the head, which are thought to entrain endogenous cortical rhythms (Schutter 2014; Schutter and Wischnewski 2016). In a previous study, we applied tACS in the theta range (6 Hz) over the frontal cortex during reversal learning (Wischnewski et al. 2016) and found better learning performance in the active as compared to sham tACS condition. Specifically, participants showed faster learning rates, as evidenced by quicker transitions between strategies to changes in reward and punishment contingencies. However, the increased learning rate was at the cost of rule implementation, as evidenced by less risk taking compared with the control condition when high risk taking was the best strategy. Furthermore, whereas no effect on theta and beta power was observed, tACS-induced decreases in the ratio between theta and beta activity were found. This observation concurs with previous studies showing an inverse relationship between theta/beta ratio and risk taking (Schutter and van Honk 2005; Massar et al. 2014; Schutte et al. 2017). The theta/beta ratio is suggested to reflect the balance between motivational tendencies and cognitive regulation. Since the theta/beta ratio correlates with a variety of (partially overlapping) processes, such as learning ability, risk-taking, processing speed, impulsivity and attention, it may reflect a global measure of behavioral Adaptation (Schutter and van Honk 2005; Massar et al. 2012, 2014; Morillas-Romero et al. 2015; Angelidis et al. 2016; Keune et al. 2017, 2019; Schutte et al. 2017).
Recently, biophysically-oriented studies have demonstrated that the tACS montage can affect the phase at which alternating currents are applied. In a traditional two-electrode tACS montage electric currents of the electrodes have an opposite phase-relationship. By using montages with more than two electrodes the phase-relationship of the electric currents can be manipulated allowing for flexible configurations with antiphase and in-phase stimulation (Polania et al. 2013). For example, an antiphase relationship between two electrodes leaves open the possibility for an in-phase relationship with a third electrode. It has been argued that in-phase tACS increases neuronal synchronization and spectral power, which arguably facilitates behavioral performance. In contrast, antiphase tACS has been proposed to decrease neural synchronization and spectral power, which yields decreases in behavioral performance (Polania et al. 2013; Helfrich et al. 2014; Alekseichuk et al. 2017).
In the present study, we explored the effect of beta-tACS on a reversal learning task using two different electrode montages. Based on the idea that beta power reflects communication of local intracortical connections, one montage was designed to increase local beta power in left and right frontal cortex by applying in-phase currents within each hemisphere (tACSLOCAL). Since stimulation of beta activity may increase cognitive regulation during decision making, we hypothesized that the tACSLOCAL montage would facilitate reversal learning performance. Conversely, the second montage applied in-phase currents between hemispheres (tACSINTER) was not expected to affect local beta activity or reversal learning performance. Furthermore, since lower theta/beta ratio values are related to better cognitive performance, a decrease in theta/beta ratio was hypothesized after tACSLOCAL. Finally, relationship between behavioral effects and theta/beta ratio were examined by exploratory correlation analyses.
Materials and Methods
Participants
Hundred-and-eight healthy right-handed volunteers (mean age ± SD = 22.46 ± 3.66, range 18–34 years, 73 female) participated in the study. All volunteers had normal or corrected-to-normal vision and were right handed. Exclusion criteria were: (i) history of psychiatric or neurological diseases, (ii) metallic objects in the head; (iii) implanted devices (e.g., pacemaker, cochlear implant), (iv) used psycho-active medication or recreational drugs less than 48 h before the experiment and (v) skin disease/allergy. The protocol was approved by the medical ethical committee of the Commissie Mensgebonden Onderzoek, Arnhem-Nijmegen and carried out in accordance with the Declaration of Helsinki (Fortaleza amendments).
Sample size was estimated by performing a power analysis using G*Power 3.0.1. (Faul et al. 2007). For this analysis an effect size of Cohen’s d = 0.7 was used, based on the behavioral and electrocortical effects found in our previous study using theta tACS on reversal learning (Wischnewski et al. 2016). Based on this effect size and a three-factor between subjects ANOVA, a power of 0.8 (1-β), and an α = 0.017 (after Bonferroni correction with three groups), required sample size was 108 participants.
Reversal Learning Task
The present task has been validated by previous studies to evaluate reversal learning (Wischnewski et al. 2016; Schutte et al. 2017). Two options were presented vertically on a screen, representing points that could be gained (reward) or lost (punishment). Eight point combinations were randomly presented and always consisted of a high and a low number (5–25; 25–5; 10–30; 30–10; 15–35; 35–15; 20–40; 40–20). Selection of the high points option corresponded to a high-risk decision that would either lead to a relatively large reward when participants had opted correctly (i.e., points gained) or to a relative large punishment when participants had chosen incorrectly (i.e., points lost). Selection of the low points option corresponded to a low-risk decision and would either lead to a relative small reward when being correct and a relatively small punishment when being wrong. High or low risk options could be selected by clicking on the left (high risk option) or right (low risk option) computer mouse button with either left or right thumb (Fig. 1A). Although there was no time constraint, participants were encouraged to respond as quickly as possible. Feedback was presented as colored squares, which indicated whether the response was correct (green square) or wrong (red square) 500 ms after a decision was made. Depending on the outcome, points were either added or subtracted from the total score. The total score was shown after each trial for 2000 ms. The intertrial interval was jittered between 800 and 1200 ms. An overview of a single trials is shown in Figure 1A. In total, the task consisted of 120 trials with two strategy reversals. First, participants learn that high-risk options are preferred (high risk: 80%, low risk: 20%). After 40 trials, participants had to reverse their strategy to low-risk options (high risk: 20%, low risk: 80%). Finally, after 80 trials the strategy had to be reversed again to high-risk options (high risk: 80%, low risk: 20%). Participants were unaware of the reversals at the start of the task and were informed that they could use any strategy to score as many points as possible. Duration of the task was approximately 12 min.
Figure 1.
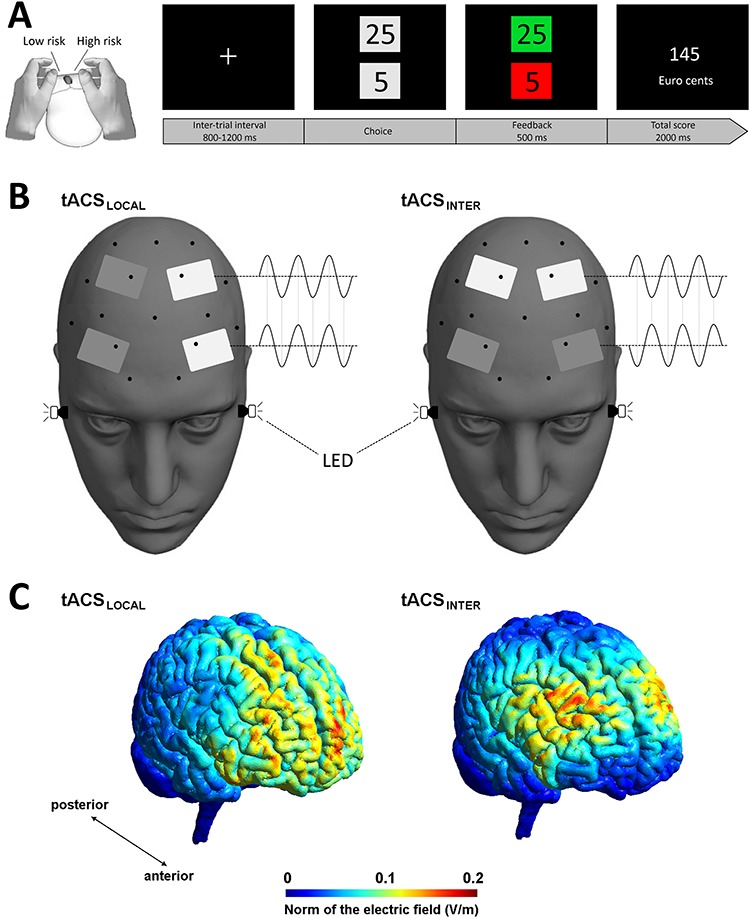
(A) Response buttons on the computer mouse on the left and an overview of a single trial on the right. (B) Left: same phase stimulation within the same hemisphere was applied to increase local beta power (tACSLOCAL). Right: opposing phase stimulation within the same hemisphere was applied to decrease local beta power (tACSINTER). To control for phosphene perception, flickering LEDs were attached next to the participant eyes. (C). Simulation of induced electric fields for tACSLOCAL and tACSINTER.
Transcranial Alternating Current Stimulation
Alternating currents were applied using a battery-driven stimulator (Eldith DC Stimulator (CE 0118), NeuroConn GmbH) and two pairs of 3 × 5 cm electrodes (15 cm2) placed under the EEG cap. Stimulation electrodes were made of conductive rubber and attached to the head using adhesive conductive paste (Ten20, Weaver and Company). Intensity of stimulation was set to 1 mA peak-to-peak. The ramp up and ramp down period at the start and end of the stimulation respectively was 5 s. Stimulation was turned on 1 min before the start of the task and lasted until the end of the task. In the sham condition, only 20 s of real tACS was applied between ramp up and ramp down period.
Two electrodes were placed over bilateral frontal cortex with the center of the electrode 2 cm lateral of AF3 and AF4. The second pair of electrodes was placed fronto-centrally 1 cm lateral of Fc1 and Fc2. Using a four electrode set-up allowed for manipulating the phase of tACS intra- and inter-hemispherically (Alekseichuk et al. 2017). Accordingly, in one condition, tACS was applied to increase local beta power within each hemisphere and creating opposing phase currents between left and right hemisphere. This montage will be referred to as tACSLOCAL (Fig. 1B). In the second experimental condition tACS was applied to decrease beta power within each hemisphere and creating same phase currents between left and right hemisphere. This montage will be referred to as tACSINTER (Fig. 1B). For the sham condition in-phase and antiphase montages were applied in a counter-balanced fashion between the participants. Electrode impedances were kept below 10 kΩ at all time.
The four electrode montages were centered on F3 and F4 to target the dorsolateral prefrontal cortex. The montages were based on computational modeling performed by SimNIBS version 2.1.0 software (Opitz et al. 2015). For this computation the following parameters were set: electrode shape = rectangular, electrode size = 3 × 5 cm, electrode thickness = 1 mm, no sponges. Results showed that both tACSLOCAL and tACSINTER cover a relatively large area in the frontal cortex, with electric field peak values over the dorsolateral prefrontal cortex (Fig. 1C). Stimulation area of tACSLOCAL extended slightly to more anterior regions as compared with tACSINTER.
Phosphene Control
A number of studies indicate that beta-tACS may evoke transcutaneous retinal phosphenes, which can affect cognitive performance (Schutter and Hortensius 2010; Kar and Krekelberg 2012; Schutter 2016). To control for this, two light-emitting diodes (LED) were placed on the outer canthi of the eyes. During the task the lights flickered at the same frequency as the tACS (20 Hz). The flickering of the LEDs overrides tACS-induced phosphene perception and therefore flickering sensation in each condition would be the same. After the experiment, participants were questioned about the intensity of the light flashes and if the perception of the flickering changed over time. Additionally, volunteers were also asked if they thought the lights had interfered with their performance. Finally, participants were asked if they had an idea what the purpose of the lights was. Results are presented in Supplementary Appendix B.
Electroencephalogram
Resting state EEG was recorded using an ActiveTwo system (BioSemi), with 32 electrodes placed according to the international 10–20 system. Data were sampled at 2048 Hz using a default online bandpass filter (DC to 400 Hz). Resting state EEG was recorded for 4 min, alternating between opened and closed eyes each minute. Data were recorded using BrainVision Recorder and stored for offline analysis using BrainVision Analyzer 2.1 (Brain Products GmbH).
Procedure
Participants were recruited using a campus database. All subjects were divided across two experimental groups (in-phase tACS: mean age ± SD = 22.56 ± 3.68, range 19–34 years, 23 female; antiphase tACS: mean age ± SD = 22.36 ± 3.86, range 18–34 years, 26 female) and one control group (mean age ± SD = 22.47 ± 3.55, range 18–31 years, 24 female) with n = 36 for each. After filling out a safety screening and informed consent form, EEG was prepared. After the preparation, the pretest resting state EEG was recorded for 4 min. Afterward tACS electrodes were placed under the EEG cap and the phosphene control LEDs were attached. LEDs and brain stimulation were turned on 1 min before the start of the task, to ensure that participants were comfortable with the tACS-induced sensations. Then participants performed the task, which lasted approximately 12 min. After the end of the task, tACS electrodes were removed and the post-test resting state EEG was recorded. Finally, participants filled out an adapted version of the questionnaire of Fertonani et al. (2015), with additional questions on the sensation of the lights (Appendices A and B).
Data Reduction and Analysis
Reversal Learning Performance
A four-parameter logistic least-squares was fit to the averaged choices of participants for the first and second reversal (Capaday 1997; Capaday et al. 1999; Wischnewski et al. 2016), according to the following formula:
 |
where Hmin and Hmax represent the lower and higher asymptote respectively, which is an indicator of the percentage high risk taking in low and high risk blocks. A value approximating one suggests that participants always opted for the high risk choice, whereas values approximating zero suggest that participants never opted for the high risk choice (i.e., always chose the low risk option). The inflection point, I50, depicts trial number x at which the midpoint between Hmin and Hmax is reached. This parameter provides an index for the amount of trials participants need to reverse from high to low risk and vice versa. Finally, parameter S reflects the maximum slope of the logistic function and is and indicator for the learning rate. For the first reversal, participant averages from trial 21 to 60 were used (reversal after trial 40) and for the second reversal participant averages from trial 61 to 100 were used (reversal after trial 80). To explore baseline differences in initial learning, a linear regression function was fit to participant averages of the first 20 trials.
Resting-State EEG
All EEG recordings were offline band-pass filtered (shift-free Butterworth) between 1 and 30 Hz (48 dB/Octave) and re-referenced to the average signal. The four-minute resting-state EEG measurements were segmented into 2-s epochs and corrected for eye blinks measured by electrode Fp1 using the Gratton and Coles method (Gratton et al. 1983). Spectral power levels were acquired by performing a fast Fourier transform analysis (Hanning window length: 10%) in the theta (4–7 Hz) and beta (13–30 Hz) frequency range. Additionally, the theta/beta ratios were calculated. For the statistical analysis post-test–pretest difference scores were calculated for both left and right frontal cortex. Since beta power is related to activity in the dorsolateral prefrontal cortex, electrodes F3 and F4 were selected for analysis (HajiHosseini and Holroyd 2015). An additional analysis was performed to compare the present data with the results of study by Wischnewski et al. (2016). That is, the theta/beta ratio was inspected by pooling left (F3, F7, Fc1, Fc5, C3) and right (F4, F8, Fc2, Fc6, C4) fronto-central electrodes. Results are shown in Supplementary Appendix E. Outliers were removed before the statistical analysis (11 out of 648 data points based on a mean ± 3.5*standard deviation criterion; Iglewicz and Hoaglin 1993).
Correlation Between Reversal Learning and Theta/Beta Ratio
An exploratory correlation analysis was performed between rule implementation and the difference in theta–beta ratio before and after the reversal learning task. Note that the four-parameter logistic regression analysis does not provide data points for each participant. Therefore, we provided a measure for the relationship between physiological change in theta/beta ratio and behavioral rule implementation (i.e., proportion high and low risk taking). As a proxy for Hmin and Hmax, the proportion risk taking in high and low risk blocks was calculated per participant and averaged over the two reversals. That is, the amount of high-risk choices in trials 21–40 and 81–100 (high risk blocks) divided by the total amount of trials (40), as well as the amount of low-risk taken in trials 41–80 (low risk blocks) divided by 40 trials. Both the proportion low and high risk taking was correlated to the pre-to-post theta/beta ratio change (averaged over F3 and F4) after intervention (sham, tACSINTER, tACSLOCAL). Note that this correlation is not specific to the intervention type.
Statistical Analysis
Statistical analyses were performed using SPSS version 22.0 (IBM corporation) and JMP 14.0 (Cary). Goodness of fit measures, based on Akaike information criterion corrected (AICc) and explained variance (r2), were performed to confirm if the four-parameter logistic regression is indeed the best fit for the data. This fit was compared with a linear, quadratic, cubic, two-parameter logistic, and three-parameter logistic regression. Results can be found in Supplementary Appendix C. For the main analysis, the linear of the initial learning phase and four-parameter logistic regression values were compared between sham and active tACS conditions separately for the first and second reversal using one-way between-subjects analyses of variance (ANOVA). Differences in pretest (baseline) EEG power were analyzed by performing repeated measures ANOVAs for theta and beta power and theta/beta ratio, with both hemispheres and type of stimulation as within-subjects variable (Supplementary Appendix C). Post – pretest changes in spectral activity were calculated for tACSLOCAL, tACSINTER, and sham tACS and for both hemispheres (F3 and F4). These values were statistically compared using 2 × 3 repeated-measures ANOVAs with theta power, beta power, and theta/beta ratio as dependent variables, both hemispheres as independent between-subjects variable and type of stimulation as independent within-subjects variable. Finally, a Pearson correlation analyses between theta/beta ratio and low and high risk taking were performed. For all comparisons, the level of significance was set to α = 0.05 (two-tailed).
Results
Stimulation was well tolerated and no adverse events occurred. The sensation of tACS was comparable between groups. Itching sensation was categorized as ‘strong’ by two participants and as ‘considerable’ by one participant. All other sensations were categorized as none, mild or moderate (see Appendices A and B). Furthermore, annoyance by the flickering LEDs was categorized as none, mild or moderate and was comparable between conditions (see Supplementary Appendix B). Six participants in the tACSLOCAL and sham condition and seven participants in the tACSINTER group felt that the LEDs had a slight effect on their performance. Stimulation electrode impendences were similar between groups (tACSLOCAL: 3.67 ± 0.24 kΩ, tACSINTER: 3.16 ± 0.42 kΩ, sham: 3.17 ± 0.31 kΩ; F(2,106) = 0.80, P = 0.450). Blinding of participants was successful, since identification of active and sham tACS was at chance level with 54.6% guessing correctly (χ2 = 0.86, P = 0.355).
Reversal Learning
Goodness of fit measures showed that the model with the four-logistic curve explained over 70% of the variance for both reversals in all conditions, The four-logistic regression model best explained the data as compared with a linear, quadratic, cubic, two-parameter logistic, and three-parameter logistic regression (Supplementary Appendix C, Capaday 1997; Capaday et al. 1999; Wischnewski et al. 2016). A linear regression on the first 20 trials showed no difference in intercept values (F(2,106) = 0.61, P = 0.545) and regression coefficients (F(2,106) = 1.40, P = 0.251) between groups, showing that initial learning was comparable between conditions (Fig. 2A). For the first reversal, a significant difference between stimulation groups was found for Hmax (F(2,106) = 4.90, P = 0.009, η2 = 0.085). Bonferroni-corrected post-hoc t-tests showed a significantly higher risk-taking probability for tACSLOCAL compared with sham (t(71) = 2.92, P = 0.014, d = 0.687). No significant effects were observed between tACSLOCAL and tACSINTER (t(71) = 2.15, P = 0.106, d = 0.506) and between tACSINTER and sham (t(71) = 0.81, P ~ 1, d = 0.192). Additionally, a significant difference between groups was found for the Hmin parameter (F(2,106) = 6.76, P = 0.002, η2 = 0.114). Bonferroni-corrected t-tests revealed a significantly higher probability of low risk-taking (i.e., lower probability of high risk-taking) for tACSLOCAL compared with sham (t(71) = 3.42, P = 0.003, d = 0.806) as well as for tACSINTER compared with sham (t(71) = 2.95, P = 0.013, d = 0.696). No effects were found for tACSLOCAL compared with tACSINTER (t(71) = 1.04, P = 0.899, d = 0.246). No difference in parameters GR and I50 were found for the first reversal (Fig. 2B, Table 1). In sum, participants showed better rule implementation during tACSLOCAL and tACSINTER compared with sham tACS, with no effect on learning speed.
Figure 2.
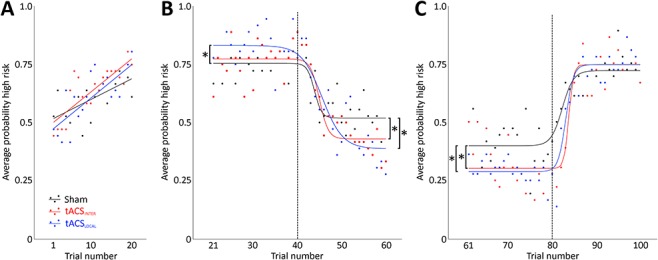
Reversal learning results. (A) A linear regression was performed to estimate differences in initial learning during the first 20 trials. (B,C) A regression using a four-parameter logistic function was used to estimate differences in reversal learning performance for the first (B) and second reversal (C). Results of the sham condition are presented in black, the tACSINTER condition in red, and the tACSLOCAL condition in blue. Significant differences are indicated by an asterisk.
Table 1.
Values of the four-parameter logistic fit for each condition and statistical comparison
| tACSLOCAL | tACSINTER | Sham | Statistic | ||
|---|---|---|---|---|---|
| Reversal 1 | H max | 0.831 ± 0.021 | 0.773 ± 0.017 | 0.754 ± 0.016 | F(2,106) = 4.90, P = 0.009, η2 = 0.085** |
| H min | 0.387 ± 0.033 | 0.429 ± 0.023 | 0.519 ± 0.020 | F(2,106) = 6.76, P = 0.002, η2 = 0.114** | |
| I50 | 45.575 ± 0.906 | 44.972 ± 0.603 | 43.867 ± 0.727 | F(2,106) = 1.31, P = 0.273, η2 = 0.024 | |
| GR | 0.428 ± 0.146 | 0.998 ± 0.523 | 1.229 ± 0.957 | F(2,106) = 0.42, P = 0.657, η2 = 0.008 | |
| Reversal 2 | H max | 0.744 ± 0.017 | 0.743 ± 0.024 | 0.718 ± 0.022 | F(2,106) = 0.48, P = 0.619, η2 = 0.009 |
| H min | 0.288 ± 0.014 | 0.301 ± 0.020 | 0.398 ± 0.020 | F(2,106) = 10.88, P < 0.001, η2 = 0.172*** | |
| I50 | 83.097 ± 0.340 | 83.766 ± 0.399 | 82.270 ± 0.784 | F(2,106) = 1.89, P = 0.156, η2 = 0.035 | |
| GR | 1.154 ± 0.395 | 1.856 ± 1.204 | 0.790 ± 0.425 | F(2,106) = 0.49, P = 0.612, η2 = 0.009 |
* P < 0.05, **P < 0.01, and ***P < 0.001.
For the analysis of the second reversal a significant difference for the Hmin parameters (F(2,106) = 10.88, P < 0.001, η2 = 0.172), that is shortly before the second reversal, was observed. Bonferroni-corrected t-tests revealed a significantly higher probability of low risk-taking (i.e., lower probability of high risk-taking) between tACSLOCAL compared with sham (t(71) = 4.51, P < 0.001, d = 1.062), as well as for tACSINTER compared with sham (t(71) = 3.43, P = 0.003, d = 0.808). No significant difference was observed between tACSLOCAL and tACSINTER (t(71) = 0.53, P ~ 1, d = 0.126). Other parameters, Hmax, GR, and I50 did not differ significantly between conditions (Fig. 2C, Table 1). In accordance with the first reversal, the second reversal showed better rule implementation during tACSLOCAL and tACSINTER compared with sham tACS, with no effect on learning speed.
Resting-State EEG
No difference in baseline activity was observed for theta power, beta power, and theta/beta ratio (Supplementary Appendix D).
Repeated-measures ANOVA on the pre- to post-test change of spectral beta power showed no significant effects of stimulation (F(2,103) = 0.09, P = 0.912, η2 = 0.001), hemisphere (F(1,103) = 0.18, P = 0.669, η2 = 0.002) or hemisphere*stimulation (F(2,103) = 1.68, P = 0.192, η2 = 0.033), as shown in Figure 3A. Similarly, no effects of stimulation (F(2,104) = 0.94, P = 0.396, η2 = 0.011), hemisphere (F(1,104) = 0.46, P = 0.501, η2 = 0.005) or hemisphere*stimulation (F(2,104) = 0.13, P = 0.969, η2 = 0.001) were found for theta power, as shown in Figure 3B.
Figure 3.
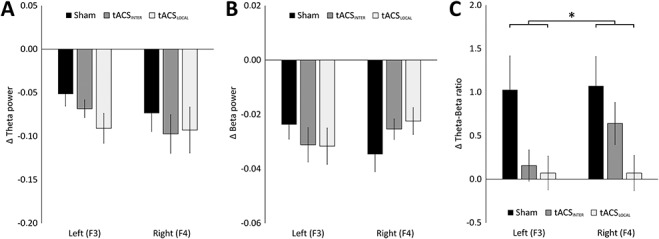
Post-test minus pretest differences in resting-state EEG for the theta (4–7 Hz) range (A), beta (13–30 Hz) range (B), and the theta/beta ratio (C). Significant differences are indicated by an asterisk.
Repeated-measures ANOVA on the post – pretest change of the theta–beta ratio revealed a significant difference between stimulation conditions (F(2,102) = 4.23, P = 0.017, η2 = 0.094). Bonferroni-corrected post-hoc independent t-test revealed a significant decrease in theta–beta ratio after tACSLOCAL compared with sham (t(69) = 2.29, P = 0.042, d = 0.612), as shown in Figure 3C. No difference was observed between tACSLOCAL and tACSINTER (t(68) = 1.46, P = 0.149, d = 0.272) and between tACSINTER and sham (t(68) = 1.29, P = 0.201, d = 0.339). The observed effect between groups was similar for both hemispheres (F(1,102) = 1.27, P = 0.264, η2 = 0.014). Neither was a significant hemisphere * stimulation interaction found (F(2,102) = 0.77, P = 0.466, η2 = 0.017). In sum, tACSLOCAL, but not tACSINTER, decreased theta/beta ratio compared with sham, with no effect on theta and beta power. Similarly, a significant main effect of stimulation (F(2,102) = 3.12, P = 0.049, η2 = 0.069), but no significant effects for hemisphere (F(1,102) = 2.68, P = 0.105, η2 = 0.028) and hemisphere*stimulation (F(2,102) = 0.84, P = 0.435, η2 = 0.018) were found when a larger area was inspected where left (F3, F7, Fc1, Fc5, C3) and right frontal electrodes (F4, F8, Fc2, Fc6, C4) were pooled (Supplementary Appendix E).
Correlation Between Reversal Learning and Theta/Beta Ratio
The theta/beta ratio change from pre- to post-test was significantly correlated with low risk taking (r = 0.199, P = 0.045, Figure 4A). This means that less risk taking in low risk blocks, which is indicative for better rule implementation, was associated with lower theta/beta ratios. However, theta/beta ratio change was not significantly correlated to risk taking in high risk blocks (r = 0.113, P = 0.256, Figure 4B).
Figure 4.
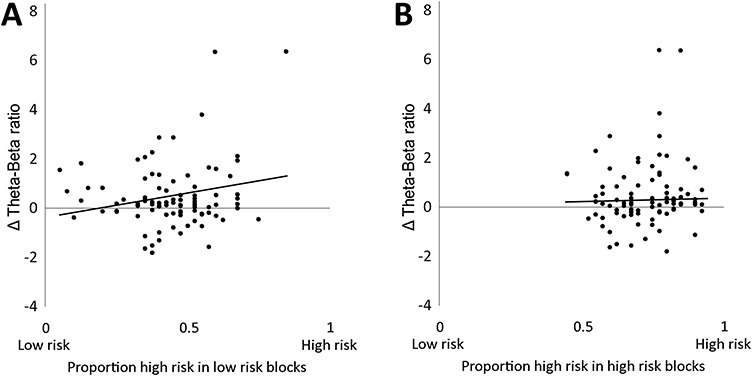
(A) The theta/beta ratio change from pre- to post-test correlated with low risk taking (r = 0.199, p = 0.045). (B) Theta/beta ratio change was not significantly correlated to risk taking in high-risk blocks (r = 0.113, P = 0.256).
Discussion
This study examined the direct involvement of beta EEG activity on reversal learning. Our results show that administration of beta-tACS with in-phase currents within each hemisphere and antiphase currents between hemispheres (tACSLOCAL) led to improved reversal learning performance compared with sham tACS. The present findings concur with our previous study where we showed that theta-tACS influences reversal learning performance (Wischnewski et al. 2016). However, in contrast to theta-tACS, beta-tACS did not affect the amount of trials needed to reverse strategy. Instead, rule implementation was enhanced, demonstrated by the observation that participants who received beta-tACS opted more often for high-risk choices in high-risk blocks and low-risk choices in low-risk blocks. It should, however, be noted that in our previous study a traditional two-electrode montage was used, with currents in antiphase between hemispheres.
Interestingly, in addition to the tACSLOCAL condition, the tACSINTER montage, applying in-phase currents between hemispheres and antiphase currents within each hemisphere, also improved reversal learning performance compared with sham. Surprisingly, this finding suggests no strong dissociation between both montages on reversal learning performance. Previous studies showed contrasting effects of in-phase and antiphase tACS (Polania et al. 2013; Helfrich et al. 2014; Alekseichuk et al. 2017). Based on these findings and since beta oscillatory activity in frontal cortex is associated with local intra-hemispheric communication (Donner and Siegel 2011; Fujisawa and Buzsaki 2011; Fries 2015), it was expected that the tACSINTER condition would not enhance performance. It should, however, be noted that previous studies using in-phase and antiphase tACS targeted a connection between specific areas, such as between the frontal and parietal cortex (Polania et al. 2013; Alekseichuk et al. 2017). In the present study, the aim was to target the frontal cortex reward and punishment network by targeting the dorsolateral prefrontal (Haber and Knutson 2010). Consequently, our conditions did not represent genuine in-phase and antiphase montages, but rather stimulation with alternating currents across different orientations. Furthermore, several studies using ‘traditional’ tACS montages with two electrodes, applying current in opposing phase have found beneficial effects on performance (for a review, see Schutter and Wischnewski 2016). Thus, the present study can draw no conclusions on the exact relationship between beta oscillatory phase and behavioral performance and further research is warranted. It should also be mentioned that, due to different current directions, the induced electric field in the brain differs slightly between tACSLOCAL and tACSINTER, as was demonstrated by a computer simulation. In addition to targeting the dorsolateral prefrontal cortex, tACSLOCAL affects more anterior areas, such as the orbitofrontal cortex, compared with tACSINTER (Fig. 1C). It can therefore not be ruled out that differences in results between both montages can in part be explained by difference in the induced electric field rather than the phase orientation. Furthermore, the induced field strength (~0.2 V/m) was relatively small (Rahman et al. 2015). However, since tACS was applied during the reversal learning task, in which underlying cortical tissue is already activated, such a small induced field may be sufficient to cause a behavioral effect.
Whereas no effect on absolute theta and beta power was found, significantly lower theta/beta ratio values were found after tACSLOCAL in comparison with sham. These results are in line with previous studies showing a relationship between lower theta/beta ratio and better reversal learning performance (Wischnewski et al. 2016; Schutte et al. 2017), as well as other related cognitive processes such as attention and impulsivity (Schutter and van Honk 2005; Putman et al. 2010; Massar et al. 2012; Angelidis et al. 2016). Interestingly, whereas we found that beta-tACS improved rule implementation and theta-tACS increased learning speed (Wischnewski et al. 2016), a similar effect was found on the electrocortical level (i.e., decreased theta/beta ratio). This result may be indicative for the theta/beta ratio reflecting a generic mechanism for adapting to new situations, rather than one specific aspect of learning (Schutte et al. 2017). According to this idea, lower values of theta/beta ratio may reflect a more generic form of behavioral adaptation. In contrast, higher values of theta/beta ratio are related to maladaptive decision making. This may also explain why the theta/beta ratio has been associated with a variety of motivational and cognitive processes, such as impulsivity, attention and learning (Schutter and van Honk 2005; Putman et al. 2010; Massar et al. 2012; Angelidis et al. 2016). Schutter a van Honk (2005) suggested that the theta/beta ratio reflects a trade-off between subcortically mediated approach motivation and cortical top-down cognitive regulation. Hence, the present observed tACS-induced decrease in theta/beta ratio may relate to increased cognitive regulation and reduced motivational urge to constantly having to change the decision making strategy.
An exploratory correlation analysis between change in theta/beta ratio from pre- to post-task and risky decision making suggested that the observed behavioral and physiological changes are indeed related. Smaller theta/beta ratio values after compared with before intervention were related to lower risk taking in low risk blocks, which arguably reflects better rule implementation. Analogously, one would expect a relationship between high risk taking in high risk blocks. However, no such correlation was observed. One reason is that participants were biased toward high risk options. Whereas in high risk blocks participants opted for the high risk option in approximately 80% of trials, the low risk option in low risk blocks was only chosen approximately 65% of trials. It is possible that this may have been a consequence of the task which always started with a high risk block. Furthermore, tACS and EEG were not co-registered, so the reported effects on theta/beta ratio are tACS after-effects. Although tACS has been shown to reliably affect cortical excitability even after the end of stimulation, the mechanisms of online and offline tACS may differ (Wischnewski et al. 2018). Therefore, the present study does not allow to make an inference about the causality between theta/beta ratio and reversal learning behavior.
Theoretical frameworks on the mechanisms of tACS involve online entrainment and offline spike timing-dependent plasticity, both of which suggest effects on endogenous oscillatory activity at the stimulated frequency (Zaehle et al. 2010 ; Helfrich et al. 2014; Wischnewski and Schutter 2017). Hence, the observation that beta oscillations were unaffected by beta-tACS was surprising. However, to date tACS applied in the beta frequency range has mostly been applied to the motor cortex, and the effects on the prefrontal cortex and cognition are less well understood. For example, tACS applied to the motor cortex has shown to increase motor cortex excitability, motor performance and increase EEG beta power (Pollok et al. 2015; Wischnewski et al. 2018). Interestingly, however, in a recent meta-analysis we showed that the effects of beta tACS on the motor cortex are limited to higher stimulation intensities of larger than 1 mA (Wischnewski et al. 2019). This may in part explain why we did not observe a direct effect on beta-oscillations. Further research is needed to broaden our understanding by which mechanisms beta tACS establishes its effects on frontal oscillations and cognitive behavior.
A limitation of the present study is the presence of retinal stimulation. Beta-tACS can induce the perception of phosphenes, which in itself can have an effect on cognitive performance (Schutter 2016). By flashing LEDs at the tACS frequency, it was possible to override any tACS-induced phosphene sensation. The subjective experience of light flickering was similar between sham and active tACS conditions (Supplementary Appendix B), which implies that the retinal stimulation in itself cannot explain the present results. Although the annoyance of LEDs was similar between real and sham tACS, a role of the light flashes on cognitive performance cannot be completely ruled out.
Although theta/beta ratio has originally been shown to be associated with attention deficit-hyperactivity disorder (Snyder and Hall 2006), other studies, as well as the present study suggest that the ratio reflects different levels of cognitive performance across the general population. As mentioned earlier, results of the present study and Wischnewski et al. (2016) seem to point at theta/beta ratio reflecting a generic rather than a specific aspect of cognitive performance. However, additional research is needed to further clarify which aspects of cognition, such as learning, memory, and attention contribute to the observed variety in theta/beta ratio and which aspects can be modulated with beta tACS.
In conclusion, our results suggest that frontal cortex tACS in the beta range can facilitate rule implementation during learning. tACS montages targeting intra- and inter-hemispheric connections were applied to the frontal cortex, with similar effects. Although beta-tACS was beneficial for reversal learning, the present results do not provide evidence for a specific relationship between tACS phase and performance improvements. Finally, we found a reduction in frontal theta/beta EEG ratio after beta-tACS as compared with sham tACS. Together, the resting-state EEG and behavioral findings suggest that the theta/beta EEG ratio is a measure of behavioral adaption.
Supplementary Material
References
- Alekseichuk I, Pabel SC, Antal A, Paulus W. 2017. Intrahemispheric theta rhythm desynchronization impairs working memory. Restor Neurol Neurosci. 35(2):147–158. doi: 10.3233/RNN-160714. [DOI] [PubMed] [Google Scholar]
- Angelidis A, Van der Does W, Schakel L, Putman P. 2016. Frontal EEG theta/beta ratio as an electrophysiological marker for attentional control and its test-retest reliability. Biol Psychol. 121:49–52. doi: 10.1016/j.biopsycho.2016.09.008. [DOI] [PubMed] [Google Scholar]
- Benchenane K, Tiesinga PH, Battaglia FP. 2011. Oscillations in the prefrontal cortex: a gateway to memory and attention. Curr Opin Neurobiol. 21:1–11. doi: 10.1016/j.conb.2011.01.004. [DOI] [PubMed] [Google Scholar]
- Capaday C. 1997. Neurophysiological methods for studies of the motor system in freely moving human subjects. J Neurosci Methods. 74:201–218. doi: 10.1016/S0165-0270(97)02250-4. [DOI] [PubMed] [Google Scholar]
- Capaday C, Lavoie BA, Barbeau H, Schneider C, Bonnard M. 1999. Studies on the corticospinal control of human walking. I. Responses to focal transcranial magnetic stimulation of the motor cortex. J Neurophysiol. 81:129–139. doi: 10.1152/jn.1999.81.1.129. [DOI] [PubMed] [Google Scholar]
- Cavanagh JF, Frank MJ. 2014. Frontal theta as a mechanism for cognitive control. Trends Cogn Sci. 18(8):414–421. doi: 10.1016/j.tics.2014.04.012. [DOI] [PMC free article] [PubMed] [Google Scholar]
- Cavanagh JF, Zambrano-Vazquez L, Allen JJB. 2012. Theta lingua franca: a common mid-frontal substrate for action monitoring processes. Psychophysiol. 45(2):220–238. doi: 10.1111/j.1469-8986.2011.01293.x. [DOI] [PMC free article] [PubMed] [Google Scholar]
- Cohen MX, Donner TH. 2013. Midfrontal conflict-related theta-band power reflects neural oscillations that predict behavior. J Neurophysiol. 110(12):2752–2763. doi: 10.1152/jn.00479.2013. [DOI] [PubMed] [Google Scholar]
- Cools R, Clark L, Owen AM, Robbins TW. 2002. Defining the neural mechanisms of probabilistic reversal learning using event-related functional magnetic resonance imaging. J Neurosci. 22(11):4563–4567. doi: 10.1523/JNEUROSCI.22-11-04563.2002. [DOI] [PMC free article] [PubMed] [Google Scholar]
- Donner TH, Siegel M. 2011. A framework for local cortical oscillations patterns. Trends Cogn Sci. 15(5):191–199. doi: 10.1016/j.tics.2011.03.007. [DOI] [PubMed] [Google Scholar]
- Engel AK, Fries P. 2010. Beta-band oscillations – signalling the status quo? Curr Opin Neurobiol. 20(2):156–165. doi: 10.1016/j.conb.2010.02.015. [DOI] [PubMed] [Google Scholar]
- Faul F, Erdfelder E, Lang AG, Buchner A. 2007. G*power 3: a flexible statistical power analysis program for the social, behavioral, and biomedical sciences. Behav Res Method. 39:175–191. doi: 10.3758/BF03193146. [DOI] [PubMed] [Google Scholar]
- Fertonani A, Ferrari C, Miniussi C. 2015. What do you feel if I apply transcranial electrical stimulation? Safety, sensations and secondary induced effects. Clin Neurophysiol. 126(11):2181–2188. doi: 10.1016/j.clinph.2015.03.015. [DOI] [PubMed] [Google Scholar]
- Fries P. 2005. A mechanism for cognitive dynamics: neuronal communication through neuronal coherence. Trends Cogn Sci. 9(10):474–480. doi: 10.1016/j.tics.2005.08.011. [DOI] [PubMed] [Google Scholar]
- Fries P. 2015. Rhythms for cognition: communication through coherence. Neuron. 88(1):220–235. doi: 10.1016/j.neuron.2015.09.034. [DOI] [PMC free article] [PubMed] [Google Scholar]
- Fujisawa S, Buzsáki G. 2011. A 4Hz oscillation adaptively synchronizes prefrontal, VTA, and hippocampal activities. Neuron. 72(1):153–165. doi: 10.1016/j.neuron.2011.08.018. [DOI] [PMC free article] [PubMed] [Google Scholar]
- Gratton G, Coles MGH, Donchin E. 1983. A new method for off-line removal of ocular artifact. Electroencephalogr. Clin Neurophysiol. 55(4):468–484.doi: 10.1016/0013-4694(83)90135-9. [DOI] [PubMed] [Google Scholar]
- Haber SN, Knutson B. 2010. The reward circuit: linking primate anatomy and human imaging. Neuropsychopharmacol Rev. 34:4–26. doi: 10.1038/npp.2009.129. [DOI] [PMC free article] [PubMed] [Google Scholar]
- HajiHosseini A, Holroyd CB. 2014. Sensitivity of frontal beta oscillations to reward valence but not probability. Neurosci Lett. 602:99–103. doi: 10.1016/j.neulet.2015.06.054. [DOI] [PubMed] [Google Scholar]
- HajiHosseini A, Holroyd CB. 2015. Reward feedback stimuli elicit high-beta EEG oscillations in human dorsolateral prefrontal cortex. Sci Rep. 5:13021. doi: 10.1038/srep13021. [DOI] [PMC free article] [PubMed] [Google Scholar]
- Helfrich RF, Knepper H, Nolte G, Strüber D, Rach S, Herrmann CS, Schneider TR, Engel AK. 2014. Selective modulation of interhemispheric functional connectivity by HD-tACS shapes perception. PLoS Biol. 12(12):e1002031. doi: 10.1371/journal.pbio.1002031. [DOI] [PMC free article] [PubMed] [Google Scholar]
- Iglewicz B, Hoaglin DC. 1993. Volume 16: How to Detect and Handle Outliers In: Mykytka EF, editor. The ASQC Basic References in Quality Control: Statistical Techniques. Milwaukee (WI, USA): ASQC Quality Press. [Google Scholar]
- Kar K, Krekelberg B. 2012. Transcranial electrical stimulation over visual cortex evokes phosphenes with a retinal origin. J Neurophysiol. 108(8):2173–2178. doi: 10.1152/jn.00505.2012. [DOI] [PMC free article] [PubMed] [Google Scholar]
- Keune PM, Hansen S, Weber E, Zapf F, Habich J, Muenssinger J, Wolf S, Schönenberg M, Oschmann P. 2017. Exploring resting-state EEG brain oscillatory activity in relation to cognitive functioning in multiple sclerosis. Clin Neurophysiol. 128(9):1746–1754. doi: 10.1016/j.clinph.2017.06.253. [DOI] [PubMed] [Google Scholar]
- Keune PM, Hansen S, Sauder T, Jaruszowic S, Kehm C, Keune J, Weber E, Schönenberg M, Oschmanna P. 2019. Frontal brain activity and cognitive processing speed in multiple sclerosis: an exploration of EEG neurofeedback training. Neuro Image: Clin. 22:101716. doi: 10.1016/j.nicl.2019.101716. [DOI] [PMC free article] [PubMed] [Google Scholar]
- Knyazev GG. 2012. EEG delta oscillations as a correlate of basic homeostatic and motivational processes. Neurosci Biobehav Rev. 36(1):677–695. doi: 10.1016/j.neubiorev.2011.10.002. [DOI] [PubMed] [Google Scholar]
- Mas-Herrero E, Marco-Pallares J. 2014. Frontal theta oscillatory activity is a common mechanism for the computation of unexpected outcomes and learning rate. J Cogn Neurosci. 26(3):447–458. doi: 10.1162/jocn_a_00516. [DOI] [PubMed] [Google Scholar]
- Mas-Herrero E, Ripollés J, HajiHosseini A, Rodriguez-Fornells A, Marco-Pallarés J. 2015. Beta oscillations and reward processing: coupling oscillatory activity and hemodynamic responses. NeuroImage. 119:13–19. doi: 10.1016/j.neuroimage.2015.05.095. [DOI] [PubMed] [Google Scholar]
- Massar SAA, Rossi V, Schutter DJLG, Kenemans JL. 2012. Baseline EEG theta/beta ratio and punishment sensitivity as biomarkers for feedback-related negativity (FRN) and risk-taking. Clin Neurophysiol. 123:1958–1965. doi: 10.1016/j.clinph.2012.03.005. [DOI] [PubMed] [Google Scholar]
- Massar SAA, Kenemans JL, Schutter DJLG. 2014. Resting-state EEG theta activity and risk learning: sensitivity to reward or punishment? Int J Psychophysiol. 91(3):172–177. doi: 10.1016/j.ijpsycho.2013.10.013. [DOI] [PubMed] [Google Scholar]
- Morillas-Romero A, Tortella-Feliu M, Bornas X, Putman P. 2015. Spontaneous EEG theta/beta ratio and delta-beta coupling in relation to attentional network functioning and self-reported attentional control. Cogn Affect Behav Neurosci. 15(3):598–606. doi: 10.3758/s13415-015-0351-x. [DOI] [PubMed] [Google Scholar]
- Mussel P, Ulrich N, Allen JJB, Osinsky R, Hewig J. 2016. Patterns of theta oscillation reflect the neural basis of individual differences in epistemic motivation. Sci Rep. 6:29245. doi: 10.1038/srep29245. [DOI] [PMC free article] [PubMed] [Google Scholar]
- Opitz A, Paulus W, Will S, Antunes A, Thielscher A. 2015. Determinants of the electric field during transcranial direct current stimulation. NeuroImage. 109:140–150. [DOI] [PubMed] [Google Scholar]
- Pennartz CM, Wingerden M, Vinck M. 2011. Population coding and neural rhythmicity in the orbitofrontal cortex. Ann NY Acad Sci. 1239:149–161. doi: 10.1111/j.1749-6632.2011.06296.x. [DOI] [PubMed] [Google Scholar]
- Polanía R, Nitsche MA, Korman C, Batsikadze G, Paulus W. 2013. The importance of timing in segregated theta phase-coupling for cognitive performance. Curr Biol. 22(14):1314–1318. doi: 10.1016/j.cub.2012.05.021. [DOI] [PubMed] [Google Scholar]
- Pollok B, Boysen AC, Krause V. 2015. The effect of transcranial alternating current stimulation (tACS) at alpha and beta frequency on motor learning. Behav Brain Res. 293:234–240. doi: 10.1016/j.bbr.2015.07.049. [DOI] [PubMed] [Google Scholar]
- Putman P, Van Peer J, Maimari I, Van der Werff S. 2010. EEG theta/beta ratio in relation to fear-modulated response-inhibition, attentional control, and affective traits. Biol Psychol. 83(2):73–78. doi: 10.1016/j.biopsycho.2009.10.008. [DOI] [PubMed] [Google Scholar]
- Rahman A, Lafon B, Biksom M.. 2015. Multilevel computational models for predicting the cellular effects of noninvasive brain stimulation : Progress in brain research. Elsevier, Amsterdam, The Netherlands. [DOI] [PubMed] [Google Scholar]
- Schultz W. 2015. Neuronal reward and decision signals: from theories to data. Physiol Rev. 95(3):853–951. doi: 10.1152/physrev.00023.2014. [DOI] [PMC free article] [PubMed] [Google Scholar]
- Schutte I, Kenemans JL, Schutter DJLG. 2017. Resting-state theta/beta EEG ratio is associated with reward- and punishment-related reversal learning. Cogn Affect Behav Neurosci. 17:754–763. doi: 10.3758/s13415-017-0510-3. [DOI] [PMC free article] [PubMed] [Google Scholar]
- Schutter DJLG. 2014. Syncing your brain: electric currents to enhance cognition. Trends Cogn Sci. 18(7):331–333. doi: 10.1016/j.tics.2014.02.011. [DOI] [PubMed] [Google Scholar]
- Schutter DJLG, Van Honk J. 2005. Electrophysiological ratio markers for the balance between reward and punishment. Brain Res Cogn Brain Res. 24(3):685–690. doi: 10.1016/j.cogbrainres.2005.04.002. [DOI] [PubMed] [Google Scholar]
- Schutter DJLG, Hortensius R. 2010. Retinal origin of phosphenes to transcranial alternating current stimulation. Clin Neurophysiol. 121(7):1080–1084. doi: 10.1016/j.clinph.2009.10.038. [DOI] [PubMed] [Google Scholar]
- Schutter DJLG, Wischnewski M. 2016. A meta-analytic study of exogenous oscillatory electric potentials in neuroenchancement. Neuropsychologia. 86:110–118. doi: 10.1016/j.neuropsychologia.2016.04.011. [DOI] [PubMed] [Google Scholar]
- Schutter DJLG. 2016. Cutaneous retinal activation and neural entrainment in transcranial alternating current stimulation: a systematic review. NeuroImage. 140:83–88. doi: 10.1016/j.neuroimage.2015.09.067. [DOI] [PubMed] [Google Scholar]
- Siegel M, Donner TH, Engel AK. 2012. Spectral fingerprints of large-scale neuronal interactions. Nat Rev Neurosci. 13:121–134. doi: 10.1038/nrn3137. [DOI] [PubMed] [Google Scholar]
- Snyder SM, Hall JR. 2006. A meta-analysis of quantitative EEG power associated with attention-deficit-hyperactivity disorder. J Clin Neurophsyiol. 23(5):441–456. doi: 10.1097/01.wnp.0000221363.12503.78. [DOI] [PubMed] [Google Scholar]
- Van de Vijver I, Ridderinkhof KR, Cohen MX. 2011. Frontal oscillatory dynamics predict feedback learning and action adjustment. J Cogn Neurosci. 23(12):4106–4121. doi: 10.1162/jocn_a_00110. [DOI] [PubMed] [Google Scholar]
- Wischnewski M, Zerr P, Schutter DJLG. 2016. Effects of theta transcranial alternating current stimulation over the frontal cortex on reversal learning. Brain Stimul. 9(5):705–711. doi: 10.1016/j.brs.2016.04.011. [DOI] [PubMed] [Google Scholar]
- Wischnewski M, Schutter DJLG. 2017. After-effects of transcranial alternating current stimulation on evoked delta and theta power. Clin Neurophsyiol. 128(11):2227–2232. doi: 10.1016/j.clinph.2017.08.029. [DOI] [PubMed] [Google Scholar]
- Wischnewski M, Engelhardt M, Salehinejad MA, Schutter DJLG, Kuo MF, Nitsche MA. 2018. NMDA receptor-mediated motor cortex plasticity after 20 Hz transcranial alternating current stimulation. Cereb Cortex. 29(7):2924–2931 doi: 10.1093/cercor/bhy160. [DOI] [PubMed] [Google Scholar]
- Wischnewski M, Schutter DJLG, Nitsche MA. 2019. Effects of beta-tACS on corticospinal excitability: a meta-analysis. Brain Stimul Brain Stim 12(6):1381–1389. doi: 10.1016/j.brs.2019.07.023. [DOI] [PubMed] [Google Scholar]
- Zaehle T, Rach S, Herrmann CS. 2010. Transcranial alternating current stimulation enhances individual alpha activity in human EEG. PLoS One. 5(11):e13766. doi: 10.1371/journal.pone.0013766. [DOI] [PMC free article] [PubMed] [Google Scholar]
Associated Data
This section collects any data citations, data availability statements, or supplementary materials included in this article.