

Abstract
Retrospective lineage tracing harnesses naturally occurring mutations in cells to elucidate single cell development. Common single-cell phylogenetic fate mapping methods have utilized highly mutable microsatellite loci found within the human genome. Such methods were limited by the introduction of in vitro noise through polymerase slippage inherent in DNA amplification, which we characterized to be approximately 10–100× higher than the in vivo replication mutation rate. Here, we present RETrace, a method for simultaneously capturing both microsatellites and methylation-informative cytosines to characterize both lineage and cell type, respectively, from the same single cell. An important unique feature of RETrace was the introduction of linear amplification of microsatellites in order to reduce in vitro amplification noise. We further coupled microsatellite capture with single-cell reduced representation bisulfite sequencing (scRRBS), to measure the CpG methylation status on the same cell for cell type inference. When compared to existing retrospective lineage tracing methods, RETrace achieved higher accuracy (88% triplet accuracy from an ex vivo HCT116 tree) at a higher cell division resolution (lowering the required number of cell division difference between single cells by approximately 100 divisions). Simultaneously, RETrace demonstrated the ability to capture on average 150,000 unique CpGs per single cell in order to accurately determine cell type. We further formulated additional developments that would allow high-resolution mapping on microsatellite-stable cells or tissues with RETrace. Overall, we present RETrace as a foundation for multi-omics lineage mapping and cell typing of single cells.
Long-outstanding questions have remained in developmental biology regarding single-cell lineage. Many methods have been recently developed to study the heterogeneity of cell populations through single cell RNA, DNA, and epigenetic sequencing (Sos et al. 2016; Cao et al. 2017; Mulqueen et al. 2018). However, a high-resolution single-cell method for simultaneous phylogenetic fate mapping has yet to be established. In general, there are two broad paradigms of studying development: prospective and retrospective lineage tracing (Woodworth et al. 2017). Methods developed for prospective lineage tracing have relied upon inducing mutations early in development and tracing such mutations through the lifetime of the cells or organism. Recent prospective lineage tracing methods utilize CRISPR-Cas9-induced molecular barcodes to determine developmental lineage of whole mice (Raj et al. 2018; Spanjaard et al. 2018). While these methods allowed for highly multiplexed simultaneous study of single-cell lineage and cell type, they were limited to use in model organisms or cultured cells.
In contrast, retrospective lineage tracing methods through the analysis of naturally occurring mutations serve as a viable means to study developmental lineage in human cells and tissues. The principle behind retrospective lineage tracing contends that, by analyzing naturally occurring somatic mutations within cells, one can determine the development of single cells without the necessity of inducing mutations. Somatic mutations of interest include single nucleotide variations (SNVs), LINE transposable elements, and microsatellites (Evrony et al. 2015; Lodato et al. 2015; Ludwig et al. 2019). Here, we present RETrace, a method for simultaneous retrospective lineage tracing and cell type determination for single cells through the capture of both microsatellite and DNA methylation status from the same cells. We demonstrated that this approach successfully achieved higher resolution lineage trees than other published methods and allows for reliable identification of cell type.
RETrace relies upon the capture of mutations across thousands of microsatellite loci for retrospective lineage tracing. The main advantage of targeting microsatellite loci was that these generally selectively neutral sites mutate at a high rate during cell division through a process known as polymerase slippage (Ellegren 2004). Estimates of microsatellite mutation rates range from 10−3 mutations per locus per cell division in mismatch repair-deficient cells, such as in some cancers, to 10−5 mutations per locus per cell division in microsatellite-stable cell types (Sun et al. 2012). These mutation rates are ∼10,000× higher than the estimated 10−9 mutations per SNV. However, such high in vivo mutability of microsatellites has meant that the in vitro capture and sequencing of microsatellites was likewise highly error-prone. Polymerases utilized for prerequisite DNA amplification have a significant chance of introducing erroneous noise that can mask naturally occurring microsatellite mutations. Consequently, existing methods that relied upon exponential whole genome amplification (WGA) were limited to low cell division resolutions when capturing microsatellite loci for retrospective lineage tracing (Biezuner et al. 2016). Here, we overcame such technical limitations of capturing microsatellite mutation information by implementing a linear amplification approach to avoid exponential accumulation of errors. Linear accumulation of replication errors can be computationally corrected by deriving the consensus of multiple sequencing reads.
Likewise, previous methods of microsatellite capture lacked the capability of identifying cell types, which would be vital for future phylogenetic fate mapping efforts in heterogeneous tissues. Through selective restriction enzyme fragmentation of the genome, we have developed a means to capture the original methylation signal identifying cell type post linear amplification of microsatellite loci. Here, we present RETrace as a method that improves the current limit of cell division resolution in single-cell retrospective lineage tracing and allows for simultaneous cell type methylation study that previously has not yet been achieved.
Results
RETrace design
We developed RETrace, a novel method to capture both microsatellite loci and methylation-informative cytosines from a single cell in order to simultaneously characterize both lineage and cell type. Previous methods have likewise utilized microsatellites as markers for retrospective cell lineage tracing, with increasing ability to capture several thousand microsatellites at a single-cell level (Frumkin et al. 2005; Salipante and Horwitz 2006; Biezuner et al. 2016). However, all of these single-cell methods required an initial step of exponential multiple displacement amplification (MDA)-based WGA in order to obtain sufficient genomic material for microsatellite enrichment. We hypothesized that this initial exponential amplification introduced noise that severely decreased the resolution of the final phylogenetic tree, as the polymerase slippage that occurs during cell replication could just as likely introduce noise during in vitro polymerase amplification. We designed an experimental framework to measure the error rate of microsatellite replication for five commonly utilized polymerases and have determined that the error is approximately 10–1000× higher per replication event than the expected in vivo microsatellite mutation rate (see Supplemental Methods; Supplemental Fig. S1; Supplemental Tables S1, S2). In order to limit the amount of polymerase slippage error introduced in vitro, we designed a strategy to circularize DNA fragments by ligating stem–loop adapters and perform single-primer PCR (Fig. 1). By utilizing single-primer PCR, we could achieve highly controlled amplification of genomic DNA as opposed to other isothermal methods. We verified that we achieved linear amplification through this single-primer PCR approach, as shown in Supplemental Figure S2. Thus, instead of exponential WGA, our linear amplification approach provided the ability to prevent compounding slippage errors and improved accuracy of microsatellite mutation calling.
Figure 1.
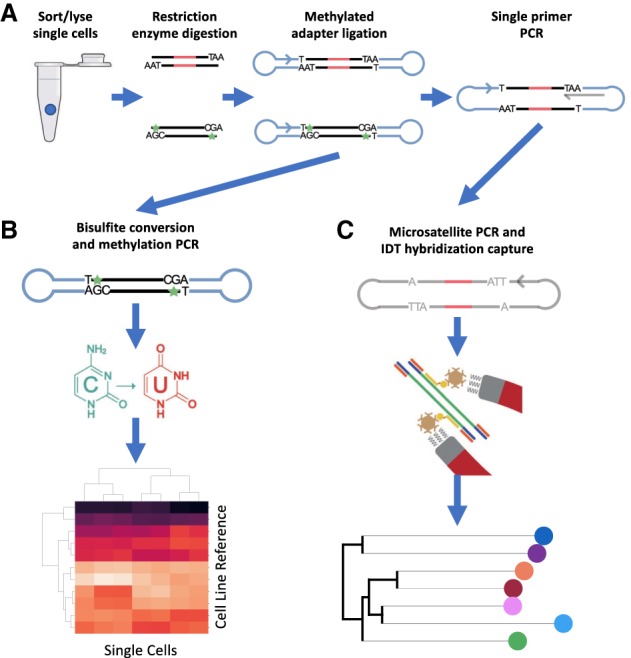
Overview of RETrace Method. (A) Single-cell processing includes FACS sorting single cell per well in a plate, followed by restriction enzyme digestion, ligation of methylated hairpin loop adapters, and single-primer PCR for linear amplification. (B) Methylation postprocessing with bisulfite conversion followed by PCR utilizing primers specific to the MspI cut site, which results in cell type identification. (C) Microsatellite postprocessing with hybridization probe enrichment, which results in building a phylogenetic tree.
RETrace also enables the simultaneous characterization of single-cell epigenetic cell type through the capture of DNA methylation in the same cell. In order to capture both microsatellite and methylation information, we utilized a dual restriction enzyme digestion approach for fragmenting the genome. MseI was selected to cut near select microsatellite loci of interest, while MspI was utilized to enrich for CpG-rich regions of the genome similar to previously developed scRRBS methods (Guo et al. 2013). The combination of MseI and MspI restriction enzyme dual digestion produced the greatest balance of both microsatellite and methylation-informative sites (Supplemental Table S9). In order to capture the original methylation status after linear amplification, methylated stem–loop adapters were ligated to A-tailed DNA fragments such that only the original DNA fragments had the proper PCR-priming sites post-bisulfite conversion.
Each single-cell reaction was divided into two postprocessing protocols for either microsatellite or methylation capture. Enabled by the dual restriction enzyme digestion method utilized for RETrace, we amplified either microsatellite MseI or methylation MspI fragments specifically using custom designed PCR primers compatible with Illumina sequencers (Supplemental Table S3). To enrich for microsatellites, we utilized a hybridization probe capture approach. We designed two sets of 12,472 probes that captured up to 11,380 microsatellite loci (Supplemental Fig. S3). The majority of these microsatellite loci were di-nucleotide repeats, with 18 subunits on average according to the reference genome, and were chosen based on expected fragment length from the GRCh37 hg19 reference genome (International Human Genome Sequencing Consortium 2001). There was no appreciable difference between hg19 and newer hg38 reference genomes, as the MAPQ score was 54.30 and 53.63, respectively, for HCT116 target captured reads.
Ex vivo validation of retrospective lineage tracing with microsatellite-unstable cells
In order to validate RETrace, we created an ex vivo cell culture tree through successive single-cell expansion of an HCT116 human colorectal cancer cell line (see Methods). The ex vivo tree provided a known ground truth for determining the accuracy of RETrace retrospective lineage tracing. This method of phylogenetic fate mapping validation was similar to those utilized previously with other cancer cell lines that exhibited microsatellite instability, which have an estimated 10−3 mutations per microsatellite per cell division (Biezuner et al. 2016). Single HCT116 cells were seeded and expanded for an estimated 23 cell divisions per passage in a known tree structure for a total of four passages from root prior to a final sort and analysis, resulting in a tree that contained a maximum of 184-cell division difference between single cells.
From eight different clones within the HCT116 ex vivo tree (Fig. 2), we sorted 138 single cells through FACS, performed RETrace processing, postprocessed with microsatellite hybridization enrichment, and sequenced each of these for microsatellite loci with a depth of approximately 3 million 250-bp Illumina sequencing reads. We performed quality filtering to select 114 single cells that captured at least 200 microsatellites (≥30 reads per microsatellite locus) and 30,000 unique CpG sites (≥1 read per CpG). These cutoffs were determined empirically through analysis of single-cell capture, nontemplate control, and bulk samples (Supplemental Fig. S5). After filtering, 1217 microsatellites were captured per single cell at a high sequencing depth, with approximately 388 microsatellites shared between each pair of single cells (Supplemental Table S4).
Figure 2.
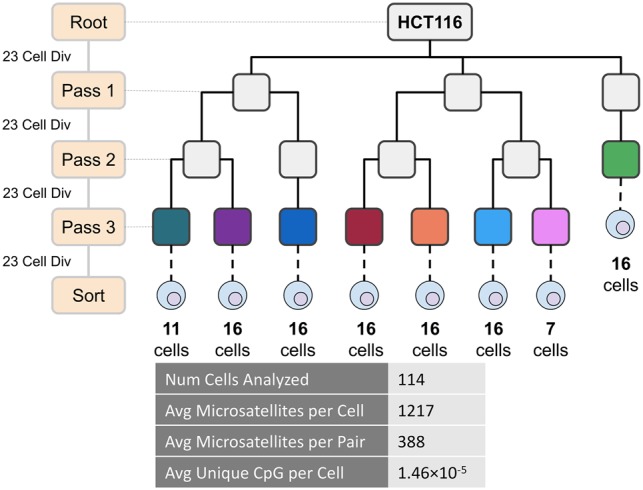
HCT116 ex vivo tree for method validation. Colored clones were utilized for RETrace validation. Important microsatellite and methylation statistics per analyzed single cell are highlighted above.
We constructed a single-cell retrospective lineage tree (Fig. 3A) by calculating an “Equal or Not” distance between shared microsatellite allelotypes of each pair of cells (Supplemental Table S8; Chapal-Ilani et al. 2013). In addition, we assumed that microsatellite loci mutate at a similar rate across all single cells within our HCT116 ex vivo tree and thus utilized midpoint rooting for the neighbor-joining phylogenetic tree. We then aimed to calculate the ex vivo tree reconstruction accuracy of RETrace by utilizing a triplet accuracy method that had been previously developed (Biezuner et al. 2016; Ludwig et al. 2019). Briefly, triplet accuracy was calculated by determining whether the most recent common ancestor was accurately identified per every possible trio of single cells derived from at least two different clones within the phylogenetic tree. A baseline of 33% accuracy was expected for a completely random tree. RETrace triplet accuracy for the reconstructed HCT116 ex vivo tree was 88% across all possible single cell triplets derived from the eight clones analyzed.
Figure 3.
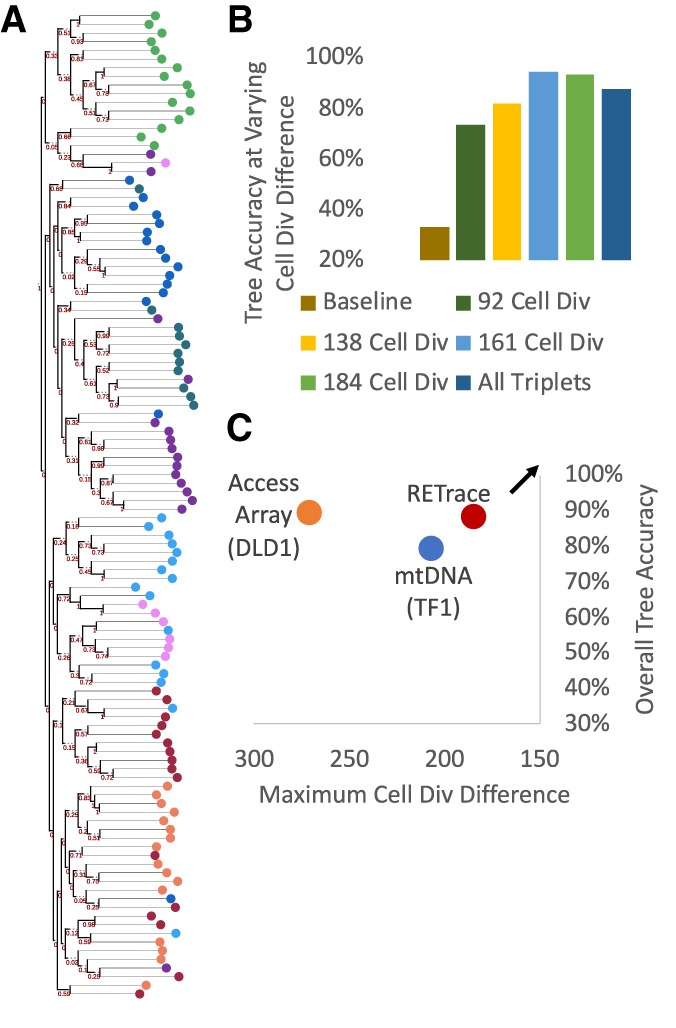
Retrospective lineage tracing accuracy based on microsatellite capture of single cells from the HCT116 ex vivo tree. (A) Diagram of complete phylogenetic tree with colors corresponding to clones from the original ex vivo tree. (B) Accuracy of tree calling, as determined by the rate of topologically correct triplets reconstructed, based on the varying number of estimated cell division differences between each clone. An overall tree accuracy of 88% was observed by using all possible triplets from the tree. (C) Overall tree accuracy as a function of maximum cell divisions recapitulated in the ex vivo tree compared to existing methods for phylogenetic tree mapping. Arrow indicates optimal desired results of maximizing accuracy at lower cell division differences.
Tree accuracy generally is controlled by two main factors: the inherent accuracy of the method for retrospective lineage tracing and the number of mutations expected between single cells in the tree, which is highly dependent on the number of cell divisions between each node. High-accuracy retrospective tree reconstruction becomes increasingly difficult with a lower number of cell division differences between single cells, as the number of microsatellites expected to be different between the two cells drops. We consequently aimed to determine the triplet accuracy of RETrace based on the varying number of cell division differences among cells. In theory, those cells that are clonally proximal with lower cell division differences may exhibit lower triplet accuracy than those that are clonally distal. As shown in Figure 3B, RETrace maintained a high lineage tracing accuracy of 74% with single cells 92 cell divisions apart, which was the highest resolution for the clones selected from the HCT116 ex vivo tree.
When compared to existing methods for retrospective lineage tracing, we observed that RETrace achieved a higher accuracy with much higher resolution (Fig. 3C). Two recent methods for retrospective lineage tracing utilized either single nucleotide variations from mitochondrial DNA (mtDNA) or exponential WGA followed by microsatellite enrichment. We hypothesized that microsatellites exhibit a much higher mutation rate than single base mutations in mitochondria, thus contributing to the higher triplet accuracy of RETrace. In addition, we demonstrated that the linear amplification method in RETrace introduced lower amounts of noise in microsatellite measurements, allowing for a gain of approximately 100 cell divisions in resolution when compared to existing microsatellite-based lineage tracing methods. These gains in accuracy and resolution were relatively stable even when we downsampled the number of microsatellite loci captured per single cell to 800, with the potential for improvement with further development of larger microsatellite probe sets (Supplemental Figs. S6, S7).
Ex vivo validation of simultaneous methylation characterization
With RETrace, we were able to simultaneously capture the DNA methylation status for each single cell processed from the ex vivo HCT116 single cell tree. As mentioned above, we obtained 114 single cells after filtering for adequate microsatellite (200 loci) and methylation (30,000 unique CpG) coverage. On average, each single cell contained ∼35% of the number of CpGs captured in bulk (150,000 unique CpGs per single cell), which was similar to previously developed single-cell RRBS methods (number of captured CpG sites versus cell input was summarized in Supplemental Fig. S4). In order to determine whether RETrace was able to accurately characterize cell type, we compared single cells to reference ENCODE cell lines utilizing a pairwise dissimilarity method as previously described (Hui et al. 2018). We demonstrated that the majority of single cells were identified as HCT116 with the lowest pairwise dissimilarity (Fig. 4A; Supplemental Fig. S9A).
Figure 4.

RETrace methylation characterization of HCT116 single cells. (A) Heat map utilizing z-scores of pairwise dissimilarity against ENCODE reference cell lines for each single cell. Column colors above the heat map denote the clone from which each single cell was derived. (B) Plot of pairwise dissimilarity between single cells and HCT116 versus the number of shared CpG sites. Colors correspond to the outgroup identified in the pairwise dissimilarity heat map. Higher pairwise dissimilarity from HCT116 was most likely due to lower coverage of informative CpG sites. (C) UMAP of all CpGs within the Ensembl regulatory build windows for all analyzed single cells (colors indicate ex vivo cell clone).
However, there was a clade of single cells that did not strongly demonstrate high similarity to any existing reference cell line. Upon further investigation, the misclassification of this outgroup clade was most likely due to technical causes, as single cells had a much higher chance of misclassification if the number of shared CpGs with reference cell lines was less than 50,000 unique CpGs (Fig. 4B, Supplemental Fig. S8). In addition, we utilized methylation rate across Ensembl regulatory build windows in order to demonstrate minimal batch effect among all ex vivo single cell clones (Fig. 4C). In conclusion, we demonstrated that RETrace accurately characterized single cell type through methylation profile while simultaneously recapitulating lineage.
Application and proposed improvements to RETrace for microsatellite-stable cells
As demonstrated with the HCT116 ex vivo cell culture, RETrace simultaneously produced highly accurate phylogenetic lineage and methylation cell type characterization for microsatellite-unstable cells. This would prove useful for retrospective phylogenetic fate mapping of human tissues that exhibit higher rates of microsatellite mutation, such as mismatch repair-deficient human cancers. However, future optimizations would be required for applying RETrace toward the study of normal human tissues, which exhibit significantly lower rates of microsatellite mutations, around 10−4 to 10−5 mutations per locus per cell division (Ellegren 2004). To demonstrate the potential to apply RETrace to human tissues and propose necessary areas of improvement, we applied our method to a microsatellite-stable U87MG ex vivo cell culture and nuclei derived from adult human postmortem brain.
We processed and analyzed 61 single U87MG cells and 137 neuronal and nonneuronal nuclei from adult human cortex, cerebellum, and hippocampus. On average, we obtained 270,000 and 162,000 unique CpGs per single cell for U87MG and brain, respectively, which was comparable to the HCT116 RETrace methylation coverage (Supplemental Tables S6, S7). In order to determine the accuracy of RETrace to identify cell type, we utilized a similar approach of calculating methylation pairwise dissimilarity with reference data. For U87MG, single-cell methylation was compared with shared sites in available ENCODE reference cell lines. As expected, all of the single cells displayed the lowest pairwise dissimilarity with U87MG reference methylation data (Fig. 5A; Supplemental Fig. S9B). To evaluate RETrace for methylation profiling in heterogeneous tissues, we then analyzed postmortem brain nuclei derived from cortex, hippocampus, and cerebellum from a single individual. Ground truth was established by utilizing NeuN antibody staining and FACS sorting, followed by processing all nuclei in a single RETrace experiment to eliminate batch effect. By comparing cortical nuclei to previously published neuronal methylation data, we verified that NeuN− nuclei displayed high pairwise dissimilarity from both excitatory and inhibitory neuronal subtypes as expected (Fig. 5B; Luo et al. 2017). Our ability to separate methylation profiles of heterogeneous tissue types was also supported by UMAP clustering demonstrating clear separation that follows the ground truth neuronal nuclei labeling (Fig. 5C).
Figure 5.

RETrace methylation analysis of U87MG and brain single cells. (A) Pairwise dissimilarity between each U87MG ex vivo single cells and ENCODE reference cell line data. (B) Comparison of RETrace-processed cortical neuronal and nonneuronal nuclei and previously published excitatory and inhibitory neuronal subtypes accurately separate NeuN+ and NeuN− nuclei. (C) Similar separation between neuronal and nonneuronal nuclei when analyzing the whole RETrace brain data set.
However, further work will be required to improve the ability of RETrace to recapitulate single-cell lineage in microsatellite-stable cells. The need for improvement was apparent when we attempted to recreate the ex vivo cell culture phylogenetic structure of U87MG, as overall triplet accuracy was at the 33% baseline for a random tree (Supplemental Fig. S10). This was anticipated due to the lower microsatellite mutation rate of approximately 10−5 mutations per locus per cell division, as compared to a 10−3 mutation rate in microsatellite-unstable cells. On average, 829 microsatellite loci were captured per single U87MG cell, with 144 shared per pair of cells. Even at the maximum 184-cell division difference between single cells, we would expect less than a single mutation to naturally occur between a pair of microsatellite-stable U87MG cells. Consequently, for lineage mapping of microsatellite-stable cell lines or human tissues, further developments of RETrace are necessary to improve the counting of informative mutational events by ∼100-fold.
There are clear paths to achieve this goal, through covering more microsatellites and mononucleotide repeats that mutate more frequently, as well as reducing dropouts from single-cell amplifications. The current hybridization panel targeted 11,380 microsatellite loci with subunit lengths ranging from 2 to 6 base pairs. A straightforward strategy for increasing mutation signal detection would be to target a greater proportion of the 33,560 potential MseI-fragmented di- to hexa-nucleotide subunit microsatellites, or a ∼3× improvement. Secondly, mononucleotide single base repeats have been previously shown to exhibit approximately a 20× higher mutation rate in microsatellite-stable mismatch repair-sufficient cells (Boyer 2002). Covering an additional 66,870 mononucleotide microsatellites found in MseI fragments would lead to a potential 120× improvement. Finally, due to the amplification bias, the current capture efficiency is ∼10% on a single cell, such that only ∼1% of the targeted loci would have overlap between any two cells and be informative. One factor affecting bias in capture was the efficiency of linear amplification, which for the current RETrace single-primer PCR process was ∼60% (Supplemental Fig. S2). One simple strategy is to increase the number of linear amplification single-primer PCR cycles prior to exponential amplification. Another, more drastic approach to improve linear amplification would be to introduce a T7 promoter sequence in the current adapter design (Chen et al. 2017), thus allowing for in vitro transcription to linearly amplify the genome to achieve an additional 100–1000× amplification of single-cell DNA prior to PCR. Such proposed methods would decrease amplification bias by providing a higher amount of input template copies into library preparation PCR. A modest 3.3× improvement on the capture efficiency would translate to 10× more informative sites shared by any pair of cells. A combination of these three options would lead to 1000–3000× more informative events detected between any pair of cells and a sensitivity of separating two cells 10–20 cell divisions apart in any human tissues.
Discussion
We present for the first time a method for simultaneous retrospective lineage tracing and methylation profiling of single cells. The majority of previous single-cell phylogenetic fate mapping methods have relied upon exponential DNA amplification, which we quantified to introduce error that is at least 100× higher than natural in vivo mutations per DNA replication. In order to mitigate in vitro microsatellite slippage error, RETrace utilizes linear amplification along with dual restriction enzyme digestion to simultaneously enrich for both microsatellite and CpG-rich regions. This allowed us to perform highly accurate lineage tracing at much higher cell division resolution with the additional ability to determine cell type. Utilizing an ex vivo microsatellite-unstable phylogenetic tree, we have validated that our method achieved >90% lineage reconstruction accuracy with single cells that were at least 161 cell divisions apart. Accuracy remained above 70% when sampling single cells that were only approximately 92 cell divisions apart. This greatly improves upon any existing method for retrospective lineage tracing in terms of accuracy and, perhaps more importantly, resolution. At the same time, we have also verified that RETrace simultaneously identified the correct cultured cell type, suggesting that our method can provide accurate methylation profiling in human tissues.
With the utilization of HCT116 for validation, we demonstrated that RETrace has immediate applicability to study the developmental history of microsatellite-unstable human cancers. In addition, we demonstrated our ability to separate broad cellular subtypes such as neuronal and nonneuronal nuclei in heterogeneous human brain tissue. However, further work is needed in order to apply RETrace for retrospective lineage tracing in normal human tissues, which feature lower mutation rates per cell division that would impact tree reconstruction resolution. We have formulated additional modifications of the RETrace method that would lead to an improvement of >1000-fold, through expanding the hybridization capture panel and increasing the yield of linear amplification. RETrace represents a major advance over previous single cell retrospective lineage tracing methods as it provides epigenetic information on top of lineage information. With the additional proposed optimizations, RETrace will provide the framework for reconstructing highly accurate single-cell retrospective lineage trees and simultaneous epigenetic profiling on broad human tissue types beyond microsatellite-unstable cells.
Methods
Ex vivo single-cell culture and neuronal nuclei collection
The goal of single-cell culture was to create a phylogenetic tree with known structure. In order to build the ex vivo single-cell culture tree, we obtained HCT116 colorectal carcinoma cell line from Coriell Institute and initially cultured cells in McCoy's 5A media (ATCC) with 1% penicillin-streptomycin (Thermo Fisher Scientific) and 15% FBS (Thermo Fisher Scientific). Once the HCT116 cells reached ∼75% confluency in a T-75 flask, we utilized FACS to identify (utilizing forward and side scatter) and sort single cells into individual wells of Nunclon Delta coated 96-well culture plates (Thermo Fisher Scientific). These single cells were cultured for ∼2 wk in the 96-well culture plates containing 100 µL of 75% complete media and 25% conditioned media. Conditioned media was prepared prior to use from another flask of HCT116 grown in complete McCoy's 5A media and filtered with a 0.22-µM filter. Cells were trypsinized once confluent and transferred into a single well of a 24-well plate containing 1 mL complete media and allowed to grow for 3 d. After 3 d, the cells were again trypsinized and transferred to a single well in a six-well plate. Finally, after having grown for an additional 3 d, all cells from a single well of the six-well plate were trypsinized and transferred into a T-75 flask. This process of culturing from single cell to a T-75 flask was repeated three times in order to create an ex vivo tree of three generations with approximately 23 cell divisions between each generation. This 23-cell division estimation was derived from the approximate number of cells in a T-75 flask at 100% confluency, or 8.4 million cells at the time of harvest and RETrace processing.
In order to further verify accurate characterization of methylation profiles of cell types, we also processed cells derived from an ex vivo culture of U87MG and human neuronal nuclei. A U87MG human glioblastoma cell line was cultured using a similar ex vivo tree method as described above with HCT116. However, one important difference between the two cell lines was that HCT116 featured a significantly higher microsatellite mutation rate (an approximated 10−3 mutations per locus per cell division), due to mismatch repair deficiencies, than microsatellite-stable U87MG cells (which have approximately 10−5 mutations per locus per cell division). The U87MG ex vivo tree was grown for a maximum of 184-cell divisions different between single cells. Likewise, we harvested single nuclei from cells derived from normal postmortem human male cortex, hippocampus, and cerebellum. Neuronal and nonneuronal cell types were determined using NeuN antibody (Millipore MABN140) labeling and FACS sorting.
Cell lysis, fragmentation, ligation, and amplification
Single cells were isolated and sorted directly into individual wells of a 96-well reaction plate containing 5.34 µL of 1× lysis buffer (10× concentration: 10× NEBuffer 2.1 [New England Biolabs], 0.703% SDS [Sigma-Aldrich], 60 fg/µL unmethylated lambda DNA [Promega]). These cells were immediately lysed at 42°C for 30 min. Following lysis, SDS was quenched by adding 1 µL of 12.68% Triton X-100 (Sigma-Aldrich), which was incubated at 42°C for another 30 min. These cells were processed immediately after lysis but could be stored at −80°C for long-term storage. SDS within the cell lysis buffer disrupted the nuclear membrane and DNA-binding proteins; this process resulted in accessibilized single-cell DNA within each single well, which would be used for downstream processing. All subsequent reactions up through amplification were performed by sequentially adding various enzyme master mixes without the need for buffer or tube changes.
After cell lysis, DNA was fragmented and A-tailed by adding 3.32 µL of restriction enzyme cocktail containing MseI and MspI (1× Thermo Tango Buffer, 4.7 U Thermo MseI, 47 U NEB MspI, 4.7 U Thermo Klenow exo−, 1 mM dATP, 0.1 mM dCTP, 0.1 mM dGTP, 0.1 mM dTTP [New England Biolabs]). DNA fragmentation and A-tailing was performed at 37°C for 3 h, followed by a 20-min 80°C heat-inactivation. MseI was chosen to digest DNA near select microsatellite sites, while MspI was selected for digestion of CpG-rich genomic regions. Methylated hairpin loop adapters were ligated onto A-tailed DNA fragments by adding 6.79 µL of ligation mix (1× Thermo Tango Buffer, 1 mM NEB ATP, 5% PEG 4000, 4 µM NEBNext methylated adapter, and 30 Weiss units of Thermo T4 DNA ligase). The ligation reaction was incubated at 16°C for 30 min, followed by 10°C incubation for 18 h and 65°C heat-inactivation for 20 min.
In order to reduce in vitro slippage noise introduced by WGA, we performed single-primer PCR utilizing KAPA_RCA_Primer custom ordered from IDT (Supplemental Table S3) that was designed to initiate amplification at the loop portion of the hairpin adapters. Single-primer PCR was performed by adding 8.56 µL of master mix (1× KAPA High Fidelity buffer, 0.3 µM KAPA_RCA_Primer, 0.3 mM NEB dNTP cocktail, and 0.5U KAPA High Fidelity polymerase). Ten cycles of single-primer PCR was performed in a thermocycler: 95°C for 3 min; followed by 10 cycles, each consisting of 98°C for 20 sec, 60°C for 15 sec, and 72°C for 30 sec; and finished with a 72°C 1-min final extension. The resulting reaction (total volume of 25 µL) was then separated into downstream microsatellite or methylation processing.
Microsatellite enrichment
Microsatellite postprocessing was performed by taking a 5-µL aliquot of the single-primer PCR-amplified single-cell DNA. The preprocessed DNA was first amplified utilizing barcoded primers designed to specifically anneal to MseI-digested microsatellite DNA fragments (Supplemental Table S3). Each single cell was amplified with a specific dual-indexed PCR primer in order to multiplex for sequencing. PCR was performed on the single-cell DNA utilizing 1× KAPA High Fidelity master mix, 0.5 µM MseI-i5 PCR primer, 0.5 µM MseI-i7 PCR primer, and 0.4× SYBR Green (Thermo Fisher Scientific). PCR cycling consisted of 95°C for 3 min initial denaturation, followed by 25 cycles, each consisting of 98°C for 20 sec, 60°C for 15 sec, and 72°C for 30 sec, and finished with a 72°C 1-min final extension. PCR product was purified utilizing AMPure XP bead PCR cleanup by adding 0.8× SPRI beads (Beckman Coulter) and performing two 80% ethanol washes. Washed PCR amplicons were eluted in 20 µL water.
In order to enrich for microsatellite sequences, we designed and produced single-stranded DNA probes that targeted 11,380 microsatellite sequences (Supplemental Fig. S3) with ∼2× tiling. These probes were labeled with biotin to allow for a magnetic streptavidin-coated bead pulldown for enrichment. We enriched for the selected microsatellite sequences by utilizing the designed DNA probes and commercially available IDT xGen hybridization and wash kit. We performed a two-stage capture as previously described (Schmitt et al. 2015). Briefly, all single cells for the experiment were pooled equally to a total mass of 500 ng. A first round of DNA hybridization was performed with 3 pmol of the biotinylated probes, followed by xGen hybridization and washing, and 16 cycles of PCR utilizing primers designed to target universal Illumina P5 and P7 adapter regions. A second round of DNA hybridization was performed with 1.5 pmol of biotinylated probes, followed by xGen hybridization and washing, and 10 cycles of PCR. The final PCR product was purified with 1.2× volume of AMPure XP beads and eluted in 22 µL of water. Enriched microsatellite DNA was sequenced utilizing an Illumina HiSeq 2500 paired-end flowcell (read 1: 250 base pairs, read 2: 75 bp, index 1: 8 bp, and index2: 8 bp) at a targeted depth of approximately 3 million reads per single cell. Because reads were required to span the entire microsatellite sequence, we only utilized the 250-bp read 1 sequences for microsatellite calling.
Bisulfite conversion and methylation sequencing
Methylation postprocessing was performed by taking the remaining 20 µL of the single-primer PCR-amplified amplified single-cell DNA. In order to determine methylation status, we first bisulfite-converted the DNA fragments by adding the PCR amplicons directly into Zymo EZ DNA Methylation-Direct conversion reagent. Each single cell was converted in individual tubes such that samples were not cross-contaminated. Bisulfite conversion was performed according to the manufacturer's specifications and eluted in 26 µL of water.
Because of the use of methylated hairpin loop adapters for ligation, the primer binding sites for the adapter regions were conserved in the original DNA fragments and not the single-primer PCR fragments post-bisulfite conversion. This allowed us to distinguish and amplify the original methylation signal from MspI-digested fragments. PCR was performed on the bisulfite-converted DNA utilizing 1× KAPA High Fidelity master mix, 0.5 µM MspI-i5 PCR primer, 0.5 µM MspI-i7 PCR primer, and 0.4× SYBR Green. PCR cycling consisted of 95°C for 3 min initial denaturation, followed by 32 cycles of 98°C for 20 sec, 60°C for 15 sec, and 72°C for 30 sec, and finished with a 72°C 1-min final extension. PCR products were purified utilizing AMPure XP bead PCR cleanup by adding 0.8× SPRI beads and performing two 80% ethanol washes. Purified PCR amplicons were eluted in 20 µL water, pooled, and sequenced utilizing the Illumina MiSeq paired-end platform (minimum read lengths of read 1: 75 base pairs, read 2: 75 bp, index 1: 8 bp, and index 2: 8 bp) at a targeted depth of approximately 1 million reads per single cell.
Microsatellite data processing
Microsatellite loci enriched by hybridization probe capture were utilized for retrospective phylogenetic fate mapping. Raw HiSeq reads were adapter-trimmed and filtered for bases with a minimum Phred score of 20 by utilizing Cutadapt and Trim-Galore (Martin 2011). Trimmed single-end reads from each single cell were mapped to the GRCh37 hg19 reference genome using BWA-MEM aligner with default values (Li and Durbin 2009). Single cells were filtered to contain a minimum of 200 microsatellites (≥30 reads per microsatellite locus) and 30,000 unique CpG sites (≥1 read per CpG).
One difficulty of microsatellite genotyping is the necessity to separate true microsatellite allelotypes from potential polymerase slippage noise. We aimed to limit such noise both experimentally through several cycles of linear amplification prior to microsatellite enrichment and bioinformatically by adjusting for microsatellite stutter noise. In order to adjust for in vitro slippage error, we utilized HipSTR to calculate single-cell microsatellite allelotypes (Gymrek et al. 2017). De novo stutter modeling was performed by running HipSTR on all single cells simultaneously using default values. HipSTR allelotypes were filtered to require a minimum 0.7 posterior probability of the genotype call. The resulting microsatellite allelotype consisted of a list of diploid microsatellite subunit counts for each single cell (Supplemental Table S5).
In order to reduce the effect of spurious microsatellite allelotype calls, we calculated a pseudobulk from all single cells for each targeted microsatellite and removed calls that were not within a distance of one subunit from any other existing single cell within the sample. In order to calculate the distance between each single cell, we utilized an “Equal or Not” distance metric as previously described (Chapal-Ilani et al. 2013). Briefly, given cells i and j, set {L} number of microsatellites shared between each, and set of alleles {Allelotypel}, l ∈ L for each single cell, the distance between each single cell D(i, j) was calculated as
where
With pairwise “Equal or Not” distances calculated for each pair of single cells, we utilized a neighbor-joining approach to build the phylogenetic fate map for the single cells. Because the ex vivo tree from which each single cell was derived contained a single cell type (HCT116), we made a reasonable assumption that the rate of cell division was constant. Consequently, we rooted the final phylogenetic tree at its midpoint. Phylogenetic bootstrapping was performed to determine the robustness of each reconstructed tree node by resampling single cells (leaves) from the tree 1000 times. Tree reconstruction accuracy was calculated by analyzing whether the most recent common ancestor was correctly identified for each trio of single cells as previously described (Biezuner et al. 2016).
Methylation data processing
Bisulfite-converted product for each single cell from the HCT116 ex vivo tree was sequenced to approximately 125,000 paired-end reads on a MiSeq. The methylation status of all cytosines was determined utilizing methylpy with default settings in addition to quality trimming bases with minimum Phred quality score of 30 (Schultz et al. 2015). Single cells were filtered as previously described by keeping cells that captured at least 200 microsatellites (≥30 reads per microsatellite locus) and 30,000 unique CpG sites (≥1 read per CpG).
In addition, ENCODE RRBS data for all cell lines (except for low-coverage HUES66 and H7-mESC) were downloaded and processed similarly with methylpy. We compared each single cell to all ENCODE reference cell lines by calculating pairwise dissimilarity for all shared cytosines in a CGN context. Briefly, pairwise dissimilarity was a previously developed single-cell methylation metric for determining methylation state by comparing methylation rate of shared CpGs between each single cell and reference cell line (Hui et al. 2018). Pairwise dissimilarity was calculated as follows given single cell i and reference cell line j, set {M} of all pairwise shared CpGs:
We calculated PD between each pair of single cell and reference cell line. We hypothesized that HCT116 would have the lowest pairwise dissimilarity with each single cell. In order to visualize this, we plotted all pairwise dissimilarities on a Python seaborn heat map with z-scores calculated within each single cell.
In order to determine batch effects across ex vivo single cell clones, we also plotted a UMAP based on the rate of methylation within each Ensembl hg19 regulatory build window (Mulqueen et al. 2018). The methylation rate was calculated by taking the ratio of reads exhibiting CpG methylation found within regulator build windows. We then utilized nonnegative matrix factorization and plotted features utilizing UMAP (McInnes et al. 2018). Pairwise dissimilarity and methylation rate analysis was repeated for U87MG single cells and nuclei derived from adult human cortex, hippocampus, and cerebellum. This demonstrated accurate cell type identification using methylation signal derived from RETrace.
Data access
All raw and processed sequencing data generated in this study have been submitted to the NCBI Gene Expression Omnibus (GEO; https://www.ncbi.nlm.nih.gov/geo/) under accession number GSE136089. The RETrace microsatellite data generated in this study have been submitted to the NCBI BioProject database (https://www.ncbi.nlm.nih.gov/bioproject/) under accession number PRJNA560947.
Competing interest statement
K.Z. is a cofounder, equity holder, scientific advisory board member, and paid consultant of Singlera Genomics, which has no commercial interests related to this study.
Supplementary Material
Acknowledgments
We thank Matthew Cai, Daniel Jacobsen, Huy Lam, Andrew Richards, and Sarah Urata for discussions regarding method optimization and troubleshooting; Dinh Diep and Yan Wu for their advice with bioinformatics data analysis; and Carter Palmer for help isolating adult human postmortem brain tissue. This work was supported by the National Institutes of Health grants to K.Z. (R01HG007836, R01HL123755, and U01MH114828).
Footnotes
[Supplemental material is available for this article.]
Article published online before print. Article, supplemental material, and publication date are at http://www.genome.org/cgi/doi/10.1101/gr.255851.119.
Freely available online through the Genome Research Open Access option.
References
- Biezuner T, Spiro A, Raz O, Amir S, Milo L, Adar R, Chapal-Ilani N, Berman V, Fried Y, Ainbinder E, et al. 2016. A generic, cost-effective, and scalable cell lineage analysis platform. Genome Res 26: 1588–1599. 10.1101/gr.202903.115 [DOI] [PMC free article] [PubMed] [Google Scholar]
- Boyer JC. 2002. Sequence dependent instability of mononucleotide microsatellites in cultured mismatch repair proficient and deficient mammalian cells. Hum Mol Genet 11: 707–713. 10.1093/hmg/11.6.707 [DOI] [PubMed] [Google Scholar]
- Cao J, Packer JS, Ramani V, Cusanovich DA, Huynh C, Daza R, Qiu X, Lee C, Furlan SN, Steemers FJ, et al. 2017. Comprehensive single-cell transcriptional profiling of a multicellular organism. Science 357: 661–667. 10.1126/science.aam8940 [DOI] [PMC free article] [PubMed] [Google Scholar]
- Chapal-Ilani N, Maruvka YE, Spiro A, Reizel Y, Adar R, Shlush LI, Shapiro E. 2013. Comparing algorithms that reconstruct cell lineage trees utilizing information on microsatellite mutations. PLoS Comput Biol 9: e1003297 10.1371/journal.pcbi.1003297 [DOI] [PMC free article] [PubMed] [Google Scholar]
- Chen C, Xing D, Tan L, Li H, Zhou G, Huang L, Xie XS. 2017. Single-cell whole-genome analyses by Linear Amplification via Transposon Insertion (LIANTI). Science 356: 189–194. 10.1126/science.aak9787 [DOI] [PMC free article] [PubMed] [Google Scholar]
- Ellegren H. 2004. Microsatellites: simple sequences with complex evolution. Nat Rev Genet 5: 435–445. 10.1038/nrg1348 [DOI] [PubMed] [Google Scholar]
- Evrony GD, Lee E, Mehta BK, Benjamini Y, Johnson RM, Cai X, Yang L, Haseley P, Lehmann HS, Park PJ, et al. 2015. Cell lineage analysis in human brain using endogenous retroelements. Neuron 85: 49–60. 10.1016/j.neuron.2014.12.028 [DOI] [PMC free article] [PubMed] [Google Scholar]
- Frumkin D, Wasserstrom A, Kaplan S, Feige U, Shapiro E. 2005. Genomic variability within an organism exposes its cell lineage tree. PLoS Comput Biol 1: e50 10.1371/journal.pcbi.0010050 [DOI] [PMC free article] [PubMed] [Google Scholar]
- Guo H, Zhu P, Wu X, Li X, Wen L, Tang F. 2013. Single-cell methylome landscapes of mouse embryonic stem cells and early embryos analyzed using reduced representation bisulfite sequencing. Genome Res 23: 2126–2135. 10.1101/gr.161679.113 [DOI] [PMC free article] [PubMed] [Google Scholar]
- Gymrek M, Yuan J, Zielinski D, Willems T, Gordon A, Erlich Y. 2017. Genome-wide profiling of heritable and de novo STR variations. Nat Methods 14: 590–592. 10.1038/nmeth.4267 [DOI] [PMC free article] [PubMed] [Google Scholar]
- Hui T, Cao Q, Wegrzyn-Woltosz J, O'Neill K, Hammond CA, Knapp DJHF, Laks E, Moksa M, Aparicio S, Eaves CJ, et al. 2018. High-resolution single-cell DNA methylation measurements reveal epigenetically distinct hematopoietic stem cell subpopulations. Stem Cell Reports 11: 578–592. 10.1016/j.stemcr.2018.07.003 [DOI] [PMC free article] [PubMed] [Google Scholar]
- International Human Genome Sequencing Consortium. 2001. Initial sequencing and analysis of the human genome. Nature 409: 860–921. 10.1038/35057062 [DOI] [PubMed] [Google Scholar]
- Li H, Durbin R. 2009. Fast and accurate short read alignment with Burrows–Wheeler transform. Bioinformatics 25: 1754–1760. 10.1093/bioinformatics/btp324 [DOI] [PMC free article] [PubMed] [Google Scholar]
- Lodato MA, Woodworth MB, Lee S, Evrony GD, Mehta BK, Karger A, Lee S, Chittenden TW, D'Gama AM, Cai X, et al. 2015. Somatic mutation in single human neurons tracks developmental and transcriptional history. Science 350: 94–98. 10.1126/science.aab1785 [DOI] [PMC free article] [PubMed] [Google Scholar]
- Ludwig LS, Lareau CA, Ulirsch JC, Christian E, Muus C, Li LH, Pelka K, Ge W, Oren Y, Brack A, et al. 2019. Lineage tracing in humans enabled by mitochondrial mutations and single-cell genomics. Cell 176: 1325–1339.e22. 10.1016/j.cell.2019.01.022 [DOI] [PMC free article] [PubMed] [Google Scholar]
- Luo C, Keown CL, Kurihara L, Zhou J, He Y, Li J, Castanon R, Lucero J, Nery JR, Sandoval JP. 2017. Single-cell methylomes identify neuronal subtypes and regulatory elements in mammalian cortex. Science 357: 600–604. 10.1126/science.aan3351 [DOI] [PMC free article] [PubMed] [Google Scholar]
- Martin M. 2011. Cutadapt removes adapter sequences from high-throughput sequencing reads. EMBnet.J 17: 10–12. 10.14806/ej.17.1.200 [DOI] [Google Scholar]
- McInnes L, Healy J, Saul N, Großberger L. 2018. UMAP: Uniform Manifold Approximation and Projection. J Open Source Softw 3: 861 10.21105/joss.00861 [DOI] [Google Scholar]
- Mulqueen RM, Pokholok D, Norberg SJ, Torkenczy KA, Fields AJ, Sun D, Sinnamon JR, Shendure J, Trapnell C, O'Roak BJ, et al. 2018. Highly scalable generation of DNA methylation profiles in single cells. Nat Biotechnol 36: 428–431. 10.1038/nbt.4112 [DOI] [PMC free article] [PubMed] [Google Scholar]
- Raj B, Wagner DE, McKenna A, Pandey S, Klein AM, Shendure J, Gagnon JA, Schier AF. 2018. Simultaneous single-cell profiling of lineages and cell types in the vertebrate brain. Nat Biotechnol 36: 442–450. 10.1038/nbt.4103 [DOI] [PMC free article] [PubMed] [Google Scholar]
- Salipante SJ, Horwitz MS. 2006. Phylogenetic fate mapping. Proc Natl Acad Sci 103: 5448–5453. 10.1073/pnas.0601265103 [DOI] [PMC free article] [PubMed] [Google Scholar]
- Schmitt MS, Fox EJ, Prindle MJ, Reid-Bayliss KS, True LD, Radich JP, Loeb LA. 2015. Sequencing small genomic targets with high efficiency and extreme accuracy. Nat Methods 12: 423–425. 10.1038/nmeth.3351 [DOI] [PMC free article] [PubMed] [Google Scholar]
- Schultz MD, He Y, Whitaker JW, Hariharan M, Mukamel EA, Leung D, Rajagopal N, Nery JR, Urich MA, Chen H, et al. 2015. Human body epigenome maps reveal noncanonical DNA methylation variation. Nature 523: 212–216. 10.1038/nature14465 [DOI] [PMC free article] [PubMed] [Google Scholar]
- Sos BC, Fung HL, Gao DR, Osothprarop TF, Kia A, He MM, Zhang K. 2016. Characterization of chromatin accessibility with a transposome hypersensitive sites sequencing (THS-seq) assay. Genome Biol 17: 20 10.1186/s13059-016-0882-7 [DOI] [PMC free article] [PubMed] [Google Scholar]
- Spanjaard B, Hu B, Mitic N, Olivares-Chauvet P, Janjuha S, Ninov N, Junker JP. 2018. Simultaneous lineage tracing and cell-type identification using CRISPR–Cas9-induced genetic scars. Nat Biotechnol 36: 469–473. 10.1038/nbt.4124 [DOI] [PMC free article] [PubMed] [Google Scholar]
- Sun JX, Helgason A, Masson G, Ebenesersdóttir SS, Li H, Mallick S, Gnerre S, Patterson N, Kong A, Reich D, et al. 2012. A direct characterization of human mutation based on microsatellites. Nat Genet 44: 1161–1165. 10.1038/ng.2398 [DOI] [PMC free article] [PubMed] [Google Scholar]
- Woodworth MB, Girskis KM, Walsh CA. 2017. Building a lineage from single cells: genetic techniques for cell lineage tracking. Nat Rev Genet 18: 230–244. 10.1038/nrg.2016.159 [DOI] [PMC free article] [PubMed] [Google Scholar]
Associated Data
This section collects any data citations, data availability statements, or supplementary materials included in this article.