

Abstract
Motivation: Although the outbreak of the severe acute respiratory syndrome (SARS) is currently over, it is expected that it will return to attack human beings. A critical challenge to scientists from various disciplines worldwide is to study the specificity of cleavage activity of SARS-related coronavirus (SARS-CoV) and use the knowledge obtained from the study for effective inhibitor design to fight the disease. The most commonly used inductive programming methods for knowledge discovery from data assume that the elements of input patterns are orthogonal to each other. Suppose a sub-sequence is denoted as P2P1P1′P2′, the conventional inductive programming method may result in a rule like ‘if P1 = Q, then the sub-sequence is cleaved, otherwise non-cleaved’. If the site P1 is not orthogonal to the others (for instance, P2, P1′ and P2′), the prediction power of these kind of rules may be limited. Therefore this study is aimed at developing a novel method for constructing non-orthogonal decision trees for mining protease data.
Result: Eighteen sequences of coronavirus polyprotein were downloaded from NCBI (http://www.ncbi.nlm.nih.gov). Among these sequences, 252 cleavage sites were experimentally determined. These sequences were scanned using a sliding window with size k to generate about 50 000 k-mer sub-sequences (for short, k-mers). The value of k varies from 4 to 12 with a gap of two. The bio-basis function proposed by Thomson et al. is used to transform the k-mers to a high-dimensional numerical space on which an inductive programming method is applied for the purpose of deriving a decision tree for decision-making. The process of this transform is referred to as a bio-mapping. The constructed decision trees select about 10 out of 50 000 k-mers. This small set of selected k-mers is regarded as a set of decisive templates. By doing so, non-orthogonal decision trees are constructed using the selected templates and the prediction accuracy is significantly improved.
Availability: The program for bio-mapping can be obtained by request to the author.
Contact: z.r.yang@exeter.ac.uk
INTRODUCTION
Severe acute respiratory syndrome (SARS) has hit the world since late 2002 and caused more than 8000 infected patients and more than 800 deaths in 25 countries around the world (Yang et al., 2003). SARS has dramatically demonstrated the wide-ranging impact on a highly mobile world. In response to the SARS outbreak, delegates of the 56th World Health Assembly, organized by WHO in May 2003, unanimously adopted a resolution authorizing WHO to act on information arising from sources other than official government notifications. In addition, WHO was asked to conduct on-the-spot investigations to ensure that an affected country has sufficient control to prevent international spread.
A novel coronavirus has been discovered to be associated with the cases of SARS; hence it was named as SARS-CoV (Rota et al., 2002). SARS-CoV as a novel coronavirus (Ksiazek et al., 2003; Marra et al., 2003; Yount et al., 2003) is an infectious respiratory disease. It starts with a fever, chills, headache and body aches, followed by a dry cough within 2–7 days. The most distinguishing feature is breathing difficulty. In severe cases, radiography can provide corroborative evidence of SARS by diagnosing pneumonia. The virus has a spherical enveloped virion. The size is between 80 and 160 nm diameters with a single stranded RNA of about 30 kb, which is the largest genome of all single stranded RNA viruses (Marra et al., 2003; Rota et al., 2002). In the electron micrograph image, glycoproteins on the virus' surface give the virions a halo or crown-like appearance, and hence the name coronavirus.
Coronaviruses are positive-strand RNA viruses with exceptionally large genome sizes (Hegyi and Ziebuhr, 2002). The replication and transcription of coronaviruses are encoded by the replicase genes (Thiel et al., 2001a,b). In many studies, 15-mers (P8P7P6P5P4P3P2P1P1′P2′P3′P4′P5′P6′P7′) were used to represent corresponding 3CLpro cleavage sites in the replicase polyproteins (Merrifield, 1965). It was indicated in Hegyi and Ziebuhr (2002) and Pallai et al. (1989) that the conserved prototypic viruses suggest that the order of cleavage events may occur in all coronaviruses. The structure and dynamics of SARS-CoV protease have been analysed using a molecular dynamics simulation technique (Lee et al., 2003), where molecular docking has been carried out in order to search for potential SARS-CoV protease inhibitors. Previously characterized coronaviruses encode two papain-like cysteine proteases (PL1pro and PL2pro), which cleave the N-proximal polyprotein regions at three sites (Bonilla et al., 1997; Gorbalenya et al., 1991; Herold et al., 1998; Thiel et al., 2001b; Ziebuhr et al., 2001). The recent studies show that 3C-like cysteine protease (3CLpro) cleaves the central and C-proximal regions at 11 conserved sites (Hardy et al., 2002; Hegyi and Ziebuhr, 2002; Tibbles et al., 1999; Ziebuhr et al., 2000).
It is found that the SARS-CoV is unrelated to any well-characterized human coronaviruses although the genome organization is similar to them (Ksiazek et al., 2003; Marra et al., 2003; Rota et al., 2002). Besides, all the SARS-CoV genomes sequenced to date demonstrate surprisingly little variation with mutations at only ∼30 nucleotides. Based on this, Scientists suggest that the virus entered the human population recently from a single point source through mutation. The study has also shown that the SARS-CoV is similar to a civet CoV. It is then hypothesized that the virus could have jumped the species barrier from civets to humans and the SARS-CoV was mutated from non-human coronavirus (Hu et al., 2003).
SARS-CoV gene expression is expected to involve complex transcriptional, translational and post-translational regulatory mechanisms whose molecular details are still unknown (Thiel et al., 2001b). It has been indicated that although vaccines are available for some animal coronaviruses, some of them can promote the disease when vaccinated animals are exposed to the wild-type virus. Moreover, antibody enhancement of disease is a potential risk of SARS vaccines in humans (Holmes, 2003; Lee et al., 2003). This means that it will take many years to develop a good preventive vaccine against SARS-CoV. It was suggested by Lee et al. (2003) to optimize the use of available drugs as inhibitors through studying the enzyme conformation. A recent study used a frequency estimation method to detect the cleavage sites within a specified region based on the knowledge of average length of cleavage products. (Gao et al., 2003). In that study, 12-mers P6P5P4P3P2P1P1′P2′P3′P4′P5′P6′ and 8-mers P4P3P2P1P1′P2′P3′P4′ were used for PLpro and 3CLpro cleavage sites, respectively.
According to our previous experience in analysing protein sequences, the prediction capability of the functional sites (cleavage sites in this study) depends on the inherent patterns in sub-sequences. If the patterns are not complicated (i.e., the sites in the sub-sequences are orthogonal to each other), simple rules can be explored by using inductive programming methods; the prediction of phosphorylation sites in proteins is such a case (Berry et al., 2004). However, most cases are not simple. The success of prediction of the functional sites needs more advanced investigation (Thomson et al., 2003; Yang and Chou, 2004a,b). A novel method is therefore proposed in this study for mining sub-sequence data. Instead of using the sites in k-mers as the inputs to an inductive programming model, it is proposed to transform k-mers to a high-dimensional numerical space through a mapping. An inductive programming method is then used in this high-dimensional space. The transform of k-mers needs a proper function to ensure the biological content in the k-mers can be maintained for data mining. In this study, the bio-basis function proposed in Thomson et al. (2003) is used for this mapping, referred to as a bio-mapping. With the bio-mapping, each k-mer is represented using a vector denoting its position in this high-dimensional space. After the mapping, an inductive programming is employed regarding the mapping vectors as the inputs. The modelling process itself will select the most informative and decisive k-mers to construct a non-orthogonal decision tree. These selected k-mers are then regarded as the templates for decision-making. Importantly, these templates are the representatives for the training k-mers, and hence the knowledge hidden in the training k-mers. Instead of resulting in rules like ‘if P1 = Q, then the k-mer cleaved’, non-orthogonal decision trees will have rules like ‘if a query k-mer is similar to a cleaved template, then the k-mer is cleaved’.
In this study, 18 coronavirus polyproteins were downloaded from GeneBank (NCBI, http://www.ncbi.nlm.nih.gov) for the investigation. After applying the proposed method to this data, it is found that the sensitivity is greatly increased by 30% while the specificity is maintained. Besides, the proposed method even outperformed the early work in the same area using neural networks (Kiemer et al., 2004) by 7% in the sensitivity with a slightly improved specificity.
SYSTEMS AND METHODS
Data
Eighteen coronavirus polyproteins whose sequences are available were downloaded from the GeneBank (NCBI, http://www.ncbi.nlm.nih.gov). They are NC_004718 (TOR2), NC_002645 (HCoV 229E), NC_001846 (MHV), NC_003045 (BCoV), NC_001451 (IBV), NC_002306 (TGEV), NC_003436 (PEDV), U_00735 (BCoVM), AF391542 (BCoVL), AF220295 (BCoVQ), AF208067 (MHVM), AF201929 (MHV2), AF208066 (MHVP), AY278741 (Urbani), AY278488 (BJ01), AY278554 (CUHK-W1), AY282752 (CUHK-su10) and AY291451 (TW1). Each has 14 cleavage sites. In total, there are 252 cleavage sites.
Decision trees
Decision trees are a kind of inductive programming algorithms (Breiman et al., 1984; Quinlan, 1988). They select a hyper-plane orthogonal to an axis of a variable through maximizing its ‘purity’. If a hyper-plane can make 100% separation between patterns from two classes with respect to a certain threshold value, its purity is 1. Otherwise, the purity value will be <1. Each hyper-plane divides a given region into two disjoint sub-regions. If each sub-region only comprises one class of patterns, the hyper-plane has a purity value as 1. The process of selecting hyper-planes continues till each resulting sub-region is pure for one class. The node which is pure for one class is referred to as a leaf. In terms of this, each leaf has an associated class label. From this, an inductive model is constructed and the training stage is completed. Various tree-pruning methods can be used to prevent over-fitting. In the testing stage, the hyper-planes will progressively lead a novel pattern into a leaf. Up to this end the classification of this novel pattern is completed through assigning the class label associated with the leaf to the novel pattern. Figure 1 shows a decision tree model, where there are two variables and the whole region is divided into six sub-regions. The first hyper-plane makes a separation using the threshold value a for the variable x. Both resulting sub-regions on the left and right of the hyper-plane are not pure. The second hyper-plane divides the left sub-region generated by the first hyper-plane into two smaller sub-regions using the threshold value b for the variable y. The upper sub-region has been pure for one class while the lower sub-region is still not pure and needs more separation.
Fig. 1.

Decision tree demonstration. The first hyper-plane is orthogonal to x with a threshold a and its purity is <1. The second hyper-plane is orthogonal to y with a threshold b and its purity is still <1. The third hyper-plane is orthogonal to y with a threshold c. The fourth and fifth hyper-planes are orthogonal to x with thresholds d and e. Their purity values are 1.
Decision tree algorithms have been used for bioinformatics research covering many areas, for instance the prediction of Hepatitis C virus protease cleavage sites (Narayanan et al., 2002) and the prediction of phosphorylation sites (Berry et al., 2004). In Kretschmann et al. (2001) C4.5 was used for protein annotation through aligning novel proteins with SWISS-PROT databank. C4.5 was also used for the prediction of phenotypes associated with Saccharomyces cerevisiae genes on the basis of gene ontology functional annotations from the relevant databanks (King et al., 2003). Decision trees were compared with support vector machines for the prediction of the impact of the single nucleotide polymorphisms on protein function (Krishnan and Westhead, 2003). The study shows that the decision trees have the advantage of generating interpreting rules although they have a lower prediction accuracy than support vector machines. In Li et al. (2003) decision trees were used for identifying genes related with cancer, and hence they provided knowledge for cancer diagnosis. King and his colleague studied the use of C4.5 for discovering rules for the prediction of the ORFs whose function is unknown (Clare and King, 2003). The alternative decision tree (Freund and Mason, 1999) was used for predicting the genetic regulatory response (Middendorf et al., 2004). In Selbig et al. (1999) decision trees were used for the prediction of secondary structures. Decision trees were also used in searching short and statistically significant emerging patterns for cancer diagnosis using gene expression profiles (Boulesteix et al., 2003).
Bio-mapping
The bio-mapping proposed in this study is based on the use of the bio-basis function (Thomson et al., 2003). The basic principle of the bio-basis function is the normalization of pairwise homology alignment scores. Figure 2 shows a query 4-mer (LQSE) aligned with two templates (LQSK and YKAE) to produce two homology alignment scores a (56+48+40+32=176) and b (28+36+36+48=148), respectively. It will be illustrated later in this paper that LQSK and LQSE are cleaved 4-mers. The values 56, 48, 40, 32, 28 and 36 are obtained from the Dayhoff matrix (Johnson and Overington, 1993). For instance, the similarity between the amino acids L and L is 56 whilst the similarity between the amino acids L and Y is 28. Because a > b, it is believed that the query 4-mer shares more functional similarity with the first (cleaved) template.
Fig. 2.

An illustration of the bio-mapping. The query 4-mer LQSE with unknown status (cleaved or non-cleaved) is mapped to a two-dimensional numerical space with two templates. These two templates are supposed to have the known status, cleaved or non-cleaved. As LQSE is more similar to LQSK than YKAE, its mapping magnitude on the axis of the template LQSK is larger than that on the axis of the template YKAE; see the right side in the figure.
The method of bio-mapping has been successfully used for the prediction of Trypsin cleavage sites (Thomson et al., 2003), HIV cleavage sites (Yang and Chou, 2004b; Yang and Thomson, 2005), hepatitis C virus protease cleavage sites (Yang and Berry, 2004), disordered protein prediction (Thomson and Esnouf, 2004; Yang et al., 2005), phosphorylation site prediction (Berry et al., 2004), the prediction of the O-linkage sites in glycoproteins (Yang and Chou, 2004a) and the prediction of caspase cleavage sites (Yang, 2005). A thorough review can be seen in Yang (2004).
In this study, the bio-basis function is employed for bio-mapping; i.e. for transforming the given k-mers to a high-dimensional numerical space on which an inductive programming method is employed for constructing a non-orthogonal decision tree. In a constructed decision tree, it is expected that the number of nodes will be much less than the number of given k-mers. As each node employs one k-mer, the selection of the most informative and decisive template is automatically completed in running an inductive programming method. In other words, the less informative k-mers are automatically removed in learning. It is also expected that the prediction accuracy of the non-orthogonal decision trees will not be lower than that of orthogonal trees constructed using the sites in k-mers as inputs.
Methods
Step 1. Sequences of 18 polyproteins are scanned using a sliding window with the size of k (k is always an even number). Each scan results in one k-mer denoted as Pk/2 ⋯ P2P1P1′P2′ ⋯ Pk/2′. A k-mer is classified as a cleaved or positive one if there is a cleavage site between P1 and P1′, and otherwise as non-cleaved or negative. The previous reports have used different window sizes (Gao et al., 2003; Hegyi and Ziebuhr, 2002; Herold et al., 1998; Merrifield, 1965; Pallai et al., 1989; Thiel et al., 2001a,b; Thiel et al., 2003; Ziebuhr et al., 2000; Ziebuhr et al., 2001). The window size is varied in this study from 4 to 12 (the largest in recent literature) to investigate the impact of window size on the prediction performance. After this process, about 50 000 k-mers are generated.
Step 2. All the k-mers are divided into 10 folds for 10-fold cross-validation. In each run, nine folds of k-mers are used for constructing orthogonal and non-orthogonal decision trees. The constructed tree is tested on the remaining fold of k-mers.
Step 3. Map nine folds of k-mers into a high-dimensional numerical space using the bio-mapping for constructing non-orthogonal decision trees. There are two bio-mapping strategies:
Strategy 1: Both positive and negative k-mers are candidates for template selection.
Strategy 2: Only positive k-mers are candidates for template selection. The use of this strategy is based on the observation that negative k-mers are normally not conserved to any pattern (Yang and Berry, 2004).
Step 4. Construct decision trees in the mapped numerical space. From this, draw and analyse the constructed decision trees. The free software package C4.5 is used in this study for tree construction.
Step 5. The prediction performance is assessed using five indicators, the true positive fraction (TPf), true negative fraction (TNf), total accuracy (Total), Matthews' correlation coefficient (MCC) (Matthews, 1975) and the positive prediction power (PPf). Suppose true negatives, true positives, false negatives and false positives are referred to as TN, TP, FN and FP, respectively, the definitions of these indicators are as follows:
 |
The positive prediction power measures the likelihood that a predicted positive is the true positive. Matthews' correlation coefficient measures how the prediction correlates with the real target value. Matthews' correlation coefficient has been widely used in biology and bioinformatics (Gorodkin, 2004). There is a risk of losing information when using the total accuracy when the disparity in the data is large, which is very common in analysing biological data; the Matthews correlation coefficient remedies this problem. When its value is 1, it means a perfect prediction; if it is 0, it means for a completely random assignment. The larger the value, the better the prediction performance. In the assessment, the combination of the TPf and the PPf can be used to visualize the model comparison.
RESULT
Figure 3 shows the performance of three sets of models using window size 4, where ‘NM’ means the models without any bio-mapping and hence orthogonal decision trees, ‘BM1’ the models using the first bio-mapping strategy and ‘BM2’ the second bio-mapping strategy. It can be seen that ‘BM2’ worked the best. The NM models did not work well since they are unable to predict cleaved k-mers well. When the window size is increased, the performance was similar in general (data not shown).
Fig. 3.

The performance of 10-fold cross-validation performance. The horizontal axis represents the measurement indicators and the vertical axis the performance. Although ‘NM’ gives a high total prediction accuracy, its sensitivity is very low (<70%). For all the measurement indicators, ‘BM2’ outperformed ‘BM1’ meaning the positive k-mers are important for template selection.
Figure 4 shows a comparison among three sets of models using TPf as the horizontal axis and PPf as the vertical axis. Each set has five points representing five models each of which uses a distinct window size. The closer to the top-right corner it is, the better the model's performance. It can be seen that the set of BM2 models performed the best. The p-value of the t-test between the NM and BM1 models is 0.01 meaning that the null hypothesis that the BM1 model does not improve the prediction accuracy compared with the NM model is denied statistically. The p-value of the t-test between the BM1 and BM2 models is 0.02 also meaning that the null hypothesis that the BM2 model does not improve the prediction compared with BM1 model is denied statistically.
Fig. 4.

A comparison among three sets of models using the sensitivity and PPf. The horizontal axis represents sensitivity and the vertical axis the PPf. Any model located between the diagonal line from the top-left corner to the bottom-right corner is a failed one. The best model, without doubt, is located on the top-right corner.
Because the performance of the BM1 model decreases when the window size increases, we use the window size 4 for the comparison of the constructed trees. Shown in Figure 5 is the constructed BM1 tree (or model) for the window size 4, where ‘f(s, LQSK, 1)’ means the output of a bio-basis function using a cleaved (marked by ‘1’, otherwise ‘0’) 4-mer LQSK, ‘< = 0.543351’ means the condition for transforming to one of two sub-trees, Y means that the condition is satisfied, N means that the condition is not satisfied and the triangles represent the class of non-cleaved 4-mers and the circles the class of cleaved 4-mers. Ten of about 50 000 4-mers were selected demonstrating their importance in decision-making. Five are cleaved and five are non-cleaved ones. The root node uses the cleaved 4-mer LQSK as the template. A query 4-mer without confirmed cleavage information is fed to the root node. If the similarity between the query 4-mer and LQSK is <0.543351, the decision is passed by to the sub-tree using GGAP as the root for further comparison. Suppose the query 4-mer has been with the leaf node associated with the non-cleaved 4-mer DYLA, we can investigate if the query 4-mer is cleaved or not. If the similarity between the query 4-mer and DYLA is <0.453845, the query 4-mer is labelled as a cleaved one as it is dissimilar to a non-cleaved 4-mer and otherwise as a non-cleaved one. Suppose the query 4-mer has been with the leaf node associated with the cleaved 4-mer LQAL, we can also investigate if the query 4-mer is cleaved or not. If the similarity between the query 4-mer and LQAL is <0.559898, the query 4-mer is labelled as non-cleaved as it is dissimilar to a cleaved 4-mer; otherwise it is labelled a cleaved one.
Fig. 5.

The extracted BM1 decision tree. The triangles represent the non-cleaved class and the circles the cleaved one. Each box uses one template which are either cleaved or non-cleaved 4-mers. The bio-basis function is used to measure the similarity between a query 4-mer and a template. In calculating the similarity, a substitution matrix like the Dayhof matrix is used. A branch node or the root node is used for transforming a decision-making process to an appropriate sub-tree. Each leaf node is used for decision-making.
As a comparison, Figure 6 shows the constructed BM2 tree, where 11 cleaved 4-mers are selected as the templates for decision-making. Interestingly, the root node again selects the same cleaved 4-mer LQSK as the BM1 tree meaning that this 4-mer is the most important one for decision-making.
Fig. 6.

The extracted BM2 decision tree. The triangles represent the non-cleaved class and the circles the cleaved class. Each box uses one template which are always cleaved 4-mers. The bio-basis function is used to measure the similarity between a query 4-mer and a template. The branch nodes including the root node are used for transforming the decision-making process to the appropriate sub-trees. The leaf nodes are used for decision-making.
We then investigate the individual 4-mers which are selected as templates in either the BM1 or the BM2 model. Figure 7 shows the probability density functions of two 4-mers selected as templates in the decision trees, where the 4-mer LQSK was always selected as the template for the root node in both trees while DYLA was selected for one of the leaf nodes. Note that the thin lines represent the probability density function of the similarity between the non-cleaved 4-mers and a template, and the thick lines the probability density function of the similarity between the cleaved 4-mers and a template. It can be seen that the template LQSK shows high discriminating capability. This is why it is always selected as the template for the root node.
Fig. 7.
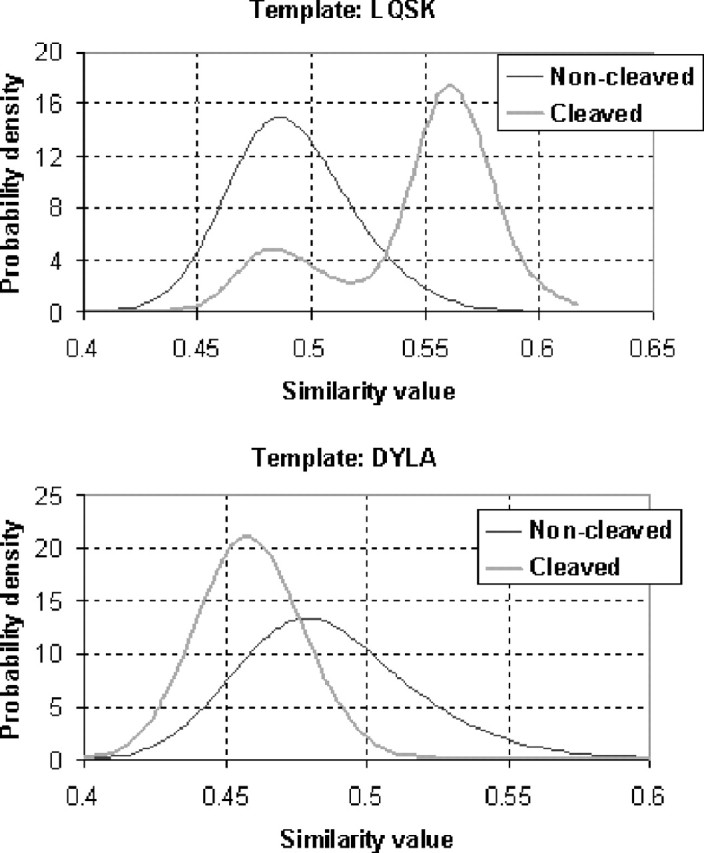
The probability density functions of two sub-sequences which are selected as templates in the decision trees. Each horizontal axis represents the similarity between a query k-mer (either cleaved or non-cleaved ones) and a template. The vertical axes represent the probability density values. If two probability density functions are separated well, the template is believed to discriminate well between cleaved and non-cleaved 4-mers.
In Kiemer et al. (2004) the sensitivity was only 87% and the specificity was 99%. The sensitivity and specificity values of the BM1 and BM2 models are listed in Table 1. From this table, we can also see that the performance of BM1 decreases when the window size increases while the performance of BM2 maintains unchanged when changing the window size. This may result from the inclusion of long non-cleaved k-mers which disrupted the modelling performance in BM1 models.
Table 1.
Sensitivity and specificity of BM1 and BM2 models
| Window | BM1 | BM2 | ||
|---|---|---|---|---|
| Specificity (%) | Sensitivity (%) | Specificity (%) | Sensitivity (%) | |
| 4 | 98.06±1.50 | 95.50±3.78 | 97.94±2.22 | 98.09±2.51 |
| 6 | 96.82±2.09 | 92.47±6.04 | 97.68±1.44 | 94.37±2.26 |
| 8 | 95.68±2.36 | 92.44±9.97 | 98.77±1.08 | 95.50±7.06 |
| 10 | 94.84±2.39 | 87.48±6.62 | 97.41±1.70 | 90.76±6.54 |
| 12 | 95.22±1.84 | 86.28±5.35 | 97.63±1.27 | 94.11±4.33 |
DISCUSSION
This paper has presented a novel method called ‘bio-mapping’ based on non-orthogonal decision trees for mining protease data. Bio-mapping maps k-mers to a numerical space. In this numerical space, decision trees are used for mining protease data. The method has been applied to the prediction of the SARS-CoV protease cleavage sites. It has been found in the simulation that this novel method showed great success in two aspects: success in improving the prediction accuracy and success in extracting the most important k-mers as templates for decision-making. Two strategies were introduced for bio-mapping. The first strategy referred to as ‘BM1’ selects templates from all the k-mers. The second strategy referred to as ‘BM2’ selects templates only from the cleaved k-mers based on the observation made in our earlier study that most non-cleaved k-mers do not show conserved patterns. It has been found through computer simulation that the second strategy performed better.
It should be noted that there are many substitution matrices available, such as Blosum62 (Henikoff and Henikoff, 1992) and the most recently developed one called the composition-adjusted matrix (Yu et al., 2003). The composition-adjusted (for short, adjusted) has been used in this study. It can be seen from Figure 8 that both models performed equally well for the window sizes 4, 6, 8 and 10. However, the adjusted model with the window size 12 performed badly.
Fig. 8.

The comparison between the Dayhoff matrix and the composition-adjusted (adjusted) matrices. The horizontal axis represents the TPf and the vertical axis the PPf. The circles represent the adjusted models while the triangles represent the Dayhoff models. It can be seen that one adjusted model performed badly. The window size for this model is 12 and it is located on the left. All the other four pairs (window sizes 4, 6, 8 and 10) performed equally well.
It has been mentioned that the 4-mer LQSK seems the most important template selected through this inductive programming learning in the high-dimensional space. Although different papers discussed the use of different sizes of k-mers for the prediction, it has to be noted that the studies were limited to a few polyproteins. The most interesting work described in Hegyi and Ziebuhr (2002) has found two templates (3-mers P2P1P1′) through experiments, i.e. LQS and LQA. This has also been confirmed by other researchers (Ziebuhr and Siddell, 1999; Gao et al., 2003; Thiel et al., 2003; Kiemer et al., 2004). This means that the proposed method in this study is able to extract the important templates for decision-making in an automatic and intelligent way and shows that computer programs are able to assist biological experiments for scientific findings.
The last issue is about window size. It has been found that the increased window size does not improve the sensitivity (Table 1) when using decision trees. However, the biological experiments have found that more than four sites are useful for inhibitor design to fight the disease (Anand et al., 2003; Gao et al., 2003; Thiel et al., 2003; Kiemer et al., 2004). This means that in the real use of a computer program for computer-aided drug design, biological knowledge should be used to alter the information provided by the decision-making system made by a computer program.
IMPLEMENTATION
The programs were encoded in java and C on a PC containing a 500 MHz Pentium and Linux operating system.
Acknowledgments
The author thanks Prof. Quinlan for the use of C4.5 and the reviewers for their valuable comments. The author also thanks Singapore Nanyang Technology University for hosting the author for his sabbatical leave in November 2004, during which this work was completed.
REFERENCES
- Anand, K., et al. 2003. Coronavirus main proteinase (3CLpro) structure: basis for design of anti-SARS drugs. Science 3001763–1767 [DOI] [PubMed] [Google Scholar]
- Berry, E., et al. 2004. Reduced bio basis function neural network for identification of protein phosphorylation sites: comparison with pattern recognition algorithms. Comput. Biol. Chem. 2875–85 [DOI] [PubMed] [Google Scholar]
- Bonilla, P.J., et al. 1997. Characterisation of a second cleavage site and demonstration of activity in trans by the papain-like proteinase of the murine coronavirus mouse hepatitis virus strain A59. J. Virol. 71900–909 [DOI] [PMC free article] [PubMed] [Google Scholar]
- Boulesteix, A., et al. 2003. A CART-based approach to discover emerging patterns in microarray data. Bioinformatics 192465–2472 [DOI] [PubMed] [Google Scholar]
- Breiman, L., Friedman, J.H., Olshen, J.A., Stone, C.J. Classification and Regression Trees 1984, Belmont, CA Wadsworth
- Clare, A. and King, R.D. 2003. Predicting gene function in Saccharomyces cerevisiae Bioinformatics 19s42–s49 [DOI] [PubMed] [Google Scholar]
- Freund, Y. and Mason, L. 1999. The alternating decision tree learning algorithm. Proceedings of the Sixteenth International Conference on Machine Learning Morgan Kaufmann, pp. 124–133
- Gao, F., et al. 2003. Prediction of proteinase cleavage sites in polyproteins of coronaviruses and its applications in analyzing SARS-CoV genomes. FEBS Lett 553451–456 [DOI] [PMC free article] [PubMed] [Google Scholar]
- Gorbalenya, A.E., et al. 1991. Putative papain-related thiol proteases of positive-strand RNA viruses. Identification of rubi- and aphthovirus proteases and delineation of a novel coserved domain associated with proteases of rubi-, alpha- and coronaviruses. FEBS Lett. 88201–205 [DOI] [PMC free article] [PubMed] [Google Scholar]
- Gorodkin, J. 2004. Comparing two K-category assignments by a K-category correlation coefficient. Comput. Biol. Chem. 28367–374 [DOI] [PubMed] [Google Scholar]
- Hardy, M.E., et al. 2002. Substrate specificity of the Norwalk virus 3C-like protease. Virus Res. 8929–39 [DOI] [PubMed] [Google Scholar]
- Hegyi, A. and Ziebuhr, J. 2002. Conservation of substrate specificities among coronavirus main proteases. J. General Virol. 83595–599 [DOI] [PubMed] [Google Scholar]
- Henikoff, S. and Henikoff, J.G. 1992. Amino acid substitution matrices from protein blocks. Proc. Natl Acad. Sci. USA 8910915–10919 [DOI] [PMC free article] [PubMed] [Google Scholar]
- Herold, J., et al. 1998. Proteolytic processing at the amino terminus of human coronavirus 229E gene 1-encoded polyproteins: identification of a papain-like proteinase and its substrate. J. Virol. 72910–918 [DOI] [PMC free article] [PubMed] [Google Scholar]
- Holmes, K.V. 2003. SARS-associated coronavirus. N. Engl. J. Med 201948. [DOI] [PubMed] [Google Scholar]
- Hu, L.D., et al. 2003. Mutation analysis of 20 SARS virus genome sequences: evidence for negative selection in replicase ORF1b and spike gene. Acta Pharmacol. Sin. 24741–745 [PubMed] [Google Scholar]
- Johnson, M.S. and Overington, J.P. 1993. A structural basis for sequence comparisons—an evaluation of scoring methodologies. J. Mol. Biol 233716–738 [DOI] [PubMed] [Google Scholar]
- Kiemer, L., et al. 2004. Coronavirus 3CLpro proteinase cleavage sites: Possible relevance to SARS virus pathology. BMC Bioinform 572. [DOI] [PMC free article] [PubMed] [Google Scholar]
- King, O., et al. 2003. Predicting phenotype from patterns of annotation. Bioinformatics 19s183–s189 [DOI] [PubMed] [Google Scholar]
- Kretschmann, E., et al. 2001. Automatic rule generation for protein annotation with the C4.5 data mining applied on SWISS-PROT. Bioinformatics 17920–926 [DOI] [PubMed] [Google Scholar]
- Krishnan, V.G. and Westhead, D.R. 2003. A comparative study of machine-learning methods to predict the effects of single nucleotide polymorphisms on protein function. Bioinformatics 192199–2209 [DOI] [PubMed] [Google Scholar]
- Ksiazek, T.G., et al. 2003. A novel coronavirus associated with severe acute respiratory syndrome. N. Engl. J. Med 3481947–1957 [DOI] [PubMed] [Google Scholar]
- Lee, V.S., et al. 2003. Structure and dynamics of SARS coronavirus proteinase: the primary key to the designing and screening for anti-SARS drugs. Sci. Asia 29181–188 [Google Scholar]
- Li, J., et al. 2003. Discovery of significant rules for classifying cancer diagnosis data. Bioinformatics 19s93–s102 [DOI] [PubMed] [Google Scholar]
- Matthews, B.W. 1975. Comparison of the predicted and observed secondary structure of T4 phage lysozyme. Biochim. Biophys. Acta 405442–451 [DOI] [PubMed] [Google Scholar]
- Marra, M.A., et al. 2003. The genome sequence of the SARS-associated coronavirus. Science 3001399–1404 [DOI] [PubMed] [Google Scholar]
- Merrifield, R.B. 1965. Automated synthesis of peptides. Science 150178–185 [DOI] [PubMed] [Google Scholar]
- Middendorf, M., et al. 2004. Predicting genetic regulatory response using classification. Bioinformatics 20s232–s240 [DOI] [PubMed] [Google Scholar]
- Narayanan, A., et al. 2002. Mining viral protease data to extract cleavage knowledge. Bioinformatics 18s5–s13 [DOI] [PubMed] [Google Scholar]
- Pallai, P.V., et al. 1989. Cleavage of synthesis peptides by purified poliovirus 3C proteinase. J. Biol. Chem 2649738–9741 [PubMed] [Google Scholar]
- Quinlan, J.R. C4.5: Programs for Machine Learning 1988, San Mateo, CA Morgan Kaufmann Publishers
- Rota, P.A., et al. 2002. Characterization of a novel coronavirus associated with severe acute respiratory syndrome. Science Express 1 May, 1–5 [DOI] [PubMed]
- Selbig, J., et al. 1999. Decision tree-based formation of consensus protein secondary structure prediction. Bioinformatics 151039–1046 [DOI] [PubMed] [Google Scholar]
- Thiel, V., et al. 2001. Infectious RNA transcribed in vitro from a cDNA copy of the human coronavirus genome cloned in vaccinia virus. J. Gen. Virol 821273–1281 [DOI] [PubMed] [Google Scholar]
- Thiel, V., et al. 2001. Viral replicase gene products suffice for coronavirus discontinuous transcription. J. Gen. Virol 756676–6681 [DOI] [PMC free article] [PubMed] [Google Scholar]
- Thiel, V., et al. 2003. Mechanisms and enzymes involved in SARS coronavirus genome expression. J. Gen. Virol 842305–2315 [DOI] [PubMed] [Google Scholar]
- Thomson, R., et al. 2003. Characterising proteolytic cleavage site activity using bio-basis function neural network. Bioinformatics 191741–1747 [DOI] [PubMed] [Google Scholar]
- Thomson, R. and Esnouf, R. 2004. Predict disordered proteins using bio-basis function neural networks. Lecture Notes Comput. Sci 317719–27 [Google Scholar]
- Tibbles, K.W., et al. 1999. Activity of a purified His-tagged 3C-like protease from the coronavirus infectious bronchitis virus. Virus Res 60137–145 [DOI] [PMC free article] [PubMed] [Google Scholar]
- Yang, Z.R. 2004. Biology applications of support vector machines. Brief. Bioinform 5328–338 [DOI] [PubMed] [Google Scholar]
- Yang, Z.R. 2005. Prediction of caspase cleavage sites using Bayesian bio-basis function neural networks. Bioinformatics 211831–1837 [DOI] [PubMed] [Google Scholar]
- Yang, Z.R. and Berry, E. 2004. Reduced bio-basis function neural networks for protease cleavage site prediction. J. Comput. Biol. Bioinform 2511–531 [DOI] [PubMed] [Google Scholar]
- Yang, Z.R. and Chou, K.C. 2004. Predicting the O-linkage sites in glycoproteins using bio-basis function neural networks. Bioinformatics 20903–908 [DOI] [PubMed] [Google Scholar]
- Yang, Z.R. and Chou, K.C. 2004. Bio-support vector machines for computational proteomics. Bioinformatics 20735–741 [DOI] [PubMed] [Google Scholar]
- Yang, H., et al. 2003. The crystal structures of severe acute respiratory syndrome virus main protease and its complex with an inhibitor. Proc. Natl Acad. Sci. USA 1113190–13195 [DOI] [PMC free article] [PubMed] [Google Scholar]
- Yang, Z.R., et al. 2005. RONN: use of the bio-basis function neural network technique for the detection of natively disordered regions in proteins. Bioinformatics (accepted) [DOI] [PubMed]
- Yang, Z.R. and Thomson, R. 2005. A novel neural network method in mining molecular sequence data. IEEE Trans. on Neural Networks 16263–274 [DOI] [PubMed] [Google Scholar]
- Yount, B., et al. 2003. Reverse genetics with a full-length infectious cDNA of severe acute respiratory syndrome coronavirus. Proc. Natl Acad. Sci. USA 10012995–13000 [DOI] [PMC free article] [PubMed] [Google Scholar]
- Yu, Y.K., et al. 2003. The compositional adjustment of amino acid substitution matrices. Proc. Natl Acad. Sci. USA 10015688–15693 [DOI] [PMC free article] [PubMed] [Google Scholar]
- Ziebuhr, J. and Siddell, S.G. 1999. Processing of the human coronavirus 229E replicase polyproteins by the virus-encoded 3C-like proteinase: identification of proteolytic products and cleavage sites common to pp1a and pp1ab. J. Gen. Virol 73177–185 [DOI] [PMC free article] [PubMed] [Google Scholar]
- Ziebuhr, J., et al. 2000. Virus-encoded protease and proteolytic processing in the Nidovirales. J. Gen. Virol 81853–879 [DOI] [PubMed] [Google Scholar]
- Ziebuhr, J., et al. 2001. The autocatalytic release of a putative RNA virus transcription factor from its polyprotein precusor involves two paralogous papain-like proteases that cleave the same peptide bond. J. Biol. Chem 27633220–33232 [DOI] [PMC free article] [PubMed] [Google Scholar]