

Abstract
Valvular heart disease is observed in approximately 2% of the general population1. Although the initial observation is often localized (for example, to the aortic or mitral valve), disease manifestations are regularly observed in the other valves and patients frequently require surgery. Despite the high frequency of heart valve disease, only a handful of genes have so far been identified as the monogenic causes of disease2–7. Here we identify two consanguineous families, each with two affected family members presenting with progressive heart valve disease early in life. Whole-exome sequencing revealed homozygous, truncating nonsense alleles in ADAMTS19 in all four affected individuals. Homozygous knockout mice for Adamts19 show aortic valve dysfunction, recapitulating aspects of the human phenotype. Expression analysis using a lacZ reporter and single-cell RNA sequencing highlight Adamts19 as a novel marker for valvular interstitial cells; inference of gene regulatory networks in valvular interstitial cells positions Adamts19 in a highly discriminatory network driven by the transcription factor lymphoid enhancer-binding factor 1 downstream of the Wnt signaling pathway. Upregulation of endocardial Krüppel-like factor 2 in Adamts19 knockout mice precedes hemodynamic perturbation, showing that a tight balance in the Wnt–Adamts19–Klf2 axis is required for proper valve maturation and maintenance.
Valvular heart disease can affect any of the four cardiac valves and is often associated with syndromic disorders8–10. Previous studies have highlighted the complex genetic architecture of heart valve disease (HVD)11,12. Despite the high frequency of different types of HVD, such as mitral valve prolapse and bicuspid aortic valve (BAV), only a minority of cases have an underlying monogenic cause in a nonsyndromic context2–7. Here, we identify two unrelated consanguineous families with a recessive inheritance pattern of early-onset HVD without a syndromic phenotype (Supplementary Note). Exome sequencing revealed homozygous, rare loss-of-function (LOF) alleles in four affected individuals in the gene ADAMTS19. The parents in family 1 (I-1 and I-2) are second cousins (Fig. 1a) and both carry a rare copy number variant overlapping exons 1–8 of ADAMTS19 (ref. 13) (Fig. 1c and Supplementary Fig. 1a). Two of the children in this family are homozygous for the deletion and were diagnosed with HVD disease early on in life (Supplementary Table 1). In family 2, the parents who are second cousins carry a rare truncating, nonsense mutation in ADAMTS19 (rs772148624, NM_133638.5:c.1984C>T, ADAMTS19:p.Arg656*, Genome AggregationDatabase(gnomAD)frequency = 7.959 × 10⁻⁶; Fig. 1b,d). Two of their children are homozygous for this mutation and were diagnosed with HVD early on in life that progressively worsened while their heterozygous siblings and parents showed no signs of the disease (Fig. 1e,f, Supplementary Table 1 and Supplementary Videos 1–3). A recessive linkage analysis of the ADAMTS19 locus for both families resulted in a nonsignificant log-of-odds score (log-of-odds = 1.59) due to the limited number of affected individuals. Despite the nonsignificant linkage results, ADAMTS19 represents the only gene for which all affected individuals showed homozygous, rare LOF alleles, making it a strong candidate gene for the observed HVD (Supplementary Table 2). In contrast to other ADAMTS-linked diseases, no syndromic features were identified in any of the affected patients, suggesting that LOF of ADAMTS19 leads to isolated, nonsyndromic, progressive HVD in humans14–18. No homozygous LOF variant carriers were found in public genetic databases such as gnomAD, Geno2MP (http://geno2mp.gs.washington.edu, accessed February 2019) or in any in-house databases (approximately 5,000 exomes of European ancestry for congenital heart disease, approximately 900 exomes of Arabic ancestry) indicating that homozygous LOF for ADAMTS19 is extremely rare13. In support of this observation, ADAMTS19 shows a strong signature of negative selection against LOF variants in the Exome Aggregation Consortium and gnomAD databases with a probability of LOF intolerance (pLI score) of 0.95 and an observed/expected score of 0.39, respectively, categorizing it as extremely intolerant to LOF variants13 (Supplementary Fig. 1b).
Fig. 1 |. Homozygous loss of ADAMTS19 in human families causes progressive HVD.
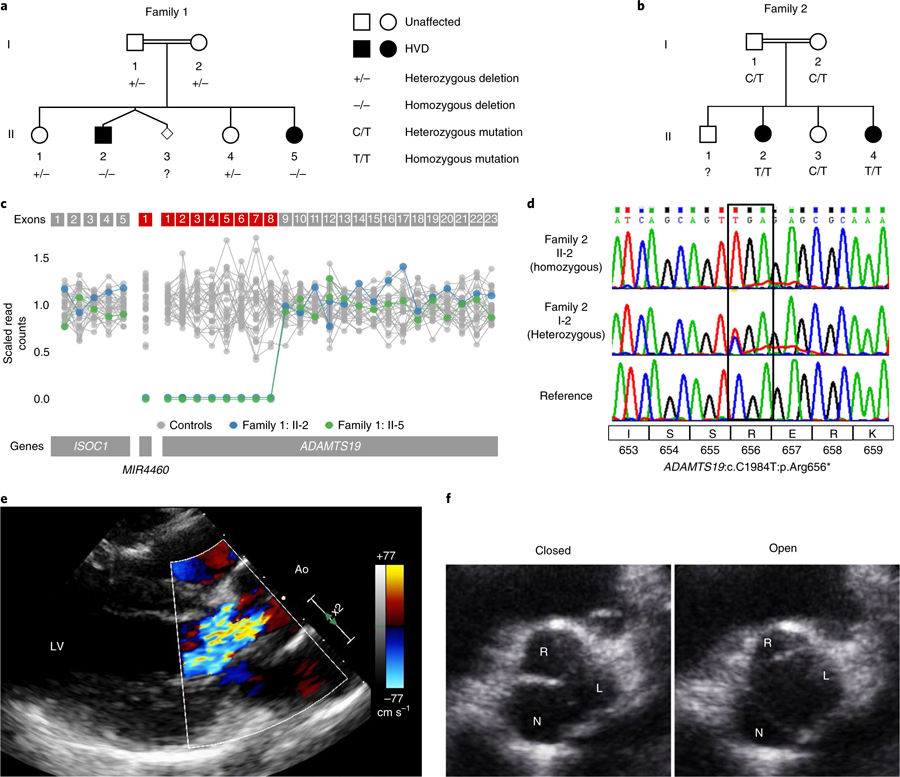
a, Family 1 has a genomic deletion of ADAMTS19 coding exons 1–8. Individuals in family 1: II-2 and family 1: II-5 are homozygous for the deletion and have progressive HVD. Parents and siblings who are carriers do not show signs of HVD. b, In family 2, two offspring (family 2: II-2 and II-4) affected with progressive HVD are homozygous for a rare LOF mutation (ADAMTS19:c. C1984T:p.Arg656*). c, Scaled read counts of whole-exome sequencing for the deleted ADAMTS19 region in family 1. Exons missing both copies in affected individuals are marked in red. d, Representative Sanger sequencing of the nonsense allele in a reference individual, the heterozygous mother who is a carrier (family 2: I-2) and a homozygous patient (family 2: II-2). e, Color Doppler echocardiography of left ventricular outflow tract in diastole for individual family 2:II-4, highlighting aortic regurgitation in the patient. f, Echocardiographic view of aortic valve for individual family 2:II-4 at 15 years of age in opened (left) and closed (right) positions, showing thickened R-N commissure.
While the results from human linkage analysis on their own did not significantly link LOF of ADAMTS19 with HVD, we wanted to test experimentally whether loss of ADAMTS19 has an effect on valve homeostasis. To address the hypothesis that ADAMTS19 is necessary for valve development, we created a mouse model using a knockout-first allele tagged with a lacZ reporter cassette (referred to as Adamts19KO (EUCOMM, Adamts19tm4a(EUCOMM)Wtsi; Supplementary Fig. 2))19–22. Homozygous Adamts19KO/KO mice were viable, fertile and born in Mendelian ratios (Supplementary Table 3). Echocardiographic analysis of homozygous Adamts19KO/KO mice revealed progressive aortic valve disease characterized by regurgitation and/or aortic stenosis in 38% of Adamts19KO/KO mice at 3 months (29 out of 77; Supplementary Table 4). No dysfunction was noted in any of the other valves examined (Supplementary Table 5). Aortic flow disturbances and valve dysfunction in Adamts19KO/KO mice strikingly resembled the phenotype observed in our human patients (Fig. 2a). Valve defects ranged from aortic regurgitation (Supplementary Videos 4 and 5) to severe aortic valve stenosis (Supplementary Videos 6 and 7) or a combination of both, compared to normal functioning valves from wild-type (WT) mice (Supplementary Video 8 and 9), with significant progression over time23 (Fig. 2b). Dysfunctional aortic valves showed thickening of commissures and reduced opening of the valve, occasionally in a ‘fish mouth’ pattern with only two visible commissures, reminiscent of fused BAV in humans (Fig. 2c and Supplementary Videos 10 and 11). Aortic valves from homozygous knockout mice appeared denser, with localized accumulation of melanocyte clusters in the leaflets (Fig. 3a,d). Histological examination of dysfunctional aortic valves from Adamts19KO/KO mice showed disorganization of the extracellular matrix (ECM) throughout the valve leaflets compared to controls (Fig. 3b–j). Aortic valves were significantly thickened at the hinge regions of the leaflets (P = 2.719 × 10⁻⁶, Student’s t-test; Fig. 3k–m). Partial fusion at the annulus of the aortic valve leaflets showed increased collagen deposition at the hinges covering the raphe (Fig. 3f). Electron microscopy of aged, diseased aortic valves at six months of age showed that the three-layered structure discernible in WT leaflets was somewhat conserved in mutants (Fig. 4a). However, mutant valves tended to be thicker, with cellular debris, small bundles of collagen fibers and abundant proteoglycans, particular at the leaflet tip (Fig. 4b and Supplementary Figs. 3 and 4). This observation, as well as the cellular characteristics in the knockout valves, are consistent with a change toward a secretory valvular interstitial cell (VIC) phenotype (Fig. 4a,b). In the hinge areas, mutant valves showed smaller collagen type I fibers, cells reminiscent of osteoblasts and increased cellular debris (Fig. 4c,d). Interestingly, we did not observe any calcification associated with valve disease in Adamts19KO/KO mice up to nine months, suggesting that the mechanism driving disease in our model is distinct from calcified aortic valve disease. To test potential dysregulated targets downstream of Adamts19, we performed immunohistochemistry (IHC) on several candidate ECM proteins for HVD in healthy WT and diseased aortic valves of Adamts19KO/KO mice (Supplementary Fig. 5). None of the canonical candidates tested showed a strong difference between genotypes, suggesting other mechanisms are responsible for disease. Moreover, the blood flow patterns and pathology of aortic valves for Adamts19KO/KO mice together with the histological observations strongly suggest a functional, fused BAV-like phenotype in the Adamts19KO/KO mice, similar to that observed in humans24. Of note, two of the four human patients were initially diagnosed with BAV, suggesting a robust correlation between the murine and human aortic valve manifestations. The incomplete penetrance for the aortic valve disease observed in Adamts19KO/KO mice is in line with several mouse models of valve disease, which often show incomplete penetrance, such as Nkx2.5 (8.2% for BAV), Gata5 (25% for BAV) and Robo4 (17.9% in male and 11.1% female homozygous knockouts)6,25,26.
Fig. 2 |. Homozygous Adamts19KO/KO mice develop aortic valve disease.
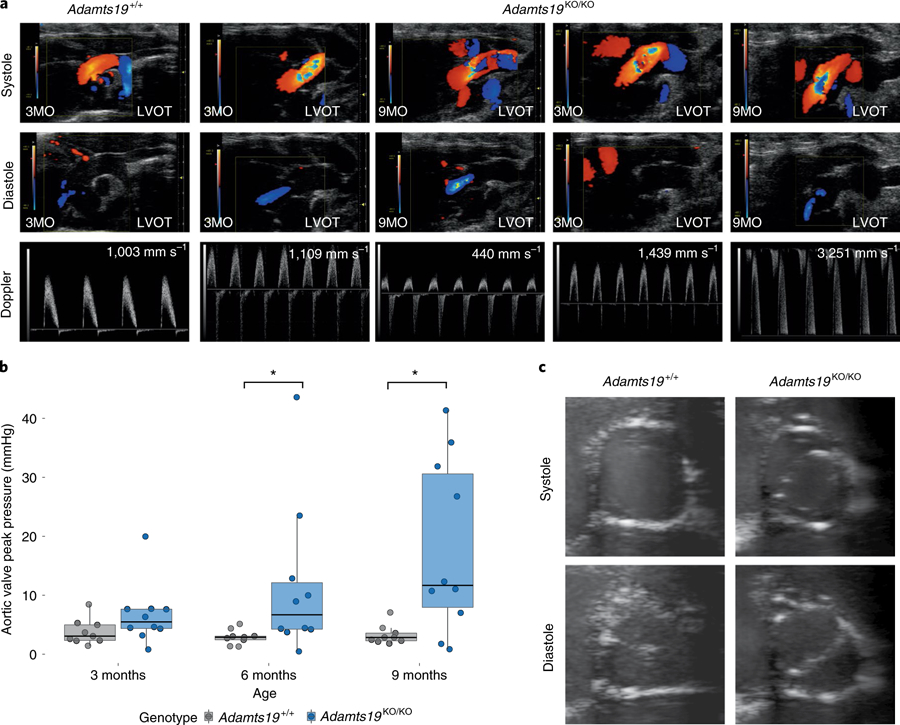
a, Representative modified ascending aortic view for one WT (Adamts19+/+, n = 9) and two homozygous Adamts19KO/KO mice. Aortic regurgitation in diastole was identified in 27% of Adamts19KO/KO mice. Color mode in systole shows abnormal blood flow and increased systolic aortic pressure in about 20% of Adamts19KO/KO mice. In total, 38% of mice were affected by some type aortic valve dysfunction (Supplementary Table 4). LVOT, left ventricular outflow tract. b, Aortic valve dysfunction is progressive in homozygous Adamts19KO/KO mice. Aortic peak pressures were significantly increased at 6 and 9 months in Adamts19KO/KO mice, while no increase in peak pressure was observed in Adamts19 WT mice (Adamts19+/+). The box plots show the interquartile range (IQR, 25th–75th percentile) with the 50th percentile as the solid line. Whiskers represent 1.5× IQR (n = 9 for WT, n = 10 for Adamts19KO/KO; the same mice were measured over time). c, Short axis view of aortic valves in B-mode. Adamts19+/+ valves show normal closing with three visible leaflets, whereas Adamts19KO/KO resemble a fused BAV in humans with only two leaflets visible and clear ‘fish mouth’ opening of the valve. Note that mice with this presentation have three formed leaflets and only functionally behave like BAV. Distribution of phenotypes across independent experiments is shown in Supplementary Table 4. LVOT, left ventricular outflow tract. *P < 0.05, two-sided Wilcoxon rank-sum test. P values: 6 months = 0.01721, 9 months = 0.03499.
Fig. 3 |. Aortic valves from Adamts19KO/KO mice are thickened and have disorganized ECM at 9 months.
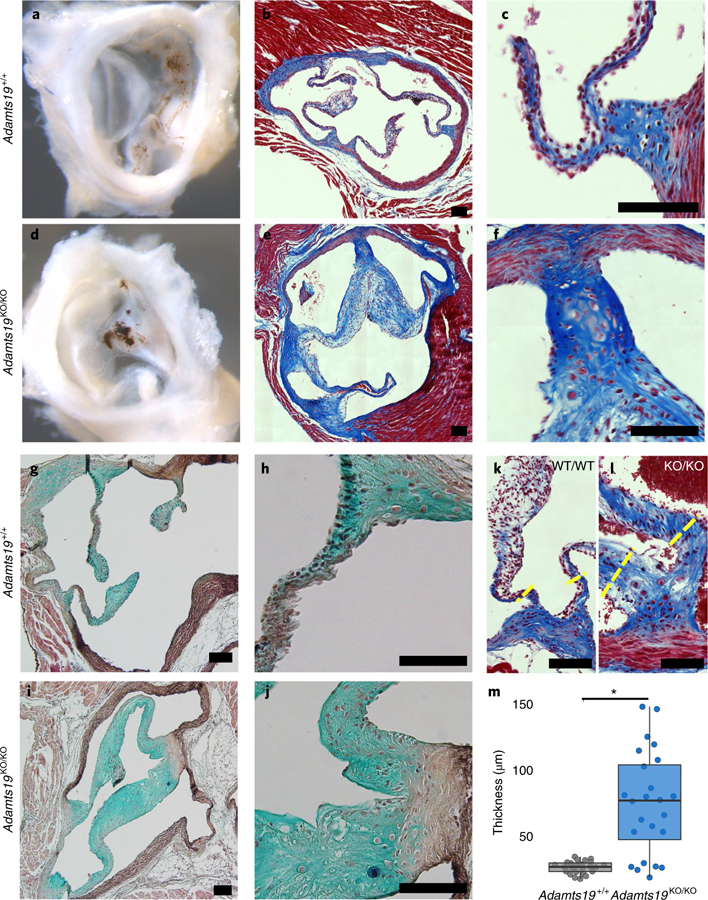
a,d, Whole mount of WT (Adamts19+/+) (a) and Adamts19KO/KO (d) aortic valve shows increased whitening of the valve tissue reflecting thickening at 9 months of age. b,c,e,f, Trichrome staining of aortic valve sections reveals substantial thickening of the valve leaflets of Adamts19KO/KO mice (e,f) compared to WT controls (b,c). g–j, Pentachrome staining shows disorganization of the ECM in Adamts19KO/KO mice (i,j) versus WT control (g,h). Staining was performed on four mice per genotype. k,l, Examples of hinge regions in the aortic valves of normal WT (k) and thickened, homozygous knockout (l) mice. The yellow dashed lines represent regions of quantification for thickness. Black scale bars, 100 µM. m, Quantification of valve thickness reveals significant enlargement of the hinges of aortic valve leaflets in knockout mice (n = 4 mice for each genotype; each mouse has 6 valve hinge measurements). The box plots show the IQR (25th–75th percentile) with the 50th percentile as a solid line. The whiskers represent 1.5× IQR. *P = 3.336 × 10⁻⁶, two-sided, Student’s t-test.
Fig. 4 |. Ultrastructural analysis of the ECM in WT and Adamts19KO/KO aortic valves.
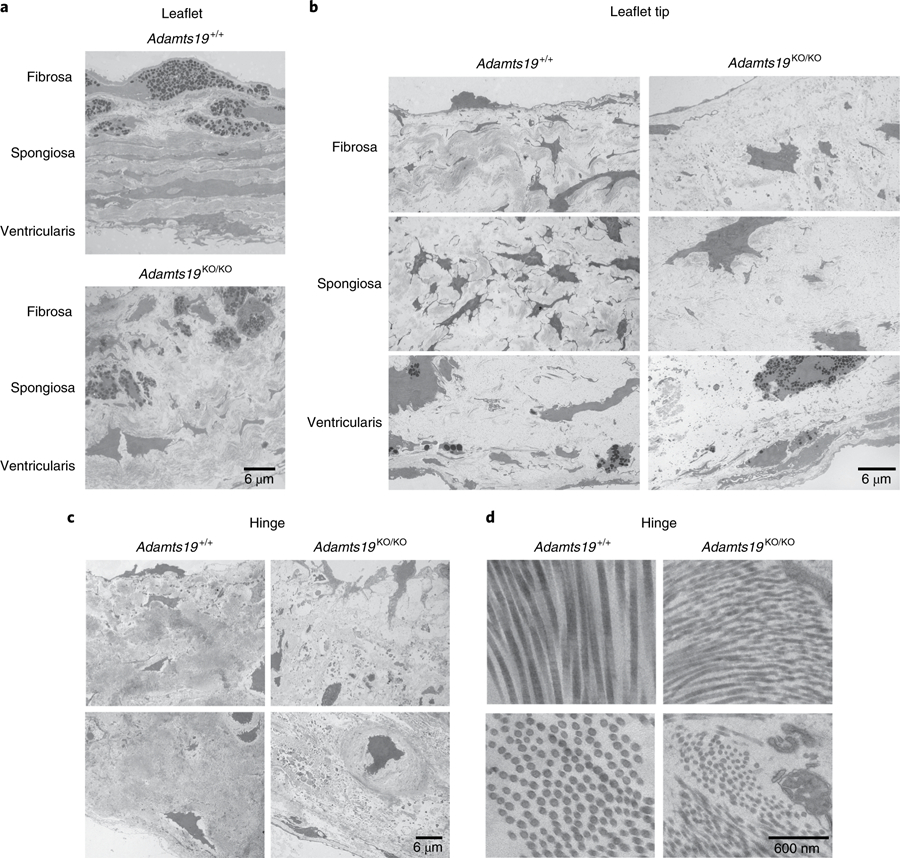
a, Comparison of the three-layered stratification in the free part of the valve leaflets of Adamts19+/+ (top) versus Adamts19KO/KO animals (bottom). A trilaminar stratification (fibrosa, spongiosa, ventricularis) can be made out, but mutant leaflets are thickened and do not have the highly organized ECM architecture of the individual layers as seen in WT. b, Comparison between WT (left) and knockout (right) aortic valves at the level of the leaflet tip. Mutants have higher proteoglycan content in all layers, more cells with activated nuclei and more secretory granules, typical of a secretory VIC phenotype. c, At the hinge area of WT valves (left), fibroblasts and chondrocyte-like cells are surrounded by abundant collagen type I fibers. In knockout valves (right), fibroblasts and chondrocytes are found, with accumulation of cellular debris, vesicular structures and disorganized proteoglycan structure. d, The hinge area of WT valves contains bundles of typical collagen type I fibers (left). In mutants (right), these fibers are thinner with a less homogenous diameter. Ultrastructural findings were reproduced for three independent, healthy Adamts19+/+ and three independent Adamts19KO/KOmice with HVD.
To assess potential roles in valve homeostasis and disease, we further characterized the spatiotemporal expression patterns of Adamts19 during valve development and maturation. In situ hybridization images from the public repository Eurexpress (www.eurexpress.org) suggested expression of Adamts19 RNA in the cardiac valve regions at embryonic day (E)14.5 (Supplementary Fig. 6)27. Expression analysis of lacZ in Adamts19 knockout mice revealed expression in the bones and cartilage regions around E10.5 (Supplementary Fig. 7a). Weak, diffuse lacZ staining was first observed in the heart around E12.5 in the atria, the trabeculated myocardium of the ventricles and the cardiac cushion regions (Supplementary Fig. 7b,c). Strong localized expression of lacZ in all four valves was visible around E14.5 and was detectable until adulthood (Fig. 5 and Supplementary Fig. 8). Notably, lacZ activity in the valves was specific to the VICs and was not detected in the endothelial monolayer. Since the specific transcriptomic signature of VIC populations is currently unknown, and to identify early differences between WT and homozygous Adamts19 knockout mice, we performed single-cell RNA sequencing (scRNA-seq) of E14.5 WT and Adamts19KO/KO hearts using the Drop-seq technique28. scRNA-seq identified the transcriptomic footprint of VICs compared to other cardiac cell types (Fig. 6a,b, Supplementary Table 6 and Supplementary Fig. 9) and revealed that known cell type marker genes were conserved between WT and Adamts19KO/KO cells (Supplementary Fig. 10). We further utilized the scRNA-seq data to confirm that no functional messenger RNA is present in Adamts19KO/KO cells and that Adamts19 and lacZ were specifically expressed in VICs, as well as trabecular and atrial cardiomyocytes (Fig. 6b and Supplementary Fig. 11).
Fig. 5 |. Adamts19 is expressed in all four cardiac valves during valve remodeling and elongation.
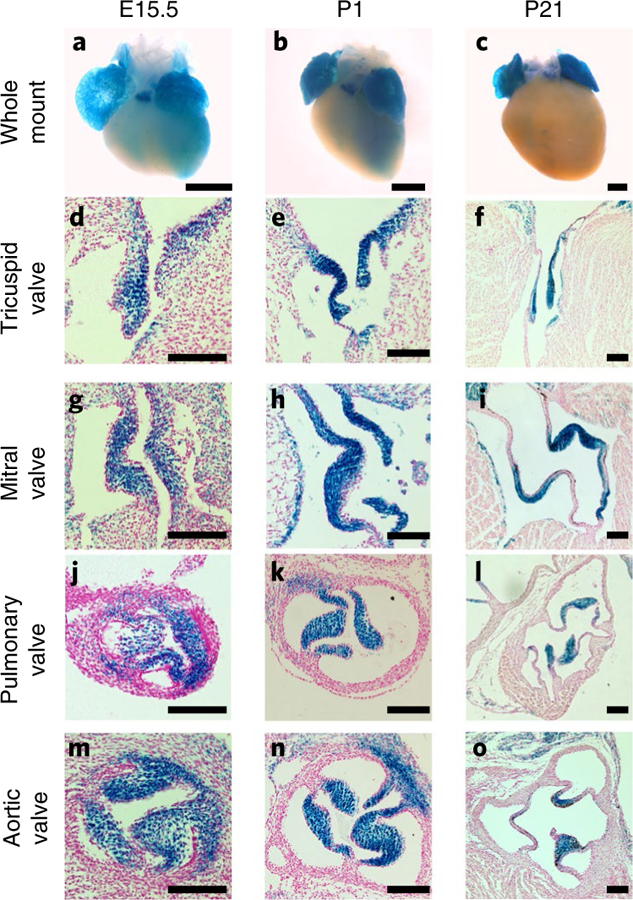
a–c, Whole-mount images of Adamts19KO/KO embryonic hearts show lacZ expression in both atria, the trabeculated myocardium as well as the pulmonary valve from E15.5 to P21. d–o, Histological sections from lacZ-stained hearts of Adamts19KO/KO animals corresponding to the stages shown in a–c. Localized lacZ expression in the interstitial cell layer of the valves is observed in the tricuspid (d–f), mitral (g–i), pulmonary (j–l) and aortic valve (m–o). Notably, the endothelial monolayer around the valve leaflets is lacZ-negative. Scale bars in whole-mount images, 500 µM. Scale bars in sections, 100 µM. LacZ staining was performed and the staining patterns consistently replicated in >10 independent mice.
Fig. 6 |. Single-cell sequencing of E14.5 mouse hearts.
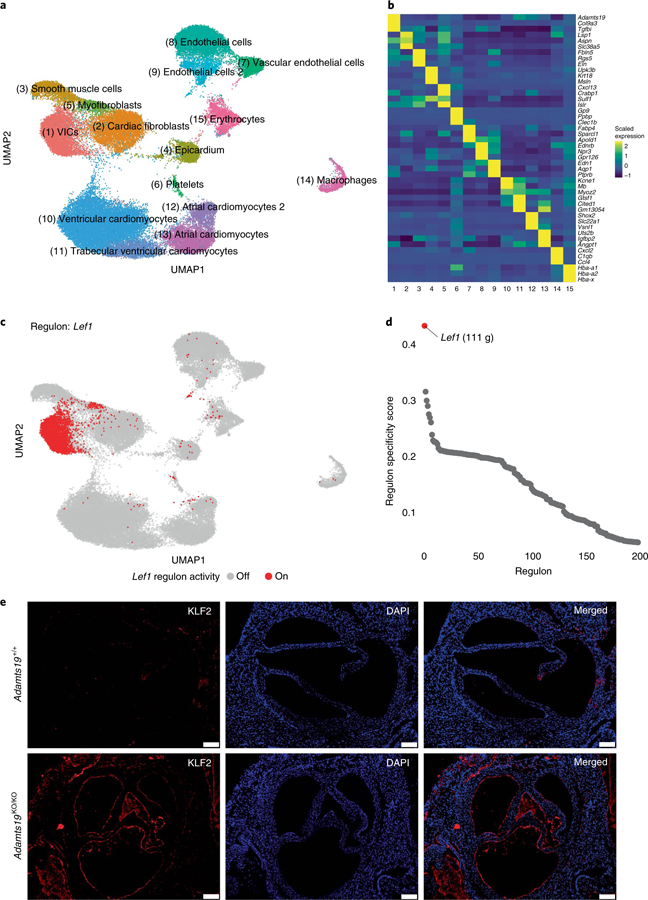
a, Joined UMAP-based clustering of a total of 55,152 single cells from Adamts19+/+ and Adamts19KO/KO mice. b, Z-scaled expression values for three marker genes for each respective cell cluster. Adamts19 strongly and specifically marks VICs. c, Binary regulon activity for the predicted Lef1 regulon, of which Adamts19 is part. d, Regulon specificity score distribution for the top 200 predicted regulons in VICs. Lef1 has the highest specificity score for VICs and represents the most distinct specific regulon for VICs compared to all other cell types (111 g = 111 genes predicted in the regulon). e, IHC for aortic valves of Adamts19+/+ and Adamts19KO/KO valves at 3 weeks show increased staining for KLF2 in sections from homozygous Adamts19 knockout mice. Scale bars, 100 μM. KLF2 staining was repeated for 11 independent mice per group; increased KLF2 was observed in 4 out of 11 (36%) Adamts19KO/KO mice.
We then performed gene regulatory network (GRN) analysis to characterize regulatory networks in VICs and identify potential upstream regulators of Adamts19 (ref. 29). GRN analysis of WT cells identified Adamts19 in a regulon with Axin2, mediated by Lef1, a Wnt/β-catenin transcriptional mediator, as the most discriminatory regulon of VICs at E14.5 (regulon specificity score = 0.44; Fig. 6c,d and Supplementary Table 7)30–32. Fluorescent RNA in situ hybridization for Adamts19 and Lef1 in WT hearts confirmed their coexpression in VICs at E12.5 and E14.5 (Supplementary Fig. 12). Public chromatin immunoprecipitation sequencing data of LEF1 and β-catenin in human embryonic stem cells shows strong induction of binding peaks at the ADAMTS19 and AXIN2 proximal promoters following treatment with Wnt3a, further reinforcing that ADAMTS19 is directly regulated by Lef1 and Wnt signaling (Supplementary Fig. 13a, chromatin immunoprecipitation sequencing data from GSE64758 (ref. 33)). To further confirm that ADAMTS19 is downstream of Wnt signaling in VICs, we stimulated in vitro differentiated human VICs using Wnta3 and R-spondin-3 and measured Axin2 and Adamts19 expression using quantitative PCR (qPCR). Both genes showed strong induction of gene expression following Wnt stimulation, confirming ADAMTS19 Wnt responsiveness in vitro (Supplementary Fig. 13b). Knockout mice for Axin2, a negative regulator of the Wnt signaling pathway, develop fibrotic, myxomatous mitral valve disease, reminiscent of the observed aortic phenotype in homozygous Adamts19KO/KO mice. These data suggests that the Lef1 regulon contains genes critical for VIC function, such as Adamts19 and Axin2, and that perturbation of this regulon can result in valve maturation defects and valve disease early in life.
Finally, we compared expression between WT and Adamts19KO/KO cells (Supplementary Fig. 14 and Supplementary Table 8). Interestingly, we identified increased expression of the hemodynamic sensor Klf2 and a stress-related gene signature in endothelial knockout cells, a finding validated by IHC in 3-week-old mice, suggesting increased shear stress in the endothelial layer of Adamts19KO/KO valves34–36 (Fig. 6e). IHC on WT and Adamts19 knockout aortic valves from 3-week-old mice validated this finding, with significantly higher Klf2 expression in the endothelial cells of 4 out of 11 (36%) Adamts19KO/KO mice investigated, close to our observed penetrance for HVD based on echocardiography data at 3 months (38%). Surprisingly, none of the mice with increased Klf2 expression had valve dysfunction in echocardiography before being killed, suggesting that the molecular signals precede the physiological manifestation of disease.
In summary, we demonstrate compelling evidence suggesting that homozygous LOF of ADMATS19 causes nonsyndromic, progressive HVD in humans and mice. The spatiotemporal expression pattern of Adamts19 in the mouse, the Adamts19 mouse knockout model and our scRNA-seq data suggest a crucial feedback from VICs to endothelial mechanosensing under the control of Wnt signaling, consistent with prior work in the field37. Based on our findings, we hypothesize that loss of Adamts19 perturbs shear stress signaling in the endothelial cells of the aortic valve, inducing over-expression of the transcription factor Klf2. Over time, defects in this mechanotransduction pathway lead to increased cellularity and proteoglycan deposition in the valves, ECM disorganization and HVD. Our data provide further incentive to examine the specific role of ADAMTS19 in VICs in maintaining ECM integrity and correct balance of mesenchymal-to-endothelial signaling both as pathogenic origins and potential therapeutic targets in HVD.
Methods
Clinical evaluation of study participants.
Written informed consent was obtained from all participating individuals or from parents for children not of age at the time of the study. Family 1 was identified and followed at the CHU Sainte-Justine hospital in Montreal. Family 2 was identified and followed at the Hadassah Hebrew University Medical Center in Jerusalem. Additional information on patient phenotypes can be found in the Supplementary Note.
Exome sequencing and human genetic analysis.
Family 1 was initially identified as part of a SNP-chip genotyping study at the CHU Sainte-Justine (Mother and Child University Hospital Centre) and is of African ancestry. The two affected individuals of family 1 (II-2 and II-5) were exome-sequenced using 100-base pair (bp) paired-end sequencing on an Illumina HiSeq 2500 system using the SureSelect Human All Exon V5 Capture Kit (Agilent Technologies) at the CHU Sainte-Justine Research Centre sequencing platform. FASTQ files were aligned using the Burrows–Wheeler Aligner v.0.7.17 (ref. 38) and processed using the Genome Analysis Toolkit (GATK) v.3.2 according to the GATK best practices for exomes39–41. Variants were called using HaplotypeCaller on individual BAM files and joint-genotyped with 28 other samples that were sequenced using the same library preparation kit. Variants from joint genotyping were annotated using the GEMINI framework v.0.20.1 (ref. 42). Coverage of exons around and inside the deleted region (ISOC1-ADAMTS19) in family 1 and 28 control exomes that did not have the deletion was calculated using GATK’s DepthOfCoverage. Read coverage over the deleted region was plotted in R. Exon sequences from the DNA samples of patients in family 2 were enriched with the SureSelect Human All Exon 50 Mb V5 Capture Kit. Sequences (125 bp paired-end) were generated on an Illumina HiSeq 2500 system. Read alignment and variant calling were performed with DNAnexus using default parameters with the human genome assembly hg19 (GRCh37) as reference. Parental consent was given for genetic studies for family 2. The study was performed with the approval of the ethical committees of the CHU Sainte-Justine University Hospital Centre and the Hadassah Medical Center and the Israeli Ministry of Health. Linkage analysis was performed using the pedigree structures from both families (Fig. 1) assuming ADAMTS19 as the causal locus, using a recessive model with 100% penetrance in the homozygous state and 0% penetrance in the heterozygous state, with an allele frequency of 1 × 10⁻⁶ using the Superlink-Online v.1.1 SNP tool43.
Mouse strains and experiments.
All animal procedures were performed according to the guidelines of the Canadian Council for Animal Care and animal protocols were approved by the ethical committee of the CHU Sainte-Justine Research Centre. Adamts19tm4a(EUCOMM)Wtsi (further referred to as Adamts19tm4a mice) were created at the Wellcome Sanger Institute and are available via the International Mouse Phenotyping Consortium (IMPC) program. High-throughput phenotyping results for Adamts19tm4a are available online on the IMPC webpage under accession number MGI:2442875. To ensure that Adamts19tm4a mice were reflective of a fully functional knockout, Adamts19tm4b mice were established by crossing Adamts19tm4a mice with CMV-cre-expressing mice (stock no. 006054; The Jackson Laboratory). This resulted in recombination of the loxP sites 3′ to the lacZ cassette and subsequent deletion of the neo selection cassette as well as exon 3 of Adamts19 (Supplementary Fig. 2). Adamts19tm4b mice were backcrossed with WT C57BL/6N mice (The Jackson Laboratory) for 1 generation to lose the CMV-cre allele. Mendelian ratios for homozygous offspring were similar in Adamts19tm4a and Adamts19tm4b mice without significant prenatal lethality (Supplementary Table 3). Phenotypes observed in Adamts19tm4a and Adamts19tm4b mice were similar in distribution and presentation; thus, Adamts19tm4a and Adamts19tm4b mice are collectively referred to as Adamts19KO/KO throughout this manuscript. Both, Adamts19tm4a and Adamts19tm4b were kept on a C57BL/6N background for maintenance.
Genotyping strategies for Adamts19KO (tm4a and tm4b) mice.
Genotyping of Adamts19tm4a and Adamts19tm4b mice was performed with distinctive primers for each allele (Supplementary Fig. 2 and Supplementary Table 9): to detect the WT allele, WT_F+WT_R; to detect the tm4a allele, tm4a_F+WT-R; and to detect the tm4b allele, tm4b_F+tm4b_R. Detection of CMV-cre allele was performed using Cre_F+Cre_R primers as described on The Jackson Laboratory datasheet for generic Cre detection. EasyTaq (catalog no. AP111–02; TransGen Biotech) was used for PCR amplification using the following cycling for all conditions: 94 °C for 5 min, 35 °C cycles of 94 °C for 30 s, 60 °C for 30 s, 72 °C for 1 min followed by a final step of 72 °C for 5 min.
LacZ staining of Adamts19KO mouse tissue.
Staining for β-galactosidase was performed as described previously44. Briefly, mouse hearts were washed twice with ice-cold PBS at 4 °C for 5 min before fixation using 4% paraformaldehyde (PFA) at 4 °C for different times depending on the developmental stage of the animal (E14.5: 10 min; postnatal day (P)1: 30 min; P21: 1 h; adult: 1 h). Hearts were then washed 3 times for 10 min with PBS to get rid of residual PFA. Hearts were then rinsed at 37 °C using rinse buffer (100 mM sodium phosphate, pH 7.3, 2 mM MgCl2, 0.01% sodium deoxycholate, 0.02% NP-40) and subsequently stained using lacZ staining solution (5 mM K3[Fe(CN)6], 5 mM K4[Fe(CN)6]·3H2O, 1 mg ml−1 X-Gal solution dissolved in dimethylformamide) at 37 °C overnight with horizontal rotation. After staining, hearts were washed at 37 °C for 15 min with PBS, then washed 3 times for 10 min each at 4 °C with PBS. Tissues were then postfixed in 4% PFA overnight at 4 °C. After a second round of fixation, hearts were dehydrated to 70% ethanol and imaged using an M165 FC Stereo Microscope (Leica Microsystems) for whole-mount images. After whole-mount imaging, hearts were paraffin-embedded for histological sectioning. For paraffin embedding, tissues were dehydrated through an increasing ethanol gradient followed by xylene treatment as per standard histological protocols. Serial paraffin sections were prepared from fixed, dehydrated hearts at 6–10 µM thickness and floated on a water bath before mounting on glass slides. Dried sections were rehydrated through an ethanol gradient at decreasing concentrations and subsequently counterstained with Nuclear Fast Red. Masson’s trichrome and pentachrome stains were performed according to standard clinical pathology protocols. Images of lacZ and trichrome sections were taken with either a DM6 microscope (Leica Microsystems) and processed using the LAS X imaging software v.3.3.0.16799 or using an AxioScan.Z1 automated slide scanner (ZEISS) and analyzed using the ZEN imaging software v.1.0.
IHC of mouse heart valves.
Whole hearts from Adamts19+/+ and Adamts19KO/KO mice were collected and fixed overnight in 4% PFA before paraffin embedding and sectioning at 7 µm thickness. Before staining, paraffin was removed in xylene; then, tissue sections were rehydrated through a graded ethanol series and rinsed in 1× PBS as described previously45. Movat’s pentachrome staining was performed on paraffin tissue sections according to the manufacturer’s instructions (Russell-Movat; catalog no. KTRMP; American MasterTech), then mounted using VectaMount Permanent Mounting Medium (catalog no. H-5000; Vector Laboratories). For immunofluorescence staining, paraffin-embedded tissue sections were subjected to antigen retrieval by boiling for 10 min in antigen unmasking solution (catalog no. H-3300; Vector Laboratories) and subsequently blocked for 1 h at room temperature in blocking buffer (1% BSA, 1% cold water fish skin gelatin, 0.1% Tween 20/PBS) as described previously46. Tissue sections were then incubated overnight at 4 °C or 1 h at room temperature with dilutions of the primary antibodies in 1:1 PBS:blocking buffer (Supplementary Table 10). For immunofluorescence primary antibody detection, sections were incubated for 1 h at room temperature with anti-rabbit, anti-mouse or anti-goat Alexa Fluor immunoglobulin G secondary antibodies (Thermo Fisher Scientific) at a 1:400 dilution in PBS, then mounted in VECTASHIELD Antifade Mounting Medium with DAPI (catalog no. H-1200; Vector Laboratories) to detect cell nuclei. Images were visualized using an Olympus BX51 microscope and captured using an Olympus DP71 camera and cellSens software (OLYMPUS cellSens Dimension v.1.15). Image brightness and contrast were edited using Adobe Photoshop CC (Photoshop C5 for Macintosh).
RNA in situ hybridization using RNAscope.
Preparation of samples and pretreatment were made according to the instructions in the RNAscope Multiplex Fluorescent Reagent Kit v2 user manual (document no. 323100-USM; https://acdbio.com/documents/product-documents). The hearts of E12.5 and 14.5 mouse embryos were collected and fixed for 24 h at room temperature in 10% neutral buffered formalin and embedded in paraffin. Paraffin sections of 5 µm thickness were heated for 1 h at 60 °C. Paraffin was removed from the slides using xylene and slides were subsequently dried in 100% ethanol. After incubation with hydrogen peroxide for 10 min at room temperature, a manual target retrieval (Appendix B of the protocol) was performed for 15 min. RNAscope Protease Plus was added for 30 min at 40 °C in the HybEZ Humidifying System Oven (Advanced Cell Diagnostics). Slides were washed in room temperature water between each step. The probes were heated at 40 °C for 10 min and subsequently cooled down to room temperature. One volume of probe-C4 (ADAMTS19 probe) was added to 50 volumes of C1 (LEF1 probe). The probes were incubated for 2 h at 40 °C. After 1 wash in 1× wash buffer, slides were stored in 5× saline sodium citrate buffer. All ensuing incubations were made at 40 °C in the HybEZ oven; RNAscope wash buffer was used between each step. Incubation for AMP1 and AMP2 was 30 min, followed by AMP3 for 15 min. The horseradish peroxidase (HRP)-C1 and HRP-C4 signals were developed by using the RNAscope Multiplex FL V2 HRP-C1 or C4 reagent for 15 min followed by incubation with an opal dye (Opal 570, Opal 620 or Opal 690; PerkinElmer). The HRP signal was blocked by adding the RNAscope Multiplex FL V2 blocker for 15 min. After washing, slides were counterstain with DAPI for 30 s at room temperature and immediately mounted with ProLong Gold Antifade Mountant (Thermo Fisher Scientific). Fluorescence was observed during the week with a DMi8 microscope (Leica Microsystems). Deconvolution of the images was performed using Huygens Professional v.19.04.
Echocardiography imaging of mice.
Echocardiographic imaging of mice was performed using a VEVO 3100 Imaging System (FUJIFILM VisualSonics) with an MS550S, 32 MHz probe. Animals were kept anesthetized during imaging using 2% isoflurane mixed with oxygen; heart rate was kept between 375 and 475 b.p.m. Valve function was assessed throughout adulthood at different time points (3 months, 6 months, 9 months) for WT (Adamts19+/+) (n = 9) and homozygous Adamts19KO/KO mice (n = 10). Left ventricular blood flow through the aortic valve was visualized via color Doppler using a modified ascending aortic view, which enables imaging of the left ventricular cavity, the aortic root, sinus and ascending aorta. Color Doppler was subsequently used to detect the presence or absence of aortic regurgitation in diastole and position the gate for the pulsed wave Doppler to measure aortic valve velocities. All angles were kept below 60° for pulsed wave Doppler measurements of aortic outflow. Echocardiography data were analyzed with the Vevo LAB software v2.2.0 (FUJIFILM VisualSonics). Aortic valve peak velocities were measured from three consecutive waves and the aortic valve peak pressure gradient was calculated using the following formula inside Vevo LAB: .
Electron microscopy analysis of aortic mouse valves.
Transmission electron microscopy of mouse valve tissue was performed as described previously47. Briefly, valves were dissected in cold PBS and fixed using a 2% PFA/1% glutaraldehyde mixture in 0.1 M, pH 7.2, sodium cacodylate buffer. Postfixation was performed in 1% OsO4 in the same buffer. Samples were dehydrated in series of acetone and embedded in epoxy resin; 1.5 μm sections were used to identify the valve and its orientation before cutting thin sections and placing them on hexagonal 150-mesh copper grids. For counterstaining, water solutions of 1% tannic acid followed by uranyl acetate and lead salts were used (all reagents, Electron Microscopy Sciences). Sections were examined under a H7600 TEM (Hitachi) at an accelerating voltage of 80 kV. Images were acquired with an Advanced Microscopy Techniques digital camera.
Differentiation of VICs and Wnt stimulation.
Undifferentiated pluripotent stem cells were first differentiated into mesoderm posterior 1 (Mesp1)+ cardiovascular progenitors using CHIR99021 (Stem Cell Technologies; 5 mM) or Wnt3a (Peprotech; 100 ng ml−1) for 1 d, CHIR99021 or Wnt3a (100 ng ml−1) and BMP2 (Thermo Fisher; 10 ng ml−1) for the second day and then BMP2+ IWR-1 (Sigma Aldrich; 10 mgM). Cells were then sorted using the BMP2-induced stage-specific embryonic antigen 1 cell membrane antigen (STEMCELL Technologies) and plated on mouse embryonic fibroblasts in fibronectin-coated plates. To segregate myocardial and endocardial cell lineages from the Mesp1+ cell population, cells were treated with vascular endothelial growth factor (30 ng ml−1), an inducer of endothelial cell fate and fibroblast growth factor 8 (10 ng ml−1) for 6 d. Cells were then sorted with anti-CD31 magnetic beads (catalog no.130–091-935; Miltenyi Biotec) and plated in endothelial cell growth medium. Endothelial-to-mesenchymal transition was induced by 100 ng ml−1 BMP2 for 2 d to obtain VICs48. VICs were then treated in Roswell Park Memorial Institute medium added with nonessential amino acids and 1% BSA with Wnt3a (100 ng ml−1) and R-spondin-3 (20 ng ml−1) for 48 h. RNA was extracted, reverse-transcribed and used in real-time PCR (LightCycler v.1.5; Roche Molecular Systems) with specific AXIN2 (hAXIN2-F+hAXIN2-R) and ADAMTS19 primers (hADAMTS19-F+hADAMTS19-R) and normalized to glyceraldehyde 3-phosphate dehydrogenase expression.
Single-cell RNA-seq.
To retrieve E14.5 hearts, embryos were removed from the uterus and yolk sac. The chest cavities of embryos were carefully opened using micro tweezers to expose the heart. The heart and lungs were removed by firmly grabbing the lungs at the base and pulling upward. The lungs were dissected from the heart, and the aorta and pulmonary artery were removed just above the pulmonary and aortic valve. Caution was taken to preserve all four valves in the embryonic heart. The whole dissected heart was put through dissociation and Drop-seq single-cell capture. Hearts were dissociated using the Neonatal Heart Dissociation Kit (catalog no. 130–098-373; Miltenyi Biotec) in C-tubes son an OctoMACS dissociator (Miltenyi Biotec) with heating. Cell dissociation was performed according to the manufacturer’s protocol. DMEM high-glucose medium (catalog no. 31053028; Thermo Scientific Fisher) supplied with 10% FBS was used for the resuspension of cells after dissociation. Cells were washed and red blood cell lysis was performed according to the neonatal Neonatal Heart Dissociation Kit protocol. Single cells from dissociated hearts were captured in nanoliter droplets using a custom Drop-seq setup in the Andelfinger laboratory according to the standard Drop-seq protocol (http://mccarrolllab.com/dropseq/)28. Our Drop-seq setup closely follows the procedure described in the original paper with some minor modifications. Medfusion 3500 syringe pumps (Smiths Medical) instead of KD Scientific Legato 100 pumps as well as a different RNase inhibitor (SUPERase• In; catalog no. AM2694; Thermo Fisher Scientific) were used. Single-cell suspensions were run alongside barcoded beads (cell concentration between 120 and 150 cells µl−1; bead concentration 140 beads µl−1) (ChemGenes) to capture single-cell RNA on the barcoded beads. The cell lysis solution for the beads was supplemented with 50 µl ml−1 of RNAse inhibitor. Beads attached to single-cell trancriptomes were subsequently washed, reverse-transcribed, treated with exonuclease and counted using a Fuchs-Rosenthal hemocytometer (INCYTO C-Chip Cat-Nr:82030–474), as described in the original Drop-seq protocol. Counting of beads was performed using a 1:1 ratio of beads in water and bead counting solution (10% polyethylene glycol, 2.5 M NaCl, as described in Gierahn et al.49). For PCR amplification of single-cell transcriptomes, 4,000 beads (approximately 200 single-cell transcriptomes attached to microparticles) were used as input for each PCR. Individual PCR reactions were subsequently pooled for the desired final number of single-cell transcriptomes attached to microparticles to sequence and cleaned up using AMPure XP (Beckmann Coulter Life Sciences) beads at 0.6× concentrations twice. Correct size distribution and concentration of complementary DNA was determined using a Bioanalyzer High Sensitivity DNA assay (catalog no. 5067–4626; Agilent Technologies). Library preparation was performed using the Nextera XT DNA Library Preparation Kit (Illumina) with 600 pg input according to the Drop-seq protocol using Illumina i7 primers (N701—N706) together with a custom P5 primer in the library PCR amplification (see the Drop-seq protocol). Libraries were quality-controlled for size and concentration using the Bioanalyzer High Sensitivity DNA assay. Libraries were quantified using the Universal Library Quantification Kit (KAPA) before sequencing on a NextSeq 500 system (Illumina) at the Institute for Research in Immunology and Cancer (IRIC) in Montreal. Sequencing was performed on a NextSeq 500 system with the read settings R1 = 20 bp, R2 = 63 bp and index = 8 bp.
Computational analysis of single-cell transcriptomic data.
Illumina sequencing data was demultiplexed using bcl2fastq v.2.17. Raw FASTQ files were quality-controlled and processed according to the Drop-seq computational pipeline (Drop-seq alignment cookbook v.1.2, January 2016) using Drop-seq tools v.1.12 to produce digital expression matrices for each sample28. Alignment was performed using STAR v.2.5.3a against the mouse reference genome (mm10) with the sequence of the inserted cassette of Adamts19tm4a mice added50. Downstream quality filtering of cells, clustering and marker analysis were performed using Seurat v.2.3.4 in R51. Cells with >15,000 unique molecular identifiers (UMIs), >3,500 genes, <250 genes and >10% mitochondrial genes were filtered out to remove potential cell doublets, and dying, apoptotic or low-quality cells (Supplementary Fig. 9). Genes that were not expressed with at least one UMI in five cells were further excluded from analysis. After filtering, expression was normalized by log transformation and scaled to 10,000 transcripts using Seurat’s normalize and scale functions as described in Macosko et al.28. Regression during z-score scaling of normalized expression values was performed for the number of UMIs, the percentage of mitochondrial genes and cell cycle scores as described in the Seurat vignette (http://satijalab.org/seurat/cell_cycle_vignette.html). Variable genes between cells were identified using the gene expression mean (ExpMean) and LogVMR as the dispersion function in Seurat’s FindVariableGenes function. The principal components were calculated in Seurat. To cluster similar cell types from WT and Adamts19KO/KOhearts across genotype, we utilized the Harmony package v.0.0.0.9000 with the cell genotype for Adamts19 (+/+ or KO/KO) as the grouping variable (www.github.com/immunogenomics/harmony)52. Harmony was run with theta = 2, nclust = 50 and max.iter.cluster = 100. Cells were subsequently clustered and visualized in reduced dimensional space with the Uniform Manifold Approximation and Projection (UMAP) using the first 20 dimensions from the harmony analysis53,54. Cell clusters were determined using the Seurat’s FindClusters function with 20 harmony dimensions and subsequently refined and merged based on manual inspection of marker genes. We performed differential gene expression analysis for each cell type between WT and Adamts19KO/KO cells using a Wilcoxon test, excluding lowly expressed genes (expressed in <10% of cells in either genotype) and filtering out genes with a log fold change of <0.1.
GRN analysis from scRNA-seq.
The normalized expression values for WT and KO cells from Seurat were used separately as input for GRNBoost2 in Python to construct coexpression networks based on expression data55. GRNBoost2 output was further used with the R implementation of SCENIC v.1.0.1–01 to create GRNs from coexpression profiles29. We used the following databases in the SCENIC pipeline to analyze transcription factor binding motifs in promoter regions: mm9-tss-centered-10kb-7species-mc9nr and mm9–500bp-upstream-7species.mc9nr. Regulons were then scored using AUCell in SCENIC for all cells in the dataset. To identify VIC-specific regulons, we calculated regulon specificity scores for VICs based on GRNs from Adamts19 WT cells using Jensen–Shannon divergence as described by Suo et al.56. We then ranked all identified regulons for VICs based on their regulon specificity score. Binary regulon activity (0 or 1) for the top-ranked VIC regulon Lef1 was plotted on top of the UMAP positions.
Statistics and reproducibility.
All statistical analysis were performed using R v.3.4.2/v.3.6 or within Rstudio v.1.1/1.2.1135. For single-cell analysis, Wilcoxon tests integrated into the FindMarkers function from the Seurat package in R were applied. P values for t-tests, Wilcoxon rank-sum tests and adjusted P values for scRNA-seq analysis <0.05 were considered as statistically significant. Exact tests and P values are reported in the respective figures.
Reporting Summary.
Further information on research design is available in the Nature Research Reporting Summary linked to this article.
Supplementary Material
Acknowledgements
We thank the families who participated in this study for their contribution to this project. A grant-in-aid from the Heart and Stroke Foundation of Canada (no. G-17–0019170) as well as the Leducq Foundation (no. MIBAVA-Leducq 12CVD03) supported this study. Additional funding was provided by Banque Nationale through a Research Excellence Chair in Cardiovascular Genetics to G.A. G.A. was supported by a Senior Research Scholarship from Fonds de Recherche Santé Québec (no. 27335). The authors thank the University of Washington Center for Mendelian Genomics and all contributors to Geno2MP for use of the data included in Geno2MP. The authors thank the gnomAD and the groups who provided exome and genome variant data to this resource. A full list of contributing groups can be found at http://gnomad.broadinstitute.org. We thank the Wellcome Sanger Institute Mouse Genetics Project and its funders for providing the mutant mouse line (Adamts19tm4a(EUCOMM)Wtsi). Funding information may be found at the Mouse Resource Portal (www.sanger.ac.uk/mouseportal); associated primary phenotypic information can be obtained from the IMPC (www.mousephenotype.org). We thank J. Huber at the IRIC genomic platform for performing the Illumina sequencing for the Drop-seq libraries and P. Gendron at the IRIC Bioinformatics platform for data demultiplexing. We also thank M. Bertagnolli and A.M. Nuyt for help with and providing equipment for mouse echocardiography. We thank S. L’Espérance, K. Jolibois-Ouellete and D. Deraspe for help in maintaining the mouse colonies. Funding was also provided by the Wellcome Sanger Institute (grant no. WT098051). Additional support was provided by the German Centre for Cardiovascular Research (DZHK), partner sites Berlin and Kiel, and the Competence Network for Congenital Heart Defects and National Register for Congenital Heart Defects: sample collection, sample management and patient follow-up were supported by the Competence Network for Congenital Heart Defects and the National Register for Congenital Heart Defects, which are financially supported by the DZHK. Work in the lab of M.P.H. was financially supported by the DZHK partner side Kiel. This work was further supported by a grant of the German Research Council (Deutsche Forschungsgemeinschaft) no. DFG-HI 1579/2–1 to M.P.H. This research was enabled in part by support provided by Calcul Quebec (https://www.calculquebec.ca/en/) and Compute Canada (www.computecanada.ca).
Footnotes
Online content
Any methods, additional references, Nature Research reporting summaries, source data, extended data, supplementary information, acknowledgements, peer review information, details of author contributions and competing interests, and statements of code and data availability are available at https://doi.org/10.1038/s41588-019-0536-2.
Publisher’s note Springer Nature remains neutral with regard to jurisdictional claims in published maps and institutional affiliations.
Data availability
The data discussed in this publication have been deposited with the NCBI’s Gene Expression Omnibus57 and are accessible through accession number GSE109247. Whole-exome sequencing data are not publicly available due to consent restrictions.
Competing interests
The authors declare no competing interests.
Additional information
Supplementary information is available for this paper at https://doi.org/10.1038/s41588-019-0536-2.
References
- 1.Nkomo VT et al. Burden of valvular heart diseases: a population-based study. Lancet 368, 1005–1011 (2006). [DOI] [PubMed] [Google Scholar]
- 2.Garg V et al. Mutations in NOTCH1 cause aortic valve disease. Nature 437, 270–274 (2005). [DOI] [PubMed] [Google Scholar]
- 3.Padang R, Bagnall RD, Richmond DR, Bannon PG & Semsarian C Rare non-synonymous variations in the transcriptional activation domains of GATA5 in bicuspid aortic valve disease. J. Mol. Cell. Cardiol 53, 277–281 (2012). [DOI] [PubMed] [Google Scholar]
- 4.Tan HL et al. Nonsynonymous variants in the SMAD6 gene predispose to congenital cardiovascular malformation. Hum. Mutat 33, 720–727 (2012). [DOI] [PMC free article] [PubMed] [Google Scholar]
- 5.Durst R et al. Mutations in DCHS1 cause mitral valve prolapse. Nature 525, 109–113 (2015). [DOI] [PMC free article] [PubMed] [Google Scholar]
- 6.Gould RA et al. ROBO4 variants predispose individuals to bicuspid aortic valve and thoracic aortic aneurysm. Nat. Genet 51, 42–50 (2019). [DOI] [PMC free article] [PubMed] [Google Scholar]
- 7.Ta-Shma A et al. Congenital valvular defects associated with deleterious mutations in the PLD1 gene. J. Med. Genet 54, 278–286 (2017). [DOI] [PubMed] [Google Scholar]
- 8.Dietz HC et al. Marfan syndrome caused by a recurrent de novo missense mutation in the fibrillin gene. Nature 352, 337–339 (1991). [DOI] [PubMed] [Google Scholar]
- 9.Loeys BL et al. A syndrome of altered cardiovascular, craniofacial, neurocognitive and skeletal development caused by mutations in TGFBR1 or TGFBR2. Nat. Genet 37, 275–281 (2005). [DOI] [PubMed] [Google Scholar]
- 10.Sznajer Y et al. The spectrum of cardiac anomalies in Noonan syndrome as a result of mutations in the PTPN11 Gene. Pediatrics 119, e1325–e1331 (2007). [DOI] [PubMed] [Google Scholar]
- 11.LaHaye S, Lincoln J & Garg V Genetics of valvular heart disease. Curr. Cardiol. Rep 16, 487 (2014). [DOI] [PMC free article] [PubMed] [Google Scholar]
- 12.Hitz M-P et al. Rare copy number variants contribute to congenital left-sided heart disease. PLoS Genet 8, e1002903 (2012). [DOI] [PMC free article] [PubMed] [Google Scholar]
- 13.Lek M et al. Analysis of protein-coding genetic variation in 60,706 humans. Nature 536, 285–291 (2016). [DOI] [PMC free article] [PubMed] [Google Scholar]
- 14.Colige A et al. Human Ehlers–Danlos syndrome type VII C and bovine dermatosparaxis are caused by mutations in the procollagen I N-proteinase gene. Am. J. Hum. Genet 65, 308–317 (1999). [DOI] [PMC free article] [PubMed] [Google Scholar]
- 15.Le Goff C et al. Regulation of procollagen amino-propeptide processing during mouse embryogenesis by specialization of homologous ADAMTS proteases: insights on collagen biosynthesis and dermatosparaxis. Development 133, 1587–1596 (2006). [DOI] [PubMed] [Google Scholar]
- 16.Levy GG et al. Mutations in a member of the ADAMTS gene family cause thrombotic thrombocytopenic purpura. Nature 413, 488–494 (2001). [DOI] [PubMed] [Google Scholar]
- 17.Morales J et al. Homozygous mutations in ADAMTS10 and ADAMTS17 cause lenticular myopia, ectopia lentis, glaucoma, spherophakia, and short stature. Am. J. Hum. Genet 85, 558–568 (2009). [DOI] [PMC free article] [PubMed] [Google Scholar]
- 18.Aldahmesh MA et al. The syndrome of microcornea, myopic chorioretinal atrophy, and telecanthus (MMCAT) is caused by mutations in ADAMTS18. Hum. Mutat 34, 1195–1199 (2013). [DOI] [PubMed] [Google Scholar]
- 19.White JK et al. Genome-wide generation and systematic phenotyping of knockout mice reveals new roles for many genes. Cell 154, 452–464 (2013). [DOI] [PMC free article] [PubMed] [Google Scholar]
- 20.Ryder E et al. Molecular characterization of mutant mouse strains generated from the EUCOMM/KOMP-CSD ES cell resource. Mamm. Genome 24, 286–294 (2013). [DOI] [PMC free article] [PubMed] [Google Scholar]
- 21.Skarnes WC et al. A conditional knockout resource for the genome-wide study of mouse gene function. Nature 474, 337–344 (2011). [DOI] [PMC free article] [PubMed] [Google Scholar]
- 22.Bradley A et al. The mammalian gene function resource: the International Knockout Mouse Consortium. Mamm. Genome 23, 580–586 (2012). [DOI] [PMC free article] [PubMed] [Google Scholar]
- 23.Hinton RB Jr et al. Mouse heart valve structure and function: echocardiographic and morphometric analyses from the fetus through the aged adult. Am. J. Physiol. Heart Circ. Physiol 294, H2480–H2488 (2008). [DOI] [PubMed] [Google Scholar]
- 24.Siu SC & Silversides CK Bicuspid aortic valve disease. J. Am. Coll. Cardiol 55, 2789–2800 (2010). [DOI] [PubMed] [Google Scholar]
- 25.Biben C et al. Cardiac septal and valvular dysmorphogenesis in mice heterozygous for mutations in the homeobox gene Nkx2–5. Circ. Res 87, 888–895 (2000). [DOI] [PubMed] [Google Scholar]
- 26.Laforest B, Andelfinger G & Nemer M Loss of Gata5 in mice leads to bicuspid aortic valve. J. Clin. Invest 121, 2876–2887 (2011). [DOI] [PMC free article] [PubMed] [Google Scholar]
- 27.Diez-Roux G et al. A high-resolution anatomical atlas of the transcriptome in the mouse embryo. PLoS Biol 9, e1000582 (2011). [DOI] [PMC free article] [PubMed] [Google Scholar]
- 28.Macosko EZ et al. Highly parallel genome-wide expression profiling of individual cells using nanoliter droplets. Cell 161, 1202–1214 (2015). [DOI] [PMC free article] [PubMed] [Google Scholar]
- 29.Aibar S et al. SCENIC: single-cell regulatory network inference and clustering. Nat. Methods 14, 1083–1086 (2017). [DOI] [PMC free article] [PubMed] [Google Scholar]
- 30.Eastman Q & Grosschedl R Regulation of LEF-1/TCF transcription factors by Wnt and other signals. Curr. Opin. Cell Biol 11, 233–240 (1999). [DOI] [PubMed] [Google Scholar]
- 31.Cai X et al. Tbx20 acts upstream of Wnt signaling to regulate endocardial cushion formation and valve remodeling during mouse cardiogenesis. Development 140, 3176–3187 (2013). [DOI] [PMC free article] [PubMed] [Google Scholar]
- 32.Alfieri CM, Cheek J, Chakraborty S & Yutzey KE Wnt signaling in heart valve development and osteogenic gene induction. Dev. Biol 338, 127–135 (2010). [DOI] [PMC free article] [PubMed] [Google Scholar]
- 33.Estarás C, Benner C & Jones KA SMADs and YAP compete to control elongation of β-catenin:LEF-1-recruited RNAPII during hESC differentiation. Mol. Cell 58, 780–793 (2015). [DOI] [PMC free article] [PubMed] [Google Scholar]
- 34.Lee JS et al. Klf2 is an essential regulator of vascular hemodynamic forces in vivo. Dev. Cell 11, 845–857 (2006). [DOI] [PubMed] [Google Scholar]
- 35.Wang N et al. Shear stress regulation of Krüppel-like factor 2 expression is flow pattern-specific. Biochem. Biophys. Res. Commun 341, 1244–1251 (2006). [DOI] [PubMed] [Google Scholar]
- 36.Dekker RJ et al. KLF2 provokes a gene expression pattern that establishes functional quiescent differentiation of the endothelium. Blood 107, 4354–4363 (2006). [DOI] [PubMed] [Google Scholar]
- 37.Goddard LM et al. Hemodynamic forces sculpt developing heart valves through a KLF2-WNT9B paracrine signaling axis. Dev. Cell 43, 274–289.e5 (2017). [DOI] [PMC free article] [PubMed] [Google Scholar]
References
- 38.Li H & Durbin R Fast and accurate short read alignment with Burrows–Wheeler transform. Bioinformatics 25, 1754–1760 (2009). [DOI] [PMC free article] [PubMed] [Google Scholar]
- 39.McKenna A et al. The Genome Analysis Toolkit: a MapReduce framework for analyzing next-generation DNA sequencing data. Genome Res 20, 1297–1303 (2010). [DOI] [PMC free article] [PubMed] [Google Scholar]
- 40.Van der Auwera GA et al. From FastQ data to high confidence variant calls: the Genome Analysis Toolkit best practices pipeline. Curr. Protoc. Bioinformatics 43, 11.10.1–11.10.33 (2013). [DOI] [PMC free article] [PubMed] [Google Scholar]
- 41.Danecek P et al. The variant call format and VCFtools. Bioinformatics 27, 2156–2158 (2011). [DOI] [PMC free article] [PubMed] [Google Scholar]
- 42.Paila U, Chapman BA, Kirchner R & Quinlan AR GEMINI: integrative exploration of genetic variation and genome annotations. PLoS Comput. Biol 9, e1003153 (2013). [DOI] [PMC free article] [PubMed] [Google Scholar]
- 43.Silberstein M et al. A system for exact and approximate genetic linkage analysis of SNP data in large pedigrees. Bioinformatics 29, 197–205 (2013). [DOI] [PMC free article] [PubMed] [Google Scholar]
- 44.Gierut JJ, Jacks TE & Haigis KM Whole-mount X-Gal staining of mouse tissues. Cold Spring Harb. Protoc 2014, 417–419 (2014). [DOI] [PMC free article] [PubMed] [Google Scholar]
- 45.Lincoln J, Alfieri CM & Yutzey KE Development of heart valve leaflets and supporting apparatus in chicken and mouse embryos. Dev. Dyn 230, 239–250 (2004). [DOI] [PubMed] [Google Scholar]
- 46.Peacock JD, Lu Y, Koch M, Kadler KE & Lincoln J Temporal and spatial expression of collagens during murine atrioventricular heart valve development and maintenance. Dev. Dyn 237, 3051–3058 (2008). [DOI] [PMC free article] [PubMed] [Google Scholar]
- 47.Fewell JG et al. A treadmill exercise regimen for identifying cardiovascular phenotypes in transgenic mice. Am. J. Physiol 273, H1595–H1605 (1997). [DOI] [PubMed] [Google Scholar]
- 48.Neri T et al. Human pre-valvular endocardial cells derived from pluripotent stem cells recapitulate cardiac pathophysiological valvulogenesis. Nat. Commun 10, 1929 (2019). [DOI] [PMC free article] [PubMed] [Google Scholar]
- 49.Gierahn TM et al. Seq-Well: portable, low-cost RNA sequencing of single cells at high throughput. Nat. Methods 14, 395–398 (2017). [DOI] [PMC free article] [PubMed] [Google Scholar]
- 50.Dobin A et al. STAR: ultrafast universal RNA-seq aligner. Bioinformatics 29, 15–21 (2013). [DOI] [PMC free article] [PubMed] [Google Scholar]
- 51.Satija R, Farrell JA, Gennert D, Schier AF & Regev A Spatial reconstruction of single-cell gene expression data. Nat. Biotechnol 33, 495–502 (2015). [DOI] [PMC free article] [PubMed] [Google Scholar]
- 52.Korsunsky I et al. Fast, sensitive and accurate integration of single-cell data with Harmony. Nat Methods 10.1038/s41592-019-0619-0 (2019). [DOI] [PMC free article] [PubMed] [Google Scholar]
- 53.McInnes L, Healy J & Melville J UMAP: Uniform Manifold Approximation and Projection for dimension reduction Preprint at https://arxiv.org/abs/1802.03426 (2018).
- 54.Becht E et al. Dimensionality reduction for visualizing single-cell data using UMAP. Nat. Biotechnol 37, 38–44 (2019). [DOI] [PubMed] [Google Scholar]
- 55.Moerman T et al. GRNBoost2 and Arboreto: efficient and scalable inference of gene regulatory networks. Bioinformatics 35, 2159–2161 (2019). [DOI] [PubMed] [Google Scholar]
- 56.Suo S et al. Revealing the critical regulators of cell identity in the mouse cell atlas. Cell Rep 25, 1436–1445.e3 (2018). [DOI] [PMC free article] [PubMed] [Google Scholar]
- 57.Edgar R, Domrachev M & Lash AE Gene Expression Omnibus: NCBI gene expression and hybridization array data repository. Nucleic Acids Res 30, 207–210 (2002). [DOI] [PMC free article] [PubMed] [Google Scholar]
Associated Data
This section collects any data citations, data availability statements, or supplementary materials included in this article.