

Abstract
Angiotensin (Ang)‐converting enzyme 2 (ACE2) metabolizes Ang II to the vasodilatory peptide Ang(1–7), while neprilysin (NEP) generates Ang(1–7) from Ang I. Experiments used novel Surface Enhanced Laser Desorption Ionization‐Time of Flight (SELDI‐TOF) mass spectroscopic (MS) assays to study Ang processing. Mass spectroscopy was used to measure proteolytic conversion of Ang peptide substrates to their specific peptide products. We compared ACE/ACE2 activity in plasma, brain and kidney from C57BL/6 and NEP −/− mice. Plasma or tissue extracts were incubated with Ang I or Ang II (1296 or 1045, m/z, respectively), and generated peptides were monitored with MS. Angiotensin‐converting enzyme 2 activity was detected in kidney and brain, but not in plasma. Brain ACE2 activity was highest in hypothalamus. Angiotensin‐converting enzyme 2 activity was inhibited by the specific ACE2 inhibitor, DX600 (10 μm, 99% inhibition), but not by the ACE inhibitor, captopril (10 μm). Both MS and colorimetric assays showed high ACE activity in plasma and kidney with low levels in brain. To extend these findings, ACE measurements were made in ACE overexpressing mice. Angiotensin‐converting enzyme four‐copy mice showed higher ACE activity in kidney and plasma with low levels in hypothalamus. In hypothalamus from NEP −/− mice, generation of Ang(1–7) from Ang I was decreased, suggesting a role for NEP in Ang metabolism. With Ang II as substrate, there was no difference between NEP −/− and wild‐type control mice, indicating that other enzymes may contribute to generation of Ang(1–7). The data suggest a predominant role of hypothalamic ACE2 in the processing of Ang II, in contrast to ACE, which is most active in plasma.
The importance of the systemic renin–angiotensin system (RAS) and the pivotal role of angiotensin (Ang) II in the pathogenesis of hypertension and other cardiovascular diseases are widely acknowledged. However, the traditional view that Ang II is the singular key product of the RAS has been questioned following the discovery of angiotensin‐converting enzyme 2 (ACE2; Donoghue et al. 2000; Tipnis et al. 2000) and the growing evidence for a physiological role for Ang(1–7) (Fontes et al. 1997; Sakima et al. 2005; Gallagher et al. 2006).
Angiotensin‐converting enzyme 2 catalyses the conversion of Ang II to Ang(1–7) (Tipnis et al. 2000; Vickers et al. 2002; Guy et al. 2003). Angiotensin(1–7) is a peptide with vasodilator and anti‐proliferative properties that has gained attention because of cumulative evidence showing that it antagonizes many of the cardiovascular actions of Ang II (Ferrario et al. 2005b ). Apart from its generation by ACE2, Ang(1–7) can be generated directly via cleavage of the Pro7–Pro8 bond in the C‐terminal domain of Ang I by at least four enzymes, which include neprilysin (EC 3.4.24.11), prolyl‐endopeptidase (EC 3.4.21.26), thimet endopeptidase (EC 3.4.24.15; Yamamoto et al. 1992; Welches et al. 1993) and neurolysin (EC 3.4.24.16; Rioli et al. 1998). With less efficiency, ACE2 also converts Ang I to Ang(1–9) (Donoghue et al. 2000; Vickers et al. 2002), a peptide whose physiological effects are not fully understood. Besides its physiological role as a peptidase, ACE2 has been demonstrated to be a functional receptor for the coronavirus that causes severe acute respiratory syndrome (SARS; Li et al. 2003).
In addition to the systemic RAS, there is evidence for a RAS in tissues such as pancreas, heart, liver, lungs, adipose tissue and brain (Lavoie & Sigmund, 2003; Paul et al. 2006). Using molecular biological, biochemical, immunochemical and genetic approaches, results have shown that the peptide precursor and enzymes required for the formation and degradation of the biologically active forms of Ang, as well as Ang receptors, are present in brain (Lippoldt et al. 1995; Allen et al. 1998; Morimoto & Sigmund, 2002). However, despite the multitude of studies on the brain RAS, there is little information on regulation of enzymatic activity. The focus has instead been on localization of enzymes, peptides and receptors and their mRNAs. There is evidence for ACE activity in brain areas lacking a blood–brain barrier, such as the subfornical organ and pineal gland (Saavedra, 1992; Jouquey et al. 1995). However, levels are low, with activity in the range of picomoles per milligram protein per hour. Angiotensin‐converting enzyme 2 is present in a wide variety of tissues, including heart, kidney and central nervous system (CNS; Harmer et al. 2002; Gembardt et al. 2005; Ferrario, 2006). Gallagher and co‐workers reported that Ang II downregulates ACE2 mRNA in astrocytic cultures, resulting in lower levels of Ang(1–7); however, activity of Ang(1–7)‐generating enzymes was not measured (Gallagher et al. 2006). We used in situ hybridization to measure ACE2 mRNA in brainstem and found a relationship between Angiotensin type 1a receptor (Ang AT1a) and ACE2 expression (Lin et al. 2008).
There is much information to show that the brain RAS is critical in regulation of blood pressure, water balance and endocrine secretion (Wright & Harding, 1992; McKinley et al. 2003). Nevertheless, there are questions concerning the means by which the central RAS functions, particularly the relationship between ACE and ACE2 in regulation of brain angiotensin peptide metabolism. With this knowledge gap in mind, we developed a research programme to examine the regulation of ACE and ACE2 activity in brain. We took advantage of newly developed mass spectrometric (MS) methods for measuring enzyme activity and angiotensin proteolytic processing (2005, 2006). The methods are sensitive and specific and offer advantages over traditional assays because they provide data on peptide precursors and precise proteolytic products. The experimental goal was to study brain angiotensin peptide metabolism, with a focus on ACE and ACE2, using pharmacological tests and genetic models.
Methods
Reagents
Angiotensin I and Ang II were obtained from Bachem Bioscience, Inc. (King of Prussia, PA, USA). Bestatin was obtained from ALPCO Diagnostics (Windham, NH, USA). Trifluoroacetic acid (TFA) was purchased from Pierce Biotechnology, Inc. (Rockford, IL, USA). Phenylmethanesulphonyl fluoride (PMSF), α‐hydroxy‐4‐cinnamic acid (CHACA), captopril and EDTA were purchased from Sigma Aldrich Co. (St Louis, MO, USA). The ACE2 inhibitor DX600 was purchased from Phoenix Pharmaceuticals, Inc. (Belmont, CA, USA). Z‐Prolyl‐prolinal (Z‐PP) was purchased from BIOMOL International, L.P. (Plymouth Meeting, PA, USA). Surface Enhanced Laser Desorption Ionization‐Time of Flight Mass Spectroscopy (SELDI‐TOF‐MS) ProteinChip® and the calibration standards were purchased from Ciphergen Biosystems, Inc. (Fremont, CA, USA). Organic solvents were HPLC grade.
Animals
Male C57BL/6 mice were purchased from Harlan, Inc. (Indianapolis, IN, USA). Tissues from NEP gene deletion mice (NEP −/−) and their littermate controls (NEP +/+) were obtained from Dr Bao Lu (Harvard Medical School, Boston, MA, USA; Lu et al. 1995). Mice with two or four functional copies of the Ace gene at its normal chromosomal location (Krege et al. 1997) were raised at Wright State University from breeding pairs obtained from The Jackson Laboratory (Bar Harbor, ME, USA). Animals were housed at 22°C under a 12 h light–12 h dark cycle with ad libitum access to water and standard mouse chow. All experimental protocols were approved by the Wright State University Animal Care and Use Committee.
Tissue and plasma samples
Mice were decapitated, and trunk blood was collected in ice‐chilled heparinized tubes. Plasma was immediately separated and stored at −80°C. Kidneys were quickly removed, frozen in liquid nitrogen and stored at −80°C. For brain dissection, tissue blocks (∼2–3 mm2) were cut from each region using microscissors. The brain areas collected for study were medial basal hypothalamus, cerebral cortex from the occipital region, brainstem from the region over the obex and hippocampus. The pituitary was removed intact. Tissues were stored at −80°C. Analysis of specific nuclear regions would be feasible, but was not attempted in this initial study. Tissues were homogenized on ice in 1:9 (w/v) Tris‐HCl (50 mm, pH 7.4) containing 2 mm PMSF. The homogenate was centrifuged at 9000g for 10 min to remove cellular debris. Total protein was determined in the supernatant using the Bradford protein assay with bovine serum albumin as a standard (BioRad Protein Assay Reagent, BioRad Laboratories, Hercules, CA, USA).
Mass spectroscopic ACE and ACE2 assays
Activities of ACE and ACE2 were measured in plasma and tissue extracts as previously described (2005, 2006). Tissue extracts (1 μg protein) or plasma (0.5 μl) were added to 25 μl Mes buffer (50 mm, pH 6.5), containing PMSF (2 mm) and bestatin (20 μm). Samples were spiked with 5 μm of Ang I or Ang II and incubated at 37°C. After incubation, the reaction mixture (1 μl, 40–80 ng protein) was spotted onto weak cation exchange (WCX2) ProteinChips®, and enzymatic reactions were terminated by addition of 1 μl of freshly prepared saturated matrix (α‐cyano‐4‐hydroxycinnamic acid in 50% acetonitrile (v/v), containing 0.1% TFA). Generated peptides, Ang II and Ang(1–7), were directly read in a ProteinChip® reader system, PBS II (Ciphergen Biosystems). Mass spectroscopic analysis was performed with proprietary software (version 3.1, Ciphergen Biosystems). Ionized peptides were detected and their molecular masses determined according to time of flight (TOF). Samples from five or six mice were measured in duplicate.
Colorimetric ACE assay
Activity of ACE was also measured with a colorimetric assay (ALPCO Diagnostics, Windham, NH, USA), using the synthetic substrate, N‐hippuryl‐l‐histidyl‐l‐leucine, in the presence and absence of the ACE inhibitor, captopril (10 μm). Briefly, tissue extracts (320 μg protein) or plasma (40 μl) were incubated with substrate, and released hippuric acid was colorimetrically measured at 382 nm. Results were expressed as ACE units, defined as the amount of enzyme required to release 1 μm of hippuric acid per minute per litre of tissue extract or plasma. Samples were measured in duplicate.
Statistics
Results are expressed as means ±s.e.m. Data were compared using two‐way ANOVA followed by Bonferroni test for multiple comparisons or by Student's unpaired t test where appropriate. Differences were considered to be statistically significant at P < 0.05.
Results
Angiotensin‐converting enzyme 2 activity
Angiotensin‐converting enzyme 2 activity was measured in brain, kidney and plasma using an MS‐based proteolytic assay. Angiotensin‐converting enzyme 2 activity is expressed as the ratio between product, Ang(1–7), and substrate, Ang II. Figure 1 is an example of a typical SELDI‐TOF‐MS peptide chromatographic profile for an ACE2 assay in plasma (Fig. 1A ), kidney (Fig. 1B ) and hypothalamus (Fig. 1C ) from normal C57Bl/6 mice. The two MS peaks seen in Fig. 1B and C are the assay substrate, Ang II (1045, m/z), and peptide product, Ang(1–7) (899, m/z). Data provide evidence for ACE2‐like activity in kidney and brain with no detectable activity in plasma. Incubation of Ang II with heat‐inactivated brain tissue failed to generate Ang(1–7) (data not shown). Based on these findings, we measured ACE2 activity in various brain regions (Table 1). The ACE2 activity was highest in hypothalamus and lowest in brainstem and pituitary. The linearity of the MS ACE2 assay is shown in Fig. 2, in which varying concentrations of a hypothalamic extract (20–80 ng protein) were tested for ACE2 activity. There was a linear relationship between protein concentration and ACE2 activity (r 2= 0.92).
Figure 1.
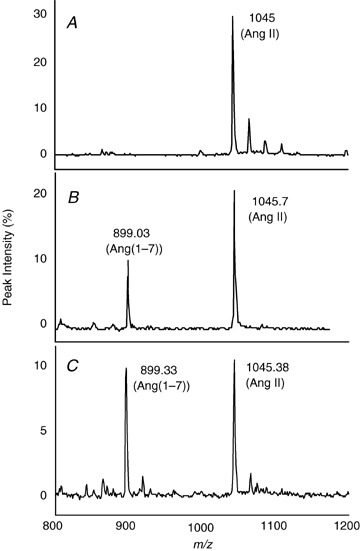
Generation of Ang(1–7) from Ang II in plasma, kidney and brain from C57BL/6 mice Plasma (0.5 μl), kidney or hypothalamic extract (1 μg protein) were incubated with 25 μl Mes buffer, containing Ang II (5 μm), PMSF (2 mm), bestatin (20 μm) and Z‐PP (10 μm), for 2 h at 37°C. Substrate and generated peptides were monitored using SELDI‐TOF‐MS. Conditions are the following: Ang II + plasma (A); Ang II + kidney (B); and Ang II + brain (C).
Table 1.
. Measurement of ACE2 activity in hypothalamus, cortex, hippocampus, pituitary and brainstem from C57BL/6 mice using SELDI‐TOF‐MS assays
| Brain Region | ACE2 activity, expressed as Ang(1–7)/Ang II |
|---|---|
| Hypothalamus | 1.4 ± 0.2 |
| Cerebral cortex | 0.7 ± 0.1 |
| Hippocampus | 0.5 ± 0.2 |
| Pituitary | 0.3 ± 0.1 |
| Brainstem | 0.1 ± 0.02 |
Tissue dissections are described in the Methods. Angiotensin II (5 μm) was incubated with tissue extract (1 μg protein) for 2 h. Buffer and protease cocktail mixture are described in Fig. 1. Angiotensin II and generated Ang(1–7) were monitored in 1 μl of the reaction mixture using SELDI‐TOF‐MS. Angiotensin‐converting enzyme 2 activity is expressed as the ratio of Ang(1–7) to Ang II. Values are means ±s.e.m. (n= 5–6).
Figure 2.
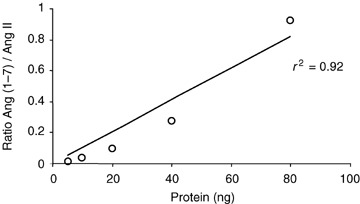
Relationship between protein concentration and Ang(1–7) formation Angiotensin II (5 μm) in 25 μl Mes buffer was mixed with variable concentrations of hypothalamic extract (20–80 ng protein) from C57BL/6 mice and incubated for 2 h at 37°C. Angiotensin II and generated Ang(1–7) were monitored using SELDI‐TOF‐MS. Activity of ACE2 is expressed as the ratio of Ang(1–7) to Ang II.
To evaluate specificity of the brain ACE2 assay, we determined the effect of the ACE2 inhibitor, DX600 (Huang et al. 2003) and the metallic chelator, EDTA. Figure 3 shows the dose‐related inhibitory effect of DX600 on hypothalamic ACE2 activity. Angiotensin II (5 μm) was incubated with hypothalamic extract (40 ng protein) in the presence and absence of DX600 (1 and 10 μm; Fig. 3B–D ). Hypothalamic ACE2 activity was 92% inhibited by 1 μm DX600 (Fig. 3C ), and the higher dose (10 μm) produced more than 99% inhibition (Fig. 3D ). A lower dose of DX600 (0.1 μm) inhibited ACE activity by 20% (data not shown). The reaction was completely blocked by EDTA (10 mm), while captopril had no effect on ACE2 activity (data not shown). Generation of Ang(1–7) was not inhibited by Z‐PP, a selective inhibitor of prolyl‐endopeptidase. These results document the specificity of the reaction, indicating that the peptide cleavage was produced by ACE2 and not by non‐specific degradation of Ang II.
Figure 3.
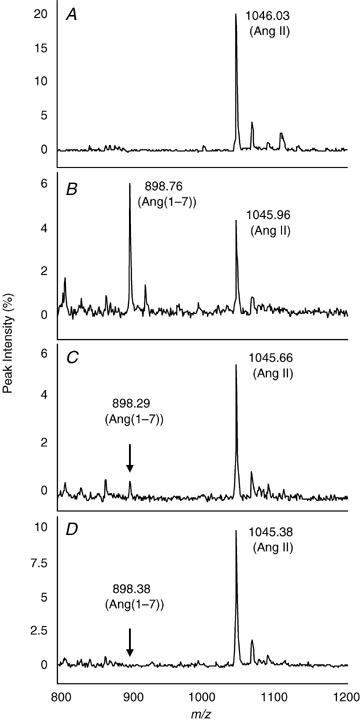
Inhibition of hypothalamic ACE2 activity with a selective ACE2 inhibitor, DX600 Angitoensin II (5 μm) was incubated with hypothalamic extract (1 μg total protein) from C57BL/6 mice for 2 h in the presence and absence of variable concentrations of DX600. Substrate and generated Ang(1–7) were monitored using SELDI‐TOF‐MS. Conditions are the following: control Ang II (A); Ang II + hypothalamus (B); Ang II + hypothalamus + 1 μm DX600 (C); and Ang II + hypothalamus + 10 μm DX600 (D).
Angiotensin I as a peptide substrate for plasma and brain ACE2
Plasma and hypothalamic extracts were incubated with Ang I (5 μm). Figure 4 shows a typical chromatograph for sequential processing of angiotensin peptides. Figure 4A shows the MS peak for the Ang I substrate alone. Upon addition of plasma, Ang I (1295.8, m/z) was processed by ACE to yield Ang II (1045.7, m/z; Fig. 4B ). There was no evidence for production of Ang(1–7) (899.7, m/z). A different peptide profile was observed when Ang I was incubated with a hypothalamic extract (Fig. 4C ). Angiotensin II was almost undetectable, indicating that ACE activity is low in brain. Moreover, the chromatograph showed that in hypothalamus, Ang(1–7) was the primary angiotensin peptide product generated when Ang I was used as a substrate (Fig. 4C). The absence of detectable Ang(1–9) (1183, m/z) suggests that Ang I is not a good substrate for ACE2. This is supported by previous experiments which tested the proteolytic profile of recombinant human ACE2 (Rice et al. 2004; Elased et al. 2006).
Figure 4.
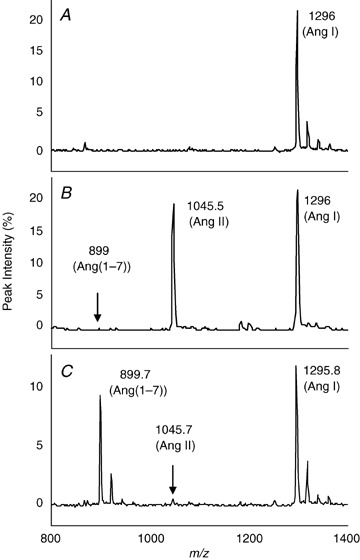
Enzymatic processing of Ang I and Ang II Plasma (0.5 μl) and hypothalamic extract (1 μg total protein) from C57BL/6 mice were incubated with Ang I (5 μm) for 2 h. SELDI‐TOF‐MS analysis of substrate and generated Ang(1–7) was monitored. Conditions are the following: control Ang I (A); Ang I + plasma (B); and Ang I + hypothalamus (C).
Angiotensin‐converting enzyme 2 activity in neprilysin‐deficient mice
Experiments were performed to study the role of NEP in angiotensin metabolism. We took advantage of the availability of NEP‐deficient mice (NEP −/−) to analyse the contribution of this enzyme in the generation of Ang(1–7) in brain. Figure 5 compares Ang(1–7) generation in hypothalamic extracts from NEP −/− and wild‐type NEP +/+ mice using Ang II or Ang I as a substrate. For quantitative evaluation, the ratio Ang(1–7)/Ang II and Ang(1–7)/Ang I were used as the experimental index. When Ang II was used as the substrate, there was no difference in the ratio of Ang(1–7)/Ang II between groups. However, as expected, there was a marked decrease in the ratio of Ang(1–7)/Ang I in NEP −/− mice compared with NEP +/+ mice (P < 0.05, Fig. 5). Taken together, these results indicate that neprilysin plays a role in generation of Ang(1–7) in mouse brain, depending on the available substrate.
Figure 5.
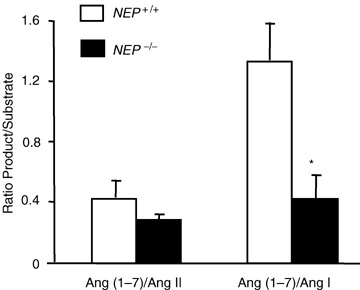
Generation of Ang(1–7) from Ang I and Ang II in hypothalamic extracts from NEP−/− and wild‐type NEP+/+ mice Tissue extracts were incubated with Ang I (5 μm) or Ang II (5 μm) for 2 h at 37°C. Reaction mixtures were assayed in duplicate. Substrates and generated peptide Ang(1–7) peaks were measured using SELDI‐TOF‐MS and expressed as the ratio of Ang(1–7) to substrate. Values are means +s.e.m., n= 5–6. Student's unpaired t test analysis showed *P < 0.05 versus NEP +/+.
Brain ACE activity: comparison of SELDI‐TOF‐MS and colorimetric assays
The SELDI‐TOF‐MS assays provided little evidence for the formation of Ang II from Ang I in hypothalamic extracts. To confirm these results, we compared the MS assay with the traditional colorimetric ACE assay (Hurst & Lovell‐Smith, 1984). Plasma (0.5 μl) and kidney or hypothalamic extracts (1 μg protein) were incubated with Ang I (5 μm). Angiotensin I and generated Ang II and the ratios were quantified using SELDI‐TOF‐MS. As shown in Fig. 6A , hypothalamic ACE activity was almost undetectable compared with that in kidney and plasma (P < 0.001). Captopril (10 μm) inhibited the generation of Ang II in kidney and plasma (Fig. 6A , P < 0.001), indicating that Ang II was generated by the action of ACE. The experiment was repeated using the conventional colorimetric assay. Plasma (20 μl) and kidney or hypothalamic extract (160 μg protein) were incubated with the synthetic substrate, N‐hippuryl‐l‐histidyl‐l‐leucine. The released hippuric acid was colorimetrically quantified and results expressed as ACE units. Figure 6B shows that ACE activity in hypothalamus was below the detection limit of the assay and was not significantly altered by captopril (10 μm). As expected, ACE activity was detected in kidney and plasma and was significantly inhibited by 10 μm captopril (P < 0.001, Fig. 6B ). The protein concentrations required for the colorimetric assay were much greater (more than 150‐fold) than those needed for the MS assay, further verifying the utility of the SELDI‐TOF‐MS assay.
Figure 6.
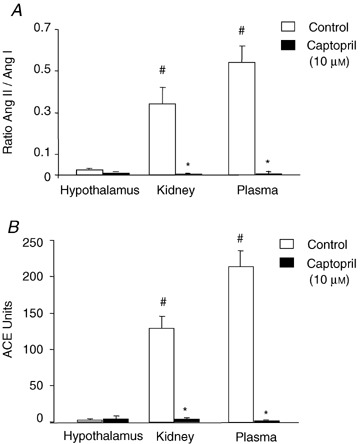
Comparison of brain ACE activity using SELDI‐TOF‐MS and colorimetric assays A, SELDI‐TOF‐MS assay. Plasma (0.5 μl), kidney or hypothalamic extract (1 μg protein) from C57BL/6 mice were incubated with Ang I (5 μm) for 2 h, in the presence or absence of captopril (10 μm). Substrate and generated Ang II were monitored and expressed as the ratio of Ang II to Ang I. There were significant main effects of drug (control versus captopril; F (1,24)= 53.11, P < 0.0001), tissue (hypothalamus, kidney, plasma; F (2,24)= 13.57, P= 0.0001) and interaction (F (2,24)= 13.76, P= 0.0001).Values are means +s.e.m., n= 5. Student's unpaired t test analysis showed *P < 0.001 versus control; #P < 0.001 versus control hypothalamus. B, colorimetric assay. Plasma (40 μl), kidney or hypothalamic extract (320 μg protein) from C57BL/6 mice were incubated in the presence of the synthetic substrate N‐hippuryl‐l‐histidyl‐l‐leucine. Released hippuric acid was colorimetrically quantified, and results expressed as ACE units. There were significant main effects of drug (control versus captopril; F (1,24)= 174.52, P < 0.0001), tissue (hypothalamus, kidney, plasma; F (2,24)= 55.24, P < 0.0001) and interaction (F (2,24)= 57.17, P < 0.0001). Values are means +s.e.m., n= 5–6. Student's unpaired t test analysis showed *P < 0.001 versus control; #P < 0.001 versus control hypothalamus.
Studies in ACE overexpression model
To further support our finding of low ACE activity in brain, we conducted tests in a genetic strain of mouse with ACE overexpression (Krege et al. 1997). The premise was that under conditions of globally high ACE activity, we might expect to measure ACE activity in brain. The ACE activity was measured in kidney, brain and plasma from C57BL/6 (two‐copy) or ACE overexpression mice (four‐copy; Fig. 7). Hypothalamic ACE activity was low to undetectable compared with kidney and plasma in ACE two‐copy mice. As expected, kidney and plasma ACE activity were significantly higher in ACE four‐copy mice (P < 0.05 and P < 0.01, respectively) compared with control mice. There was no evidence for brain ACE activity in the ACE four‐copy animals, suggesting that global overexpression of the Ace gene does not translate into functional changes in the brain.
Figure 7.
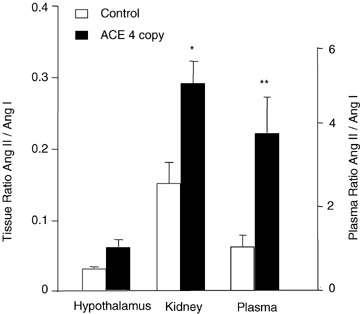
Effect of number of Ace gene copies on ACE activity in hypothalamus, kidney and plasma Angiotensin I (10 μm) was incubated with hypothalamic or kidney extracts (1 μg protein) or plasma (0.5 μl) from C57BL/6 (two‐copy) or ACE four‐copy mice for 2 h at 37°C. Activity of ACE was expressed as the ratio of Ang II to Ang I. Values are means +s.e.m. Student's unpaired t test analysis showed *P < 0.05 versus control two‐copy kidney and **P < 0.01 versus control two‐copy plasma.
Discussion
The RAS is an attractive target for medications designed for management of cardiovascular disease. Since this system is a complex of bioactive peptides with a regulatory enzymatic cascade, characterization of current and prospective drugs requires data on peptide processing as well as sensitive proteolytic enzyme assays. There is much clinical interest in measurement of renin and ACE activity as biomarkers for disease states such as hypertension, diabetes, heart failure and renal dysfunction. However, recent data indicate that Ang(1–7), a product of the carboxypeptidase, ACE2, may be important in regulating cardiovascular function (Tipnis et al. 2000; Vickers et al. 2002; Ferrario, 2006). Like ACE, the substrate affinity of ACE2 is not confined to the RAS; for example, it also efficiently degrades des‐Arg9 bradykinin (Vickers et al. 2002; Huang et al. 2003). However, it is the ability of ACE2 to inactivate the vasoconstrictor, Ang II, and to generate the metabolite, Ang(1–7), that implicates ACE2 as an important participant in cardiovascular homeostasis. Angiotensin‐converting enzyme 2 and Ang(1–7) become potential targets in the development of novel therapeutic agents for cardiovascular disease (Raizada & Ferreira, 2007).
An important issue in the study of the RAS is the availability of specific and sensitive assays. We have taken advantage of MS technology to develop proteolytic assays for ACE, ACE2 and renin activities in plasma and tissue (2005, 2006). The proteolytic angiotensin peptide products are identified by m/z and quantified by peak intensity. Results show that the enzymatic reactions produce the predicted angiotensin peptides with inhibition by specific inhibitors. For example, incubation of plasma with Ang I resulted in formation of Ang II with a linear relationship between substrate depletion and product formation. There was also a correlation between incubation time and product formation. In the present study, we exploited the sensitivity and selectivity of SELDI‐TOF‐MS to study brain ACE and ACE2 and other enzymes such as NEP which generate Ang(1–7) from Ang I and Ang II. The assay system allows for relative comparison of multiple proteolytic enzymes contributing to angiotensin peptide processing in brain. Plasma and kidney were used as known sources of ACE and ACE2, respectively, and provided a means of comparison with brain. The goal was to address the ability of brain tissue to metabolize Ang I and Ang II and to directly evaluate the contributions of ACE/ACE2 activity. Proteolytic enzyme activities were measured directly rather than using other indices of the RAS such as protein levels or mRNA expression.
The current, widely used assay for measurement of ACE2 activity employs synthetic, fluorogenic peptide substrates (Vickers et al. 2002; Yan et al. 2003; Huentelman et al. 2004). The substrate peptide contains a fluorescent 7‐methoxycoumarin group which is quenched by energy transfer to a 2,4‐dinitrophenyl group. A fluorogenic peptide substrate, Mca‐Y‐V‐A‐D‐A‐P‐K (Dnp)‐OH is used to measure activity of ACE2 or peptidases that are capable of cleaving an amide bond between the fluorescent and quencher groups. Examples of other enzymes that would be active in this assay are ACE (Wysocki et al. 2006), caspase‐1 and interleukin‐converting enzyme (Enari et al. 1996). The assay has been improved by the use of a different fluorogenic substrate, Mca‐A‐P‐K (Dnp)‐OH, which is more specific for ACE2 (Vickers et al. 2002; Guy et al. 2003). It is also possible to use radioactive angiotensin peptides (125I‐Ang I and 125I‐Ang II) for the study of angiotensin metabolism and as a screen for ACE2 activity in kidney and heart (Ferrario et al. 2005b ; Shaltout et al. 2007). While this approach is reliable and accurate, it is time consuming and requires the use of radioactivity and chromatographic separation of substrate and peptide products. The advantage of the MS‐based methods is the ability to utilize endogenous peptide substrates for ACE and ACE2 without the need of synthetic, artificial fluorogenic or radioactive substrates.
There are considerable data to support the presence and a physiological role for brain Ang(1–7) (Chappell et al. 1989), which binds to a non‐Ang I/Ang II‐type receptor, thought to be the mas oncogene (Santos et al. 2003). However, the role of brain ACE2 in the generation of this peptide is not well understood. The original study described ACE2 in heart, kidney and testis, but failed to demonstrate its presence in brain (Donoghue et al. 2000). Subsequent studies using quantitative reverse transcriptase‐polymerase chain reaction (Harmer et al. 2002) and immunohistochemistry (Doobay et al. 2007) revealed that ACE2 is localized in brain. There is also evidence for the presence of ACE2 mRNA in cultured astrocytes (Gallagher et al. 2006) and mouse brain (Lin et al. 2008). However, in this emerging field there are few studies that address the issue of ACE2 activity in brain. Thus, the first goal was to determine whether ACE2 is active in brain.
Results demonstrate the presence of ACE2 activity in brain, as evidenced by the conversion of Ang II to Ang(1–7), with highest proteolytic activity in hypothalamus. This is consistent with immunochemical staining for Ang(1–7) in the hypothalamus (Block et al. 1988; Krob et al. 1998) and biochemical evidence for brain localization of the peptide (Chappell et al. 1989). Other supportive data show that the reaction is inhibited by an ACE2 inhibitor, DX600, but not by captopril. There is much information to show that injection of Ang(1–7) into the brain has prominent effects on cardiovascular function (Campagnole‐Santos et al. 1989). A comparison of the blood‐pressure‐lowering effects of brainstem injection of Ang II and Ang(1–7) showed that the responses were similar (Couto et al. 2002). While Ang I has been shown to exert central cardiovascular actions, most studies have used the intracerebroventricular injection route (Tomlinson et al. 1990). In this case, the angiotensin peptide may be metabolized by cerebrospinal fluid ACE, probably derived from plasma.
It is important to note that the substrate of preference in brain was Ang II, with little interaction with Ang I. In fact, there was no evidence for ACE activity in brain even though it was easily detected in kidney and plasma. This was seen using either the MS proteolytic or the conventional colorimetric assay. Furthermore, a test using a model of ACE overexpression (Krege et al. 1997) failed to show evidence for ACE activity in hypothalamus. This occurred even though there were markedly higher ACE levels in plasma and kidney in the four‐copy ACE mice. Most studies of brain ACE have relied on the use of immunochemical methods (Johren et al. 1997) or receptor binding assays (Chai et al. 1987; Rogerson et al. 1995; Johren & Saavedra, 1996) to support the idea of an active brain ACE system. A recent study reports that brain ACE activity is low in brain of perindopril‐treated mice (Eckman et al. 2006). Results showed more than 90% inhibition of serum ACE with only a slight inhibition of brain ACE even though perindopril readily crosses the blood–brain barrier. Using HPLC separation with radioimmunoassay, brain Ang II levels were undetectable despite pooling the tissue from three mice (Alexiou et al. 2005). There are also data from an in situ hybridization study which revealed low levels of ACE mRNA throughout the mouse hypothalamus (Johren & Saavedra, 1996). Nevertheless, low brain ACE activity under normal conditions does not rule out the possibility of enhanced activity during pathophysiological situations.
An important conclusion of our study is that brain ACE2 is predominant over ACE under normal physiological situations. This is an unexpected finding because Ang II and its receptors are present and active in the brain (reviewed by McKinley et al. 2003). Injection of Ang II peripherally or centrally activates brain systems, with effects blocked by angiotensin type 1 receptor blockers. However, these experiments rely on the response to exogenous peptide or antagonist administration, which is not the same as the endogenous state. It would be interesting to determine whether there are changes in brain ACE and ACE2 activity in animals or humans with cardiovascular dysfunction. Indeed, a recent study using db/db and streptozotocin‐induced diabetic mice showed an alteration in ACE and ACE2 activity compared with non‐diabetic control mice (Wysocki et al. 2006). Studies using adenovirus small hairpin RNA (shRNA) for AT1a injected directly into the brainstem also documented interactions between angiotensin AT1a and ACE2 (Lin et al. 2008).
The endopeptidase NEP cleaves atrial natriuretic factor and a number of RAS peptides and contributes to the formation of Ang(1–7) (Welches et al. 1991; Turner et al. 2001). In an effort to understand the mechanisms that implicate NEP and the RAS in generation of Ang(1–7) in brain, experiments were performed using NEP‐deficient mice. Our data showed that Ang(1–7)‐forming activity from Ang I was significantly lower in hypothalamus from NEP −/− mice. However, Ang(1–7)‐forming activity from Ang II, putative ACE2 activity, was not altered in these mice. This supports the idea that brain ACE2 has a distinct role in inactivating Ang II which is separate from NEP. Our data also showed that conversion of Ang I to Ang(1–7) was not inhibited by the ACE2 inhibitor, DX600, which suggested that NEP might be involved in this metabolic pathway. Indeed, there are data which support the idea that NEP plays a role in generation of Ang(1–7) (Chappell et al. 1989; Welches et al. 1991). Taken together, the data indicate minimal importance for ACE in brain metabolism. If there was an abundant supply of functional ACE, there would be sequential production of Ang II and Ang(1–7); something which is not seen.
Measurement of circulating forms of ACE2 has proved problematical. In normal plasma, we found no evidence of ACE2 activity. A recent clinical trial showed that plasma ACE2 was detectable in <10% of individuals, within a study population of 500 (Rice et al. 2006). While there is evidence showing Ang(1–7) in plasma and urine which is physiologically regulated, the source of the peptide is not certain (Brosnihan et al. 2004; Ferrario et al. 2005a ). A recent study in sheep demonstrated the presence of serum ACE2 activity which converted Ang II to Ang(1–7) but did not cleave Ang I into Ang‐(1–9) (Shaltout et al. 2007). In rats, ACE2 was measured in plasma and found to be increased after coronary arterial ligation (Ocaranza et al. 2006). It was surprising that the increase in rat plasma ACE2 activity was not associated with an increase in plasma Ang(1–7), but rather with an increase in Ang (1–9). This would suggest that ACE2 preferentially cleaves Ang I rather than Ang II. This observation does not agree with our data or with previous studies which demonstrate that Ang II is efficiently cleaved by ACE2, almost 400‐fold more active with Ang II as substrate compared with Ang I (Vickers et al. 2002). We also found no evidence for ACE2‐dependent formation of Ang(1–9) from Ang I (data not shown). Therefore, an important criterion for in vivo ACE2 activity would be detection of increased Ang(1–7). The generation of Ang(1–7) in the brain was not inhibited by Z‐PP, a selective inhibitor of prolyl‐endopeptidase, which is capable of generating Ang(1–7). It was not possible to address the possible activity of prolyl carboxypeptidase (EC 3.4.16.2) in the generation of Ang(1–7) in the brain because all the assays were carried out in the presence of 2 mm PMSF, an inhibitor of prolyl carboxypeptidase (Odya et al. 1978).
In conclusion, studies using a SELDI‐TOF‐MS assay approach documented a predominant role of ACE2 versus ACE in processing of angiotensin peptides in mouse hypothalamus. This suggests an interesting scenario in which Ang(1–7), rather than Ang II, may be the dominant brain peptide. This provides further evidence to support a vital role for localized ACE2 and tissue specificity of the RAS. Furthermore, a balance between ACE and ACE2 may be important in cardiovascular health, and new treatment strategies may be envisioned which specifically target this system.
Acknowledgements
The authors acknowledge the financial support of NIH R01HL69319 (M.M.), Wright State University development fund (K.M.E.) and AHA Scientist Development Grant 0735112N (K.M.E.). T.S.C. was supported in part by Coordenação de Aperfeiçoamento de Pessoal de Nível Superior, Programa de Doutorado com Estágio no Exterior (CAPES/PDEE). We gratefully acknowledge the help of Terry Oroszi, Mary Key and Dr Bao Lu (Harvard Medical School, Boston, MA, USA).
K. M. Elased and T. S. Cunha contributed equally to this work.
References
- Alexiou T, Boon WM, Denton DA, Nicolantonio RD, Walker LL, McKinley MJ & Campbell DJ (2005). Angiotensinogen and angiotensin‐converting enzyme gene copy number and angiotensin and bradykinin peptide levels in mice. J Hypertens 23, 945–954. [DOI] [PubMed] [Google Scholar]
- Allen AM, Moeller I, Jenkins TA, Zhuo J, Aldred GP, Chai SY & Mendelsohn FA (1998). Angiotensin receptors in the nervous system. Brain Res Bull 47, 17–28. [DOI] [PubMed] [Google Scholar]
- Block CH, Santos RA, Brosnihan KB & Ferrario CM (1988). Immunocytochemical localization of angiotensin‐(1–7) in the rat forebrain. Peptides 9, 1395–1401. [DOI] [PubMed] [Google Scholar]
- Brosnihan KB, Neves LA, Anton L, Joyner J, Valdes G & Merrill DC (2004). Enhanced expression of Ang‐(1–7) during pregnancy. Braz J Med Biol Res 37, 1255–1262. [DOI] [PubMed] [Google Scholar]
- Campagnole‐Santos MJ, Diz DI, Santos RA, Khosla MC, Brosnihan KB & Ferrario CM (1989). Cardiovascular effects of angiotensin‐(1–7) injected into the dorsal medulla of rats. Am J Physiol Heart Circ Physiol 257, H324–H329. [DOI] [PubMed] [Google Scholar]
- Chai SY, McKinley MJ & Mendelsohn FA (1987). Distribution of angiotensin converting enzyme in sheep hypothalamus and medulla oblongata visualized by in vitro autoradiography. Clin Exp Hypertens A 9, 449–460. [DOI] [PubMed] [Google Scholar]
- Chappell MC, Brosnihan KB, Diz DI & Ferrario CM (1989). Identification of angiotensin‐(1–7) in rat brain. Evidence for differential processing of angiotensin peptides. J Biol Chem 264, 16518–16523. [PubMed] [Google Scholar]
- Couto AS, Baltatu O, Santos RA, Ganten D, Bader M & Campagnole‐Santos MJ (2002). Differential effects of angiotensin II and angiotensin‐(1–7) at the nucleus tractus solitarii of transgenic rats with low brain angiotensinogen. J Hypertens 20, 919–925. [DOI] [PubMed] [Google Scholar]
- Donoghue M, Hsieh F, Baronas E, Godbout K, Gosselin M, Stagliano N, Donovan M, Woolf B, Robison K, Jeyaseelan R, Breitbart RE & Acton S (2000). A novel angiotensin‐converting enzyme‐related carboxypeptidase (ACE2) converts angiotensin I to angiotensin 1–9. Circ Res 87, E1–E9. [DOI] [PubMed] [Google Scholar]
- Doobay MF, Talman LS, Obr TD, Tian X, Davisson RL & Lazartigues E (2007). Differential expression of neuronal ACE2 in transgenic mice with overexpression of the brain renin‐angiotensin system. Am J Physiol Regul Integr Comp Physiol 292, R373–R381. [DOI] [PMC free article] [PubMed] [Google Scholar]
- Eckman EA, Adams SK, Troendle FJ, Stodola BA, Kahn MA, Fauq AH, Xiao HD, Bernstein KE & Eckman CB (2006). Regulation of steady‐state β‐amyloid levels in the brain by neprilysin and endothelin‐converting enzyme, but not angiotensin‐converting enzyme. J Biol Chem 281, 30471–30478. [DOI] [PubMed] [Google Scholar]
- Elased KM, Cool DR & Morris M (2005). Novel mass spectrometric methods for evaluation of plasma angiotensin converting enzyme 1 and renin activity. Hypertension 46, 953–959. [DOI] [PubMed] [Google Scholar]
- Elased KM, Cunha TS, Gurley SB, Coffman TM & Morris M (2006). New mass spectrometric assay for angiotensin‐converting enzyme 2 activity. Hypertension 47, 1010–1017. [DOI] [PubMed] [Google Scholar]
- Enari M, Talanian RV, Wong WW & Nagata S (1996). Sequential activation of ICE‐like and CPP32‐like proteases during Fas‐mediated apoptosis. Nature 380, 723–726. [DOI] [PubMed] [Google Scholar]
- Ferrario CM (2006). Angiotensin‐converting enzyme 2 and angiotensin‐(1–7): an evolving story in cardiovascular regulation. Hypertension 47, 515–521. [DOI] [PubMed] [Google Scholar]
- Ferrario CM, Jessup J, Gallagher PE, Averill DB, Brosnihan KB, Ann TE, Smith RD & Chappell MC (2005a). Effects of renin‐angiotensin system blockade on renal angiotensin‐(1–7) forming enzymes and receptors. Kidney Int 68, 2189–2196. [DOI] [PubMed] [Google Scholar]
- Ferrario CM, Trask AJ & Jessup JA (2005b). Advances in biochemical and functional roles of angiotensin‐converting enzyme 2 and angiotensin‐(1–7) in regulation of cardiovascular function. Am J Physiol Heart Circ Physiol 289, H2281–H2290. [DOI] [PMC free article] [PubMed] [Google Scholar]
- Fontes MA, Pinge MC, Naves V, Campagnole‐Santos MJ, Lopes OU, Khosla M & Santos RA (1997). Cardiovascular effects produced by microinjection of angiotensins and angiotensin antagonists into the ventrolateral medulla of freely moving rats. Brain Res 750, 305–310. [DOI] [PubMed] [Google Scholar]
- Gallagher PE, Chappell MC, Ferrario CM & Tallant EA (2006). Distinct roles for ANG II and ANG‐(1–7) in the regulation of angiotensin‐converting enzyme 2 in rat astrocytes. Am J Physiol Cell Physiol 290, C420–C426. [DOI] [PubMed] [Google Scholar]
- Gembardt F, Sterner‐Kock A, Imboden H, Spalteholz M, Reibitz F, Schultheiss HP, Siems WE & Walther T (2005). Organ‐specific distribution of ACE2 mRNA and correlating peptidase activity in rodents. Peptides 26, 1270–1277. [DOI] [PMC free article] [PubMed] [Google Scholar]
- Guy JL, Jackson RM, Acharya KR, Sturrock ED, Hooper NM & Turner AJ (2003). Angiotensin‐converting enzyme‐2 (ACE2): comparative modeling of the active site, specificity requirements, and chloride dependence. Biochemistry 42, 13185–13192. [DOI] [PubMed] [Google Scholar]
- Harmer D, Gilbert M, Borman R & Clark KL (2002). Quantitative mRNA expression profiling of ACE 2, a novel homologue of angiotensin converting enzyme. FEBS Lett 532, 107–110. [DOI] [PubMed] [Google Scholar]
- Huang L, Sexton DJ, Skogerson K, Devlin M, Smith R, Sanyal I, Parry T, Kent R, Enright J, Wu QL, Conley G, DeOliveira D, Morganelli L, Ducar M, Wescott CR & Ladner RC (2003). Novel peptide inhibitors of angiotensin‐converting enzyme 2. J Biol Chem 278, 15532–15540. [DOI] [PubMed] [Google Scholar]
- Huentelman MJ, Zubcevic J, Katovich MJ & Raizada MK (2004). Cloning and characterization of a secreted form of angiotensin‐converting enzyme 2. Regul Pept 122, 61–67. [DOI] [PubMed] [Google Scholar]
- Hurst PL & Lovell‐Smith CJ (1984). Comparison of two colorimetric assays for angiotensin‐converting enzyme activity. Clin Chem 30, 817. [PubMed] [Google Scholar]
- Johren O, Imboden H, Hauser W, Maye I, Sanvitto GL & Saavedra JM (1997). Localization of angiotensin‐converting enzyme, angiotensin II, angiotensin II receptor subtypes, and vasopressin in the mouse hypothalamus. Brain Res 757, 218–227. [DOI] [PubMed] [Google Scholar]
- Johren O & Saavedra JM (1996). Expression of AT1A and AT1B angiotensin II receptor messenger RNA in forebrain of 2‐wk‐old rats. Am J Physiol Endocrinol Metab 271, E104–E112. [DOI] [PubMed] [Google Scholar]
- Jouquey S, Mathieu MN, Hamon G & Chevillard C (1995). Effect of chronic treatment with trandolapril or enalapril on brain ACE activity in spontaneously hypertensive rats. Neuropharmacology 34, 1689–1692. [DOI] [PubMed] [Google Scholar]
- Krege JH, Kim HS, Moyer JS, Jennette JC, Peng L, Hiller SK & Smithies O (1997). Angiotensin‐converting enzyme gene mutations, blood pressures, and cardiovascular homeostasis. Hypertension 29, 150–177. [DOI] [PubMed] [Google Scholar]
- Krob HA, Vinsant SL, Ferrario CM & Friedman DP (1998). Angiotensin‐(1–7) immunoreactivity in the hypothalamus of the (mRen‐2d)27 transgenic rat. Brain Res 798, 36–45. [DOI] [PubMed] [Google Scholar]
- Lavoie JL & Sigmund CD (2003). Minireview: overview of the renin‐angiotensin system – an endocrine and paracrine system. Endocrinology 144, 2179–2183. [DOI] [PubMed] [Google Scholar]
- Li W, Moore MJ, Vasilieva N, Sui J, Wong SK, Berne MA, Somasundaran M, Sullivan JL, Luzuriaga K, Greenough TC, Choe H & Farzan M (2003). Angiotensin‐converting enzyme 2 is a functional receptor for the SARS coronavirus. Nature 426, 450–454. [DOI] [PMC free article] [PubMed] [Google Scholar]
- Lin Z, Chen Y, Zhang W, Chen A, Lin S & Morris M (2008). RNA interference shows interactions between brainstem angiotensin AT1 receptors and ACE2. Exp Physiol 93, in press. [DOI] [PubMed] [Google Scholar]
- Lippoldt A, Paul M, Fuxe K & Ganten D (1995). The brain renin‐angiotensin system: molecular mechanisms of cell to cell interactions. Clin Exp Hypertens 17, 251–266. [DOI] [PubMed] [Google Scholar]
- Lu B, Gerard NP, Kolakowski LF Jr, Bozza M, Zurakowski D, Finco O, Carroll MC & Gerard C (1995). Neutral endopeptidase modulation of septic shock. J Exp Med 181, 2271–2275. [DOI] [PMC free article] [PubMed] [Google Scholar]
- McKinley MJ, Albiston AL, Allen AM, Mathai ML, May CN, McAllen RM, Oldfield BJ, Mendelsohn FA & Chai SY (2003). The brain renin‐angiotensin system: location and physiological roles. Int J Biochem Cell Biol 35, 901–918. [DOI] [PubMed] [Google Scholar]
- Morimoto S & Sigmund CD (2002). Angiotensin mutant mice: a focus on the brain renin‐angiotensin system. Neuropeptides 36, 194–200. [DOI] [PubMed] [Google Scholar]
- Ocaranza MP, Godoy I, Jalil JE, Varas M, Collantes P, Pinto M, Roman M, Ramirez C, Copaja M, Az‐Araya G, Castro P & Lavandero S (2006). Enalapril attenuates downregulation of angiotensin‐converting enzyme 2 in the late phase of ventricular dysfunction in myocardial infarcted rat. Hypertension 48, 572–578. [DOI] [PubMed] [Google Scholar]
- Odya CE, Marinkovic DV, Hammon KJ, Stewart TA & Erdos EG (1978). Purification and properties of prolylcarboxypeptidase (angiotensinase C) from human kidney. J Biol Chem 253, 5927–5931. [PubMed] [Google Scholar]
- Paul M, Poyan MA & Kreutz R (2006). Physiology of local renin‐angiotensin systems. Physiol Rev 86, 747–803. [DOI] [PubMed] [Google Scholar]
- Raizada MK & Ferreira AJ (2007). ACE2: a new target for cardiovascular disease therapeutics. J Cardiovasc Pharmacol 50, 112–119. [DOI] [PubMed] [Google Scholar]
- Rice GI, Jones AL, Grant PJ, Carter AM, Turner AJ & Hooper NM (2006). Circulating activities of angiotensin‐converting enzyme, its homolog, angiotensin‐converting enzyme 2, and neprilysin in a family study. Hypertension 48, 914–920. [DOI] [PubMed] [Google Scholar]
- Rice GI, Thomas DA, Grant PJ, Turner AJ & Hooper NM (2004). Evaluation of angiotensin‐converting enzyme (ACE), its homologue ACE2 and neprilysin in angiotensin peptide metabolism. Biochem J 383, 45–51. [DOI] [PMC free article] [PubMed] [Google Scholar]
- Rioli V, Kato A, Portaro FC, Cury GK, Te Kaat K, Vincent B, Checler F, Camargo AC, Glucksman MJ, Roberts JL, Hirose S & Ferro ES (1998). Neuropeptide specificity and inhibition of recombinant isoforms of the endopeptidase 3.4.24.16 family: comparison with the related recombinant endopeptidase 3.4.24.15. Biochem Biophys Res Commun 250, 5–11. [DOI] [PubMed] [Google Scholar]
- Rogerson FM, Schlawe I, Paxinos G, Chai SY, McKinley MJ & Mendelsohn FA (1995). Localization of angiotensin converting enzyme by in vitro autoradiography in the rabbit brain. J Chem Neuroanat 8, 227–243. [DOI] [PubMed] [Google Scholar]
- Saavedra JM (1992). Brain and pituitary angiotensin. Endocrine Rev 13, 329–380. [DOI] [PubMed] [Google Scholar]
- Sakima A, Averill DB, Gallagher PE, Kasper SO, Tommasi EN, Ferrario CM & Diz DI (2005). Impaired heart rate baroreflex in older rats: role of endogenous angiotensin‐(1–7) at the nucleus tractus solitarii. Hypertension 46, 333–340. [DOI] [PubMed] [Google Scholar]
- Santos RA, Simoes e Silva AC, Maric C, Silva DM, Machado RP, De Buhr I, Heringer‐Walther S, Pinheiro SV, Lopes MT, Bader M, Mendes EP, Lemos VS, Campagnole‐Santos MJ, Schultheiss HP, Speth R & Walther T (2003). Angiotensin‐(1–7) is an endogenous ligand for the G protein‐coupled receptor Mas. Proc Natl Acad Sci USA 100, 8258–8263. [DOI] [PMC free article] [PubMed] [Google Scholar]
- Shaltout HA, Westwood BM, Averill DB, Ferrario CM, Figueroa JP, Diz DI, Rose JC & Chappell MC (2007). Angiotensin metabolism in renal proximal tubules, urine, and serum of sheep: evidence for ACE2‐dependent processing of angiotensin II. Am J Physiol Renal Physiol 292, F82–F91. [DOI] [PubMed] [Google Scholar]
- Tipnis SR, Hooper NM, Hyde R, Karran E, Christie G & Turner AJ (2000). A human homolog of angiotensin‐converting enzyme. Cloning and functional expression as a captopril‐insensitive carboxypeptidase. J Biol Chem 275, 33238–33243. [DOI] [PubMed] [Google Scholar]
- Tomlinson KC, Gardiner SM & Bennett T (1990). Central effects of angiotensins I and II in conscious streptozotocin‐treated rats. Am J Physiol Regul Integr Comp Physiol 258, R1147–R1156. [DOI] [PubMed] [Google Scholar]
- Turner AJ, Isaac RE & Coates D (2001). The neprilysin (NEP) family of zinc metalloendopeptidases: genomics and function. Bioessays 23, 261–269. [DOI] [PubMed] [Google Scholar]
- Vickers C, Hales P, Kaushik V, Dick L, Gavin J, Tang J, Godbout K, Parsons T, Baronas E, Hsieh F, Acton S, Patane M, Nichols A & Tummino P (2002). Hydrolysis of biological peptides by human angiotensin‐converting enzyme‐related carboxypeptidase. J Biol Chem 277, 14838–14843. [DOI] [PubMed] [Google Scholar]
- Welches WR, Brosnihan KB & Ferrario CM (1993). A comparison of the properties and enzymatic activities of three angiotensin processing enzymes: angiotensin converting enzyme, prolyl endopeptidase and neprilysin. Life Sci 52, 1461–1480. [DOI] [PubMed] [Google Scholar]
- Welches WR, Santos RA, Chappell MC, Brosnihan KB, Greene LJ & Ferrario CM (1991). Evidence that prolyl endopeptidase participates in the processing of brain angiotensin. J Hypertens 9, 631–638. [DOI] [PubMed] [Google Scholar]
- Wright JW & Harding JW (1992). Regulatory role of brain angiotensins in the control of physiological and behavioral responses. Brain Res Rev 17, 227–262. [DOI] [PubMed] [Google Scholar]
- Wysocki J, Ye M, Soler MJ, Gurley SB, Xiao HD, Bernstein KE, Coffman TM, Chen S & Batlle D (2006). ACE and ACE2 activity in diabetic mice. Diabetes 55, 2132–2139. [DOI] [PubMed] [Google Scholar]
- Yamamoto K, Chappell MC, Brosnihan KB & Ferrario CM (1992). In vivo metabolism of angiotensin I by neutral endoeptidase (EC 3.4.24.11) in spontaneously hypertensive rats. Hypertension 19, 692–696. [DOI] [PubMed] [Google Scholar]
- Yan ZH, Ren KJ, Wang Y, Chen S, Brock TA & Rege AA (2003). Development of intramolecularly quenched fluorescent peptides as substrates of angiotensin‐converting enzyme 2. Anal Biochem 312, 141–147. [DOI] [PubMed] [Google Scholar]