

ABSTRACT
Background
Unexplained heterogeneity in clinical trials has resulted in questions regarding the effectiveness of ɣ-linolenic acid (GLA)-containing botanical oil supplements. This heterogeneity may be explained by genetic variation within the fatty acid desaturase (FADS) gene cluster that is associated with circulating and tissue concentrations of arachidonic acid (ARA) and dihomo-ɣ-linolenic acid (DGLA), both of which may be synthesized from GLA and result in proinflammatory and anti-inflammatory metabolites, respectively.
Objectives
The objective of this study was to prospectively compare the capacity of a non-Hispanic white cohort, stratified by FADS genotype at the key single-nucleotide polymorphism (SNP) rs174537, to metabolize 18-carbon omega-6 (n-6) PUFAs in borage oil (BO) and soybean oil (SO) to GLA, DGLA, and ARA.
Methods
Healthy adults (n = 64) participated in a randomized, double-blind, crossover intervention. Individuals received encapsulated BO (Borago officinalis L.; 37% LA and 23% GLA) or SO [Glycine max (L.) Merr.; 50% LA and 0% GLA] for 4 wk, followed by an 8-wk washout period, before consuming the opposite oil for 4 wk. Serum lipids and markers of inflammation (C-reactive protein) were assessed for both oil types at baseline and during weeks 2 and 4 of the intervention.
Results
SO supplementation failed to alter circulating concentrations of any n-6 long-chain PUFAs. In contrast, a modest daily dose of BO elevated serum concentrations of GLA and DGLA in an rs174537 genotype–dependent manner. In particular, DGLA increased by 57% (95% CI: 0.38, 0.79) in GG genotype individuals, but by 141% (95% CI: 1.03, 2.85) in TT individuals. For ARA, baseline concentrations varied substantially by genotype and increased modestly with BO supplementation, suggesting a key role for FADS variation in the balance of DGLA and ARA.
Conclusions
The results of this study clearly suggest that personalized and population-based approaches considering FADS genetic variation may be necessary to optimize the design of future clinical studies with GLA-containing oils. This trial was registered at clinicaltrials.gov as NCT02337231.
Keywords: PUFAs, n-3 fatty acids, n-6 fatty acids, gene–diet interaction, gamma-linolenic acid, borage oil, randomized cross-over design, soybean oil, arachidonic acid, precision nutrition
Introduction
ɣ-Linolenic acid (GLA; 18:3) is an omega-6 (n-6), 18-carbon PUFA found in several seed oils, including evening primrose [∼10% of total fatty acids (FAs)] and borage (∼21%). While many types of studies (in vitro, in vivo, animal, and human) have shown that GLA-containing oils reduce inflammatory processes and impact inflammatory diseases [rheumatoid arthritis, asthma and atopic dermatitis (1–10)], there is large unexplained heterogeneity in results of clinical studies, and recent meta-analyses have called into question the efficacy of these oils (11–15). The putative molecular mechanisms by which GLA-containing oils act appear to originate in large part from the metabolic elongation of GLA [by the elongation of very long-chain FAs (ELOVL) by ELOVL5-encoded enzymatic activity] to dihomo-ɣ-linolenic acid (DGLA; 20:3n6) (Figure 1) (16–18). Oxidative metabolites of DGLA have anti-inflammatory, antiproliferative, antiatherogenic, and vasodilation effects (18–30). DGLA can be further metabolized to arachidonic acid (ARA; 20:4n6) through a Δ-5 desaturase step encoded by the FADS1 gene within the FA desaturase (FADS) gene cluster. In contrast to DGLA, ARA-derived bioactive lipids are generally proinflammatory (26, 31). These factors may contribute to the complexity of interpreting results gathered from GLA supplementation studies in terms of their impact on inflammatory-based diseases.
FIGURE 1.
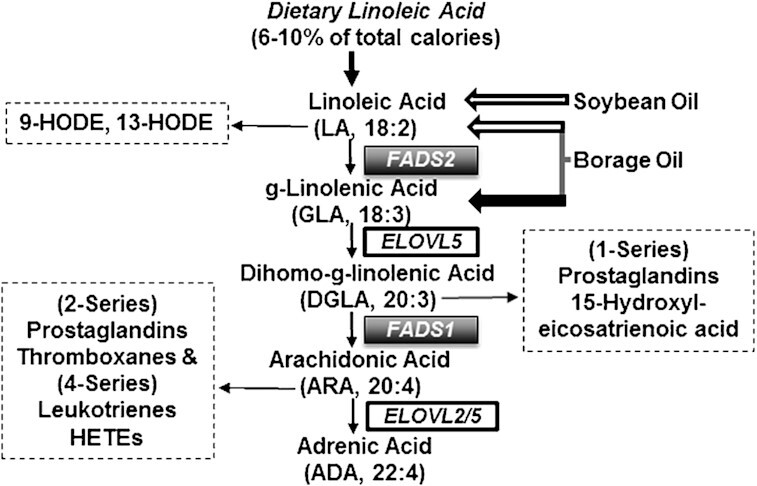
Omega 6 PUFA pathway. The PUFA metabolic pathway consists of alternating desaturation (FADS) and carbon chain elongation (ELOVL) steps. The FAs administered in botanical oil supplements (LA and GLA) enter the pathway as shown. The bioactive lipids derived from DGLA and ARA are indicated. The omega 6 (n-6) side of the pathway is shown, but the same enzymes utilize omega-3 (n-3) substrates (not shown) in a competitive manner. Bioactive lipid mediators derived from n = 6 PUFAs are indicated in dashed boxes. ARA, arachidonic acid; DGLA, dihomo-ɣ-linolenic acid; FADS, FA desaturase; ELOVL, elongation of very long-chain FAs; GLA, ɣ-linolenic acid; HETE, hydroxyeicosatetraenoic acid; HODE, hydroxyoctadecadienoic acid; LA, linoleic acid.
The Δ-6 (FADS2) and Δ-5 (FADS1) desaturation steps (Figure 1), which form GLA from LA and ARA from DGLA, respectively, were once assumed to have uniform metabolic efficiency across individuals and populations. However, considerable evidence now indicates that common genetic and epigenetic variations in the FADS1/2 genes markedly impact the overall rate of conversion of LA to ARA. In fact, the strongest FADS genetic associations observed to date are for ratios of ARA- to DGLA-containing lipids (a surrogate measure for FADS1 activity), with minor alleles consistently associated with decreased ARA and increased DGLA concentrations (32–34). Importantly, the frequencies of FADS cluster variants differ dramatically among different global populations (33, 35–44).
Together, these findings raise important questions regarding the impact of supplementation with GLA-containing oils in diverse populations. Importantly, they suggest that a generalized “one size fits all” dietary supplementation approach may not be appropriate or safe. A key hypothesis arising from previous studies is that the impact of GLA consumption and its subsequent metabolism depend on FADS1 variant–associated metabolic efficiency. Specifically, an inefficient conversion phenotype would result in the accumulation of DGLA-containing lipids. In contrast, the efficient converter phenotype would exhibit increased ARA-containing lipids at the expense of DGLA-containing lipids. We tested this hypothesis utilizing a prospective, crossover efficacy trial of GLA supplementation in a European-ancestry population stratified by the FADS genotypes at rs174537.
Methods
Study overview
This study was designed to examine how GLA supplementation changes serum FA concentrations, particularly concentrations of GLA, DGLA, and ARA, and to determine whether the changes vary by genotype at rs174537. We employed a double-blinded, randomized, crossover study design using 2 botanical oils—borage oil (BO), a source of GLA, as the treatment, and soybean oil (SO), which lacks GLA but contains LA, as the control (45). In this design, illustrated in Figure 2B, all subjects received both oils, albeit in random order. Biospecimens (fasting blood and urine), vital signs (blood pressure and resting heart rate), and morphometric measurements (waist and hip circumference, height, BMI in kg/m2, and body fat percentage) were obtained at baseline, and at week 2 and 4 for each supplementation phase. An 8-wk washout period was used between the 2 oil supplementation periods. The primary outcomes were concentrations of circulating GLA, DGLA, and ARA.
FIGURE 2.
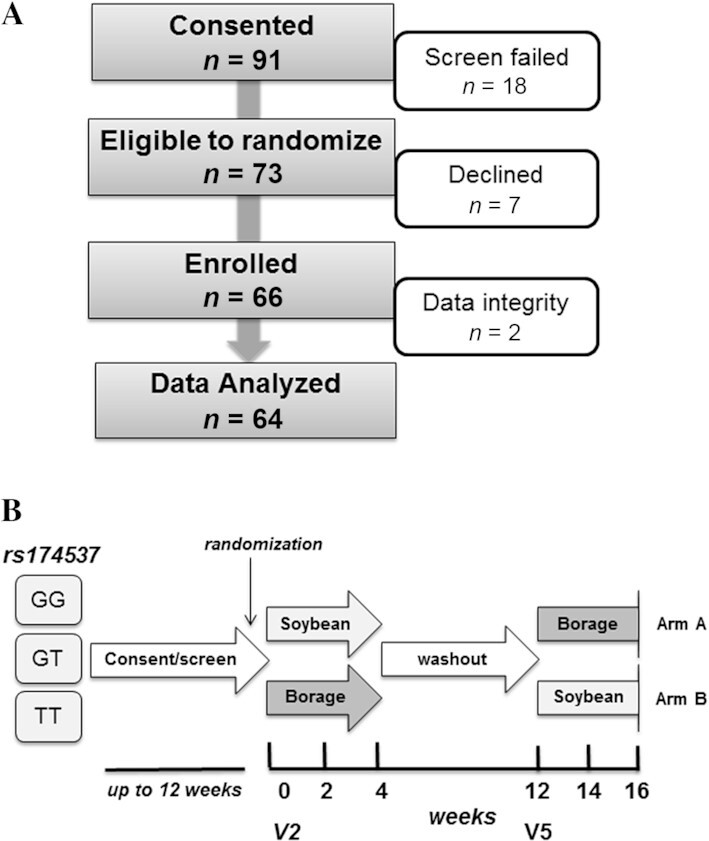
Recruitment and study design. (A) The recruitment and retention summary is shown for this nutritional intervention study. (B) The study design is that of a double-blind, randomized, crossover type. Participants were stratified by the FADS SNP rs174537 genotype (GG, GT, TT). After the consenting and screening process, eligible subjects (of each genotype) were randomized to begin 4-wk consumption of either daily soybean or borage oil capsules, followed by an 8-wk washout period and then another 4-wk period of consumption of the opposite oil. Participant genotype and oil consumption order were blind to both the participants and study team. The 2 baseline visits (V2 and V5) preceding the 2 supplementation periods are indicated. FADS, FA desaturase gene; GLA, ɣ-linolenic acid; SNP, single-nucleotide polymorphism; V, visit.
Study subjects
This study was conducted at the Wake Forest Baptist Medical Center (WFBMC), and was reviewed and approved by the Wake Forest University Health Sciences Institutional Review Board (IRB) and NIH/Office of Clinical and Regulatory Affairs. The inclusion criteria were healthy, self-identifying non-Hispanic white adults of European ancestry, age 21 to 65 y, free of major diseases, and previously genotyped at rs174537 through a concurrent IRB-approved screening study. Participant exclusion criteria included the following: 1) current use of anti-inflammatory drugs [nonsteroidal anti-inflammatory drugs (NSAIDs), oral/IV steroids, other injection anti-inflammatory drugs], >100 mg aspirin per d, leukotriene receptor antagonists, niacin, fibrates, or fish oil; 2) blood pressure >130/90 mm/Hg; 3) fasting blood triglycerides >150 mg/dL, fasting blood glucose >125 mg/dL; 4) having a pacemaker, defibrillator, or myocardial infarction; vascular surgery; or stroke in the preceding year; 5) any stage of heart failure, prior cholecystectomy, or end-stage renal disease; 6) BMI < 19 or > 30 kg/m2; 7) pregnancy; 8) alcohol use > 14 drinks per wk; 9) self-reported current tobacco smoking or other illicit drug use; and 10) intolerance or allergy to BO or SO. A summary of the recruitment and enrollment numbers for the 16-wk study is shown in Figure 2A. Written informed consent was obtained from all subjects at an initial screening visit. Participants were asked to report any change in their medical condition at each study visit.
Randomization, compliance, and dropout
Consented participants were stratified by genotype at rs174537 and randomized within strata into 1 of the 2 oil consumption sequences (SO followed by BO [Arm A] or BO followed by SO [Arm B]) as shown in Figure 2B. Block randomization was used to ensure approximately equal accrual to each sequence from each stratum over time. The study staff and participants were blinded to both genotype and oil supplement assignment.
Compliance was monitored by multiple mechanisms, including serum FA profiles at week 2 and 4 of the intervention, the capsule log, and counts of returned capsules at each visit. Subjects used a log to record intake of study oils on a daily basis. Returned capsule counts indicated that an average of 94.6% of capsules were consumed as directed. Only 4 participants (6.3%) consumed <80% of their oil supplements.
Dietary oil supplements
The oils used in this study were obtained from borage seeds (Borago officinalis L.; 23% GLA, 37% LA) and soybeans (Glycine max (L.) Merr.; 0% GLA, 50% LA) and were generously supplied by Nordic Naturals. Subjects in each arm consumed a total of 10 oil capsules (1.2 g oil/capsule) daily with half consumed at morning meals and half consumed at evening meals. As shown in Table 1 (right 2 columns), the LA dosage provided by the SO (control arm) and BO (experimental arm) capsules were 5.27 g/d and 4.11 g/d, respectively. The GLA dosages provided by the SO and BO capsules were 0 g/d and 2.54 g/d, respectively. For comparison, supplemental GLA has been safely administered in clinical trials at oral doses of ≤2.8 g/d for up to 1 y. The physical appearance of the soft gelatin oil capsules was indistinguishable. Participants were advised to consume their normal diet but to minimize fish intake during the supplementation period, refrain from self-medication with anti-inflammatory drugs, and inform the study staff about any health concerns during the study. The same dietary advice was given for the 8-wk washout period.
TABLE 1.
FA profile of encapsulated study oils1
| FA profile of encapsulated oil | PUFA from supplementation, g/d | ||||
|---|---|---|---|---|---|
| Common name | FA | Soybean, area % | Borage, area % | Soybean | Borage |
| Palmitic | C16:0 | 10.5 | 10.2 | 1.09 | 1.13 |
| Stearic | C18:0 | 4.5 | 4.0 | 0.59 | 0.44 |
| Oleic | C18:1 n-9c | 24.4 | 15.7 | 2.50 | 1.73 |
| Vaccenic | C18:1 n-7c | 1.5 | 0.6 | 0.16 | 0.06 |
| Linoleic | C18:2 n-6c | 49.7 | 37.3 | 5.27 | 4.11 |
| γ-Linolenic | C18:3 n-6 | — | 23.0 | — | 2.54 |
| α-Linolenic | C18:3 n-3 | 6.2 | 0.2 | 0.68 | 0.02 |
| Stearidonic | C18:4 n-3 | — | 0.2 | — | 0.02 |
| Arachidic | C20:0 | 0.4 | 0.2 | 0.03 | 0.03 |
| Gondoic | C20:1 n-9 | 0.3 | 4.2 | 0.02 | 0.46 |
| Eicosadienoic | C20:2 n-6 | — | 0.2 | — | 0.02 |
| Behenic | C22:0 | 0.4 | 0.1 | 0.03 | 0.02 |
| Euricic | C22:1 n-9 | — | 2.6 | — | 0.29 |
| Nervonic | C24:1 n-9 | — | 1.3 | — | 0.15 |
| Others | 0.1 | 0.1 | — | 0.01 | |
| Total | 98.0 | 99.9 | 10.37 | 11.02 | |
FA profiles of the control (soybean) and experimental (borage) oils are derived from in-house quality control analyses and are in agreement with those stated on vendor-supplied certificates of analysis. The dose of FAs was provided in the 10 capsules consumed daily by participants. FA, fatty acid; LA, linoleic; GLA, γ-linolenic.
A significant due diligence process was undertaken to identify high-quality oil products from reliable vendors (46). All relevant vendor-derived product documentation was obtained and archived. The results of in-house FA analyses found profiles of the oil products to be comparable to those stated in vendor documentation. Table 1 shows the FA composition (derived from in-house analyses) of each oil and the daily dose of these FAs. Figure 1 shows the primary entry points where target PUFAs (LA in SO and BO, GLA in BO) in these oil supplements enter the long-chain (LC)–PUFA biosynthetic pathway.
Prior to final oil product approval and encapsulation, the oils were authenticated and subjected to thorough evaluation (FA profile, oxidation status, and endogenous and exogenous contaminants) by the Botanical and Quality Assurance Core Lab within the Wake Forest School of Medicine Center for Botanical Lipids and Inflammatory Disease Prevention. The quality of the encapsulated oil products was monitored (FA profile and oxidation status) over the course of the study. Archival samples have been maintained. Thus, the study products and associated documentation were obtained, analyzed, inventoried, dispensed, and archived with the same rigor typical of that used for drug studies, with the goal of generating reproducible results from the clinical trial (47, 48).
Fatty acid analysis
Total serum FAs were analyzed from fasting blood, and concentrations of GLA, DGLA, and ARA were the primary outcome measures for this study. FA methyl esters (FAMEs) were prepared (49) after alkaline hydrolysis of complex lipids in duplicate samples (100 μL) in the presence of an internal standard (triheptadecanoin, Nuchek Prep; included for purposes of FA quantification) as previously described (50, 51). A standard panel of 26 FAs (which accounted for 99% of the FAs in the samples) was quantified by gas chromatography with flame ionization detection (GC-FID) using an HP5890 instrument with a DB-23 column (30 m, 0.25 mm ID, 0.25 µm film) fitted with an inert precolumn (1 m, 0.53 mm ID) for cool on-column injection. The instrument response factor was calculated based on the use of external standard sets for quality assurance purposes, and a mixture of known FAMEs was run with each sample set to monitor instrument performance (45). Individual FAs are expressed as percentage of total FAs in each sample.
The FA composition of the oil supplements (Table 1) was determined in aliquots of oil quantitative dilutions (in hexane) and processed as described above in the presence of the internal standard. For the purposes of product authentication, individual FAs in oil products are expressed as area percentage (Table 1) to facilitate comparison with vendor documentation of product FA profile. The daily FA doses derived from each oil were calculated from units of grams FA/grams oil. The integrity of the encapsulated oils was monitored over time by routine evaluation of FA content and oxidation status to ensure that a high-quality product was provided to participants. For the oxidation status of oils, standard food industry assays were employed. These included peroxide value [PV; primary oxidants; iodometric titration assay (52); European Pharmacopeia 2.5.5], anisidine value [AV; secondary oxidants; colorimetric assay (53); European Pharmacopeia 2.5.36], and Totox (total oxidation = 2PV + AV).
Biochemical measurements
Routine cardiometabolic and inflammatory biomarkers were measured as secondary outcomes. Serum derived from fasting blood was used to measure glucose (enzymatic assay), high-sensitivity C-reactive protein (hsCRP; immunochemoluminometric assay), and serum lipids (total cholesterol, triglycerides, and HDL, VLDL, and LDL cholesterol; enzymatic assays). Urinary creatinine concentrations were measured with spectrophotometric assay in order to normalize data of future urine analyses. An assessment of hepatic function (7 analyte panels measured in serum) was performed only at the screening stage and used to evaluate healthy baseline screening status. The hepatic function tests conducted included alkaline phosphatase (kinetic assay), albumin (colorimetric assay), total protein (colorimetric assay), total and direct bilirubin (colorimetric assay), and aspartate (serum glutamic oxaloacetic transaminase) and alanine aminotransferase (kinetic assays). These endpoints were analyzed by a qualified clinical laboratory (Lab Corp).
Data analysis
All statistical analyses were conducted in R version 3.5.0 (54). For each subject, we examined change in measured FAs as the percentage of total FAs over time, focusing on LA, GLA, DGLA, and ARA as illustrated in Figure 1 and their ratios (GLA/LA, DGLA/GLA, and ARA/DGLA), which serve as surrogates for the (steady-state) enzymatic activity along the steps of the LC-PUFA biosynthetic pathway. We additionally examined the important n-3 LC-PUFAs EPA, DPA, and DHA.
The distribution of each FA was first examined for outliers, and the values were plotted over time for each subject. Values for individual FAs are relative abundances (percentage of total FA) and hence are compositional in nature. For the statistical models, FA outcomes were first log-ratio transformed [i.e., xnew = log(x/1 − x), where x is an FA proportion] as is appropriate for compositional data (55). All model results were back-transformed to percentage of total FAs for interpretation and presentation.
Baseline FA values were stratified by genotype and compared using a linear model with the FA as the outcome and genotype as the explanatory variable, with age and sex also included. The washout period was evaluated by comparing FA measurements from each individual subject at the beginning of each oil supplementation period (i.e., V2 and V5) with a paired t-test. To assess how responses to supplementation over time varied by genotype, for each FA we fitted a linear mixed-effects model with a random intercept for each subject. Several choices for the correlation structure of the repeated measurements were compared using likelihood ratio tests, and a heterogeneous autoregressive AR (1) model was used based on those results. The main explanatory variables in the models were rs174537 genotype under an additive model (i.e., 0, 1, or 2 copies of the T allele), data collection time period (0, 2, or 4 wk), oil type (BO or SO), as well as their interactions. As FA concentrations can vary by age and sex, those variables were included as covariates. A term for study arm (oil sequence) was also included but was consistently found to have small and nonsignificant estimated effects. The mixed-effects models were fit using the nlme R package (56) with maximum likelihood (ML) used for model comparison and restricted ML used for parameter estimation.
For another perspective on the data, in addition to the mixed-model analyses, we also looked at fold-change from baseline in subjects who completed both arms of the study (n = 53; Table 4). For each subject, fold changes from baseline values were computed for the 4 FAs illustrated in Figure 1 (i.e., LA, GLA, DGLA, and ARA) as well as for the n-3 LC-PUFAs EPA, DPA, and DHA. A linear model was then used to assess the effects of supplementation, with oil examined separately. For each FA, a linear regression was performed with log-fold change from baseline as the outcome and genotype as the primary covariate (additive genetic model), adjusted for age, sex, and study arm.
TABLE 4.
Evidence of a gene–diet interaction for BO1
| BO | SO | |||||||
|---|---|---|---|---|---|---|---|---|
| FA rs174537 genotype | Change in total FAs, % | 4-wk fold change | Change in total FAs, % | 4-wk fold-change | ||||
| Estimate | 95% CI | Estimate | 95% CI | Estimate | 95% CI | Estimate | 95% CI | |
| LA | ||||||||
| GG | −1.66 | −1.94, −1.37 | 0.95 | 0.92, 0.99 | 1.05 | 0.75, 1.36 | 1.02 | 0.97, 1.07 |
| GT | −2.16 | −2.33, −1.97 | 0.94 | 0.92, 0.96 | 1.19 | 0.97, 1.41 | 1.03 | 0.99, 1.06 |
| TT | −2.65 | −2.96, −2.31 | 0.93 | 0.92, 0.97 | 1.32 | 0.92, 1.75 | 1.04 | 0.98, 1.11 |
| GLA* | ||||||||
| GG | 0.80 | 0.67, 0.97 | 3.01 | 2.42, 3.74 | 0.03 | 0.02, 0.04 | 1.07 | 0.97, 1.11 |
| GT | 0.96 | 0.85, 1.09 | 4.21 | 3.63, 4.88 | 0.00 | 0.00, 0.00 | 0.99 | 0.94, 1.03 |
| TT | 1.09 | 0.85, 1.39 | 5.89 | 4.42, 7.86 | −0.02 | −0.01, −0.02 | 0.93 | 0.88, 0.97 |
| DGLA* | ||||||||
| GG | 0.80 | 0.69, 0.91 | 1.57 | 1.38, 1.79 | −0.08 | −0.09, −0.07 | 0.94 | 0.87, 1.02 |
| GT | 1.46 | 1.34, 1.58 | 1.94 | 1.78, 2.12 | −0.10 | −0.10, −0.09 | 0.94 | 0.89, 1.00 |
| TT | 2.38 | 2.03, 2.79 | 2.41 | 2.03, 2.85 | −0.12 | −0.13, −0.11 | 0.95 | 0.85, 1.05 |
| ARA | ||||||||
| GG | 1.38 | 1.27, 1.50 | 1.19 | 1.17, 1.27 | −0.07 | −0.07, −0.07 | 1.00 | 0.94, 1.07 |
| GT | 1.12 | 1.06, 1.19 | 1.18 | 1.13, 1.24 | −0.26 | −0.25, −0.27 | 0.98 | 0.94, 1.02 |
| TT | 0.90 | 0.80, 1.02 | 1.18 | 1.08, 1.28 | −0.37 | −0.33, −0.41 | 0.95 | 0.88, 1.04 |
| EPA | ||||||||
| GG | −0.10 | −0.08, −0.12 | 0.79 | 0.68, 0.92 | −0.01 | −0.01, −0.01 | 1.01 | 0.88, 1.16 |
| GT | −0.05 | −0.05, −0.06 | 0.85 | 0.77, 0.94 | 0.00 | 0.00, 0.00 | 0.99 | 0.90, 1.09 |
| TT | −0.02 | −0.01, −0.02 | 0.92 | 0.75, 1.12 | 0.00 | 0.00, 0.00 | 0.97 | 0.80, 1.17 |
| DPA | ||||||||
| GG | −0.03 | −0.03, −0.03 | 0.94 | 0.87, 1.02 | 0.00 | 0.00, 0.00 | 1.03 | 0.97, 1.10 |
| GT | −0.01 | −0.01, −0.01 | 0.97 | 0.92, 1.03 | 0.00 | −0.01,0.01 | 0.99 | 0.95, 1.03 |
| TT | 0.00 | 0.00, 0.00 | 1.01 | 0.90, 1.12 | −0.01 | −0.01, 0.01 | 0.95 | 0.88, 1.03 |
| DHA | ||||||||
| GG | −0.06 | −0.07, −0.05 | 0.95 | 0.88, 1.02 | −0.10 | −0.11, −0.09 | 0.92 | 0.85, 0.99 |
| GT | −0.04 | −0.05, −0.04 | 0.96 | 0.91, 1.01 | −0.05 | −0.05, −0.04 | 0.96 | 0.91, 1.01 |
| TT | −0.02 | −0.03, −0.02 | 0.98 | 0.88, 1.08 | 0.00 | 0.00, 0.00 | 1.00 | 0.90, 1.10 |
Changes from baseline for important n-3 and n-6 PUFAs and LC-PUFAs over the course of this study for both oils. Differences between week 4 and week 0 FA values and 95% CIs were estimated from mixed-effects models using all subjects (n = 64). Fold-change values and CIs were computed for all subjects who completed both supplementation periods and had data for both time points (n = 53). The asterisked fatty acids highlight the values for GLA and DGLA on BO, the main focus of this study. For GLA, similar increases in percentages of total FAs were seen across genotypes (an increase of ∼1% of total FAs). The fold-change values varied substantially, but these differences were not significant, P = 0.0024, at our conservative α. In contrast, the increase in DGLA as the percentage of total FAs varied by the number of T alleles, P = 0.0002, reflecting the gene–diet interaction. ARA values varied by genotype at baseline and increased by about 18% in all 3 genotypes. We did not observe meaningful changes with SO supplementation. ARA, arachidonic acid; BO, borage oil; DGLA, dihomo-ɣ-linolenic acid; DPA, docosapentaenoic acid; FA, fatty acid; GLA, ɣ-linolenic acid; LA, linoleic acid; LC, long chain; n-3, omega-3; n-6, omega-6; SO, soybean oil.
Due to the large number of hypothesis tests conducted herein (10 FAs or FA ratios × ∼10 tests = ∼100 tests), we adopted a conservative threshold of P = 0.05/100 = 0.0005 for statistical significance. Furthermore, following recent recommendations of the statistical community (57), we avoided simple dichotomization of results based on a significance threshold and instead focused on estimates, their CIs, and their biological significances. The Consolidated Standards of Reporting Trials randomized controlled trial reporting guidelines were used as a checklist reporting tool for this study (58).
Results
Characteristics of the participant population
As shown in Figure 2A, n = 73 (80%) of the 91 consented individuals were eligible to participate in this study. Of the consented participants, n = 66 of those individuals were randomly assigned and enrolled in the intervention. Based on an intention-to-treat analysis, data from 64 participants were used in the final analyses. At the recommendation of the WFBMC Research Integrity Office, 2 participants were removed from all analyses due to conflicting information regarding their random assignment and treatment. Information indicated that in those 2 cases, the treatments were partially or completely reversed. As the primary goal of this study was to estimate changes in FA concentrations due to BO supplementation by genotype, deliberate inclusion of incorrect treatment data would bias the estimates of interest. For this reason, we employed a modified intention-to-treat analysis with a final sample size of n = 64 subjects. The characteristics of this study population are detailed in Table 2. Of the participants who began the intervention, a total of n = 11 participants did not complete the intervention. Reasons for dropping out included scheduling conflicts (n = 3), elevated C-reactive protein on 2 occasions (n = 3), the need to use NSAID medications (n = 2), gastrointestinal upset (n = 1), difficulty swallowing oil capsules (n = 1), and pregnancy (n = 1).
TABLE 2.
Baseline demographics of the study cohort1
| Subject genotype | |||
|---|---|---|---|
| GG | GT | TT | |
| Female, % | 92 | 66.7 | 55.6 |
| n | 25 | 30 | 9 |
| Age, years | 39.7 ± 12.7 | 40.6 ± 11.7 | 41.3 ± 9.9 |
| Systolic BP | 110.1 ± 11.46 | 111.9 ± 13.0 | 113.1 ± 11.0 |
| Diastolic BP | 66.0 ± 7.04 | 69.3 ± 9.2 | 71.73 ± 9.9 |
| Resting HR | 66.6 ± 9.39 | 67.0 ± 12.7 | 70.3 ± 11.17 |
| Weight, kg | 65.0 ± 9.7 | 73.2 ± 11.0 | 71.9 ± 13.2 |
| Body fat, % | 29.6 ± 7.5 | 28.21 ± 9.4 | 25.8 ± 9.1 |
| BMI, kg/m2 | 23.2 ± 2.8 | 24.9 ± 2.9 | 24.4 ± 2.7 |
| Waist, cm | 69.7 ± 6.3 | 78.2 ± 7.9 | 76.3 ± 12.1 |
| Hip, cm | 94.8 ± 7.8 | 98.0 ± 6.4 | 96.2 ± 6.4 |
| Waist/hip ratio | 0.74 ± 0.04 | 0.80 ± 0.07 | 0.79 ± 0.08 |
Values are the means ± SDs at the visit 2 baseline before oil supplementation for the 64 participants who began the intervention. HR, heart rate.
Baseline differences in PUFAs and LC-PUFAs by rs174537 genotype
In agreement with previous studies, there were significant baseline (nonsupplemented) differences by rs174537 genotype in the concentrations of ARA and the FA ratios GLA/LA, DGLA/GLA, and ARA/DGLA (32, 33, 35). Table 3 shows these baseline (unsupplemented) results for the primary FAs and FA ratios examined in this study; boxplots are shown for both FAs and FA ratios at baseline in Supplemental Figure 1. Importantly, ARA showed highly significant (P = 1.59 × 10⁻⁵) baseline differences between genotype groups, with each copy of the T allele corresponding to a decrease of 1.39 percentage points (95% CI: 0.95,1.84), such that the average values of ARA were 8.13% for those with the GG genotype but only 5.39% for TT individuals (i.e., representing the inefficient haplotype). The ARA/DGLA ratio, reflecting FADS1 activity, was also highly genotype dependent (GG, 5.67 > GT, 4.20 > TT, 3.11; P = 1.76 × 10⁻¹¹).
TABLE 3.
Baseline FA and FA ratio values by genotype1
| FA or FA ratio rs174537 genotype | Baseline | ||
|---|---|---|---|
| Mean | 95% CI | P value | |
| LA | |||
| GG | 35.13 | 33.79, 36.50 | 0.76 |
| GT | 35.34 | 34.40, 36.29 | |
| TT | 35.55 | 33.68, 37.46 | |
| GLA | |||
| GG | 0.42 | 0.35, 0.50 | 0.0002 |
| GT | 0.30 | 0.26, 0.33 | |
| TT | 0.21 | 0.16, 0.27 | |
| DGLA | |||
| GG | 1.44 | 1.30, 1.59 | 0.07 |
| GT | 1.58 | 1.47, 1.69 | |
| TT | 1.73 | 1.51, 1.98 | |
| ARA | |||
| GG | 8.13 | 7.48, 8.83 | 1.59 × 10⁻⁵ |
| GT | 6.63 | 6.25, 7.02 | |
| TT | 5.39 | 4.78, 6.07 | |
| EPA | |||
| GG | 0.48 | 0.40, 0.57 | 0.0024 |
| GT | 0.36 | 0.32, 0.41 | |
| TT | 0.28 | 0.22, 0.35 | |
| DPA | |||
| GG | 0.41 | 0.36, 0.47 | 0.07 |
| GT | 0.36 | 0.33, 0.40 | |
| TT | 0.32 | 0.26, 0.38 | |
| DHA | |||
| GG | 1.29 | 1.13, 1.48 | 0.99 |
| GT | 1.29 | 1.18, 1.42 | |
| TT | 1.29 | 1.07, 1.56 | |
| GLA/LA | |||
| GG | 0.012 | 0.010, 0.014 | 4.09 × 10⁻⁵ |
| GT | 0.008 | 0.007, 0.010 | |
| TT | 0.006 | 0.005, 0.008 | |
| DGLA/GLA | |||
| GG | 3.46 | 2.98, 4.01 | 7.74 × 10⁻¹¹ |
| GT | 5.33 | 4.81, 5.90 | |
| TT | 8.21 | 6.69, 10.08 | |
| ARA/DGLA | |||
| GG | 5.67 | 5.02, 6.39 | 1.76 × 10⁻¹¹ |
| GT | 4.20 | 3.86, 4.56 | |
| TT | 3.11 | 2.63, 3.67 | |
Baseline means and 95% CIs for key FAs and FA ratios. The baseline data for both oil consumption periods (visit 2 and visit 5) was used since the washout period was successful (Supplemental Table 1). FA values are presented as percentage of total FAs. The P values are from tests of whether that FA or ratio differed by genotype. ARA, arachidonic acid; DGLA, dihomo-ɣ-linolenic acid; DPA, docosapentaenoic acid; FA, fatty acid; GLA, ɣ-linolenic acid; LA, linoleic acid.
Effect of oil supplementation and rs174537 genotype on serum FAs
In this crossover study, each participant consumed both the control oil (SO) and the experimental oil (BO), albeit in an arm-dependent order. The washout period of 8 wk between the oil consumption periods was deemed successful, as we did not observe differences in serum concentrations of GLA, the principle FA differing between the 2 oils (Table 1), between the first (V2) and the second (V5) baselines for all subjects and genotypes (diff = 0.12, 95% CI: −0.016, 0.04; P = 0.39, paired t-test). LA and DGLA also had negligible differences between arms, and those results are presented in Supplemental Table 1.
The time courses of serum concentrations of n-6 PUFAs and LC-PUFAs in response to BO and SO supplementation are shown in Figure 3. There were clear differences by genotype in the response to BO supplementation but no changes with SO. Based on the FA composition of the supplemental oils (Table 1), both oils would be expected to enter the n-6 LC-PUFA biosynthetic pathway (Figure 1). As expected, for all genotypes, GLA concentrations markedly increased within 2 wk after BO consumption but not after SO. Mean values increased several-fold after 4 wk of BO consumption. Comparing genotypes, the “inefficient” TT genotype had the lowest mean value at baseline but also increased the most over the study period (Figure 3). Thus, while the week 4 differences between genotypes were not significantly different from each other (P = 0.81, test of week 4 × rs174537 interaction for BO), GLA increased ∼3-fold in those with the GG genotype compared with ∼6-fold in TT individuals. Given the trajectories in Figure 3, a longer supplementation period may have resulted in larger genotypic differences. DGLA, the elongation product of GLA, also increased significantly during BO consumption, but not during SO consumption. Baseline DGLA concentrations were 1–2% and increased only slightly with each copy of the T allele (diff = 0.19, 95% CI: 0.075, 0.30; Table 3). Values after 4 wk, however, were strongly connected to genotype, such that TT subjects had dramatically higher values than GG subjects (4.1% compared with 2.2% for TT and GG, respectively). Although less striking, amounts of ARA, the FADS1 desaturation product of DGLA, significantly increased by ∼18% (P = 7.39 × 10⁻¹¹; Table 4) with BO consumption for all genotypes. This elevation was seen in GT and GG individuals after just 2 wk of supplementation, while increased ARA concentrations in the TT individuals were only evident after 4 wk of BO consumption (see Supplemental Table 2). SO supplementation resulted in no changes in ARA concentrations compared with baseline (P = 0.061).
FIGURE 3.

Time course of serum n-6 PUFA concentrations (as % of total) after supplementation with botanical oils. This figure shows the changes in circulating n-6 PUFAs with either SO (blue) or BO (red) supplementation over the course of the 4-wk study period by the rs174537 genotype. Points represent the estimated mean values from the mixed models and bars represent 95% CIs. For both GLA and DGLA, BO supplementation resulted in dramatic increases from baseline values, both P < 1 × 10⁻¹¹. For GLA, values at week 4 were similar across genotypes, P = 0.80, while for DGLA they varied significantly,P = 8.05 × 10⁻⁷. GLA and DGLA values at week 2 and 4 were also significantly different from the corresponding values for SO at week 2 and 4, all P < 1 × 10⁻⁶. For ARA, changes were modest and initial baseline differences by genotype were carried forward such that the initial ordering (GG > GT > TT) was preserved. ARA, arachidonic acid; BO, borage oil; DGLA, dihomo-ɣ-linolenic acid; n-6, omega-6; GLA, ɣ-linolenic acid; SO, soybean oil.
Table 4 compares the impact of oil supplementation on major n-6 and n-3 PUFAs and LC-PUFAs over the course of the study period. For each FA, we fit a linear mixed-effects model to the longitudinal data and estimated the changes in FA over the 4 wk of supplementation. Interestingly, both LA (−5%) and EPA (−16%) concentrations also showed small but statistically significant decreases with BO consumption. In contrast, the concentrations of GLA, DGLA, and ARA increased nearly 400%, 200%, and 18%, respectively. No changes in other n-3 LC-PUFA (DPA and DHA) concentrations were observed (see Supplemental Figure 2) with the consumption of either botanical oil.
During BO consumption, both GLA and DGLA concentrations varied significantly with genotype, such that the accumulation of circulating GLA and DGLA increased dramatically with each additional copy of the T allele. Relatively small baseline differences grew over time, such that TT individuals had nearly double the amounts of DGLA at the end of the 4-wk supplementation period. Other covariants (sex, age, oil supplementation sequence) in this model did not impact FA concentrations. These data clearly reveal a gene–diet interaction for BO.
The increases in serum ARA with BO consumption appeared to be modest compared with those for GLA and DGLA and appeared not to vary greatly by genotype. However, it is important to recognize that GLA and DGLA are low-abundance FAs in the circulation, with values normally ranging from <1% of total circulating FAs for GLA and <3% for DGLA. In contrast, circulating concentrations of ARA range from 5% to 10% of total FAs. Supplemental Table 2 shows an analysis of the circulating ARA amounts (expressed as percentage of total FAs) in this cohort at baseline and after 4 wk of oil supplementation. As we and others have previously observed, baseline amounts of ARA are genotype-dependent (GG > GT > TT) and highly associated with rs174537 (33, 35). Importantly, as illustrated in Figure 3, the addition of GLA-containing BO increased ARA in all individuals, but it reached the highest amounts in individuals with rs174537 G alleles. Even after 4 wk of BO supplementation, TT individuals reached an average of 6.41% ARA (95% CI: 5.55, 7.27, Figure 3), which was still lower than the average in GG individuals at baseline of 8.13% (95% CI: 7.48, 8.83, Table 3). We did not observe any similar changes with SO supplementation.
We next applied this analysis approach to the FA ratios that serve as surrogates for enzymatic activity for the steps in the PUFA metabolic pathway shown in Figure 1: specifically, GLA/LA (FADS2), DGLA/GLA (ELOVL5), and ARA/DGLA (FADS1). These results are shown graphically in Supplemental Figure 3. The apparent increase in FADS2 and decrease in ELOLV5 activities were likely driven by the elevated GLA concentrations during BO supplementation. With BO consumption, the ARA/DGLA ratio representing the FADS1 step, which is 2 steps removed from the consumed n-6 PUFA (GLA), decreased for all 3 genotypes, but showed the largest decrease for TT individuals. In contrast, SO consumption resulted in no change in the ARA/DGLA ratio. This provides further evidence for an allelic effect and a gene–diet interaction.
Effect of botanical oil supplementation on cardiometabolic and inflammatory biomarkers
The impact of oil supplementation (4-wk consumption of each oil) on cardiometabolic and inflammatory biomarkers was evaluated by comparing baseline and week 4 values of serum lipids, hsCRP, and blood glucose (Table 5). Neither SO nor BO consumption impacted other measured endpoints in any genotype subgroup over the 4-wk supplementation period.
TABLE 5.
Impact of botanical oil supplementation on cardiometabolic and inflammatory biomarkers1
| Subject genotype | ||||||
|---|---|---|---|---|---|---|
| GG | GT | TT | ||||
| Week 0 | Week 4 | Week 0 | Week 4 | Week 0 | Week 4 | |
| Triglyceride | ||||||
| SO | 70.4 (4.3) | 70.1 (6.4) | 78.1 (4.9) | 77.4 (5.4) | 94.5 (27.2) | 90.6 (16.5) |
| BO | 63.9 (3.1) | 70.5 (6.2) | 78.2 (4.5) | 85.5 (9.4) | 91.9 (15.7) | 76.4 (12.7) |
| Total cholesterol | ||||||
| SO | 167.1 (5.9) | 167.3 (8.4) | 168.5 (5.7) | 165.1 (5.5) | 165.0 (5.7) | 164.6 (6.6) |
| BO | 165.5 (7.1) | 163.3 (6.7) | 175.6 (6.2) | 173.1 (5.7) | 162.4 (3.9) | 159.8 (6.4) |
| HDL | ||||||
| SO | 65.4 (3.3) | 64.7 (3.4) | 58.3 (3.1) | 59.3 (3.0) | 57.8 (3.1) | 61.9 (4.1) |
| BO | 65.9 (3.9) | 68.0 (4.0) | 60.1 (3.1) | 64.7 (3.8) | 58.8 (5.9) | 61.5 (4.7) |
| LDL | ||||||
| SO | 86.6 (5.2) | 89.4 (6.0) | 94.5 (5.1) | 90.5 (4.6) | 88.4 (6.8) | 84.5 (6.9) |
| BO | 87.0 (6.0) | 81.0 (4.4) | 99.8 (5.7) | 91.4 (4.3) | 85.3 (7.2) | 82.9 (7.3) |
| VLDL | ||||||
| SO | 14.0 (0.80) | 14.4 (1.3) | 15.7 (1.0) | 15.4 (1.1) | 18.9 (5.5) | 18.3 (3.3) |
| BO | 12.7 (0.6) | 14.3 (1.3) | 15.7 (0.9) | 17.1 (1.9) | 18.3 (3.2) | 15.4 (2.6) |
| Glucose | ||||||
| SO | 88.4 (1.3) | 87.0 (1.2) | 89.5 (1.2) | 89.4 (1.2) | 85.5 (1.3) | 86.1 (0.7) |
| BO | 88.7 (1.3) | 87.6 (1.5) | 89.0 (1.0) | 91.2 (1.3) | 86.1 (2.0) | 89.0 (1.8) |
| hsCRP | ||||||
| SO | 0.8 (0.3) | 0.5 (0.2) | 3.8 (2.0) | 1.2 (0.3) | 0.9 (0.4) | 0.7 (0.2) |
| BO | 0.5 (0.1) | 0.6 (0.1) | 1.4 (0.3) | 1.1 (0.2) | 1.8 (1.1) | 4.6 (3.8) |
Values are means (SEs). Measurements of a standard lipid panel, glucose, and hsCRP were made in fasting serum at all intervention visits. Data are presented for baseline (week 0) and after week 4 of oil supplementation. The 0- and 4-wk values were not significantly different (paired t-test, by genotype) for any of the markers measured. BO, borage oil; hsCRP, high-sensitivity C-reactive protein; SO, soybean oil.
Discussion
Early clinical studies suggested that GLA-enriched botanical oils positively impact the symptoms of several chronic inflammatory diseases, but more recent reviews and meta-analyses have questioned their effectiveness (2–15). A number of important issues may be responsible for much of this heterogeneity, including low subject numbers, less than ideal clinical design, GLA sources and administration, and disease states examined (15, 59). However, there is also a growing body of evidence that suggests there may be important relationships between genetic variation in the human host and the effectiveness of bioactive components in natural products (60). With regard to GLA-containing botanical oils, there is evidence that evolutionary-driven, ancestry-based, FADS gene–dietary PUFA interactions may impact the balance of glycerolipid substrates available for anti- and pro-inflammatory eicosanoid biosynthesis (40, 60). Numerous cross-sectional studies point to FADS1 encoded Δ-5 desaturase efficiency in impacting concentrations of DGLA, ARA, and, importantly, the ratio of ARA to DGLA. In fact, Geiger and colleagues pointed out that the effect between FADS1 variants and the ratio of ARA- to DGLA-containing phosphatidylcholine species is so strong that “if the molecular function of FADS1 had not been already known, the association between the SNP and the different glycerophospholipid concentrations per se would have allowed [one] to deduce its enzymatic activity of inserting a fourth double bond.” (34).
Given this evidence, a critical next step was to complete a prospective clinical trial to determine the impact of FADS1 variation on the metabolic flux of GLA entry into the LC-PUFA biosynthetic pathway and its subsequent conversion into DGLA and ARA products. The current trial did so, but providing a dietary source of LA from SO and LA + GLA from BO to non-Hispanic white individuals stratified by the FADS genotype at rs174537. Overall, there was little difference in circulating FAs or cardiometabolic/inflammatory biomarker concentrations during SO supplementation for any of the genotype subgroups. This is perhaps not surprising given that the current Western diet contains very high amounts of LA [12–15 g/d (61)]. The addition of ∼35% (∼5 g/d) more LA content in the form of a supplement may not have significant effects over the background diet. This is in contrast to a recent study that provided 17–28 g of LA over the background LA amounts in the diets. In that study, the FADS1 genotype did modify metabolic responses and ARA concentrations in response to high concentrations of LA (62).
In contrast, after BO supplementation, the accumulation of DGLA and ARA, and possibly GLA, was genotype dependent. The amount of GLA in the BO supplements was substantial compared with the amounts in typical participant diets, and GLA concentrations increased quickly in participants of all 3 genotypes (Figure 3C). In agreement with our central research hypothesis, the accumulation of circulating DGLA differed dramatically by genotype and resulted in marked alterations in the ratios of ARA to DGLA. Early biochemical studies of this pathway suggested that dietary GLA is rapidly elongated via an ELOVL5 elongase activity to DGLA, and the FADS1 (Δ-5 desaturase) step represents the major “bottleneck” in the conversion of GLA to ARA (30, 63). We postulate that after BO causes GLA to rise in all subjects, it is converted to DGLA via ELOVL5 and/or ELOVL2 but then reaches the rate-limiting FADS1 step. Then, individuals with the GG genotype efficiently metabolize DGLA → ARA, while DGLA and GLA accumulate in the TT individuals due to their less efficient FADS1 metabolism. In general, the data from this prospective clinical trial support this hypothesis but also show that, when examining the metabolic flux through the pathway, FADS1 variation leads to differential accumulation of DGLA and possibly also GLA.
A limitation of the current study is that we did not have the capacity to measure cyclooxygenase or lipoxygenase metabolites of DGLA and ARA to determine if their quantities were associated with amounts and ratios of their precursors. These measurements are difficult to perform in human in vivo studies, especially with DGLA metabolites, as eicosanoids are locally acting mediators that are typically rapidly metabolized. DGLA has the capacity to be metabolized by cyclooxygenase to 1-series PGs, particularly PGE1, and by 15-lipoxygenase into 15-HETrE, but these are cell- and tissue-dependent metabolic steps. We were not able to detect circulating concentrations of DGLA metabolites in human blood by using LC-MS/MS (data not shown), but this is not surprising given their rapid metabolism and cell- and tissue-specific biosynthesis (25, 64). Our previous study focusing on eicosanoids produced by stimulated whole blood demonstrated associations between genotype at rs174537 and eicosanoids, including leukotriene B4 and 5-HETE. These findings indicate that rs174537 impacts not only the synthesis of ARA precursors but also that of ARA bioactive metabolites (65). Given the biological effects of DGLA metabolites and their function in a wide variety of disorders/diseases (66–69), it is likely that quantities of these metabolites and their balance with ARA metabolites play key roles in human health and disease.
As with many natural products that contain potential bioactives, there has been large heterogeneity in the results derived from clinical trials aimed at interrogating GLA-containing oils. Clearly, genetic variations within the human host have a great capacity to impact the outcomes in natural product supplementation studies. The current study clearly suggests that gene–diet interactions exist in the context of PUFA metabolism. Thus, for individuals with variant(s) resulting in the efficient PUFA metabolizing phenotype, GLA supplementation could lead to elevated ARA precursors, eicosanoids, and undesirable clinical outcomes. The opposite would be true for individuals with variant(s) resulting in the inefficient PUFA metabolizing phenotype. Our results suggest that the balance of DGLA and ARA precursors, both up- or downstream of the FADS1 step, can contribute to the supplement's impact in a genotype subgroup. In conclusion, the current results clearly suggest that personalized and population-based approaches may be necessary to optimize the design of future clinical studies with GLA-containing oils.
Supplementary Material
ACKNOWLEDGEMENTS
The authors thank the following people who provided important assistance in conducting the study. Keri Marshall, ND, with Nordic Naturals (Watsonville, CA) was instrumental in helping to provide the high-quality encapsulated oil used for this study. Tim Morgan, PhD (Wake Forest School of Medicine) performed the randomization of participants to study arms. Brian Strittmatter, PharmD (Wake Forest School of Medicine) blinded the study oil products before they were dispensed to participants. Edward Kirby (Wake Forest School of Medicine) provided valuable assistance with FA analyses. Kirsten Lake, MA (University of Arizona) provided important editorial assistance during the preparation of the manuscript.
The authors’ responsibilities were as follows—FHC and RAM: designed the study and protocols, FHC: oversaw the conduct of the study; SS and FHC: wrote the manuscript; TLM, PI, and MLB: were study coordinators; SS: analyzed samples; SS: performed data analyses; IR, BH, and LJ: performed the statistical analyses; SS: oversaw the acquisition of the encapsulated oils, study product monitoring, and quality control; MCS: oversaw data quality control and edited the manuscript; and all authors: read and approved the final version of the manuscript. The authors report no conflicts of interest.
Notes
Supported by grants from the NIH, P50 AT002782 (to FHC), R01 AT008621 (to FHC) and UL1TR001420 (to Wake Forest Clinical and Translational Science Institute).
Supplemental Tables 1 and 2 and Supplemental Figures 1–3 are available from the “Supplementary data” link in the online posting of the article and from the same link in the online table of contents at https://academic.oup.com/ajcn/.
Abbreviations used: ARA, arachidonic acid; AV, anisidine value; BO, borage oil; CRP, C-reactive protein; DGLA, dihomo-ɣ-linolenic acid; DPA, docosapentaenoic acid; ELOVL, elongation of very long-chain FAs; FA, fatty acid; FADS, fatty acid desaturase; FAME, fatty acid methyl ester; GLA, ɣ-linolenic acid; HETE, hydroxyeicosatetraenoic acid; HETrE, hydroxyeicosatrienoic acid; HODE, hydroxyoctadecadienoic acid; hsCRP, high-sensitivity C-reactive protein; IRB, Institutional Review Board; LA, linoleic acid; LC, long chain; ML, maximum likelihood; n-3, omega-3; n-6, omega-6; NSAID, nonsteroidal anti-inflammatory drug; PG, prostaglandin; PV, peroxide value; SNP, single-nucleotide polymorphism; SO, soybean oil; TX, thromboxane; WFBMC, Wake Forest Baptist Medical Center.
References
- 1. Sergeant S, Rahbar E, Chilton FH. Gamma-linolenic acid, dihomo-gamma linolenic, eicosanoids and inflammatory processes. Eur J Pharmacol. 2016;785:77–86. [DOI] [PMC free article] [PubMed] [Google Scholar]
- 2. Andreassi M, Forleo P, Di Lorio A, Masci S, Abate G, Amerio P. Efficacy of gamma-linolenic acid in the treatment of patients with atopic dermatitis. J Int Med Res. 1997;25(5):266–74. [DOI] [PubMed] [Google Scholar]
- 3. Foolad N, Brezinski EA, Chase EP, Armstrong AW. Effect of nutrient supplementation on atopic dermatitis in children: a systematic review of probiotics, prebiotics, formula, and fatty acids. JAMA Dermatol. 2013;149(3):350–5. [DOI] [PubMed] [Google Scholar]
- 4. Kunkel SL, Ogawa H, Ward PA, Zurier RB. Suppression of chronic inflammation by evening primrose oil. Prog Lipid Res. 1981;20:885–8. [DOI] [PubMed] [Google Scholar]
- 5. Leventhal LJ, Boyce EG, Zurier RB. Treatment of rheumatoid arthritis with gammalinolenic acid. Ann Intern Med. 1993;119(9):867–73. [DOI] [PubMed] [Google Scholar]
- 6. Leventhal LJ, Boyce EG, Zurier RB. Treatment of rheumatoid arthritis with blackcurrant seed oil. Br J Rheumatol. 1994;33(9):847–52. [DOI] [PubMed] [Google Scholar]
- 7. Lovell CR, Burton JL, Horrobin DF. Treatment of atopic eczema with evening primrose oil. Lancet. 1981;1(8214):278. [DOI] [PubMed] [Google Scholar]
- 8. Morse PF, Horrobin DF, Manku MS, Stewart JC, Allen R, Littlewood S, Wright S, Burton J, Gould DJ, Holt PJet al.. Meta-analysis of placebo-controlled studies of the efficacy of Epogam in the treatment of atopic eczema. Relationship between plasma essential fatty acid changes and clinical response. Br J Dermatol. 1989;121(1):75–90. [DOI] [PubMed] [Google Scholar]
- 9. Tate G, Mandell BF, Laposata M, Ohliger D, Baker DG, Schumacher HR, Zurier RB. Suppression of acute and chronic inflammation by dietary gamma linolenic acid. J Rheumatol. 1989;16(6):729–34. [PubMed] [Google Scholar]
- 10. Zurier RB, Rossetti RG, Jacobson EW, DeMarco DM, Liu NY, Temming JE, White BM, Laposata M. Gamma-linolenic acid treatment of rheumatoid arthritis. A randomized, placebo-controlled trial. Arthritis Rheum. 1996;39(11):1808–17. [DOI] [PubMed] [Google Scholar]
- 11. Bamford JT, Ray S, Musekiwa A, van Gool C, Humphreys R, Ernst E. Oral evening primrose oil and borage oil for eczema. Cochrane Database Syst Rev. 2013;(4):Cd004416. [DOI] [PMC free article] [PubMed] [Google Scholar]
- 12. Belch JJ, Hill A.. Evening primrose oil and borage oil in rheumatologic conditions. Am J Clin Nutr. 2000;71(1 Suppl):352s–6s. [DOI] [PubMed] [Google Scholar]
- 13. Kitz R, Rose MA, Schonborn H, Zielen S, Bohles HJ. Impact of early dietary gamma-linolenic acid supplementation on atopic eczema in infancy. Pediatr Allergy Immunol. 2006;17(2):112–7. [DOI] [PubMed] [Google Scholar]
- 14. Macfarlane GJ, El-Metwally A, De Silva V, Ernst E, Dowds GL, Moots RJ. Evidence for the efficacy of complementary and alternative medicines in the management of rheumatoid arthritis: a systematic review. Rheumatology (Oxford). 2011;50(9):1672–83. [DOI] [PubMed] [Google Scholar]
- 15. van Gool CJ, Zeegers MP, Thijs C. Oral essential fatty acid supplementation in atopic dermatitis-a meta-analysis of placebo-controlled trials. Br J Dermatol. 2004;150(4):728–40. [DOI] [PubMed] [Google Scholar]
- 16. de Bravo MM, De Tomas ME, Mercuri O. Metabolism of gammalinolenic acid by human blood platelet microsomes. Biochem Int. 1985;10(6):889–96. [PubMed] [Google Scholar]
- 17. Chapkin RS, Ziboh VA, Marcelo CL, Voorhees JJ. Metabolism of essential fatty acids by human epidermal enzyme preparations: evidence of chain elongation. J Lipid Res. 1986;27(9):945–54. [PubMed] [Google Scholar]
- 18. Chilton L, Surette ME, Swan DD, Fonteh AN, Johnson MM, Chilton FH. Metabolism of gammalinolenic acid in human neutrophils. J Immunol. 1996;156(8):2941–7. [PubMed] [Google Scholar]
- 19. Wang X, Lin H, Gu Y. Multiple roles of dihomo-gamma-linolenic acid against proliferation diseases. Lipids Health Dis. 2012;11:25. [DOI] [PMC free article] [PubMed] [Google Scholar]
- 20. Tabolacci C, Lentini A, Provenzano B, Gismondi A, Rossi S, Beninati S. Similar antineoplastic effects of nimesulide, a selective COX-2 inhibitor, and prostaglandin E1 on B16-F10 murine melanoma cells. Melanoma Res. 2010;20(4):273–9. [DOI] [PubMed] [Google Scholar]
- 21. Williams CD, Whitley BM, Hoyo C, Grant DJ, Iraggi JD, Newman KA, Gerber L, Taylor LA, McKeever MG, Freedland SJ. A high ratio of dietary n-6/n-3 polyunsaturated fatty acids is associated with increased risk of prostate cancer. Nutr Res. 2011;31(1):1–8. [DOI] [PubMed] [Google Scholar]
- 22. Hofmanova J, Vaculova A, Kozubik A. Polyunsaturated fatty acids sensitize human colon adenocarcinoma HT-29 cells to death receptor-mediated apoptosis. Cancer Lett. 2005;218(1):33–41. [DOI] [PubMed] [Google Scholar]
- 23. Skuladottir GV, Heidarsdottir R, Arnar DO, Torfason B, Edvardsson V, Gottskalksson G, Palsson R, Indridason OS. Plasma n-3 and n-6 fatty acids and the incidence of atrial fibrillation following coronary artery bypass graft surgery. Eur J Clin Invest. 2011;41(9):995–1003. [DOI] [PubMed] [Google Scholar]
- 24. Gallagher H, Williams JO, Ferekidis N, Ismail A, Chan YH, Michael DR, Guschina IA, Tyrrell VJ, O'Donnell VB, Harwood JLet al.. Dihomo-gamma-linolenic acid inhibits several key cellular processes associated with atherosclerosis. Biochim Biophys Acta Mol Basis Dis. 2019;1865(9):2538–50. [DOI] [PMC free article] [PubMed] [Google Scholar]
- 25. Borgeat P, Hamberg M, Samuelsson B. Transformation of arachidonic acid and homo-gamma-linolenic acid by rabbit polymorphonuclear leukocytes. Monohydroxy acids from novel lipoxygenases. J Biol Chem. 1976;251(24):7816–20. [PubMed] [Google Scholar]
- 26. Needleman P, Turk J, Jakschik BA, Morrison AR, Lefkowith JB. Arachidonic acid metabolism. Annu Rev Biochem. 1986;55:69–102. [DOI] [PubMed] [Google Scholar]
- 27. Iversen L, Fogh K, Kragballe K. Effect of dihomogammalinolenic acid and its 15-lipoxygenase metabolite on eicosanoid metabolism by human mononuclear leukocytes in vitro: selective inhibition of the 5-lipoxygenase pathway. Arch Dermatol Res. 1992;284(4):222–6. [DOI] [PubMed] [Google Scholar]
- 28. Chapkin RS, Miller CC, Somers SD, Erickson KL. Ability of 15-hydroxyeicosatrienoic acid (15-OH-20:3) to modulate macrophage arachidonic acid metabolism. Biochem Biophys Res Commun. 1988;153(2):799–804. [DOI] [PubMed] [Google Scholar]
- 29. Arm JP, Boyce JA, Wang L, Chhay H, Zahid M, Patil V, Govindarajulu U, Ivester P, Weaver KL, Sergeant Set al.. Impact of botanical oils on polyunsaturated fatty acid metabolism and leukotriene generation in mild asthmatics. Lipids Health Dis. 2013;12:141. [DOI] [PMC free article] [PubMed] [Google Scholar]
- 30. Johnson MM, Swan DD, Surette ME, Stegner J, Chilton T, Fonteh AN, Chilton FH. Dietary supplementation with gamma-linolenic acid alters fatty acid content and eicosanoid production in healthy humans. J Nutr. 1997;127(8):1435–44. [DOI] [PubMed] [Google Scholar]
- 31. Martin SA, Brash AR, Murphy RC. The discovery and early structural studies of arachidonic acid. J Lipid Res. 2016;57(7):1126–32. [DOI] [PMC free article] [PubMed] [Google Scholar]
- 32. Mathias RA, Vergara C, Gao L, Rafaels N, Hand T, Campbell M, Bickel C, Ivester P, Sergeant S, Barnes KCet al.. FADS genetic variants and omega-6 polyunsaturated fatty acid metabolism in a homogeneous island population. J Lipid Res. 2010;51(9):2766–74. [DOI] [PMC free article] [PubMed] [Google Scholar]
- 33. Mathias RA, Sergeant S, Ruczinski I, Torgerson DG, Hugenschmidt CE, Kubala M, Vaidya D, Suktitipat B, Ziegler JT, Ivester Pet al.. The impact of FADS genetic variants on omega6 polyunsaturated fatty acid metabolism in African Americans. BMC Genet. 2011;12:50. [DOI] [PMC free article] [PubMed] [Google Scholar]
- 34. Gieger C, Geistlinger L, Altmaier E, Hrabe de Angelis M, Kronenberg F, Meitinger T, Mewes HW, Wichmann HE, Weinberger KM, Adamski Jet al.. Genetics meets metabolomics: a genome-wide association study of metabolite profiles in human serum. PLos Genet. 2008;4(11):e1000282. [DOI] [PMC free article] [PubMed] [Google Scholar]
- 35. Sergeant S, Hugenschmidt CE, Rudock ME, Ziegler JT, Ivester P, Ainsworth HC, Vaidya D, Case LD, Langefeld CD, Freedman BIet al.. Differences in arachidonic acid levels and fatty acid desaturase (FADS) gene variants in African Americans and European Americans with diabetes or the metabolic syndrome. Br J Nutr. 2012;107(4):547–55. [DOI] [PMC free article] [PubMed] [Google Scholar]
- 36. Ameur A, Enroth S, Johansson A, Zaboli G, Igl W, Johansson AC, Rivas MA, Daly MJ, Schmitz G, Hicks AAet al.. Genetic adaptation of fatty-acid metabolism: a human-specific haplotype increasing the biosynthesis of long-chain omega-3 and omega-6 fatty acids. Am J Hum Genet. 2012;90(5):809–20. [DOI] [PMC free article] [PubMed] [Google Scholar]
- 37. Mathias RA, Fu W, Akey JM, Ainsworth HC, Torgerson DG, Ruczinski I, Sergeant S, Barnes KC, Chilton FH. Adaptive evolution of the FADS gene cluster within Africa. PLoS One. 2012;7(9):e44926. [DOI] [PMC free article] [PubMed] [Google Scholar]
- 38. Fumagalli M, Moltke I, Grarup N, Racimo F, Bjerregaard P, Jorgensen ME, Korneliussen TS, Gerbault P, Skotte L, Linneberg Aet al.. Greenlandic Inuit show genetic signatures of diet and climate adaptation. Science. 2015;349(6254):1343–7. [DOI] [PubMed] [Google Scholar]
- 39. Amorim CE, Nunes K, Meyer D, Comas D, Bortolini MC, Salzano FM, Hunemeier T. Genetic signature of natural selection in first Americans. Proc Natl Acad Sci USA. 2017;114(9):2195–9. [DOI] [PMC free article] [PubMed] [Google Scholar]
- 40. Harris DN, Ruczinski I, Yanek LR, Becker LC, Becker DM, Guio H, Cui T, Chilton FH, Mathias RA, O'Connor TD. Evolution of hominin polyunsaturated fatty acid metabolism: from Africa to the New World. Genome Biol Evol. 2019;11(5):1417–30. [DOI] [PMC free article] [PubMed] [Google Scholar]
- 41. Mathieson S, Mathieson I.. FADS1 and the timing of human adaptation to agriculture. Mol Biol Evol. 2018;35(12):2957–70. [DOI] [PMC free article] [PubMed] [Google Scholar]
- 42. Mathieson I, Lazaridis I, Rohland N, Mallick S, Patterson N, Roodenberg SA, Harney E, Stewardson K, Fernandes D, Novak Met al.. Genome-wide patterns of selection in 230 ancient Eurasians. Nature. 2015;528(7583):499–503. [DOI] [PMC free article] [PubMed] [Google Scholar]
- 43. Li P, Zhao J, Kothapalli KSD, Li X, Li H, Han Y, Mi S, Zhao W, Li Q, Zhang Het al.. A regulatory insertion-deletion polymorphism in the FADS gene cluster influences PUFA and lipid profiles among Chinese adults: a population-based study. Am J Clin Nutr. 2018;107(6):867–75. [DOI] [PubMed] [Google Scholar]
- 44. Kothapalli KSD, Ye Kaixiong, Gadgil MS, Carlson SE, O'Brien KO, Zhang JY, Park HG, Ojukwu K, Zou J, Hyon SSet al.. Positive selection on a regulatory insertion–deletion polymorphism in FADS2 influences apparent endogenous synthesis of arachidonic acid. Mol Biol Evol. 2016;33(7):1726–39. [DOI] [PMC free article] [PubMed] [Google Scholar]
- 45. Brenna JT, Plourde M, Stark KD, Jones PJ, Lin Y-H. Best practices for the design, laboratory analysis, and reporting of trials involving fatty acids. Am J Clin Nutr. 2018;108(2):211–27. [DOI] [PMC free article] [PubMed] [Google Scholar]
- 46. Sorkin BC, Kuszak AJ, Williamson JS, Hopp DC, Betz JM. The challenge of reproducibility and accuracy in nutrition research: resources and pitfalls. Adv Nutr. 2016;7(2):383–9. [DOI] [PMC free article] [PubMed] [Google Scholar]
- 47. Kuszak AJ, Hopp DC, Williamson JS, Betz JM, Sorkin BC. Approaches by the US National Institutes of Health to support rigorous scientific research on dietary supplements and natural products. Drug Test Anal. 2016;8(3-4):413–7. [DOI] [PMC free article] [PubMed] [Google Scholar]
- 48. Sorkin B, Kuszak A, Pauli G, Bloss G, Barrett B, Ferruzzi M, Fukagawa N, Kiely M, Lakens D, Meltzer Det al.. Enhancing natural product clinical trials (P13-037-19). Curr Dev Nutr. 2019;3(Suppl 1):nzz036.P13–7-19. [Google Scholar]
- 49. Metcalfe LD, Schmitz AA, Pelka JR. Rapid preparation of fatty acid esters from lipids for gas chromatographic analysis. Anal Chem. 1966;38(3):514–15. [Google Scholar]
- 50. Sergeant S, Ruczinski I, Ivester P, Lee TC, Morgan TM, Nicklas BJ, Mathias RA, Chilton FH. Impact of methods used to express levels of circulating fatty acids on the degree and direction of associations with blood lipids in humans. Br J Nutr. 2016;115(2):251–61. [DOI] [PMC free article] [PubMed] [Google Scholar]
- 51. Weaver KL, Ivester P, Seeds M, Case LD, Arm JP, Chilton FH. Effect of dietary fatty acids on inflammatory gene expression in healthy humans. J Biol Chem. 2009;284(23):15400–7. [DOI] [PMC free article] [PubMed] [Google Scholar]
- 52. Council of Europe. Directorate for the quality of M. 2.5 assays. European pharmacopoeia. Strasbourg: Directorate for the Quality of Medicines, Council of Europe; 2010:137–8. [Google Scholar]
- 53. Talbot G. The stability and shelf life of fats and oils. In: Subramaniam Peditor. The stability and shelf life of food. 2nd ed.Cambridge, United Kingdom; Woodhead Publishing; 2016:461–503. [Google Scholar]
- 54. R Core Team. R: A language and environment for statistical computing. R Foundation for Statistical Computing, Vienna, Austria. 2018; [Internet]. Available from: https://www.R-project.org/. [Google Scholar]
- 55. Aitchison J. The statistical analysis of compositional data. London; Chapman and Hall; 1986. [Google Scholar]
- 56. Pinheiro J, Bates D, DebRoy S, Sarkar D; R Core Team . nlme: linear and nonlinear mixed effects models. 2019; [Internet]. Available from: https://CRAN.R-project.org/package = nlme. [Google Scholar]
- 57. Amrhein V, Greenland S, McShane B. Scientists rise up against statistical significance. Nature. 2019;567(7748):305–7. [DOI] [PubMed] [Google Scholar]
- 58. Rennie D. CONSORT revised–improving the reporting of randomized trials. JAMA. 2001;285(15):2006–7. [DOI] [PubMed] [Google Scholar]
- 59. Foster RH, Hardy G, Alany RG. Borage oil in the treatment of atopic dermatitis. Nutrition. 2010;26(7-8):708–18. [DOI] [PubMed] [Google Scholar]
- 60. Chilton FH, Dutta R, Reynolds LM, Sergeant S, Mathias RA, Seeds MC. Precision nutrition and omega-3 polyunsaturated fatty acids: a case for personalized supplementation approaches for the prevention and management of human diseases. Nutrients. 2017;9(11):E1165. [DOI] [PMC free article] [PubMed] [Google Scholar]
- 61. Blasbalg TL, Hibbeln JR, Ramsden CE, Majchrzak SF, Rawlings RR. Changes in consumption of omega-3 and omega-6 fatty acids in the United States during the 20th century. Am J Clin Nutr. 2011;93(5):950–62. [DOI] [PMC free article] [PubMed] [Google Scholar]
- 62. Lankinen MA, Fauland A, Shimizu BI, Agren J, Wheelock CE, Laakso M, Schwab U, Pihlajamaki J. Inflammatory response to dietary linoleic acid depends on FADS1 genotype. Am J Clin Nutr. 2019;109(1):165–75. [DOI] [PubMed] [Google Scholar]
- 63. Barham JB, Edens MB, Fonteh AN, Johnson MM, Easter L, Chilton FH. Addition of eicosapentaenoic acid to gamma-linolenic acid-supplemented diets prevents serum arachidonic acid accumulation in humans. J Nutr. 2000;130(8):1925–31. [DOI] [PubMed] [Google Scholar]
- 64. Levin G, Duffin KL, Obukowicz MG, Hummert SL, Fujiwara H, Needleman P, Raz A. Differential metabolism of dihomo-gamma-linolenic acid and arachidonic acid by cyclo-oxygenase-1 and cyclo-oxygenase-2: implications for cellular synthesis of prostaglandin E1 and prostaglandin E2. Biochem J. 2002;365(Pt 2):489–96. [DOI] [PMC free article] [PubMed] [Google Scholar]
- 65. Hester AG, Murphy RC, Uhlson CJ, Ivester P, Lee TC, Sergeant S, Miller LR, Howard TD, Mathias RA, Chilton FH. Relationship between a common variant in the fatty acid desaturase (FADS) cluster and eicosanoid generation in humans. J Biol Chem. 2014;289(32):22482–9. [DOI] [PMC free article] [PubMed] [Google Scholar]
- 66. Ye Z, Lu H, Guo W, Dai W, Li H, Yang H, Li L. The effect of alprostadil on preventing contrast-induced nephropathy for percutaneous coronary intervention in diabetic patients: A systematic review and meta-analysis. Medicine (Baltimore). 2016;95(46):e5306. [DOI] [PMC free article] [PubMed] [Google Scholar]
- 67. Vietto V, Franco JV, Saenz V, Cytryn D, Chas J, Ciapponi A. Prostanoids for critical limb ischaemia. Cochrane Database Syst Rev. 2018;1:Cd006544. [DOI] [PMC free article] [PubMed] [Google Scholar]
- 68. McLaughlin J, Devoe LD.. Current status of prostaglandins for cervical ripening. J Reprod Med. 2017;62(5-6):221–8. [PubMed] [Google Scholar]
- 69. Moncada I, Martinez-Salamanca J, Ruiz-Castane E, Romero J. Combination therapy for erectile dysfunction involving a PDE5 inhibitor and alprostadil. Int J Impot Res. 2018;30(5):203–8. [DOI] [PubMed] [Google Scholar]
Associated Data
This section collects any data citations, data availability statements, or supplementary materials included in this article.