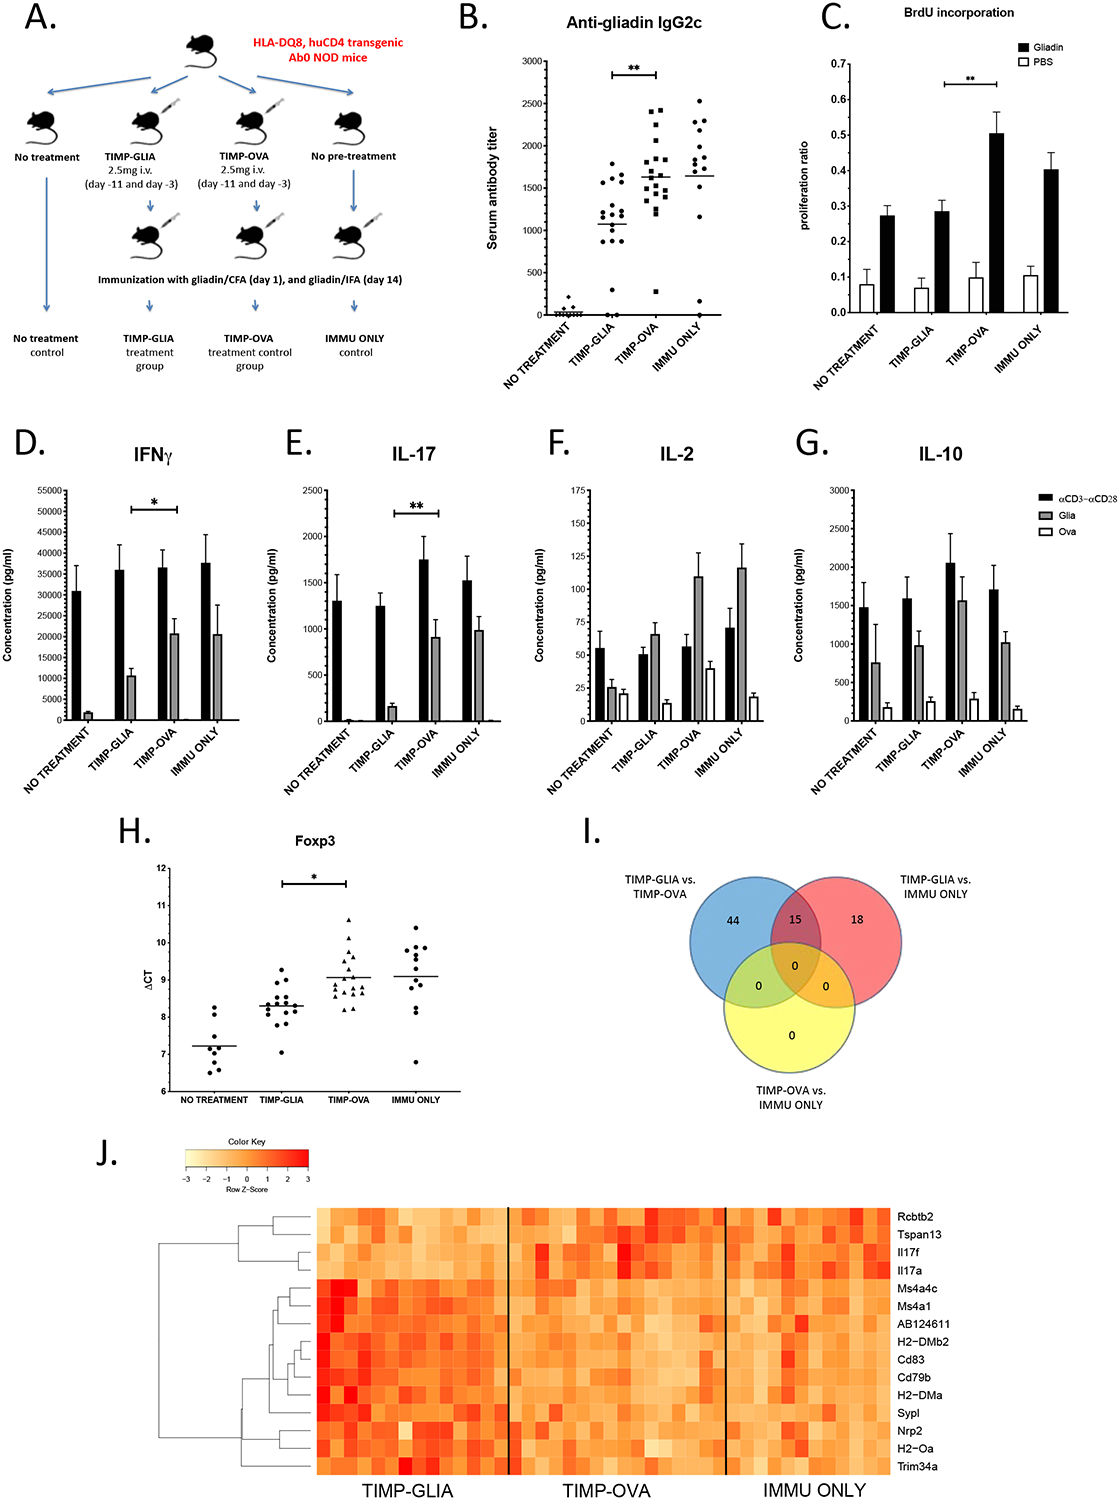
Figure 4. TIMP-GLIA tolerance induction in transgenic mice expressing celiac disease-associated HLA-DQ8.

A) Experimental design. B) Serum anti-gliadin IgG2c antibody titers in groups of HLA-DQ8 mice, treated according to A (n=11–19; ELISA). C) Proliferation of spleen cells (n=8–9; BrdU ELISA). Data expressed as proliferation ratios, relating to anti-CD3/anti-CD28 positive control. D-G) IFNG, IL17, IL2 and IL10 cytokine concentrations in supernatants of spleen cells stimulated with gliadin, ovalbumin (negative control) or anti-CD3/anti-CD28 (positive control; n=11–19; ELISA). H) Foxp3 mRNA expression by spleen cells in response to gliadin restimulation (n=9–18; RT-qPCR). Results expressed in ΔCT values (reductions of ΔCT reflect increases in Foxp3 mRNA expression). I) Venn diagram depicting the numbers of genes differentially expressed in spleen cells restimulated with gliadin, in 3 separate comparisons between 3 groups of HLA-DQ8 mice (n=13–16; RNAseq). J) Heat map depicting the up- (red) or down-regulation (yellow) of 15 genes differentially expressed after treatment with TIMP-GLIA (n=13–16, adjusted p-value p≤0.05; RNAseq). Statistical analyses were performed using one-way ANOVA and Tukey’s multiple comparison test (B, H), t-tests corrected for multiple testing using the Holm-Sidak method (C-G) or edgeR (I, J). In plots B-H, significant results are indicated for comparisons between TIMP-GLIA and TIMP-OVA groups only (*p≤0.05, **p≤0.01).
