Abstract
Introduction
The daily injection burden of recombinant human growth hormone (r-hGH) replacement therapy to treat growth hormone deficiency (GHD) may reduce compliance and limit treatment benefit. Research is needed to evaluate patient preferences for GHD injection regimen and device features.
Objective
Quantitatively evaluate factors driving preferences for r-hGH injection regimen and device features among pediatric (3–17 years, and caregivers) and adult (≥25 years) patients with GHD using a discrete choice experiment (DCE) approach.
Methods
The DCE was part of a broader, cross-sectional observational field study to develop clinical outcome assessments (COAs) that assess the experience of patients taking r-hGH injections. Following ethics approval, discrete choice data were collected through an online questionnaire from consented participants recruited from eight sites in the United States. Participants were presented with 20 choice tasks, each comprising different combinations of two profiles. Participants were then shown the same set of three hypothetical device and injection profiles (ie, storage, preparation, injection type device, maintenance, dose setting, injection schedule) and asked whether they would choose each profile over their current device and schedule. Choice-based conjoint analyses were used to estimate the marginal utilities and values for treatment attributes. Subject preferences were estimated at individual and aggregate levels.
Results
Two hundred and twenty-four participants completed the DCE (n=75 adults, n=79 adolescent/caregiver dyads, n=70 child/caregiver dyads). Injection schedule was the strongest predictor of choice for the total sample and each patient group. Less frequent injection schedules were more likely to be chosen by participants. A “ready to use” injection was preferred, with no preference for auto-injector versus needle-free device. Most participants would choose the hypothetical injection devices and less frequent dosing over their current daily administered device schedule.
Conclusion
Patients prefer a less frequent injection regimen for treating GHD. Addressing patient preferences may improve compliance, adherence, and ultimately, clinical outcomes.
Keywords: discrete choice experiment, DCE, conjoint analysis, treatment regimen, attributes, children, adults
Introduction
Incorporating the patient experience into the clinical decision-making process is of increasing interest to the international regulatory and health policy community,1 as these bodies increasingly recognize that patients are experts in terms of their preferences and have a unique knowledge of their own health. The patient experience can be captured in a number of different ways; an increasingly important approach is via patient preference (PP) studies.
PP studies generate rigorous data on patients’ perception and preferences surrounding different aspects of existing or investigational health-related products, services, and interventions. The growing use of PP studies helps incorporate the patient perspective into clinical drug development, care management, and the broader healthcare decision-making of regulators and payers.2–5 Over the last decade, benefit-risk methodologies have evolved substantially and are seen by regulators2 and industry stakeholders as a valuable tool in aiding transparency and communication in decision-making. Benefit-risk evaluation is both subjective and objective, and PP data can help regulatory and other stakeholders (eg, payers) evaluate and communicate value-based judgments.
Preference research allows estimation of the relative importance of different aspects of care, the trade-offs between these aspects, total satisfaction or utility that respondents derive from healthcare services and can help with decision making for some of the important issues in healthcare.
As summarized in the US Food and Drug Administration (FDA)’s “Patient Preference Information – Voluntary Submission, Review in Premarket Approval Applications, Humanitarian Device Exemption Applications, and De Novo Requests, and Inclusion in Decision Summaries and Device Labeling” guidance,2 patient preference data may be collected through qualitative or quantitative approaches. There are several quantitative approaches to eliciting patient preference data; some use revealed-preference methods (whereby patient preferences are obtained from actual observed choices made by participants), while others use stated-preference methods (in which preferences are elicited by offering choices to participants). A discrete choice experiment (DCE) is a quantitative stated-preference method for eliciting preference data. DCEs are based on random utility theory (RUT), a long-standing theory of choice behavior proposed by Thurstone in 1927.6,7 The method involves presenting participants with a choice task that requires a force choice between hypothetical alternative products (or programs, or services). Participants are asked to state their preference from the alternative options. These data are used to evaluate how respondents’ value selected attributes of a product (or program or service), whether preferences are influenced by the attributes, and the relative importance of the attributes.8
Growth hormone deficiency (GHD) in adults and children has been treated over the last several decades with recombinant human growth hormone (r-hGH) administered as a daily injection. Whilst this treatment has, on the whole, been successful, evidence indicates that adherence with daily treatment is less than optimal9 and presents a particular challenge in children for a variety of reasons (including discomfort or pain with daily injections, the required length of treatment, and the patients and parents understanding of treatment benefit and consequences of non-compliance).10,11 The psychological impact on the family, and in particular the impact on the caregiver who primarily administers the daily injections to young children, can be emotionally distressing.
It has been hypothesized that a less frequent injection schedule (for example, a weekly or monthly injection schedule) could improve patient adherence.12 In children, this would obviously result in improved long-term height outcomes and improved quality of life (QoL).13 Injection frequency for administration of r-hGH injections may be an important factor for patients and clinicians when initiating therapy for GHD and making subsequent treatment choices for this chronic condition. Various delivery and device attributes (ie, product features such as safety, effectiveness, or mode of administration14) may factor into patient preferences about r-hGH injections, such as frequency, device, and storage options. Little research regarding r-hGH injection frequency preferences has been done to date, since the development work on these newer “less frequent” products is still ongoing,15,16 and they are not currently available for routine prescribing.
The goal of this study was to ascertain relative patient preferences associated with the r-hGH injections and injection devices using DCE methods.
Objective
The objective of this research was to quantitatively evaluate factors driving preferences for r-hGH injection regimen and device features among a target cohort of 225 pediatric and adult patients with GHD, recruited from clinics in the US, through the conduct of a DCE.
Materials and Methods
Study Design
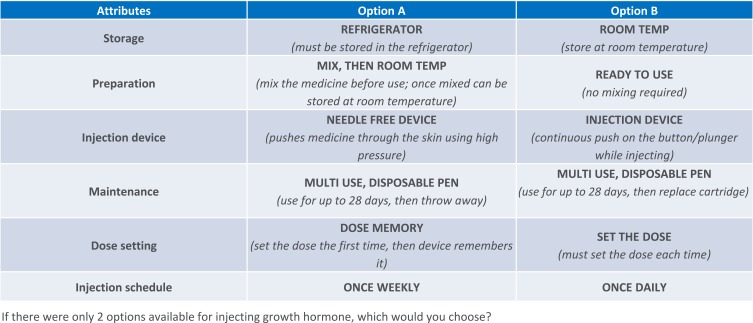
Clinician-diagnosed pediatric (aged 3–17 years, and caregivers) and adult (aged 25 years or older) patients were recruited from eight endocrinology clinics in the US and invited to participate in a cross-sectional, observational, internet-based study conducted in the first half of 2017 to develop clinical outcome assessments (COAs) that measure injection regimen burden in pediatric and adult GHD populations. As part of this broader study, participants completed a DCE administered via an online questionnaire to determine their preferences for r-hGH injection regimen and injection device features. For this research, product profiles were constructed based on all possible combinations of pre-defined injection regimen and device attributes (and levels of each attribute) and the profiles served as the basis for the choice tasks presented to participants. To summarize, each participant was presented with a total of 20 choice tasks to complete. The choice tasks that each participant completed were determined via an experimental design and each participant was presented with a different set of profiles to offset chance association with a single set of profiles. Participants were asked, “If these were the only two options available for injecting growth hormone, which would you choose?” prior to making their choice between the two profile options.
Sample
The study targeted the inclusion of approximately 225 child, adolescent, and adult patients with a clinically confirmed diagnosis of GHD as confirmed by two different growth hormone provocation tests, defined as a peak plasma growth hormone level ≤10 ng/mL. To be eligible, all participants must have been taking daily r-hGH injections for at least 6 months; had normal birth size, weight, and length for gestational age; and had a body mass index (BMI) within ± 2 standard deviations of mean BMI for the patient’s age and sex. Further, all participants needed to be able to read and understand English, be able to complete web-based questionnaires and have access to the internet. Exclusion criteria included patients who had evidence of malignancy, psychosocial dwarfism, other conditions/syndromes which could be treated with r-hGH (such as Prader Willi syndrome, small for gestational age, Turners syndrome), active acromegaly in the case of adults, and diabetes mellitus in the case of children.
Targeted sample distributions included approximately equal numbers of children (n~75, 3–11 years old), adolescents (n~75, 12–17 years old), and adults (n~75, ≥25 years old), and efforts were made to recruit a sample of which approximately 50% were currently using the branded r-hGHs Genotropin® products (Pfizer Inc) to treat GHD (the remaining 50% were using the remaining r-hGH products available in the US). Patients who are 18–24 years of age are generally viewed as being in a “transition period” of GHD; during this time, individuals with pediatric-onset GHD experience a slowed growth rate as they approach their adult height.17–19 It is estimated that up to 40% of children with GHD will have persistent GHD into adulthood;20 if further treatment is required, this is usually initiated once they have entered adulthood, ie, after the transition phase. Hence, in order to avoid confounding the study results, and to clearly distinguish between pediatric and adult GHD populations, individuals aged 18–24 years were not included in the study population. Caregivers of pediatric and adolescent patient participants were included in the study if they were the primary caregiver for a patient 3–17 years of age, and regularly administered r-hGH injections to or with the patient. All participating caregivers were part of a patient/caregiver dyad, and the DCE questionnaire was completed by this dyad pair together.
Materials and Measures
Examples of r-hGH Injection and Device Descriptions
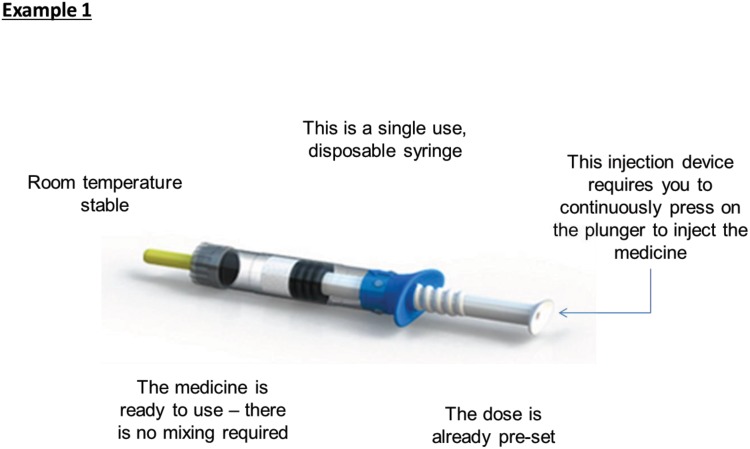
Images of different devices are illustrated to orient participants and ensure that they have a consistent understanding of the device attributes considered in the DCE (see Figure 1 for an example description).
Figure 1.
Example of r-hGH injection and device descriptions.
Attribute and Level Grid
The attribute and level grid are presented in Table 1. This table presents the injection device attributes, and levels of each attribute, that were used to create the profiles that participants selected from when completing the DCE. “Attributes” are the individual features that make up the research object (ie, an injection device), while attribute “levels” describe the possible values, outcomes, or technological components associated with each attribute.14 Pre-defined attributes included storage (two levels) and preparation (three levels) of injection medicine; injection device (three levels); pen maintenance (three levels) and dose setting (three levels); and injection schedule (four levels). The specific attributes were determined following internal discussions using prior feedback from patients regarding injection pens.
Table 1.
Attribute and Level Grid
| Attributes | Level 1 | Level 2 | Level 3 | Level 4 | Level 5 | |
|---|---|---|---|---|---|---|
| 1 | Storage | Refrigerator (must be stored in the refrigerator) |
Refrigerator (must be stored in the refrigerator) |
Refrigerator (must be stored in the refrigerator) |
Room Temp (store at room temperature) |
Room Temp (store at room temperature) |
| 1b | Preparation | Mix (mix the medicine before use) |
Ready to Use (no mixing required) |
Mix, Then Room Temp (mix the medicine before use; once mixed can be stored at room temperature) |
Mix (mix the medicine before use) |
Ready to Use (no mixing required) |
| 2 | Injection device | Injection Device (continuous push on the button/plunger while injecting) |
Autoinjector (single push of the button to inject) |
Needle Free Device (pushes medicine through the skin using high pressure) |
||
| 3 | Maintenance | Single Use, Disposable Syringe (throw away after one use) |
Multi Use, Disposable Pen (use for up to 28 days, then throw away) |
Multi Use, Disposable Pen (use for up to 28 days, then throw away) |
Multi Use, Reusable Pen (use for up to 28 days, then replace cartridge) |
Multi Use, Reusable Pen (use for up to 28 days, then replace cartridge) |
| 3b | Dose setting | Pre-Set Dose (dose is already pre-set) |
Set the Dose (must set the dose each time) |
Dose Memory (set the dose the first time, then device remembers it) |
Set the Dose (must set the dose each time) |
Dose Memory (set the dose the first time, then device remembers it) |
| 4 | Injection schedule | Once Daily | Once Weekly | Once Every 2 Weeks | Once a Month |
Analysis Grid
Six device attributes were identified to be investigated, but some of these were not independent since only certain levels of the attributes could be shown together to create a logically sensible product profile (for example, the device level “autoinjector” cannot be combined with the maintenance level “single use, disposable syringe” so this combination was prohibited in the design). Early in design, both six- and four-attribute grids were tested, and the six-attribute grid was found to be highly inefficient due to the number of prohibitions needed. Therefore, the six-attribute grid was reduced to a four-attribute grid by introducing “super-attributes” (see Table 1), removing the need for any prohibitions. To the participant, the super-attribute appears as two attributes (presented as distinct items), but to the design and analysis, it is treated as one attribute. In Table 1, the super-attributes are labelled as 1/1b and 3/3b. In the analysis process, the two super-attributes were unbundled; in each case the utility of the single level (eg, Room Temperature) is the average of the combined levels incorporating that level.
“Fixed” Hypothetical Product Profiles
To better understand the desirability and acceptance of less frequent dosing schedules, three hypothetical “fixed” product profiles were constructed and submitted to participants as a follow up activity (Table 2). Attribute levels for storage and preparation, injection device, maintenance and dose setting were the same (or “fixed”) for all three of these product profiles. The only attribute that varied across the three product profiles was injection schedule: profile X included a “once weekly” injection schedule, profile Y included a “once every 2 weeks” injection schedule, and profile Z included a “once monthly” injection schedule. Participants were asked if they would prefer each of the three “fixed” product profiles (with differing injection schedules) to that of their current product profile.
Table 2.
Fixed Attribute Grid Profiles for Hypothetical Products X, Y, Z
| Attributes | Profile X | Profile Y | Profile Z |
|---|---|---|---|
| Storage | Refrigerator (must be stored in the refrigerator) |
Refrigerator (must be stored in the refrigerator) |
Refrigerator (must be stored in the refrigerator) |
| Preparation | Ready to Use (no mixing required) |
Ready to Use (no mixing required) |
Ready to Use (no mixing required) |
| Injection device | Injection Device (continuous push on the button/plunger while injecting) |
Injection Device (continuous push on the button/plunger while injecting) |
Injection Device (continuous push on the button/plunger while injecting) |
| Maintenance | Multi Use, Disposable Pen (use for up to 28 days, then throw away) |
Multi Use, Disposable Pen (use for up to 28 days, then throw away) |
Multi Use, Disposable Pen (use for up to 28 days, then throw away) |
| Dose setting | Set the Dose (must set the dose each time) |
Set the Dose (must set the dose each time) |
Set the Dose (must set the dose each time) |
| Injection schedule | Once Weekly | Once Every 2 Weeks | Once a Month |
Procedure
Institutional review board (IRB) ethics approval was granted by a centralized IRB, Quorum Review, as well as local IRBs for clinical sites requiring local IRB review and approval. After IRB ethics approval was granted, potentially eligible patients were identified by eight endocrinology clinics spread across the US to encourage geographic diversity of the sample. Potentially eligible patients were identified through a review of medical records by clinical site staff and were provided with information about the study by the clinical site. Interested patients (and caregivers, when appropriate) were sent a unique internet web address to enable online informed consent (or assent for adolescent and pediatric patients aged seven years and older) and Health Insurance Portability and Accountability Act of 1996 (HIPAA) authorization. After providing consent/assent, participants were asked to complete screening questions to confirm eligibility. Those enrolled in the study then completed a series of clinical outcome assessments and a brief demographic questionnaire. They were then asked to complete the DCE. All data, including participant consent, were collected electronically through a web-based interface. To protect anonymity, participants were assigned a unique identification number and data were collected through a universal resource locator (URL) unique to each participant.
Before completing the DCE, participants were shown examples of the r-hGH injection and device descriptions that they would see, along with images of the different devices (see example in Figure 1). This served to ensure that all participants had a consistent understanding of the devices being considered.
Participants were asked to complete choice tasks to express their preference between alternative features related to r-hGH injections and injection devices, represented in product profiles generated based on the attributes and level grid (see Table 1 for an outline of all attributes and levels, and Figure 2 for an example DCE question). Specifically, in the DCE, each participant was presented with 20 choice tasks to complete, and each saw a different series of choice tasks to offset effects of chance association with a single set of choices. In this study, it was not feasible to have each participant evaluate every possible combination of regimen/device features and pairs (given the high number of possible combinations). Thus, the choice tasks that each participant completed were determined via an experimental design based on the pre-defined attributes and levels grid (ie, the design determined the combination of attribute levels included in each task for each respondent). The design was constructed to achieve a balanced design across the respondent sample, where “balanced” refers to a number of balancing principles (it is generally not possible to achieve perfect balance across all criteria):
Equal frequency of presentation of levels,
Equal levels of pairing of attribute levels across the profiles,
Equal pairwise frequency of attribute X level with attribute X level (subject to prohibitions), and
Equal frequency of appearance of levels in either profile A or profile B (in a two-profile study).
Figure 2.
Example discrete choice experiment question.
Each participant was assigned a design version, and the survey logic balanced the distribution of versions. Each individual choice task asked participants to pick between two profile options, with each profile option consisting of a different combination of device and injection features developed based upon the attributes and levels grid (see Table 1). Participants were presented with two options and asked which they would choose if the two presented options were the only two available for injecting growth hormone. The DCE was intended to measure participant preferences between the different device and injection options.
After completing all 20 choice tasks, all participants were then shown the same series of three “fixed” profiles for hypothetical products described as profiles X, Y, and Z. Each profile was identical (ie, a ready to use medication needing to be stored in the refrigerator, using a multi-use disposable pen injection device that requires the user to set the dose) with only the injection schedule differentiating each of the three profiles. For each of these profiles, participants were asked whether they would choose that product profile over their current r-hGH device and schedule if their doctor were to offer it to them. Profile X included a once-weekly injection schedule, Profile Y included injections once every two weeks, and Profile Z included a monthly injection schedule. This was intended to determine which injection schedules are valued enough by patients and caregivers to result in a desire to switch.
Analyses
Weighting
Data were weighted to give equal weight to each analysis group: child/caregiver dyads, adolescent/caregiver dyads, and adults.
Analysis of the DCE (Choice-Based Conjoint Analysis)
Hierarchical Bayes Modelling was used to estimate utilities for each attribute level, from which we can then determine the relative importance of attributes as choice predictors. This process extracts logistic coefficients at the level of the individual respondent for each of the attributes and levels from the grid of options used to construct the discrete choice task profiles. This is the fundamental analysis providing the basis for all further analyses of the choice data. Participant preferences were estimated at individual and aggregate levels.
The paradigm behind the design was a part-worth model in which the “worth” of a product profile can be broken down into a sum of the individual “worths” of each of the attribute levels (“part worths”). Part-worth utilities were derived from the task design information and the 20 task choices completed by each respondent using Hierarchical Bayesian (HB).
Choice tasks were designed using Sawtooth’s “Complete Enumeration” design method, which aims to create task profiles as statistically independent as possible, with two-way frequency of level combinations equally balanced,21 meaning each attribute level is evaluated an equal number of times with all levels of the other attributes (for example, attribute 1 level 1 was presented the same number of times as attribute 2 level 1).
Raw Utilities
Utilities measure the value of each attribute level to the respondents. Raw utilities were used to scale the data; in this form, the sum of utilities for each attribute level and each respondent sum to zero. The utilities have been rescaled to a minimum of zero (for the least valued attribute level) and scaled relative to the one attribute level on the grid with the highest value (which is given the value 100%).
Relative Importance
Relative importance, the degree to which changes across the levels of that attribute will have an impact on preference share, was calculated in two ways:22,23
Individual relative importance (IRI): utility range (maximum minus minimum) of each attribute was calculated for each participant and summed; the attribute’s proportion of that sum is its IRI.
Aggregate relative importance (ARI): utilities for each level of each attribute were averaged across participants, and then range-sum-average calculation was applied to the averages.
Aggregate relative importance sums to 100% across attributes with IRI calculated relative to ARI. When the ARI score is greater than the IRI score for an individual attribute, this implies that the respondents collectively are more in agreement about the importance of an attribute and the order of preference across the levels. Conversely, when the IRI score is greater than the ARI score, then there is less agreement among respondents across the dataset on the preference order of the levels.
“Fixed” Hypothetical Product Profiles
Respondents were asked to choose whether they would switch from their current device to each profile if given the chance; and the percentage of respondents who indicated that they would switch to each hypothetical profile was reported.
Software
Lighthouse Studio 9 Version 9.3.1, “Analysis Manager” module, was used to run the HB analyses. Microsoft Office Standard 2010: Excel Version 14.0.7177.5000 (32 bit) was used for supplementary analyses.
Results
Participants
A total of 224 participants completed the DCE (child/caregiver dyads n=70, 31.3%, adolescent/caregiver dyads n=79, 35.3%, adult n=75, 33.5%). Patient ages ranged from 3 to 87 years (as per the study’s inclusion/exclusion criteria no patients 18–24 years of age were recruited). Patients were predominantly male (58%), and the majority were white (84%). Among adult patients and caregivers, 87% and 92%, respectively, reported some college or higher education level. Please see Tables 3 and 4 for patient demographic and health information, and caregiver demographic information, respectively.
Table 3.
Patient Characteristics
| Characteristic | Total Participants (N=224)* | ||
| Children (3–11 Years) (n=70) | Adolescents (12–18 Years) (n=79) | Adults (≥25 Years) (n=75) | |
| Age (years) | |||
| Mean (SD) | 8.7 (2.2) | 13.9 (1.4) | 50.3 (11.7) |
| Min-Max | 3.0-11.0 | 12.0-17.0 | 28.0-87.0 |
| Gender (n, %) | |||
| Male | 44 (62.9%) | 60 (75.9%) | 25 (33.3%) |
| Female | 26 (37.1%) | 19 (24.1%) | 50 (66.7%) |
| Location of residency (n, %) | |||
| Arizona | 2 (2.9%) | 5 (6.3%) | 1 (1.3%) |
| Arkansas | -- | -- | 1 (1.3%) |
| California | 8 (11.4%) | 9 (11.4%) | -- |
| District of Columbia |
-- | -- | 1 (1.3%) |
| Florida | 12 (17.1%) | -- | 2 (2.7%) |
| Georgia | 1 (1.4%) | -- | -- |
| Kansas | -- | -- | 2 (2.7%) |
| Louisiana | -- | -- | 3 (4.0%) |
| Nevada | 28 (40.0%) | 38 (48.1%) | -- |
| North Carolina | -- | 1 (1.3%) | -- |
| Ohio | 18 (25.7%) | 25 (31.6%) | 14 (18.7%) |
| Pennsylvania | 1 (1.4%) | -- | 13 (17.3% |
| Texas | -- | -- | 38 (50.7%) |
| West Virginia | -- | 1 (1.3%) | -- |
| Race (n, %) | |||
| Asian | 5 (7.1%) | 4 (5.1%) | 0 (0.0%) |
| Black or African-American |
2 (2.9%) | 2 (2.5%) | 1 (1.3%) |
| Native Hawaiian or Other Pacific Islander | 0 (0.0%) | 1 (1.3%) | 0 (0.0%) |
| White | 55 (78.6%) | 63 (79.7%) | 71 (94.7%) |
| Other | 8 (11.4%) | 9 (11.4%) | 3 (4.0%) |
| Ethnicity (n, %) | |||
| Hispanic or Latino |
6 (8.6%) | 14 (17.7%) | 5 (6.7%) |
| Not Hispanic or Latino |
64 (91.4%) | 65 (82.3%) | 70 (93.3%) |
| Not answered | 0 (0.0%) | 0 (0.0%) | 0 (0.0%) |
| Education (n, %) | |||
| 5th grade | 16 (8.0%) | ||
| 2nd grade | 11 (5.5%) | ||
| 4th grade | 11 (5.5%) | ||
| 3rd grade | 6 (3.0%) | ||
| Preschool | 4 (2.0%) | ||
| 1st grade | 3 (1.5%) | ||
| 7th grade | 16 (8.0%) | ||
| 8th grade | 15 (7.5%) | ||
| 6th grade | 12 (6.0%) | ||
| 9th grade | 12 (6.0%) | ||
| 10th grade | 7 (3.5%) | ||
| 11th grade | 3 (1.5%) | ||
| 12th grade | 1 (0.5%) | ||
| Other | 6 (3.0%) | 6 (3.0%) | |
| College or university degree (2- or 4-year) | 32 (16.0%) | ||
| Graduate degree | 17 (8.5%) | ||
| High school diploma (or GED) or less | 16 (8.0%) | ||
| Some college or certificate program | 7 (3.5%) | ||
| Overall health (n, %) | |||
| Excellent | 28 (40.0%) | 40 (50.6%) | 6 (8.0%) |
| Very good | 31 (44.3%) | 28 (35.4%) | 17 (22.7%) |
| Good | 10 (14.3%) | 10 (12.7%) | 38 (50.7%) |
| Fair | 1 (1.4%) | 1 (1.3%) | 8 (10.7%) |
| Poor | 0 (0.0%) | 0 (0.0%) | 6 (8.0%) |
| Participant impression of overall GHD severity (n, %) | |||
| Very mild | 0 (0.0%) | 0 (0.0%) | 0 (0.0%) |
| Mild | 2 (2.9%) | 7 (8.9%) | 6 (8.0%) |
| Moderate | 33 (47.1%) | 40 (50.6%) | 29 (38.7%) |
| Severe | 28 (40.0%) | 27 (34.2%) | 27 (36.0%) |
| Very severe | 7 (10.0%) | 5 (6.3%) | 13 (17.3%) |
Notes: *A total of 302 patients were screened, and of these 224 patients were eligible to participate and completed the study.
Table 4.
Caregiver Characteristics (Caregivers of Patients 3–18 Years [N=149])
| Characteristic | Caregivers of Patients 3–18 Years (N=149) |
|---|---|
| Age (Years) | |
| Mean (SD) | 23.0–59.0 |
| Min-Max | 42.7 (6.9) |
| Gender (n, %) | |
| Male | 22 (14.8%) |
| Female | 127 (85.2%) |
| Race (n, %) | |
| Asian | 9 (6.0%) |
| Black or African-American | 5 (3.4%) |
| Native Hawaiian or Other Pacific Islander | 1 (0.7%) |
| White | 126 (84.6%) |
| Other | 8 (5.4%) |
| Ethnicity (n, %) | |
| Hispanic or Latino | 14 (9.4%) |
| Not Hispanic or Latino | 0 (0.0%) |
| Not answered | 135 (90.6%) |
| Education (n, %) | |
| College or university degree (2- or 4-year) | 49 (24.5%) |
| Graduate degree | 35 (17.5%) |
| Some college or certificate program | 30 (15.0%) |
| High school diploma (or GED) or less | 8 (4.0%) |
| Living Status (n, %) | |
| Living alone | 12 (8.1%) |
| Living with family or friends | 125 (83.9%) |
| Other | 12 (8.1%) |
| Not answered | 0 (0.0%) |
| Work Status (n, %) | |
| Working full-time | 82 (55.0%) |
| Working part-time | 22 (14.8%) |
| Homemaker | 37 (24.8%) |
| Student | 1 (0.7%) |
| Retired | 2 (1.3%) |
| Unemployed | 2 (1.3%) |
| On disability | 1 (0.7%) |
| Other | 2 (1.3%) |
| Not answered | 0 (0.0%) |
Relative Importance
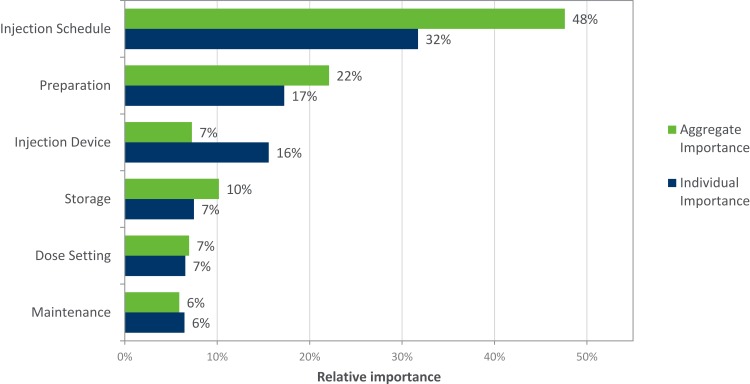
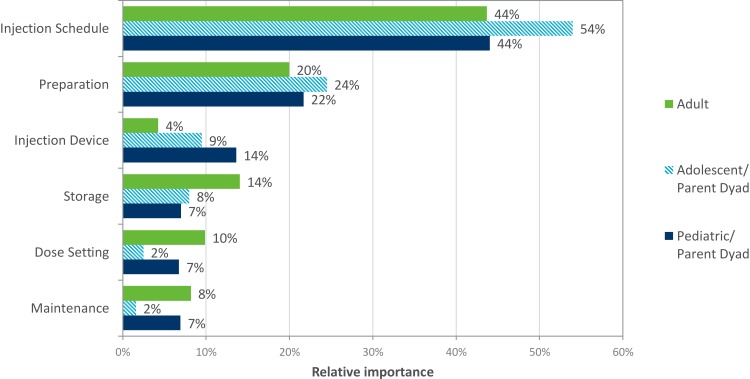
Injection schedule emerged as the most important device attribute (ie, strongest predictor of choice) (Figure 3) for both aggregate (averaged across all participants) and individual importance. Injection device has a higher individual importance, meaning there is disagreement across participants about which device level is preferred. When examining importance by patient group, injection schedule was also the strongest predictor (Figure 4).
Figure 3.
Average relative importance of attributes. Base: All patients (Total weighted, n=224).
Figure 4.
Average relative importance of attributes by patient cohort. Base: All patients (Total weighted, Adult, n=75; Adolescent Dyad, n=79; Pediatric Dyad, n=70).
Utilities
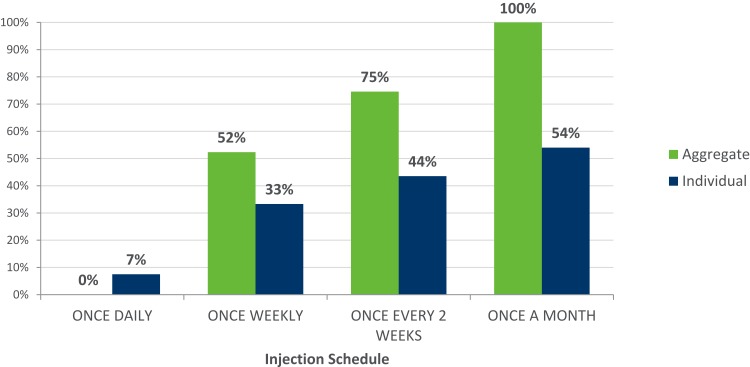
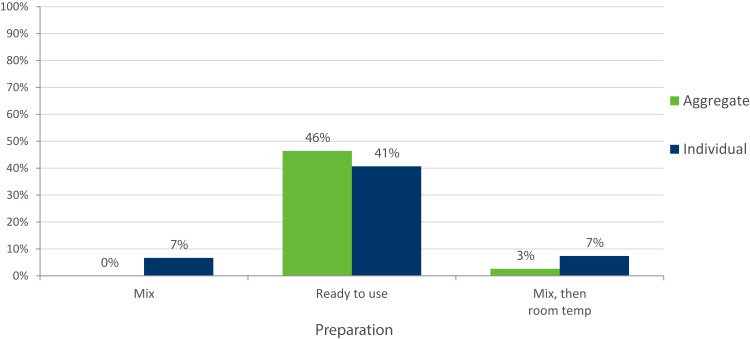
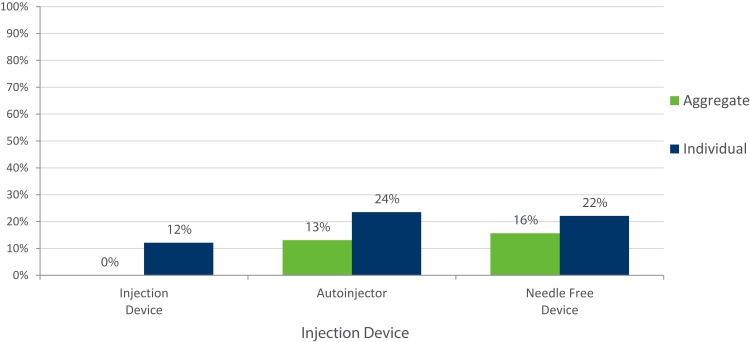
Less frequent injection schedules were more likely to be chosen by participants on both aggregate and individual levels (Figure 5). A “ready to use” injection was preferred (Figure 6), and participants demonstrated no preference for auto-injector vs needle-free device (Figure 7).
Figure 5.
Average relative utility of injection schedule attribute. Base: All patients (Total weighted, n=224).
Figure 6.
Average relative utility of preparation attribute. Base: All patients (Total weighted, n=224).
Figure 7.
Average relative utility of injection device attribute. Base: All patients (Total weighted, n=224).
Fixed Profile Choice
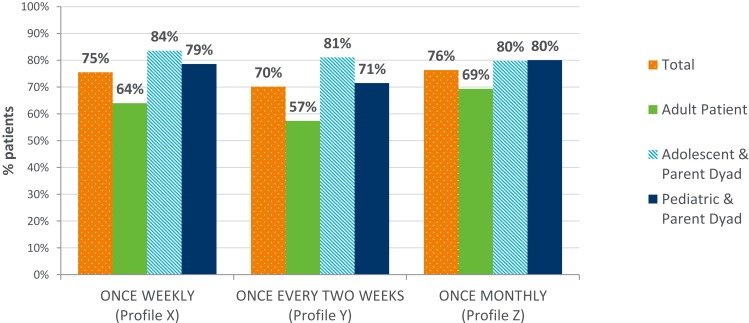
When presented with the three fixed profiles to assess patient desire to switch device, the majority of participants would choose the presented injection device and less frequent dosing over their current device/schedule (Figure 8). Adults were less likely to choose to switch devices than adolescent and pediatric parent dyads.
Figure 8.
Percentage of participants that would choose the new profile over current treatment. Base: All patients (Total weighted, n=224; Adult, n=75; Adolescent Dyad, n=79; Pediatric Dyad, n=70).
Discussion
This DCE study was designed to estimate the relative importance and preferences for different aspects of the growth hormone injection device’s use and handling. This patient preference study is the first study that we are aware of to evaluate patient preference for GH injections in this way. The strength of this DCE enabled an exploration of preferences relating to alternative options for delivery of r-hGH which are not currently available.
The focus of the study was on the degree to which each attribute contributed to the desirability of a pen device, rather than whether a particular device configuration would actually be used (or would be more preferable compared to existing options). This study, involving children, adolescents (and their caregivers) and adults yielded several results of interest. Overall, respondents indicated a clear preference for a less frequent injection schedule rather than daily injections (ie, a preference for weekly, bi-monthly or monthly injections). This attribute was more important relative to others.
The study also included a separate exercise looking at the uptake of whether the participant would choose to switch from their current daily pen device, if given the chance, to a less frequent injection schedule. The results show that the vast majority of respondents would switch to a less frequent injection administration (either weekly, biweekly or monthly, although there appeared to be slightly less support for a schedule given once every two weeks).
The results for each age category (children, adolescents and adults) are generally consistent. However, results indicate that adolescents showed a greater tendency to switch to a less frequent injection schedule compared to the adult and pediatric cohorts. This is perhaps unsurprising, as evidence suggests that adherence to treatment in this age group reduces. Hence, the availability of an injection pen which requires only a once-weekly injection, or even fewer administrations, could offer patients a valuable option which could improve adherence and persistence, with potential clinical implications for improved growth outcomes.
The lower preference for a less frequent injection schedule seen in our adult cohort is aligned with a recent publication24 which also reported that adult patients were less likely to switch to a weekly injection schedule. The Amereller study suggests that if patients were provided with additional information regarding the efficacy and safety of a newly introduced product, patients may be more willing to switch when they are offered a choice between weekly and daily injection schedules.
DCE studies have some limitations. The potential for hypothetical bias is a general concern. Choices involving hypothetical treatments do not have the same clinical, financial and emotional consequences of experiencing the actual treatment.14 Hence, differences may arise between patients stated and actual choices. In this study, all respondents had considerable experience treating their GHD with daily injections; none of the respondents had experience or knowledge of alternative injection schedules.
All recruited participants were enrolled exclusively from clinics in the US, and while treatment for GHD is standard across different countries and regions, and therefore bias should be minimal, in an ideal scenario, patient preferences from other countries should also have contributed to these results. While patients in transition were excluded from this study, future research should explore the experiences of these patients.
Whilst the authors identified the attributes via internal consultation and previous research, the attributes identified and evaluated had not been robustly researched via a literature review and this could also be considered a limitation of the study. However, it is unlikely that a key attribute had been omitted. Attributes in DCE studies are always pre-defined and therefore it is possible a more relevant attribute may have been missed, but this is a limitation of all DCE studies.
One strength of the recruited sample is that since all respondents had participated in a broader clinical study we can be assured that everyone had been confirmed with a diagnosis of GHD. All participants in the clinical study participated in the conjoint analysis, with no drop outs – suggesting completion was not burdensome or challenging.
The attributes and scenarios applied in this study were tested in a set of 10 pilot interviews, during which respondents completed the online DCE exercise while a moderator observed them completing the exercise via screen share. During and after the exercise, the moderator asked the respondent targeted questions to ensure they understood the content and options presented. The results of this pilot study indicated that the attributes and scenarios were tangible and easily understood by respondents, so it is unlikely to have led to misunderstandings or lack of comprehension which may have led to varying interpretations of the data.
In conclusion, the voice of the patient and patient preferences regarding novel and different treatment options is becoming increasingly important to many stakeholders, in particular regulators who are interested in how these studies may best support the benefit/risk analysis of a new drug. In this study, the DCE was successful in evaluating the tradeoffs and preferences patients with GHD and caregivers (dyads), when appropriate, were willing to make amongst injection pen attributes. The findings from this study suggest that a less frequent injection schedule is the most preferred and important attribute for patients with GHD. Less frequent injection schedules25 may be an important factor to improve compliance in this therapy area, which would lead to improved outcomes in the longer term. A recommended next step would be to conduct a randomized clinical trial, and ideally a real-world data study, to scientifically and robustly determine the clinical implications of a less frequent injection regimen.
Conclusion
Injection schedule was rated as the most important aspect to patients when evaluating alternative ways to take their growth hormone – in general, patients preferred a weekly (or less frequent) r-hGH injection regimen to a daily regimen. Addressing patient preferences for treatment may improve compliance, adherence, and ultimately, clinical outcomes. This may be particularly important in adolescents and pediatrics.
The findings from this study suggest that a less frequent injection schedule is the most preferred and important attribute for patients with GHD. Less frequent injection schedules25 may be an important factor to improve compliance in this therapy area, which would lead to improved outcomes in the longer term.
Acknowledgments
Components of this research were summarized in individual poster presentations, including: ISPOR 22nd Annual International Meeting, Boston, MA, May 20-24, 2017; ISPOR 20th Annual European Congress, Glasgow, Scotland, November 4-8, 2017; ISPOR 23rd Annual International Meeting, Baltimore, MD, May 19-23, 2018; and the 57th Annual European Society for Paediatric Endocrinology (ESPE) Meeting, Athens, Greece, September 27-29, 2018. We thank Pfizer colleague Alesia Sadosky for her editorial review of this manuscript.
Funding Statement
Pfizer, Inc. sponsored the research reported in this manuscript. MM and HG are employees of Adelphi Research and DTB and AY are employed by Adelphi Values and all were paid consultants to Pfizer in connection with the development of this manuscript. HW, now retired, was employed by Adelphi Research at the time that the study was conducted and was a paid consultant to Pfizer in connection with the development of this manuscript. A Pleil was a Pfizer employee at the time the research was conducted. For the manuscript development, he acted as an unpaid independent research and evaluation consultant to Pfizer. All authors contributed to the development of the publication and maintained control over the final content.
Author Contributions
All authors contributed to data analysis, drafting or revising the article, gave final approval of the version to be published, and agree to be accountable for all aspects of the work.
Disclosure
MM and HG are employed by Adelphi Research. DTB and AY are employed by Adelphi Values. JL and AP are employed by and own stocks from Pfizer. HW was employed by Adelphi Research at the time that the study was conducted and is now retired. A Pleil is an independent research and evaluation consultant who was employed by Pfizer at the time of the research and owns stocks from Pfizer. The authors report no other conflicts of interest in this work.
References
- 1.Kluetz PG, O’connor DJ, Soltys K. Incorporating the patient experience into regulatory decision making in the USA, Europe, and Canada. Lancet Oncol. 2018;19(5):e267–e274. doi: 10.1016/S1470-2045(18)30097-4 [DOI] [PubMed] [Google Scholar]
- 2.US Department of Health and Human Services, Food and Drug Administration, Center for Devices and Radiological Health, Center for Biologics Evaluation and Research. Guidance for Industry: Patient Preference Information – Voluntary Submission, Review in Premarket Approval Applications, Humanitarian Device Exemption Applications, and De Novo Requests, and Inclusion in Decision Summaries and Device Labeling; 2016. [Google Scholar]
- 3.Postmus D, Mavris M, Hillege HL, et al. Incorporating patient preferences into drug development and regulatory decision making: results from a quantitative pilot study with cancer patients, carers, and regulators. Clin Pharmacol Ther. 2016;99(5):548–554. doi: 10.1002/cpt.v99.5 [DOI] [PubMed] [Google Scholar]
- 4.healthcare Ifqaei. Background: what are patient preferences? Accessed 24 June, 2019.
- 5.UK R. NICE given grant to research patient preference; 2016. Accessed 24June, 2019.
- 6.Louviere JJ, Flynn TN, Carson RT. Discrete choice experiments are not conjoint analysis. J Choice Modell. 2010;3(3):57–72. doi: 10.1016/S1755-5345(13)70014-9 [DOI] [Google Scholar]
- 7.Thurstone LL. A law of comparative judgment. Psychol Rev. 1927;34(4):273–286. doi: 10.1037/h0070288 [DOI] [Google Scholar]
- 8.Mangham LJ, Hanson K, McPake B. How to do (or not to do) … Designing a discrete choice experiment for application in a low-income country. Health Policy Plan. 2009;24(2):151–158. doi: 10.1093/heapol/czn047 [DOI] [PubMed] [Google Scholar]
- 9.Koledova E, Stoyanov G, Ovbude L, Davies PSW. Adherence and long-term growth outcomes: results from the easypod. Endocr Connect. 2018;7(8):914–923. doi: 10.1530/EC-18-0172 [DOI] [PMC free article] [PubMed] [Google Scholar]
- 10.Rosenfeld RG, Bakker B. Compliance and persistence in pediatric and adult patients receiving growth hormone therapy. Endocr Pract. 2008;14(2):143–154. doi: 10.4158/EP.14.2.143 [DOI] [PubMed] [Google Scholar]
- 11.Cutfield WS, Derraik JG, Gunn AJ, et al. Non-compliance with growth hormone treatment in children is common and impairs linear growth. PLoS One. 2011;6(1):e16223. doi: 10.1371/journal.pone.0016223 [DOI] [PMC free article] [PubMed] [Google Scholar]
- 12.Boye KS, Matza LS, Walter KN, Van Brunt K, Palsgrove AC, Tynan A. Utilities and disutilities for attributes of injectable treatments for type 2 diabetes. Eur J Health Econ. 2011;12(3):219–230. doi: 10.1007/s10198-010-0224-8 [DOI] [PubMed] [Google Scholar]
- 13.Quitmann J, Bloemeke J, Silva N, et al. Quality of life of short-statured children born small for gestational age or idiopathic growth hormone deficiency within 1 year of growth hormone treatment. Front Pediatr. 2019;7:164. doi: 10.3389/fped.2019.00164 [DOI] [PMC free article] [PubMed] [Google Scholar]
- 14.Reed Johnson F, Lancsar E, Marshall D, et al. Constructing experimental designs for discrete-choice experiments: report of the ISPOR conjoint analysis experimental design good research practices task force. Value Health. 2013;16(1):3–13. doi: 10.1016/j.jval.2012.08.2223 [DOI] [PubMed] [Google Scholar]
- 15.Maniatis AK, Thornton P, Hofman P, et al. The pivotal phase 3 heiGHt Trial of Weekly TransCon™ hGH vs. Daily hGH in treatment-naïve subjects with pediatric growth hormone deficiency. Poster presented at the Pediatric Academic Societies/Pediatric Endocrine Society Annual Meeting(PAS/PES), April 27-30, 2019 (Baltimore MD). [Google Scholar]
- 16.Biospace. New Phase 2 data for somapacitan demonstrate its potential as an efficacious once-weekly treatment for childhood growth hormone deficiency. Published Sept 28 2018. Available from: https://www.biospace.com/article/new-phase-2-data-for-somapacitan-demonstrate-its-potential-as-an-efficacious-once-weekly-treatment-for-childhood-growth-hormone-deficiency/. Accessed March 27, 2020. [Google Scholar]
- 17.Hauffa BP, Touraine P, Urquhart--Kelly T, Koledova E. Managing transition in patients treated with growth hormone. Front Endocrinol (Lausanne). 2017;8:346. doi: 10.3389/fendo.2017.00346 [DOI] [PMC free article] [PubMed] [Google Scholar]
- 18.Clayton PE, Cuneo RC, Juul A, Monson JP, Shalet SM, Tauber M. Consensus statement on the management of the GH-treated adolescent in the transition to adult care. Eur J Endocrinol. 2005;152(2):165–170. doi: 10.1530/eje.1.01829 [DOI] [PubMed] [Google Scholar]
- 19.Cook DM, Yuen KC, Biller BM, Kemp SF, Vance ML. American Association of Clinical Endocrinologists medical guidelines for clinical practice for growth hormone use in growth hormone-deficient adults and transition patients – 2009 update. Endocr Pract. 2009;15(Suppl 2):1–29. doi: 10.4158/EP.15.S2.1 [DOI] [PubMed] [Google Scholar]
- 20.Tritos NA, Hamrahian AH, King D, et al. A longer interval without GH replacement and female gender are associated with lower bone mineral density in adults with childhood-onset GH deficiency: a KIMS database analysis. Eur J Endocrinol. 2012;167(3):343–351. doi: 10.1530/EJE-12-0070 [DOI] [PMC free article] [PubMed] [Google Scholar]
- 21.Chrzan K, Orme B. An Overview and Comparison of Design Strategies for Choice-Based Conjoint Analysis. Sawtooth Software Inc; 2000. [Google Scholar]
- 22.Orme B. Getting Started with Conjoint Analysis: Strategies for Product Design and Pricing Research. 2nd ed. Madison, Wis: Research Publishers LLC; 2010. [Google Scholar]
- 23.Software S. The Basics of Interpreting Conjoint Utilities; 2019. [Google Scholar]
- 24.Ammareller F, Schilback K, Schopohl J, Stormann S. Adherence, attitudes and beliefs of growth hormone deficient patients – a questionnaire-based cohort study. Exp Clin Endocrinol Diabetes. 2019. [DOI] [PubMed] [Google Scholar]
- 25.Beusterien KM, Dziekan K, Flood E, Harding G, Jordan JC. Understanding patient preferences for HIV medications using adaptive conjoint analysis: feasibility assessment. Value Health. 2005;8(4):453–461. doi: 10.1111/j.1524-4733.2005.00036.x [DOI] [PubMed] [Google Scholar]


