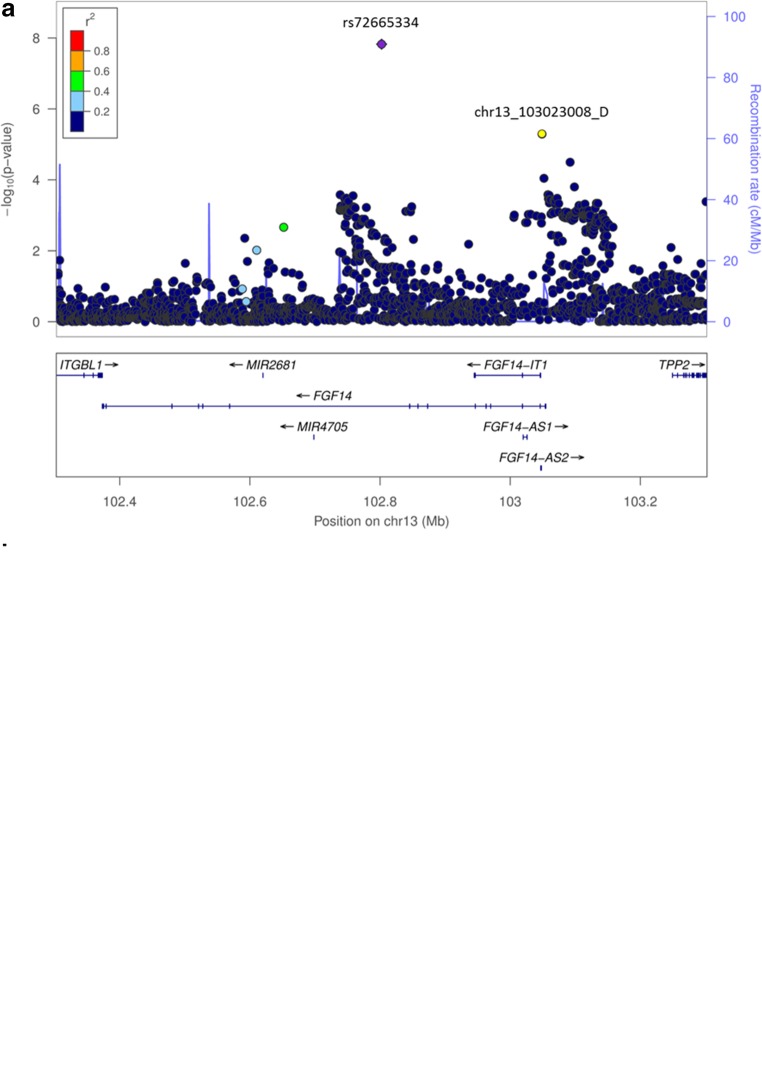
Fig. 4.
Regional association plots for loci associated with DBN. In order to highlight the statistical strength of the association in the context of the surrounding markers, gene annotations and estimated recombination rates (NCBI build 37) of the SNPs in the specific regions are plotted against their corresponding p values (as −log10 values, left-hand y-axis). A purple diamond represents the SNP with the highest association signal in each locus. All other SNPs are represented as single dots, where dot colors indicate the LD with the associated SNP. Color coding represents the r2 value, and respective categories are shown on the upper left hand side. Estimated recombination rates (cM/Mb) are plotted to reflect the local LD structure surrounding the associated SNP and are shown as vertical light blue lines, marked on the right-hand y-axis. Genes in the region are displayed below. The orientation of the genes is indicated by arrows. a Regional association plot of the FGF14 variations on chromosome 13q33.1 associated with DBN. The genome-wide–associated SNP (rs72665334, purple diamond) is localized in intron 9, the suggestive hit chr13_103023008_D (yellow circle) in intron 1 of the fibroblast growth factor 14 gene (FGF14). LD structure refers to the genome-wide associated variant rs72665334. b Regional association plot of the merged region on chromosome 5 containing the overlapping genes DHFR and MSH3 and the respective hits (rs245100, purple; rs33003, yellow). LD structure refers to the associated variant localized in DHFR (rs245100)

