Abstract
Multiple elements are required to be allocated to different organs to meet the demands for plant growth, reproduction, and maintenance. However, our knowledge remains limited on the stoichiometry in all plant organs in response to heterogeneous environments. Here, we present the systematic investigation of multielemental stoichiometry in organs of the alpine plant Gentiana rigescens across different environmental conditions. The slopes of N–P stoichiometric relationships among organs in G. rigescens did not differ significantly between environments even in flowers, the most active organ with the highest N and P level. C:P ratios had strong positive relationships with N:P ratios within and between organs. Zn had strong positive correlations with Fe, S, or Cu in each organ, indicating the potential interactions among the homeostases of these elements. The contents of macroelements, such as C, N, P, Ca, Mg, and S, were higher in plant organs than those in soil and exhibited a relatively narrow range in plant organs. However, G. rigescens reduced Fe uptake from soil and showed the strictest homeostasis in its root, implying its resistance to excess Fe. Furthermore, precipitation and temperature associated with geography, followed by soil P, were the main divers for the multielemental stoichiometry in this species. Plant stoichiometry responded differently to abiotic environmental factors, depending on organ type and element. N:P ratio, no matter in which organ, showed little flexibility to climate factors. The results have implications for understanding the regulation of multielemental stoichiometry in plant individuals to environmental changes. Further studies are needed on the interactions of multielement homeostasis in plants.
Keywords: homeostasis, nutrient, herbaceous plant, reproduction, soil, climate
Introduction
Ecological stoichiometry offers a framework to understand the balance of multiple elements in ecological interactions and processes (Elser et al., 2010). Under this framework, the degree to which organisms maintain a constant elemental composition in response to the availability of their environmental resources is referred to as “stoichiometric homeostasis” (Sterner and Elser, 2002). For example, an organism’s carbon/nitrogeN:Phosphorus stoichiometry tends to be more constrained than the stoichiometry of its environment (Sardans et al., 2012). In addition, the core central tendency in N:P ratio is similar among observations in different biota, which could be due to the similar biochemical investment across all biota (Zhang and Elser, 2017). Apart from C, N, and P, a more complete understanding of homeostasis necessitates the consideration of other elements, especially the nutrient elements for plant growth (Jeyasingh et al., 2017; Ågren and Weih, 2020). Potassium (K) is the second most abundant nutrient in plant photosynthetic tissues and is required for many functions, such as the maintenance of electrical potentials across cell membranes (Britto and Kronzucker, 2008; Sardans and Peñuelas, 2015). Calcium (Ca) is another essential nutrient for plants and is required for structural roles in the membranes and cell wall (White and Broadley, 2003). Magnesium (Mg) is vital for the function of many cellular enzymes and for the aggregation of ribosomes, and the maintenance of its homeostasis in the plant is essential for viability (Shaul, 2002). Sulfur (S) plays critical roles in many biological processes, including the role linked to trace element homeostasis in plants (Na and Salt, 2011). Iron (Fe) is an essential cofactor for fundamental biochemical activities, so Fe homeostasis plays an important role in plant nutrition (Vigani et al., 2013). Plants only need small amounts of manganese (Mn), which vary more than two orders of magnitude in soils (Shao et al., 2017); therefore, plants must maintain their Mn homeostasis for health growth. Copper (Cu) is one of the essential trace elements for plants and is a cofactor in proteins that are involved in electron transfer reactions (Burkhead et al., 2009). Zinc (Zn) with multifunctions in all plants has key roles in basal metabolism, defense, and virulence (Cabot et al., 2019).
When nutrients are taken up by plants, plentiful processes regulate elemental homeostasis to maintain plant function (Sperfeld et al., 2017). Multiple elements are required to be allocated to different organs to meet the demands for plant growth, reproduction, and maintenance (Wang et al., 2012). It is necessary to consider all plant organs in understanding how plants respond to nutrient limitation and changing environmental conditions (Allen and Gillooly, 2009; Kleyer and Minden, 2015). In a previous study, distinct patterns of C:N:P stoichiometry have been found in plant organs related to their internal function (Minden and Kleyer, 2014). Stoichiometric homeostasis for N and P has been found among vegetative tissues in forest plant (Zhang et al., 2018a). However, relatively little is known about multielemental stoichiometry at organ level, especially in reproductive tissue, in whole plant individuals.
Many plant species are distributed at relatively wide spatial scales and are, therefore, exposed to heterogeneous environments (Helsen et al., 2017). An understanding of stoichiometry within individuals is a key component for the accurate prediction of responses of plants to environmental change (Sistla and Schimel, 2012). Soil nutrient availability, as well as plant nutrient demand under climate change, can affect leaf element contents and their coupling (Tian et al., 2019). Several systematic investigations or meta-analysis studies have been done on the effects of soil and climate on plant C:N:P stoichiometry at global scale (Reich and Oleksyn, 2004; Sardans et al., 2017), regional scale (Yang et al., 2015; Zhang et al., 2018b), or local scale (Zhao et al., 2014). Some studies on plant stoichiometry that go beyond C, N, and P under different environmental conditions were also carried out. For example, Han et al. (2011) found that variation in leaf elemental content was more constrained for nutrients with the highest requirements. In a fertilizer experiment with different Salix spp. genotypes, difference in the elemental contents in the environment was the major driver of variation in leaf nutrient relations (Ågren and Weih, 2012). However, our knowledge remains limited on multielemental stoichiometry in plant organs to nutrient stress or climate change.
To address these gaps in our knowledge, here, we present the systematic investigation of multielemental stoichiometry in organs of an alpine plant across different environmental conditions. Our questions are as follows. Does multielemental stoichiometry differ among organs? How does the plant regulate the elemental stoichiometry to response soil nutrient heterogeneity? Is multielemental stoichiometry in plants affected by different climates? Answering these questions will help us understand how plant regulates its multielemental stoichiometry in response to heterogeneous environments.
Materials and Methods
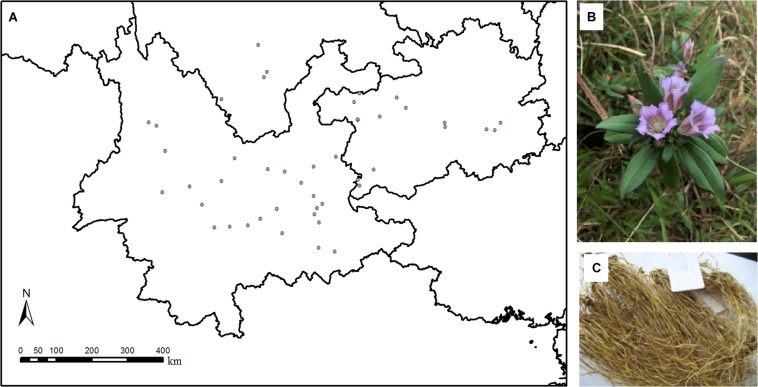
Our investigations were conducted in Yunnan–Guizhou Plateau, southwest China. This area is very close to the Qinghai–Tibet Plateau, which is considered to be a geographical source area for genus Gentiana (Favre et al., 2016). Gentiana rigescens Franch. ex Hemsl. (Gentianaceae) is a perennial plant distributed in the elevation range of 1,100–3,000 m in subtropical evergreen broad-leaved and sclerophyllous forests, subtropical conifer forest, and subtropical mixed deciduous-evergreen shrubland in southwest China (Li and Walker, 1986; Flora of China Editorial Committee, 1988). From December 2012 to January 2013 and October to November 2013 (within the populations’ flowering period), we investigated 45 wild populations of G. rigescens in Yunnan, Guizhou, and Sichuan provinces, China in the elevation range of 1,230–2,980 m and in the latitude range of 23.316–28.524°N (Figure 1 and Supplementary Table S1). In each sampling site, 10 plant individuals at the flowering stage were dug out carefully with roots from soil and washed. Each individual was divided into roots, stems, leaves, and flowers. The same plant organs from the same sampling site were pooled, which means that there were totally 45 samples for each plant organ. The plant samples were dried to constant mass at 60°C, powdered, screened (<0.125 mm), and kept in polyethylene bag for chemical analyses. From each sampling site, five subsamples of top soil (0–20 cm) were bulked into one soil sample, except two sites. Therefore, totally, 43 soil samples across southwest China were collected. After removing the debris, the samples were air dried and screened (<0.125 mm). The mean annual temperature (MAT) and the mean annual precipitation (MAP) data of the sampling sites in 2012 were obtained from a temperature and precipitation interpolated 1 km spatial resolution raster data (Wang et al., 2017).
FIGURE 1.
Sampling sites and samples of Gentiana rigescens. (A) Sampling sites of the plant species in southwest of China. (B) Above-ground part of the plant species. (C) Below-ground part of the plant species.
The soil and plant samples were kept at 60°C for 24 h using an electrically heated laboratory oven before analyses. Total C and N contents in the samples were directly determined by an elemental analyzer (Model Vario MAX CN, Elementar Analysensysteme GmbH, Germany). Total contents of P, K, Ca, Mg, S, Fe, Mn, Cur, and Zn were determined by an inductively coupled plasma atomic-emission spectrometer (Model iCAP6300, Thermo Fisher Scientific, United States) after wet digestion. Several standard reference materials, such as GBW 10015 (GSB-6) spinach and GBW 10052 (GSB-30) green tea, were purchased from the National Research Center for Certified Reference Materials of China to verify the elemental analysis methods. A digital pH meter (Model FE20, Mettler-Toledo International Inc., China) was used to determine the soil pH. Soil organic matter content was determined by the potassium dichromate volumetric method.
Raw data are available in Supplementary Data Sheet S1. Data were log10 transformed before statistical analysis. Linear regression models of the form
were used for the stoichiometric relationships defined as logy and logx, where x is the P content (or element contents in soils), y is the N content (or element contents in plants), a is the slope, and logb is the intercept. The strength of elemental homeostasis is expressed as the homeostasis regulation coefficient H, which is calculated as 1/slope (Sterner and Elser, 2002). We estimated the stoichiometric relationships by standardized major axis regression and tested for a common slope among several stoichiometric relations using R software version 3.5.3 package “smatr” version 3.4-8 (Warton et al., 2012; R Core Team, 2019). A heatmap integrated with dendrogram was performed to explore correlations of the element contents and C, N, and P ratios in soils and intraorgan using R package “pheatmap” version 1.0.12. Multiple factor analysis was employed to investigate different groups (climate, coordinate, and soil) of abiotic environmental factors on plant multielemental stoichiometry using R packages “FactoMineR” version 1.34 and “factoextra” version 1.0.5. One-way ANOVA with Tukey post hoc test was performed to compare element contents among different samples.
Results
In the soils, the mean content was 3.4% for C, 0.19% for N, and 0.056% for P; in the plants, the mean content varied from 45.2 to 46.9% for C, 0.080 to 1.44% for N, and 0.085 to 0.189% for P (Table 1). N contents were significantly (p < 0.05) higher in flower and leaf than in stem and root, while P content in flower was significantly (p < 0.05) higher than the values in other plant organs (Table 1).
TABLE 1.
Contents and molar ratios of C, N, and P in soils and plants.
| n | %C | %N | %P | C:N:P | |
| Soil | 43 | 3.4 ± 2.4b | 0.19 ± 0.13c | 0.056 ± 0.043d | 169:8:1 |
| Root | 45 | 44.4 ± 1.5a | 0.89 ± 0.21b | 0.100 ± 0.047bc | 1,390:23:1 |
| Stem | 45 | 46.2 ± 0.7a | 0.80 ± 0.18b | 0.085 ± 0.046c | 1,746:25:1 |
| Leaf | 45 | 45.2 ± 1.1a | 1.29 ± 0.36a | 0.134 ± 0.076b | 1,157:26:1 |
| Flower | 45 | 46.9 ± 0.9a | 1.44 ± 0.31a | 0.189 ± 0.068a | 728:18:1 |
Lowercase letters in the same columnn indicate significant differences at 0.05 level.
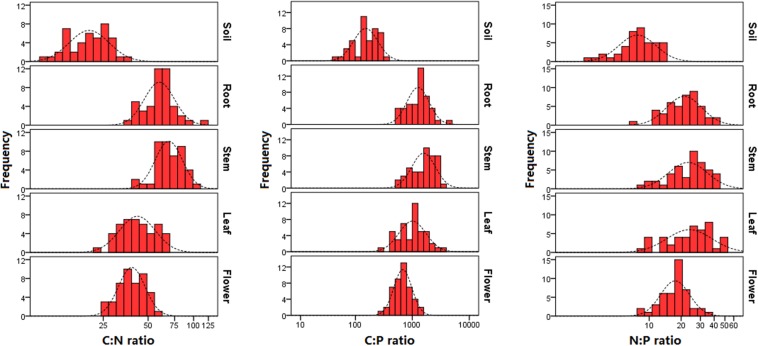
C:N ratio varied from 10 to 35 in soil, 39 to 114 in root, 39 to 100 in stem, 23 to 69 in leaf, and 24 to 56 in flower; C:P ratio varied from 45 to 334 in soil, 513 to 4,067 in root, 506 to 3,185 in stem, 308 to 3,343 in leaf, and 315 to 1,564 in flower; N:P ratio varied from 2 to 15 (with 8 on average) in soil, 6 to 42 (with 23 on average) in root, 9 to 41 (with 25 on average) in stem, 8 to 53 (with 26 on average) in leaf, and 8 to 34 (with 18 on average) in flower (Table 1 and Figure 2).
FIGURE 2.
Distribution of C:N, C:P, and N:P molar ratios in soils and plants. The sample size is 43 for soil and 45 for each plant organ.
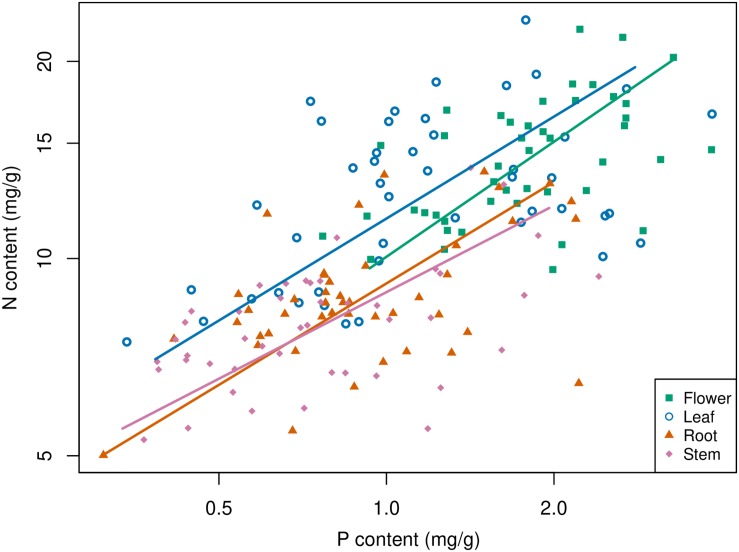
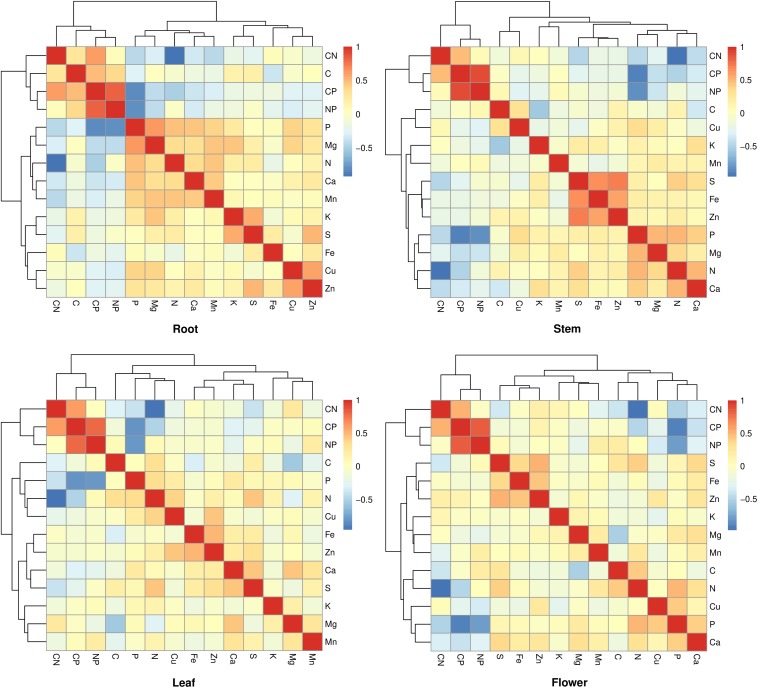
C:P ratios have strong positive relationships with N:P ratios within and between organs (p < 0.01); however, C:N only has strong positive relationship with C:P in root or stem (p < 0.01), respectively (Table 2). The largest Pearson’s correlation coefficient, 0.912, was found between leaf N:P ratio and flower N:P ratio, followed by 0.904, which was found between leaf N:P ratio and stem N:P ratio (Table 2). Stoichiometric relationships for N and P contents have been found among different organs, and these relationships shared a common slope (p = 0.51) (Figure 3 and Table 3). Zn had strong positive correlations with Fe, S, or Cu in each organ (Figure 4).
TABLE 2.
Pearson correlation coefficients of C:N, C:P, and N:P ratios in plants.
| Root | Stem | Leaf | Flower | ||||||||||
| C:N | C:P | N:P | C:N | C:P | N:P | C:N | C:P | N:P | C:N | C:P | N:P | ||
| Root | C:N | 1 | |||||||||||
| C:P | 0.598* | 1 | |||||||||||
| N:P | 0.071 | 0.810* | 1 | ||||||||||
| Stem | C:N | 0.218 | 0.077 | -0.072 | 1 | ||||||||
| C:P | 0.312 | 0.703* | 0.684* | 0.471* | 1 | ||||||||
| N:P | 0.215 | 0.779* | 0.863* | 0.067 | 0.899* | 1 | |||||||
| Leaf | C:N | 0.116 | 0.167 | 0.070 | 0.252 | 0.344 | 0.238 | 1 | |||||
| C:P | 0.311 | 0.746* | 0.723* | 0.132 | 0.776* | 0.821* | 0.590* | 1 | |||||
| N:P | 0.242 | 0.798* | 0.886* | −0.007 | 0.764* | 0.904* | 0.021 | 0.794* | 1 | ||||
| Flower | C:N | −0.058 | 0.002 | −0.048 | 0.180 | 0.190 | 0.103 | 0.768* | 0.359 | −0.102 | 1 | ||
| C:P | 0.216 | 0.662* | 0.674* | 0.066 | 0.683* | 0.753* | 0.562* | 0.898* | 0.709* | 0.520* | 1 | ||
| N:P | 0.221 | 0.763* | 0.859* | −0.045 | 0.694* | 0.846* | 0.135 | 0.795* | 0.912* | −0.010 | 0.835* | 1 | |
* p < 0.01.
FIGURE 3.
Relationships between N and P in different plant organs. A base-10 logarithmic scale is used for the axes. The sample size is 45 for each plant organ.
TABLE 3.
Parameters for the stoichiometric relationships between N and P in plant organs.
| Slope | 95% CI of slope | Intercept | 95% CI of intercept | N | R2 | p | |
| Root | 0.51 | 0.40–0.67 | 0.48 | 0.33–0.62 | 45 | 0.25 | <0.001 |
| Stem | 0.44 | 0.34–0.57 | 0.39 | 0.25–0.52 | 45 | 0.25 | <0.001 |
| Leaf | 0.52 | 0.40–0.67 | 0.58 | 0.44–0.71 | 45 | 0.24 | <0.001 |
| Flower | 0.58 | 0.45–0.76 | 0.59 | 0.47–0.70 | 45 | 0.27 | <0.001 |
FIGURE 4.
Pearson’s correlation coefficients for the element contents and C, N, and P molar ratios in plant organs. The sample size is 45 for each plant organ.
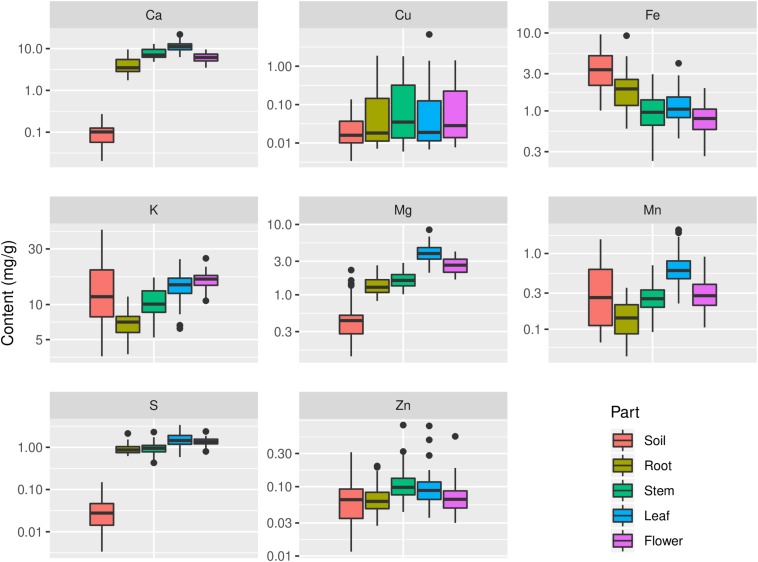
Apparently contents of C, N, P, Ca, Mg, and S in plant organs were significantly higher than their contents in soil (p < 0.05), while Fe content in plant organs was significantly lower than its content in soil (p < 0.05) (Table 1 and Figure 5). Cu content in plant organs varied more than its content in soil; in contrast, K content varied more in soil samples compared with its contents in plant organs (Figure 5). Mn content in leaf was significantly higher than that in soil, but it was significantly lower in root than that in soil (p < 0.05) (Figure 5). Zn content in stem was significantly higher than its content in soil (p < 0.05) (Figure 5).
FIGURE 5.
Distribution of contents of Ca, Cu, Fe, K, Mg, Mn, S, and Zn in soils and plants. The sample size is 43 for soil and 45 for each plant organ.
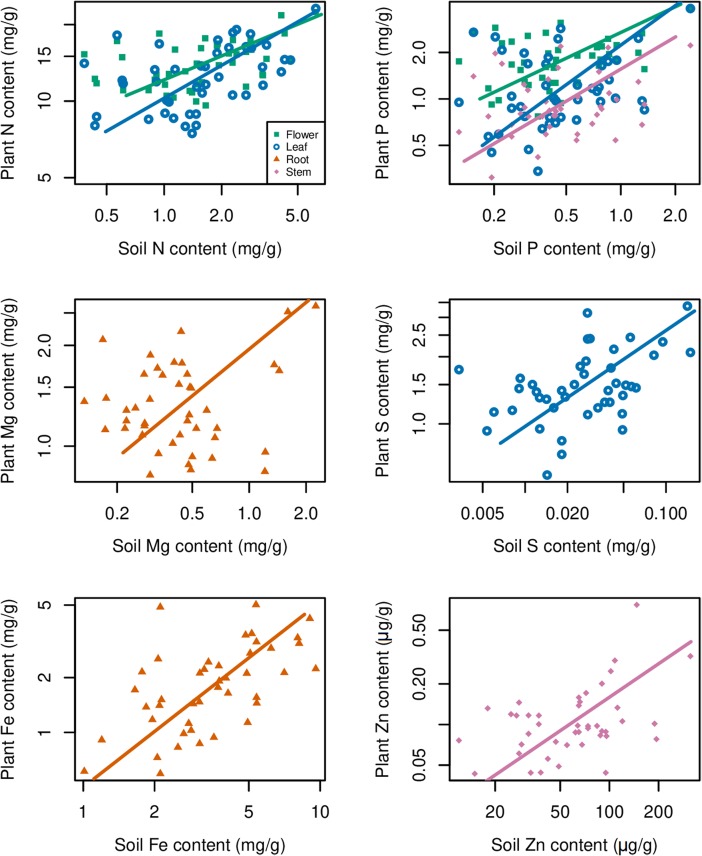
Contents of some elements in certain organs showed significant relationships with their contents in soil (p < 0.01), such as Mg and Fe in root, P and Zn in stem, N, P, and, S in leaf, and N and P in flower (Figure 6). In the above relationships, Fe in root showed the strictest homeostasis (H = 1.93), followed by Mg in root (H = 1.01), whereas S in leaf showed the weakest homeostasis (H = 0.05) (Table 4).
FIGURE 6.
Relationships between soil elements contents and plant elements contents. A base-10 logarithmic scale is used for the axes. The sample size is 43 for both soil and each plant organ, p < 0.01.
TABLE 4.
Parameters of relationships between soil elements contents and plant elements contents.
| Element | Part | H | Slope | 95% CI of slope | Intercept | 95% CI of intercept | n | R2 | p |
| N | Flower | 0.41 | 2.417 | 1.861–3.141 | 9.599 | 8.077–11.120 | 43 | 0.30 | <0.001 |
| Leaf | 0.34 | 2.940 | 2.258–3.827 | 7.295 | 5.428–9.162 | 43 | 0.28 | <0.001 | |
| P | Flower | 0.65 | 1.529 | 1.158–2.018 | 0.988 | 0.667–1.158 | 43 | 0.21 | 0.002 |
| Leaf | 0.56 | 1.793 | 1.349–2.384 | 0.311 | -0.078–1.349 | 43 | 0.16 | 0.007 | |
| Stem | 0.92 | 1.084 | 0.819–1.435 | 0.226 | -0.004–0.457 | 43 | 0.19 | 0.004 | |
| Mg | Root | 1.01 | 0.987 | 0.742–1.312 | 0.846 | 0.633–1.059 | 43 | 0.16 | 0.007 |
| S | Leaf | 0.05 | 18.505 | 14.220–24.083 | 0.898 | 0.647–1.148 | 43 | 0.29 | <0.001 |
| Fe | Root | 1.93 | 0.517 | 0.397–0.675 | -0.020 | -0.659–0.618 | 43 | 0.28 | <0.001 |
| Zn | Stem | 0.47 | 2.106 | 1.591–2.788 | -29.906 | -89.029–29.217 | 43 | 0.19 | 0.004 |
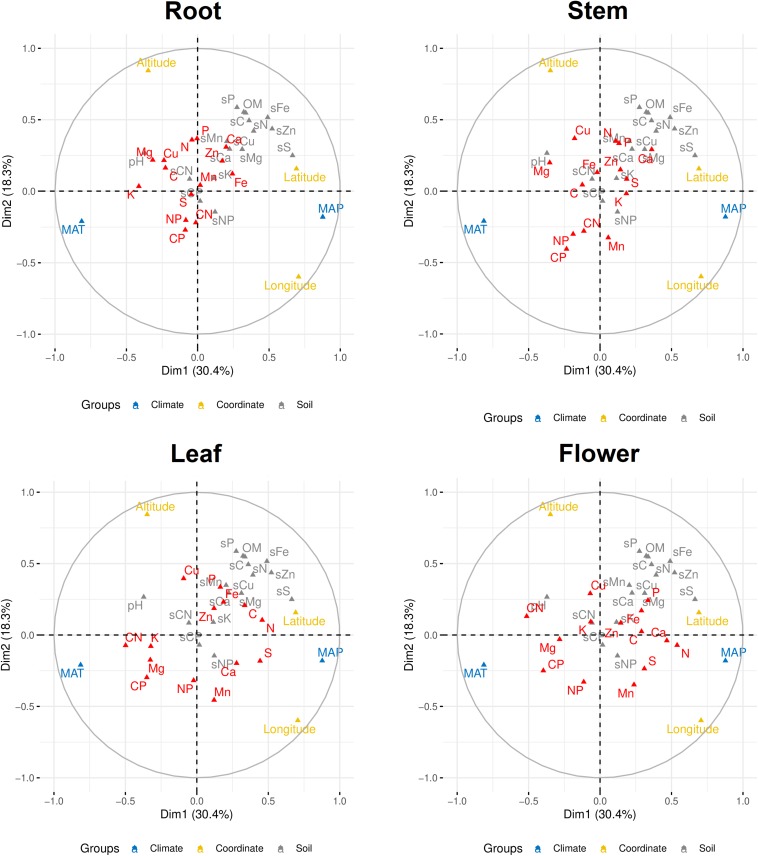
Multiple factor analysis was used to explore the correlations of climate (MAT and MAP), coordinate (latitude, longitude, and altitude), and soil (soil chemical properties) on plant elemental stoichiometry. The first and second dimensions together explained ∼50% of the total variance. The first dimension was mainly contributed by MAP, MAT, latitude, and longitude, while the second dimension was mainly contributed by altitude, longitude, and some soil chemical properties (such as soil P) (Figure 7 and Supplementary Figures S1, S2). Meanwhile, plant stoichiometry responded differently to abiotic environment factors, depending on organ type and element (Figure 7). For example, C:N and C:P ratios were more influenced by MAT in both leaf and flower than those ratios in root, while N content was more influenced by MAP and latitude in both leaf and flower than its content in root. However, N:P ratios in all of the organs seemed not influenced by climate factors associated with geography.
FIGURE 7.
Multiple factor analysis of abiotic environmental factors and multielemental stoichiometry in plant organs. Elements and C:N:P ratios in plants are in red color. MAP, mean annual precipitation; MAT, mean annual temperature; sC, soil carbon; sN, soil nitrogen; sP, soil phosphorus; sK, soil potassium; sCa, soil calcium; sMg, magnesium; sS, soil sulfur; sFe, soil iron; sMn, soil manganese; sCu, soil copper; sZn, soil zinc; sCN, soil C:N ratio; sCP, soil C:P ratio; sNP, soil N:P ratio; OM, soil organic matter, pH, soil pH; CN, plant C:N ratio; CP, plant C:P ratio; NP, plant N:P ratio.
Discussion
Inter- and Intraorgan Multielement Stoichiometry
Our data showed that the means of leaf N and P contents of G. rigescens are 1.29 and 0.134%, respectively, which are lower than those for global herbaceous plants (2.17 and 0.164%, respectively) and for the herbaceous species (2.09 and 0.155%, respectively) in China (Han et al., 2005; Tian et al., 2018). However, the leaf N:P atomic ratio (26:1) of G. rigescens is very similar with 28:1 for N:P ratio in global forests and 30:1 for herb species in China (McGroddy et al., 2004; Han et al., 2005). Garten (1976) found that correlations between contents of elements (such as N and P) across many species were probably because of biochemical similarities of cell metabolism. Moreover, herbaceous plant species tend to maintain their own N and P composition even growing in different sites (Hu et al., 2018). The exponent of leaf N vs. P scaling relationships of global herbaceous plants was 0.659 (Tian et al., 2018). Geng et al. (2014) reported that slopes of N–P scaling did not differ between leaves and fine roots in 139 species collected from Tibetan alpine grassland and Mongolian temperate grassland. In another study, there were no significant differences in the N and P scaling exponents among root, stem, and leaf in 304 species of herbaceous plants (Zhang et al., 2018a). Our data further showed that the slopes of N and P stoichiometric relationships among organs (root, stem, leaf, and flower) of G. rigescens did not differ significantly between environments. In G. rigescens flower, P and N contents were higher than the values in other plant organs, indicating that flower is the most active organ at the organ level.
We also found that Zn had positive correlations with Fe, S, or Cu in each plant organ. Zn homeostasis is maintained by a tightly regulated network, which includes low molecular-weight ligands, membrane transport and Zn-binding proteins, and so on (Sinclair and Krämer, 2012). Interactions between Zn and Fe homeostasis have been observed in different plant species (Xie et al., 2019). Zn homeostasis interacts with Fe homeostasis as a result of the chemical similarity between their divalent cations and the generality of the key root iron uptake transporter (Sinclair and Krämer, 2012). Zn, Fe, and Cu play roles in plant photosynthesis and the mechanisms that their homeostasis within chloroplasts has been concerned (Yruela, 2013). Moreover, the interaction between Zn and S is a critical biological partnership in which sulfur gives mobility to zinc and zinc adjusts the chemical properties of sulfur (Maret, 2004). Further studies are needed on the interactions of multielement homeostasis in plants.
Multielemental Stoichiometry Between Plant and Soil
At the global scale, atomic C:N:P ratios in the soil is 186:13:1 on average (Cleveland and Liptzin, 2007). In this study, the soil C:N:P stoichiometry was 169:8:1. It indicated that soils in our study area are more N and P limited, compared with global data. This is in agreement with the finding that soil P contents across most areas of China were below the global average (Han et al., 2005). Strong positive correlations between soil and plant tissue C:N:P stoichiometry were found in field experiment for herbaceous plants (Bell et al., 2014). In a subtropical mountainous region of southwest China, community leaf P was primarily determined by soil P; leaf P increased as soil P availability increased (Yan et al., 2015). In the P-rich soil in a forest in Yunnan, soil P content is a major driver triggering the variation in multielemental stoichiometry in plants (Li et al., 2019). Our study showed that, in the P-limited soil, soil P content also plays an important role in multielemental stoichiometry in plant.
Multielemental stoichiometry in plants can be affected by soil nutrient availability and plant functions that resist to nutrient stress (Tian et al., 2019). Our analyses indicate that the contents of macroelements, such as C, N, P, Ca, Mg, and S, were higher in plant organs than those in soil and exhibited a relatively narrow range in plant organs, which is in agreement with the studies of Han et al. (2011) and Zhao et al. (2016). Both N and P contents in leaf and flower of G. rigescens showed stoichiometric relationships with their contents in soil. However, flower and leaf N and P contents of common reed (Phragmites australis) did not change significantly with N and P availability in northern China (Li et al., 2014). Further work is needed on the stoichiometry of reproductive tissue in different plant species. In this study, higher Mn content was found in leaf, compared with other organs and soil. The reason for this could be that plants that can release carboxylates to mobilize soil P as a phosphorus-acquisition strategy can also mobilize soil Mn, leading to high leaf Mn content (Lambers et al., 2015). Fe is essential for plants, but excess Fe is toxic to plant because of the formation of damaging reactive oxygen species duo to free intracellular Fe. Therefore, maintaining proper Fe homeostasis is crucial for plants (Jeong and Guerinot, 2009). Plant can reduce Fe uptake when Fe is at high levels (Kroh and Pilon, 2019). Intriguingly, we found that, compared with other studied elements, G. rigescens reduced Fe uptake from soil and showed the strictest homeostasis. Furthermore, our average leaf Fe content was nearly 1.3 mg/g (Figure 5), which was more than two times higher than the critical leaf content (>0.5 mg/g, dry weight) for Fe toxicity in non-tolerant crop plants (White and Brown, 2010). The results imply that the soils contain relatively high levels of Fe, but G. rigescens can resist to excess Fe.
Variation of Multielemental Stoichiometry With Climatic Conditions
In this study, MAP and MAT associated with geography were the main drivers for plant stoichiometry. Similar result was found in an investigation on the variation of multielemental stoichiometry in Quercus variabilis leaves across China (Sun et al., 2015). Our data showed that plant stoichiometry responded differently to abiotic environmental factors, depending on organ type and element. Contents of leaf N and S were closely correlated with MAP. The same pattern had been found in a study investigating more than 700 wild plant species across China (Zhang et al., 2012). A meta-analysis on multielemental stoichiometry including 1,900 plant species across China showed that global warming might have no effect on leaf Ca and Mg but could decrease leaf K, Fe, Mn, and Zn (Tan et al., 2019). We found that leaf K and Mg had a relatively close relationship with MAT. For N:P ratio, a trend of increasing leaf N:P ratio with decreasing latitude for 753 terrestrial plant species was discovered across China (Han et al., 2005). In another study, leaf N:P ratio increased with increasing MAT along the 400 mm isohyet in north China (Tan et al., 2018). In this study, N:P ratio, no matter in which organ, showed little flexibility to climate factors, which may be because factors intrinsic to each plant species play a more important role in controlling N:P ratios than extrinsic factors at a local scale (Luo et al., 2015). However, at global scale, terrestrial plant N:P ratio decreases with increasing precipitation but increases with warming (Yuan and Chen, 2015).
Conclusion
In conclusion, our analyses indicate that the slopes of N–P scaling among organs did not differ significantly between environments even in flower, the most active organ with highest N and P level. Zn had strong positive correlations with Fe, S, or Cu in each organ. Fe showed the strictest homeostasis in its root when excessive Fe in soil. In this study, MAP and MAT associated with geography, followed by soil P, were the main divers for plant multielemental stoichiometry, while N:P ratio, no matter in which organ, showed little flexibility to climate factors. The results have implications for understanding the roles that multielemental stoichiometry play for plant individuals to nutrient stress and climate change.
Data Availability Statement
All datasets generated for this study are included in the article/Supplementary Material.
Author Contributions
JZ, YW, and CC conceived and designed the study. JZ and YW collected the samples. JZ analyzed the samples and analyzed the data. JZ and CC wrote the manuscript.
Conflict of Interest
The authors declare that the research was conducted in the absence of any commercial or financial relationships that could be construed as a potential conflict of interest.
Acknowledgments
We thank the Public Technology Service Center of Xishuangbanna Tropical Botanical Garden for the help in sample analyses.
Footnotes
Funding. This work was sponsored by the National Natural Science Foundation of China (81760684), the CAS 135 Program of China (No. 2017XTBG-F05), and the Key Project of Yunnan Provincial Natural Science Foundation (2017FA049).
Supplementary Material
The Supplementary Material for this article can be found online at: https://www.frontiersin.org/articles/10.3389/fpls.2020.00441/full#supplementary-material
Information of the sampling sites.
The contribution of quantitative variables (in%) to the first dimension of the multiple factor analysis.
The contribution of quantitative variables (in%) to the second dimension of the multiple factor analysis.
The dataset for this study.
References
- Ågren G. I., Weih M. (2012). Plant stoichiometry at different scales: element concentration patterns reflect environment more than genotype. New Phytol. 194 944–952. 10.1111/j.1469-8137.2012.04114.x [DOI] [PubMed] [Google Scholar]
- Ågren G. I., Weih M. (2020). Multi-dimensional plant element stoichiometry—looking beyond carbon, nitrogen, and phosphorus. Front. Plant Sci. 11:23. 10.3389/fpls.2020.00023 [DOI] [PMC free article] [PubMed] [Google Scholar]
- Allen A. P., Gillooly J. F. (2009). Towards an integration of ecological stoichiometry and the metabolic theory of ecology to better understand nutrient cycling. Ecol. Lett. 12 369–384. 10.1111/j.1461-0248.2009.01302.x [DOI] [PubMed] [Google Scholar]
- Bell C., Carrillo Y., Boot C. M., Rocca J. D., Pendall E., Wallenstein M. D. (2014). Rhizosphere stoichiometry: are C: N: P ratios of plants, soils, and enzymes conserved at the plant species-level? New Phytol. 201 505–517. 10.1111/nph.12531 [DOI] [PubMed] [Google Scholar]
- Britto D. T., Kronzucker H. J. (2008). Cellular mechanisms of potassium transport in plants. Physiol. Plantarum 133 637–650. 10.1111/j.1399-3054.2008.01067.x [DOI] [PubMed] [Google Scholar]
- Burkhead J. L., Gogolin Reynolds K. A., Abdel-Ghany S. E., Cohu C. M., Pilon M. (2009). Copper homeostasis. New Phytol. 182 799–816. 10.1111/j.1469-8137.2009.02846.x [DOI] [PubMed] [Google Scholar]
- Cabot C., Martos S., Llugany M., Gallego B., Tolrà R., Poschenrieder C. (2019). A role for zinc in plant defense against pathogens and herbivores. Front. Plant Sci. 10:1171. 10.3389/fpls.2019.01171 [DOI] [PMC free article] [PubMed] [Google Scholar]
- Cleveland C. C., Liptzin D. (2007). C: N: P stoichiometry in soil: is there a “Redfield ratio” for the microbial biomass? Biogeochemistry 85 235–252. 10.1007/s10533-007-9132-0 [DOI] [Google Scholar]
- Elser J. J., Fagan W. F., Kerkhoff A. J., Swenson N. G., Enquist B. J. (2010). Biological stoichiometry of plant production: metabolism, scaling and ecological response to global change. New Phytol. 186 593–608. 10.1111/j.1469-8137.2010.03214.x [DOI] [PubMed] [Google Scholar]
- Favre A., Michalak I., Chen C. H., Wang J. C., Pringle J. S., Matuszak S., et al. (2016). Out-of-Tibet: the spatio-temporal evolution of Gentiana (Gentianaceae). J. Biogeogr. 43 1967–1978. 10.1111/jbi.12840 [DOI] [Google Scholar]
- Flora of China Editorial Committee (1988). Flora of China, Vol. 62 Beijing: Science Press. [Google Scholar]
- Garten C. T., Jr. (1976). Correlations between concentrations of elements in plants. Nature 261 686–688. 10.1038/261686a0 [DOI] [Google Scholar]
- Geng Y., Wang L., Jin D., Liu H., He J. S. (2014). Alpine climate alters the relationships between leaf and root morphological traits but not chemical traits. Oecologia 175 445–455. 10.1007/s00442-014-2919-5 [DOI] [PubMed] [Google Scholar]
- Han W., Fang J., Guo D., Zhang Y. (2005). Leaf nitrogen and phosphorus stoichiometry across 753 terrestrial plant species in China. New Phytol. 168 377–385. 10.1111/j.1469-8137.2005.01530.x [DOI] [PubMed] [Google Scholar]
- Han W. X., Fang J. Y., Reich P. B., Ian Woodward F., Wang Z. H. (2011). Biogeography and variability of eleven mineral elements in plant leaves across gradients of climate, soil and plant functional type in China. Ecol. Lett. 14 788–796. 10.1111/j.1461-0248.2011.01641.x [DOI] [PubMed] [Google Scholar]
- Helsen K., Acharya K. P., Brunet J., Cousins S. A., Decocq G., Hermy M., et al. (2017). Biotic and abiotic drivers of intraspecific trait variation within plant populations of three herbaceous plant species along a latitudinal gradient. BMC Ecol. 17:38. 10.1186/s12898-017-0151-y [DOI] [PMC free article] [PubMed] [Google Scholar]
- Hu M., Peñuelas J., Sardans J., Sun Z., Wilson B. J., Huang J., et al. (2018). Stoichiometry patterns of plant organ N and P in coastal herbaceous wetlands along the East China Sea: implications for biogeochemical niche. Plant Soil 431 273–288. 10.1007/s11104-018-3759-6 [DOI] [Google Scholar]
- Jeong J., Guerinot M. L. (2009). Homing in on iron homeostasis in plants. Trends Plant Sci. 14 280–285. 10.1016/j.tplants.2009.02.006 [DOI] [PubMed] [Google Scholar]
- Jeyasingh P. D., Goos J. M., Thompson S. K., Godwin C. M., Cotner J. B. (2017). Ecological stoichiometry beyond Redfield: an ionomic perspective on elemental homeostasis. Front. Microbiol. 8:722. 10.3389/fmicb.2017.00722 [DOI] [PMC free article] [PubMed] [Google Scholar]
- Kleyer M., Minden V. (2015). Why functional ecology should consider all plant organs: an allocation-based perspective. Basic Appl. Ecol. 16 1–9. 10.1016/j.baae.2014.11.002 [DOI] [Google Scholar]
- Kroh G. E., Pilon M. (2019). Connecting the negatives and positives of plant iron homeostasis. New Phytol. 223 1052–1055. 10.1111/nph.15933 [DOI] [PubMed] [Google Scholar]
- Lambers H., Hayes P. E., Laliberte E., Oliveira R. S., Turner B. L. (2015). Leaf manganese accumulation and phosphorus-acquisition efficiency. Trends Plant Sci. 20 83–90. 10.1016/j.tplants.2014.10.007 [DOI] [PubMed] [Google Scholar]
- Li L., Zerbe S., Han W., Thevs N., Li W., He P., et al. (2014). Nitrogen and phosphorus stoichiometry of common reed (Phragmites australis) and its relationship to nutrient availability in northern China. Aquat. Bot. 112 84–90. 10.1016/j.aquabot.2013.08.002 [DOI] [Google Scholar]
- Li M., Huang C., Yang T., Drosos M., Wang J., Kang X., et al. (2019). Role of plant species and soil phosphorus concentrations in determining phosphorus: nutrient stoichiometry in leaves and fine roots. Plant Soil 445 231–242. 10.1007/s11104-019-04288-4283 [DOI] [Google Scholar]
- Li X., Walker D. (1986). The plant geography of Yunnan Province, southwest China. J. Biogeogr. 13 367–397. [Google Scholar]
- Luo W., Elser J. J., Lü X. T., Wang Z., Bai E., Yan C., et al. (2015). Plant nutrients do not covary with soil nutrients under changing climatic conditions. Glob. Biogeochem. Cycles 29 1298–1308. 10.1002/2015gb005089 [DOI] [Google Scholar]
- Maret W. (2004). Zinc and sulfur: a critical biological partnership. Biochemistry 43 3301–3309. 10.1021/bi036340p [DOI] [PubMed] [Google Scholar]
- McGroddy M. E., Daufresne T., Hedin L. O. (2004). Scaling of C: N: P stoichiometry in forests worldwide: implications of terrestrial redfield-type ratios. Ecology 85 2390–2401. 10.1890/03-0351 [DOI] [Google Scholar]
- Minden V., Kleyer M. (2014). Internal and external regulation of plant organ stoichiometry. Plant Biol. 16 897–907. 10.1111/plb.12155 [DOI] [PubMed] [Google Scholar]
- Na G., Salt D. E. (2011). The role of sulfur assimilation and sulfur-containing compounds in trace element homeostasis in plants. Environ. Exp. Bot. 72 18–25. 10.1016/j.envexpbot.2010.04.004 [DOI] [Google Scholar]
- R Core Team (2019). R: A Language and Environment for Statistical Computing. Vienna: R Foundation for Statistical Computing. [Google Scholar]
- Reich P. B., Oleksyn J. (2004). Global patterns of plant leaf N and P in relation to temperature and latitude. Proc. Nat. Acad. Sci. U.S.A. 101 11001–11006. 10.1073/pnas.0403588101 [DOI] [PMC free article] [PubMed] [Google Scholar]
- Sardans J., Grau O., Chen H. Y., Janssens I. A., Ciais P., Piao S., et al. (2017). Changes in nutrient concentrations of leaves and roots in response to global change factors. Glob. Change Biol. 23 3849–3856. 10.1111/gcb.13721 [DOI] [PubMed] [Google Scholar]
- Sardans J., Peñuelas J. (2015). Potassium: a neglected nutrient in global change. Glob. Ecol. Biogeogr. 24 261–275. 10.1111/geb.12259 [DOI] [PMC free article] [PubMed] [Google Scholar]
- Sardans J., Rivas-Ubach A., Penuelas J. (2012). The elemental stoichiometry of aquatic and terrestrial ecosystems and its relationships with organismic lifestyle and ecosystem structure and function: a review and perspectives. Biogeochemistry 111 1–39. 10.1007/s10533-011-9640-9 [DOI] [Google Scholar]
- Shao J. F., Yamaji N., Shen R. F., Ma J. F. (2017). The key to Mn homeostasis in plants: regulation of Mn transporters. Trends Plant Sci. 22 215–224. 10.1016/j.tplants.2016.12.005 [DOI] [PubMed] [Google Scholar]
- Shaul O. (2002). Magnesium transport and function in plants: the tip of the iceberg. Biometals 15 307–321. [DOI] [PubMed] [Google Scholar]
- Sinclair S. A., Krämer U. (2012). The zinc homeostasis network of land plants. Biochim. Biophys. Acta 1823 1553–1567. 10.1016/j.bbamcr.2012.05.016 [DOI] [PubMed] [Google Scholar]
- Sistla S. A., Schimel J. P. (2012). Stoichiometric flexibility as a regulator of carbon and nutrient cycling in terrestrial ecosystems under change. New Phytol. 196 68–78. 10.1111/j.1469-8137.2012.04234.x [DOI] [PubMed] [Google Scholar]
- Sperfeld E., Wagner N. D., Halvorson H. M., Malishev M., Raubenheimer D. (2017). Bridging ecological stoichiometry and nutritional geometry with homeostasis concepts and integrative models of organism nutrition. Funct. Ecol. 31 286–296. 10.1111/1365-2435.12707 [DOI] [Google Scholar]
- Sterner R. W., Elser J. J. (2002). Ecological Stoichiometry: The Biology of Elements From Molecules to the Biosphere. Princeton, NJ: Princeton University Press. [Google Scholar]
- Sun X., Kang H., Kattge J., Gao Y., Liu C. (2015). Biogeographic patterns of multi-element stoichiometry of Quercus variabilis leaves across China. Can. J. Forest Res. 45 1827–1834. 10.1139/cjfr-2015-0110 [DOI] [Google Scholar]
- Tan Q., Li J., Chen Z., Ma Y., Wang G., Jia Y., et al. (2019). Clarifying the influence of temperature on variances in plant metallic nutrients through minimizing the effect of precipitation. Sci. Total Environ. 646 347–356. 10.1016/j.scitotenv.2018.07.312 [DOI] [PubMed] [Google Scholar]
- Tan Q., Li J., Chen Z., Wang G., Jia Y., Yao H., et al. (2018). Minimizing the effect of precipitation in clarifying the responses of leaf N and P stoichiometry to temperature. Environ. Pollut. 243 404–409. 10.1016/j.envpol.2018.09.010 [DOI] [PubMed] [Google Scholar]
- Tian D., Reich P. B., Chen H. Y., Xiang Y., Luo Y., Shen Y., et al. (2019). Global changes alter plant multi-element stoichiometric coupling. New Phytol. 221 807–817. 10.1111/nph.15428 [DOI] [PubMed] [Google Scholar]
- Tian D., Yan Z., Niklas K. J., Han W., Kattge J., Reich P. B., et al. (2018). Global leaf nitrogen and phosphorus stoichiometry and their scaling exponent. Nat. Sci. Rev. 5 728–739. 10.1002/ecy.2812 [DOI] [PubMed] [Google Scholar]
- Vigani G., Zocchi G., Bashir K., Philippar K., Briat J. F. (2013). Cellular iron homeostasis and metabolism in plant. Front. Plant Sci. 4:490. 10.3389/fpls.2013.00490 [DOI] [PMC free article] [PubMed] [Google Scholar]
- Wang H., Sterner R. W., Elser J. J. (2012). On the “strict homeostasis” assumption in ecological stoichiometry. Ecol. Model. 243 81–88. 10.1016/j.ecolmodel.2012.06.003 [DOI] [Google Scholar]
- Wang J., Wang J., Ye H., Liu Y., He H. (2017). An interpolated temperature and precipitation dataset at 1-km grid resolution in China (2000 – 2012). China Sci. Data 2 73–80. [Google Scholar]
- Warton D. I., Duursma R. A., Falster D. S., Taskinen S. (2012). smatr 3- an R package for estimation and inference about allometric lines. Methods Ecol. Evol. 3 257–259. 10.1111/j.2041-210x.2011.00153.x [DOI] [Google Scholar]
- White P. J., Broadley M. R. (2003). Calcium in plants. Ann. Bot. 92 487–511. [DOI] [PMC free article] [PubMed] [Google Scholar]
- White P. J., Brown P. H. (2010). Plant nutrition for sustainable development and global health. Ann. Bot. 105 1073–1080. 10.1093/aob/mcq085 [DOI] [PMC free article] [PubMed] [Google Scholar]
- Xie X., Hu W., Fan X., Chen H., Tang M. (2019). Interactions between phosphorus, zinc, and iron homeostasis in nonmycorrhizal and mycorrhizal plants. Front. Plant Sci. 10:1172. 10.3389/fpls.2019.01172 [DOI] [PMC free article] [PubMed] [Google Scholar]
- Yan K., Duan C., Fu D., Li J., Wong M. H., Qian L., et al. (2015). Leaf nitrogen and phosphorus stoichiometry of plant communities in geochemically phosphorus-enriched soils in a subtropical mountainous region, SW China. Environ. Earth Sci. 74 3867–3876. 10.1007/s12665-015-4519-z [DOI] [Google Scholar]
- Yang X., Huang Z., Zhang K., Cornelissen J. H. (2015). C: N: P stoichiometry of Artemisia species and close relatives across northern China: unravelling effects of climate, soil and taxonomy. J. Ecol. 103 1020–1031. 10.1111/1365-2745.12409 [DOI] [Google Scholar]
- Yruela I. (2013). Transition metals in plant photosynthesis. Metallomics 5 1090–1109. 10.1039/c3mt00086a [DOI] [PubMed] [Google Scholar]
- Yuan Z. Y., Chen H. Y. (2015). Decoupling of nitrogen and phosphorus in terrestrial plants associated with global changes. Nat. Clim. Change 5 465–469. 10.1038/nclimate2549 [DOI] [Google Scholar]
- Zhang J., Elser J. J. (2017). Carbon: nitrogen: phosphorus stoichiometry in fungi: a meta-analysis. Front. Microbiol. 8:1281. 10.3389/fmicb.2017.01281 [DOI] [PMC free article] [PubMed] [Google Scholar]
- Zhang J., He N., Liu C., Xu L., Yu Q., Yu G. (2018a). Allocation strategies for nitrogen and phosphorus in forest plants. Oikos 127 1506–1514. 10.1111/oik.05517 [DOI] [Google Scholar]
- Zhang J., Zhao N., Liu C., Yang H., Li M., Yu G., et al. (2018b). C: N: P stoichiometry in China’s forests: from organs to ecosystems. Funct. Ecol. 32 50–60. 10.1371/journal.pone.0116391 [DOI] [PMC free article] [PubMed] [Google Scholar]
- Zhang S. B., Zhang J. L., Slik J. F., Cao K. F. (2012). Leaf element concentrations of terrestrial plants across China are influenced by taxonomy and the environment. Glob. Ecol. Biogeogr. 21 809–818. 10.1111/j.1466-8238.2011.00729.x [DOI] [Google Scholar]
- Zhao N., He N., Wang Q., Zhang X., Wang R., Xu Z., et al. (2014). The altitudinal patterns of leaf C: N: P stoichiometry are regulated by plant growth form, climate and soil on Changbai Mountain, China. PLoS One 9:e95196. 10.1371/journal.pone.0095196 [DOI] [PMC free article] [PubMed] [Google Scholar]
- Zhao N., Yu G., He N., Wang Q., Guo D., Zhang X., et al. (2016). Coordinated pattern of multi-element variability in leaves and roots across Chinese forest biomes. Glob. Ecol. Biogeogr. 25 359–367. 10.1111/geb.12427 [DOI] [Google Scholar]
Associated Data
This section collects any data citations, data availability statements, or supplementary materials included in this article.
Supplementary Materials
Information of the sampling sites.
The contribution of quantitative variables (in%) to the first dimension of the multiple factor analysis.
The contribution of quantitative variables (in%) to the second dimension of the multiple factor analysis.
The dataset for this study.
Data Availability Statement
All datasets generated for this study are included in the article/Supplementary Material.


