

Abstract
Fortification of two staple foods, maize meal and wheat flour (bread), is mandatory, and commercial infant products are widely available in South Africa. Using a 24‐hr recall, we determined the contribution of these foods towards nutrient intakes at ages 6 (n = 715), 12 (n = 446), and 18 (n = 213) months in a cohort of children in a peri‐urban community, North West province. On the day of recall, commercial infant products were consumed by 83% of children at 6 months, 46% at 12 months, and 15% at 18 months; fortified staples were consumed by 23%, 81%, and 96%, respectively. For consumers thereof, commercial infant products contributed 33% energy and 94% iron intakes at 6 months and 27% energy and 56% iron intakes at 12 months; nutrient densities of the complementary diet was higher than for nonconsumers for most micronutrients. For consumers of fortified staples, energy contribution thereof was 11% at 6 months versus 29% at 18 months; at 18 months, fortified staples contributed >30% of iron, zinc, vitamin A, thiamine, niacin, vitamin B6, and folate; at 12 months, nutrient densities of the complementary diet were higher for zinc, folate, and vitamin B6 but lower for calcium, iron, vitamin A, niacin, and vitamin C than nonconsumers. At ages 12 and 18 months, ~75% of children had low calcium intakes. At 12 months, 51.4% of consumers versus 25.0% (P = 0.005) of nonconsumers of fortified staples had adequate intakes (>EAR) for all eight fortificant nutrients. However, despite fortification, nutrient gaps remain.
Keywords: commercial infant products, complementary foods, dietary intake assessment, fortified staples, infants and child nutrition, South Africa
Key messages.
Consumers of commercial infant products had significantly higher intakes and nutrient density of most micronutrients (including calcium, iron, and zinc) compared with nonconsumers at ages 6 and 12 months.
Fortified staples were widely consumed from 12 months onwards, and consumers had higher intakes of zinc, vitamin B6, and folate, but nutrient density of the complementary diet was lower for several important nutrients, including calcium, iron, vitamin A, and vitamin C.
Calcium intake was low for 75% of children at 12 and 18 months.
Even with fortification, nutrient gaps remained.
Strategies to improve nutrient content of the complementary diet should include targeted fortification of staple foods for infants and young children in combination with dietary diversification and use of fortified complementary foods.
1. INTRODUCTION
Optimal nutrition during infancy and early childhood is critical for child growth and development. Complementary foods should be of high nutrient density as children under the age of 2 years have high nutrient requirements because of rapid growth and development but consume relatively small amounts of food (Dewey, 2013). The complementary diet of children in low‐ and middle‐income countries generally lack multiple micronutrients, with iron, zinc, and calcium being the major “problem nutrients” (Campos, Hernandez, Soto‐Mendez, Vossenaar, & Solomons, 2010; Dewey & Brown, 2003; Dewey & Vitta, 2013; Kimmons et al., 2005; Osendarp et al., 2016; Vossenaar, Hernández, Campos, & Solomons, 2013). Several studies demonstrated that it may be challenging to meet infants' nutritional needs, particularly for these “problem nutrients,” without including fortified foods in the complementary diet mainly derived from family foods typically consumed in low‐income settings (Fahmida & Santika, 2016; Hlaing et al., 2016; Vossenaar & Solomons, 2012). Enhanced and optimized consumption and accessibility of targeted fortified infant foods are among proposed strategies to improve dietary intake of infants and young children in poor communities (Bhutta et al., 2013; Dewey & Adu‐Afarwuah, 2008; Dewey & Vitta, 2013). However, the potential benefit for 6‐ to 24‐month‐old children from large‐scale untargeted food fortification is considered low because the amount of fortified food that is typically consumed at this age is very low (Hoogendoorn, Luthringer, Parvanta, & Garret, 2016), and the amounts of the fortificants are generally too low to meet the micronutrient requirements of 6‐ to 24‐month‐old children (Darnton‐Hill, Neufeld, Vossenaar, Osendarp, & Martinez, 2017).
Commercial infant products are widely used in both developed (Fotorek, Hibig, & Alexy, 2014; Hauta‐alus et al., 2017; Maslin & Venter, 2017) and, to a lesser extent, developing countries (Abizari, Ali, Essah, Agyeiwaa, & Amaniampong, 2017; Feeley et al., 2016; Pries, Huffman, Adhikary, et al., 2016; Pries, Huffman, Mengkheang, et al., 2016). With urbanisation, households have increased access to commercially processed foods (Global Panel on Agriculture and Food Systems for Nutrition, 2017). The cost of commercial infant products may prohibit its use by poor communities (Shisana et al., 2013), and the consumption thereof often depends on affordability (Katepa‐Bwalya et al., 2015). In South Africa, commercial infant cereal is the most common complementary first food to be introduced, but it has been proposed that home‐made porridge would be a more affordable option as it is a staple food for most families (Shisana et al., 2013).
Porridge made with maize meal and, to a lesser extent, bread are frequently consumed by infants and young children in South Africa (Faber, Laubscher, & Berti, 2016; Ntila, Siwela, Kolanisi, Abdelgadir, & Ndhlala, 2017), although it may differ across study populations (Faber et al., 2015). Mandatory fortification of both maize meal and wheat flour (used to make bread) was implemented in 2003 as part of the National Food Fortification Programme, with the aim to improve micronutrient intake of the South African population (Department of Health, South Africa, 2003). Secondary data analyses of available food intake data showed that substituting unfortified maize meal and bread in the diet with the fortified equivalents improved micronutrient adequacy of the diets of 1‐ to 9‐year‐old children (Steyn, Nel, & Labadarios, 2008). It has been suggested however that fortification of maize meal and wheat flour may have little influence on infant nutrition as they consume relatively small amounts of these staple foods (Faber, 2005). No data are however available on the contribution of the South African National Food Fortification Programme to nutrient intake during the first 2 years of life.
From age 6 to 24 months, the complementary diet transitions progressively from semi‐solid early infant foods to a variety of family foods. During the complementary feeding period, the contribution from commercial infant foods and fortified staple foods to dietary intake will therefore depend on the age of the child. In this study, we determined energy and nutrient contribution of commercial infant products and fortified staple foods to total intake and nutrient density of the complementary diet at ages 6, 12, and 18 months in a cohort of children in a peri‐urban community in the North West province, South Africa.
2. METHODS
2.1. Study design
Dietary data were collected as part of a randomised controlled trial (Tswaka study), which assessed the effect of small‐quantity lipid‐based nutrient supplements (SQ‐LNS) on child growth. Infants were enrolled at age 6 months and were randomly allocated to one of the three intervention groups, of which two of the groups received SQ‐LNS and the third group being a no‐supplement control group. The duration of the intervention was 6 months, which was followed by a 6‐month postintervention follow‐up study during which the no‐supplement control group became the delayed intervention group and received SQ‐LNS from age 12 to 18 months. The two SQ‐LNS products provided 100 kcal and 50% RNI for most nutrients, if taken as intended.
Data were continuously collected from September 2013 to December 2015. Dietary data were collected at ages 6 months (from September 2013 to January 2015), 12 months (from April 2014 to July 2015), and 18 months (from October 2014 to December 2015) using a single 24‐hr recall.
2.2. Study population and study participants
Recruitment of eligible study participants for the aforementioned randomised controlled trial (Tswaka study) was done at five health care centres and through door‐to‐door home visits in the peri‐urban Jouberton area in the greater Matlosana Municipality in Klerksdorp in the North West province of South Africa. Infants were excluded if they had never been breastfed, had severe congenital abnormalities, were severely anaemic (haemoglobin < 70 g L−1) or malnourished (weight‐for‐length z‐score < −3 SD), had a chronic disease, known food allergies, or intolerances (i.e., to peanuts, soy, milk, or lactose), received special nutritional supplements, and had not been born as a singleton or if the caregiver planned to relocate out of the study area within 7 months following the baseline of the study. Eligible study participants (n = 750) were enrolled in the study at the age of 6 months.
Dietary data were collected by a single 24‐hr recall at age 6 months (n = 715), age 12 months (n = 446), and age 18 months (n = 213). The decrease in number of participants with increasing age is due to a 31.5% dropout rate in the randomised controlled trial as well as a lower number of participants enrolled in the postintervention follow‐up survey. In some instances, the 24‐hr dietary recall was not done, as the respondent was not the full‐time caregiver on the day of recall.
2.3. Data collection
Trained fieldworkers interviewed the mother or caregiver (collectively referred to from here on forward as caregivers) in either English or the native language (Setswana) of the area. Sociodemographic information was collected using a questionnaire.
The fieldworkers were trained and provided with a manual outlining the procedures for administering a 24‐hr recall. A standardised dietary kit containing examples of food, food containers, household utensils, and photographs was used to estimate and record the reported amount of food eaten. In addition, dish‐up and measure, using dry oats, was used to estimate and record the amount eaten, particularly for cooked food. The amount for leftovers was recorded and was factored in the calculation of the estimated actual consumption. Infant cereal and formula milk were recorded per dry amount and liquid. Porridge made with maize meal was recorded as soft, crumbly or stiff. SQ‐LNS were considered supplements and were not included; results therefore reflect the background diet.
2.4. Processing and statistical analysis of data
For the 24‐hr recall data, food intake reported in household measures was converted into weight using the South African Medical Research Council Food Quantities Manual (Langenhoven, Conradie, Wolmarans, & Faber, 1991). The amount of breast milk intake was assumed according to age: 775 ml for exclusively breastfed infants and 675 ml for partially breastfed infants at age 6 months, 615 ml at age 12 months, and 550 ml at age 18 months (World Health Organization, 1998). In the instance where other milk feeds (formula milk feeds) were consumed together with breast milk, the volume of the other milk feed was subtracted from these amounts for the different age groups to obtain an estimated amount of breast milk consumed.
The food intake was converted to energy, macronutrients, and micronutrients using the STATA version 15 in conjunction with the South African Food Composition Database (SAFCD; Wolmarans, Danster, Dalton, Rossouw, & Schönfeldt, 2010). The section on baby foods in the SAFCD has been updated (Chetty, van Graan, & Links, 2016; Van Graan, Chetty, & Links, 2016) prior to data analysis. The SAFCD vitamin A values are reported as retinol equivalents (μg RE; Wolmarans et al., 2010), whereas the Dietary Reference Intakes give vitamin A as retinol activity equivalent (μg RAE; Institute of Medicine, 2001). We calculated the vitamin A μg RAE, where 1 μg RAE = 1 μg RE of retinol when vitamin A was from animal and fortified foods and 1 μg RAE = 2 μg RE of retinol if vitamin A was from plant foods. Age‐appropriate estimated average requirements (EARs) or, in the absence of an EAR, the adequate intake (AI) of the Dietary Reference Intakes was used as the reference for nutrient intake (Institute of Medicine, 1998, 2000, 2001, 2005, 2011).
Total dietary intake includes breast milk, formula milk, and all foods and beverages consumed, and excludes the SQ‐LNS of the randomised control trial. The complementary diet was defined as all foods and beverages consumed, excluding breast milk, formula milk feeds and SQ‐LNS. The complementary feeding period is a period of change from a breast milk‐ and/or formula milk‐based diet to a diet including solid foods and other beverages (Fein, Labiner‐Wolfe, Scanlon, & Grummer‐Strawn, 2008). Nutrient (macronutrient and micronutrient) densities (amount of nutrient per 100 kcal) of the complementary diet (excluding breast milk, formula milk feeds and SQ‐LNS, but including formula mixed in with porridge) were calculated.
The reported energy and nutrient intakes exclude SQ‐LNS provided to the active arms during the trial. The Kruskal–Wallis test showed that there were no statistically significant differences between the three study groups within an age group for energy, either for total intake (age 6 months, P = 0.507; age 12 months, P = 0.853; and age 18 months, P = 0.788) or for the complementary diet (age 6 months, P = 0.333; age 12 months, P = 0.915; and age 18 months, P = 0.264).
To determine the energy and nutrient contribution of commercial infant products (infant cereals, jarred products, baby juice, and formula milk) and fortified maize meal and bread to total intake, the food intake data were categorised into six food groups. These were (a) infant cereals, (b) jarred baby foods, (c) formula milk, (d) baby juice, (e) fortified maize meal, and (f) bread made with fortified wheat flour. Energy and nutrient contribution of each of these six food groups were calculated and expressed as a percentage of total intakes for the consumers thereof, where consumers are defined as those children who consumed the specific food group on the day of recall. Furthermore, energy and nutrient intakes as well as nutrient densities of the complementary diet from the commercial infant products and the fortified staple foods of children who consumed these products were compared with those who did not.
IBM SPSS version 22 (IBM Company, Armonk, New York, USA) was used for statistical analyses of nutrient intake—to test for normality, to derive median and interquartile range (IQR) values, and to determine statistical differences between consumers and nonconsumers of commercial infant products and fortified staple foods. Continuous data (dietary data from 24‐hr recall) were tested for normality by using Shapiro–Wilks test; the data were not normally distributed and are therefore reported as the median and IQR. The Mann–Whitney U test was used to determine the significance of differences between intake of consumers and nonconsumers of commercial infant products and fortified staple foods, respectively. For all analyses, the level of significance was set at P < 0.05.
2.5. Ethical considerations
The study was approved by the Human Research Ethics Committee of the North‐West University (NWU‐00011‐11‐A1) and the Ethics Committee of the South African Medical Research Council (EC011‐03/2012). The study was reviewed by the Department of Health and Social Development and registered with the Directorate for Policy, Planning and Research. The local District Department of Health granted permission for the study to be conducted in the area. Informed written consent was obtained from the mother or legal guardian of the child, or if the mother was younger than 18 years, informed consent was obtained from an older family member.
3. RESULTS
3.1. Baseline socio‐economic information of participants
Most (91.7%) of the primary caregivers interviewed were the mothers of the infants. Only 9.2% of the mothers were married. The mean (95% confidence interval) age of the caregivers was 28.4 (27.8, 29.0) years, and 80% had an education level of Grade 10 or higher. The median (IQR) number of people in a household was 5 (4, 7), and 87.4% of households were recipients of a child support grant (social grant). Most households had access to a flush toilet (95.1%), electricity (92.3%), and tap water either inside (29.3%) or outside (66.5%) their dwelling.
3.2. Total dietary intake
Breast milk intake was reported for 71% of infants at age 6 months, 56% at age 12 months, and 37% at age 18 months. Total energy and nutrient intake of infants for whom 24‐hr recall data were available are presented in Table 1. Median intakes of calcium, vitamin A, thiamine, riboflavin, niacin, vitamin B6, vitamin B12, and vitamin C were all above the respective AI values at age 6 months, and thus, a low probability of inadequate intake for these nutrients can be assumed. Iron and zinc intakes were below the EAR for 61.5% and 46.6% of 6‐month‐old infants, respectively; 40.6% of children at age 12 months had intake of folate below the EAR; and ~75% of children at ages 12 and 18 months had intakes of calcium below the EAR. The percentage of children at risk of inadequate intakes of all other nutrients was 25% of less.
Table 1.
Total energy and nutrient intake for infants at age 6, 12 and 18 monthsa
| DRI 6 months | DRI 12 & 18 months |
6 months (n = 715) |
12 months (n = 446) | 18 months (n = 213) | |
|---|---|---|---|---|---|
| Median (IQR) | Median (IQR) | Median (IQR) | |||
| Energy (kJ)b | see footnote | 2857 (2419; 3367) | 3779 (3079; 4498) | 4402 (3551; 5463) | |
| Energy <EER (%) | 35.7 | 27.6 | 24.4 | ||
| Protein (g) | 1.0 g/kg/dc | 0.87 g/kg/dc | 12.5 (9.7; 16.8) | 21.9 (15.1; 28.6) | 29.0 (21.0; 38.5) |
| Protein <EAR (%) | ‐ | 3.6 | 2.8 | ||
| Fat (g) | 30d | ‐‐ | 32.7 (30.1; 36.3) | 35.0 (26.1; 42.6) | 32.0 (22.2; 44.0) |
| Carbohydrates (g) | 95d | 100c | 83 (69; 104) | 119 (95; 148) | 147 (121; 190) |
| Energy distribution | |||||
| Protein %E | ‐‐ | ‐‐ | 7.4 (6.2; 8.9) | 9.6 (7.8; 11.9) | 11.7 (9.0; 13.2) |
| Fat %E | ‐‐ | ‐‐ | 42.4 (37.2; 47.4) | 35.2 (28.0; 40.1) | 28.6 (21.0; 34.0) |
| CHO %E | ‐‐ | ‐‐ | 49.5 (45.7; 54.4) | 53.5 (48.1; 59.3) | 57.4 (52.4; 63.4) |
| Calcium (mg) | 260d | 500c | 357 (276; 468) | 368 (276; 494) | 346 (239; 497) |
| Calcium <EAR (%) | ‐ | 75.8 | 75.1 | ||
| Iron (mg) | 6.9c | 3.0c | 5.4 (2.2; 9.5) | 5.1 (3.4; 7.6) | 5.9 (4.6; 7.8) |
| Iron <EAR (%) | 61.5 | 18.6 | 8.5 | ||
| Zinc (mg) | 2.5c | 2.5c | 2.65 (1.65; 4.33) | 4.39 (3.12; 6.02) | 5.81 (4.30; 7.26) |
| Zinc <EAR (%) | 46.6 | 13.7 | 3.8 | ||
| Vitamin A (μg RAE) | 500d | 210c | 640 (505; 825) | 592 (453; 809) | 489 (304; 723) |
| Vitamin A <EAR (%) | ‐ | 6.5 | 13.1 | ||
| Thiamine (mg) | 0.3d | 0.4c | 0.41 (0.24; 0.62) | 0.66 (0.44; 0.89) | 0.86 (0.63; 1.13) |
| Thiamine <EAR (%) | ‐ | 19.9 | 4.7 | ||
| Riboflavin (mg) | 0.4d | 0.4c | 0.58 (0.39; 0.86) | 0.81 (0.57; 1.14) | 1.02 (0.66; 1.66) |
| Riboflavin <EAR (%) | ‐ | 10.3 | 7.0 | ||
| Niacin (mg) | 4d | 5c | 4.8 (3.0; 7.1) | 7.0 (4.9; 9.5) | 8.6 (6.3; 11.6) |
| Niacin <EAR (%) | ‐ | 25.1 | 14.6 | ||
| Vitamin B6 (mg) | 0.3d | 0.4c | 0.35 (0.20; 0.55) | 0.70 (0.46; 1.00) | 1.04 (0.73; 1.43) |
| Vitamin B6 <EAR (%) | ‐ | 17.7 | 4.2 | ||
| Folate (μg) | 80d | 120c | 62 (44; 116) | 138 (86; 219) | 216 (148; 287) |
| Folate <EAR (%) | ‐ | 40.6 | 16.4 | ||
| Vitamin B12 (μg) | 0.5d | 0.7c | 0.93 (0.70; 1.34) | 1.13 (0.74; 1.66) | 1.19 (0.69; 2.07) |
| Vitamin B12 <EAR (%) | ‐ | 20.9 | 24.9 | ||
| Vitamin C (mg) | 50d | 13c | 62 (45; 82) | 48 (33; 70) | 34 (17; 57) |
| Vitamin C<EAR (%) | ‐ | 6.5 | 7.0 | ||
Note. DRI: Dietary Reference Intakes, EER: Estimated Energy Requirements, mg: milligram, μg: microgram, IQR: Interquartile range, RE: Retinol Equivalents.
Total intake includes breast milk, formula milk feeds and other milk feeds, and complementary foods (but excludes SQ‐LNS). The amount of breast milk intake was assumed according to age; 775 mL for exclusively breastfed infants and 675 mL for partially breastfed infants at age 6 months, 615mL at age 12 months and 550 mL at age 18 months (WHO, 1998). In the instance where other milk feeds (formula milk feeds) were consumed together with breast milk, the volume of the other milk feed was subtracted from these amounts for the different age groups to obtain an estimated amount of breast milk consumed. SQ‐LNS was excluded from the dietary analysis.
EER (in kilojoules – kJ) of the US DRI published by the Institute of Medicine (Institute of Medicine, 2005): age 6 months: (boys 2709; girls 2535), 12 months: (boys 3245; girls 2985), 18 months: (boys 3702; girls 3465).
EAR of the US DRI published by the Institute of Medicine (Institute of Medicine, 1998; 2000; 2001; 2005; 2011).
AI of the US DRI published by the Institute of Medicine (Institute of Medicine, 1998; 2000; 2001; 2005; 2011).
Not determined – insufficient evidence/data to set reference values.
3.3. Commercial infant products
3.3.1. Nutrient contribution towards total intake for consumers of commercial infant products
The contribution of commercial infant products towards total energy and nutrient intake is shown in Figure 1. Data for age 18 months are not presented as only a small number of children (n = 33; 15%) consumed infant products on the day of recall. Commercial infant products were consumed on the day of recall by 83% (n = 591) of infants at age 6 months and by 46% (n = 205) of infants at age 12 months. For consumers, the contribution of commercial infant products to total energy intake was 33% at age 6 months and 27% at age 12 months. For consumers, the contribution of these products to total intake was >90% for iron; ≥70% for thiamine and niacin; and ≥50% for zinc, riboflavin, vitamin B6, folate, and vitamin C intakes at age 6 months and just more than 50% for iron and vitamin C at age 12 months (Figure 1).
Figure 1.
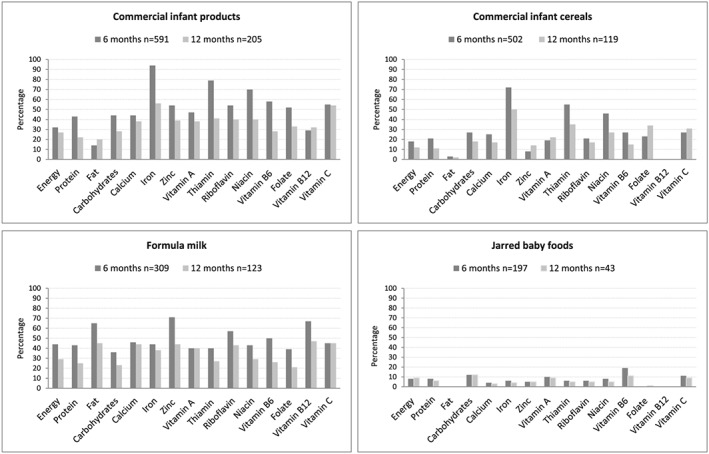
Percentage contribution of commercial infant products (combined and individually) towards total energy and nutrient intake of consumers at ages 6 and 12 months
Infant cereals were consumed on the day of recall by 70% (n = 502) of infants at age 6 months and 27% (n = 119) of infants at age 12 months. For consumers, the contribution of these products to total intake was >70% for iron and >50% for thiamine at age 6 months and ~50% for iron at age 12 months (Figure 1).
Jarred infant products were consumed on the day of recall by 28% (n = 197) of infants at age 6 months and 10% (n = 43) of infants at age 12 months. For consumers, these products contributed <20% of total intake for vitamin B6 and vitamin C at age 6 months and <10% for most other micronutrients at both ages (Figure 1).
Formula milk was consumed on the day of recall by 43% (n = 309) infants at age 6 months and 28% (n = 123) of infants at age 12 months. For consumers, the contribution of formula milk to total intake was approximately two thirds for zinc and vitamin B12, 44% for iron, and 50–60% for riboflavin and vitamin B6 at age 6 months and 40–50% for calcium, zinc, vitamin A, riboflavin, vitamin B12, and vitamin C and 38% for iron at age 12 months (Figure 1).
The contribution of baby juice is not shown as it was consumed on the day of recall by only a small number of children at all ages (6 months, 3% [n = 25]; 12 months, 4% [n = 17]).
3.3.2. Total nutrient intake for consumers versus nonconsumers of commercial infant products
Energy and nutrient intake for consumers and nonconsumers of commercial infant products at ages 6 and 12 months are reported in Table 2. At age 6 months, consumers of commercial infant products had significantly higher intakes (P < 0.05) of energy, protein, carbohydrates, and all key micronutrients in comparison with nonconsumers (Table 2). At age 12 months, consumers of commercial infant products had significantly higher intakes (P < 0.05) of iron, zinc, vitamin A, thiamine, riboflavin, and vitamin C compared with nonconsumers.
Table 2.
Total energy and nutrient intake of consumers versus nonconsumers of commercial infant productsa
| Age 6 months | Age 12 months | |||||
|---|---|---|---|---|---|---|
|
Consumers (n = 591) Median (IQR) |
Nonconsumers (n = 124) Median (IQR) |
P valueb |
Consumers (n = 205) Median (IQR) |
Nonconsumers (n = 241) Median (IQR) |
P valueb | |
| Energy (kJ) | 2,912 (2,524; 3,408) | 2,334 (2,301; 3,093) | <0.001 | 3,630 (3,028; 4,437) | 3,898 (3,099; 4,585) | 0.123 |
| Energy < EER (%) | 30.8 | 58.9 | <0.001 | 29.8 | 25.7 | 0.343 |
| Protein (g) | 13.1 (10.3; 17.6) | 8.5 (7.8; 12.7) | <0.001 | 22.4 (15.1; 28.6) | 21.2 (15.1; 28.9) | 0.846 |
| Fat (g) | 32.6 (29.9; 36.6) | 33.6 (31.1; 34.1) | 0.280 | 32.9 (25.8; 41.8) | 36.9 (26.4; 43.5) | 0.197 |
| Carbohydrates (g) | 85.7 (71.6; 105.0) | 63.6 (53.5; 87.5) | <0.001 | 114.8 (93.7; 142.5) | 121.5 (95.5; 150.9) | 0.141 |
| Calcium (mg) | 376 (298; 487) | 248 (236; 336) | <0.001 | 405 (307; 536) | 342 (236; 469) | <0.001 |
| Calcium < EAR (%) | — | — | 68.3 | 82.2 | 0.001 | |
| Iron (mg) | 6.4 (3.6; 10.3) | 0.8 (0.2; 2.1) | <0.001 | 7.1 (5.1; 9.6) | 3.9 (2.8; 5.5) | <0.001 |
| Iron < EAR (%) | 53.5 | 100 | <0.001 | 6.8 | 28.6 | <0.001 |
| Zinc (mg) | 3.04 (1.81; 4.84) | 1.66 (1.32; 2.41) | <0.001 | 4.90 (3.21; 7.05) | 4.10 (3.06; 5.31) | <0.001 |
| Zinc < EAR (%) | 40.3 | 76.6 | <0.001 | 10.7 | 16.2 | 0.095 |
| Vitamin A (μg RAE) | 682 (554; 860) | 496 (460; 528) | <0.001 | 667 (508; 901) | 546 (414; 692) | <0.001 |
| Vitamin A < EAR (%) | — | — | 2.4 | 10.0 | 0.001 | |
| Thiamine (mg) | 0.47 (0.32; 0.68) | 0.15 (0.08; 0.28) | <0.001 | 0.74 (0.48; 0.96) | 0.57 (0.40; 0.83) | <0.001 |
| Thiamine < EAR (%) | — | — | 12.2 | 22.8 | 0.004 | |
| Riboflavin (mg) | 0.64 (0.45; 0.92) | 0.31 (0.31; 0.48) | <0.001 | 0.92 (0.66; 1.27) | 0.72 (0.49; 1.03) | <0.001 |
| Riboflavin < EAR (%) | — | — | 4.9 | 14.9 | <0.001 | |
| Niacin (mg) | 5.3 (3.5; 7.6) | 2.1 (1.6; 3.5) | <0.001 | 7.6 (5.8; 9.9) | 6.5 (4.3; 8.9) | <0.001 |
| Niacin < EAR (%) | — | — | 18.5 | 30.7 | 0.003 | |
| Vitamin B6 (mg) | 0.39 (0.23; 0.58) | 0.19 (0.08; 0.34) | <0.001 | 0.68 (0.46; 0.94) | 0.72 (0.46; 1.01) | 0.958 |
| Vitamin B6 < EAR (%) | — | — | 15.6 | 19.5 | 0.283 | |
| Folate (μg) | 66 (46; 132) | 44 (38; 78) | <0.001 | 137 (83; 237) | 138 (86; 214) | 0.605 |
| Folate < EAR (%) | — | — | 39.0 | 41.9 | 0.536 | |
| Vitamin B12 (μg) | 0.98 (0.75; 1.42) | 0.78 (0.68; 0.95) | <0.001 | 1.26 (0.87; 1.82) | 1.04 (0.69; 1.56) | 0.003 |
| Vitamin B12 < EAR (%) | — | — | 15.6 | 25.3 | 0.012 | |
| Vitamin C (mg) | 67 (51; 88) | 38 (35; 43) | <0.001 | 65 (49; 91) | 36 (26; 50) | <0.001 |
| Vitamin C < EAR (%) | — | — | 0.5 | 11.6 | <0.001 | |
Note. EAR: estimated average requirement; EER: estimated energy requirements; IQR: interquartile range; RAE: retinol activity equivalent; SQ‐LNS: small‐quantity lipid‐based nutrient supplements.
Total intake includes breast milk, formula milk and other feeds, and complementary foods (but excludes SQ‐LNS). Consumer of commercial infant products indicates that the child consumed these products on the day of recall; nonconsumer indicates that the child has not consumed any of these products on the day of recall; infant products include formula milk feeds, formula milk stirred into food, commercial infant cereal, jarred baby foods, and infant juice.
P < 0.05 indicates significant differences and is formatted in bold type; consumers and nonconsumers of commercial infant products were compared using the Mann–Whitney U test for median values and the chi‐square test/Fischer exact test for percentages.
3.3.3. Nutrient densities of the complementary diet for consumers versus nonconsumers of commercial infant products
Energy content and nutrient density of the complementary diet for consumers and nonconsumers of commercial infant products are reported in Table 3. The difference in the number of consumers and nonconsumers given in Table 3 compared with Table 2 is because infants who consumed only breast milk or formula milk feeds were excluded and formula milk feeds were not considered part of the complementary diet. The nutrient density of the complementary diet for consumers of commercial infant products was significantly higher (P < 0.05) for protein (6 months only), calcium, iron, vitamin A, thiamine (12 months only), riboflavin, niacin, vitamin B12 (6 months only), and vitamin C compared with nonconsumers (Table 3).
Table 3.
Energy content and nutrient density of the complementary diet of consumers versus nonconsumers of commercial infant productsa
| Age 6 months | Age 12 months | |||||
|---|---|---|---|---|---|---|
|
Consumers (n = 558) Median (IQR) |
Nonconsumers (n = 107) Median (IQR) |
P valueb |
Consumers (n = 149) Median (IQR) |
Nonconsumers (n = 297) Median (IQR) |
P valueb | |
| Energy (kJ) | 991 (631; 1,456) | 1,046 (558; 1,685) | 0.696 | 2,210 (1,637; 2,958) | 2,536 (1,787; 3,487) | 0.013 |
| Protein (g/100 kcal) | 2.3 (1.8; 3.3) | 2.0 (1.5; 2.7) | 0.001 | 2.8 (2.2; 3.5) | 2.7 (2.1; 3.4) | 0.415 |
| Fat (g/100 kcal) | 1.9 (0.8; 2.5) | 1.6 (0.8; 3.0) | 0.559 | 2.4 (1.7; 3.1) | 2.5 (1.9; 3.3) | 0.191 |
| Carbohydrates (g/100 kcal) | 16.9 (15.7; 19.3) | 16.8 (15.6; 19.8) | 0.435 | 15.7 (13.3; 17.3) | 15.2 (13.2; 16.7) | 0.215 |
| Calcium (mg/100 kcal) | 69 (39; 92) | 46 (97; 66) | <0.001 | 42 (26; 67) | 33 (18; 52) | <0.001 |
| Iron (mg/100 kcal) | 1.7 (1.2; 3.1) | 0.7 (0.4; 0.8) | <0.001 | 1.1 (0.8; 1.4) | 0.6 (0.5; 0.8) | <0.001 |
| Zinc (mg/100 kcal) | 0.5 (0.2; 0.8) | 0.5 (0.4; 0.6) | 0.269 | 0.6 (0.5; 0.7) | 0.6 (0.5; 0.6) | 0.286 |
| Vitamin A (μg RAE/100 kcal) | 93 (61; 178) | 41 (26; 54) | <0.001 | 66 (45; 102) | 40 (29; 59) | <0.001 |
| Thiamine (mg/100 kcal) | 0.11 (0.05; 0.22) | 0.13 (0.05; 0.23) | 0.574 | 0.11 (0.09; 0.13) | 0.09 (0.07; 0.11) | <0.001 |
| Riboflavin (mg/100 kcal) | 0.11 (0.07; 0.17) | 0.07 (0.03; 0.12) | <0.001 | 0.11 (0.07; 0.15) | 0.09 (0.06; 0.14) | <0.001 |
| Niacin (mg/100 kcal) | 1.22 (0.89; 1.87) | 0.76 (0.54; 0.96) | <0.001 | 1.02 (0.79; 1.42) | 0.87 (0.67; 1.22) | <0.001 |
| Vitamin B6 (mg/100 kcal) | 0.08 (0.03; 0.17) | 0.07 (0.02; 0.16) | 0.482 | 0.10 (0.07; 0.13) | 0.11 (0.08; 0.13) | 0.113 |
| Folate (μg/100 kcal) | 9.4 (5.1; 32.3) | 16.7 (8.9; 23.2) | 0.068 | 21.0 (11.2; 32.8) | 19.2 (12.3; 27.9) | 0.100 |
| Vitamin B12 (μg/100 kcal) | 0.1 (0.0; 0.2) | 0.0 (0.0; 0.2 | 0.007 | 0.1 (0.1; 0.2) | 0.1 (0.0; 0.2) | 0.081 |
| Vitamin C (mg/100 kcal) | 12 (8; 17) | 4 (1; 6) | <0.001 | 7 (4; 12) | 3 (1; 5) | <0.001 |
Note. IQR: interquartile range; RAE: retinol activity equivalent; SQ‐LNS: small‐quantity lipid‐based nutrient supplements.
Consumer of commercial infant products indicates that the child consumed these products as part of the complementary diet on the day of recall; nonconsumer indicates that the child has not consumed any of these products as part of the complementary diet on the day of recall; the complementary diet is defined as all foods and drinks except breast milk, formula milk feeds, and SQ‐LNS; infant products as part of the complementary diet include formula milk stirred into food, commercial infant cereal, jarred baby foods, and infant juice. Sample sizes for consumers and nonconsumers differ from Table 2 because infants who received breast milk and/or formula milk feeds only were excluded, and formula milk feeds were excluded when defining a consumer.
P < 0.05 indicates significant differences between consumers and nonconsumers of commercial infant products (Mann–Whitney U test) and is formatted in bold type.
3.4. Fortified maize meal and bread
3.4.1. Nutrient contribution towards total intake for consumers of fortified maize meal and bread
The contribution of fortified maize meal and/or bread (combined and individually) towards total energy and nutrient intake for consumers is shown in Figure 2. Fortified maize meal and bread were consumed by 23% (n = 167) of infants at age 6 months, 81% (n = 362) of children at age 12 months, and 95% (n = 203) of children at age 18 months on the day of recall. For these products, only the contribution of the fortified micronutrients (vitamin A, thiamine, riboflavin, niacin, pyridoxine, folic acid, iron, and zinc) is reported together with energy and macronutrients (Figure 2). For consumers, contribution of fortified staple foods to total energy intake was 11% at age 6 months and 29% at age 18 months. For consumers, the contribution of fortified staples foods to total intake was ~20% for carbohydrate, zinc, and niacin; ~25% for iron and thiamine; and ~33% for vitamin B6 and folate intake at age 6 months; ~33% for carbohydrate, iron, and zinc and ≥50% for thiamine, vitamin B6, and folate at age 12 months; and >40% for iron and zinc, >50% for thiamine and vitamin B6, and >70% for folate at age 18 months (Figure 2).
Figure 2.
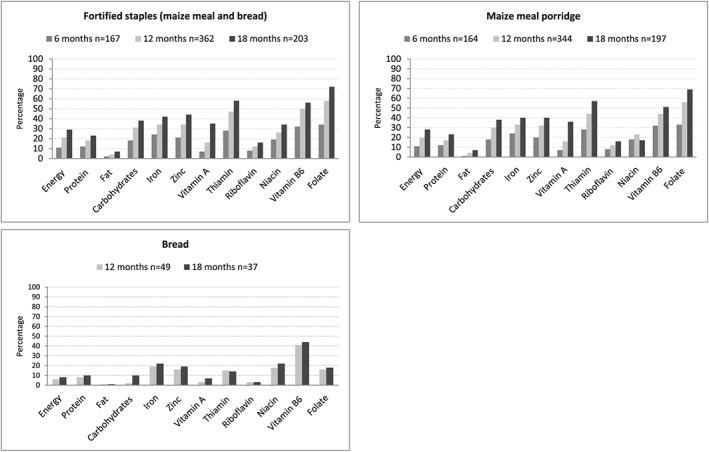
Percentage contribution of fortified bread and maize meal (combined and individually) to total intake of consumers at ages 6 (not for bread), 12, and 18 months
Fortified maize meal porridge was consumed by 23% (n = 164) of infants at age 6 months, 78% (n = 344) of children at age 12 months, and 92% (n = 197) of children at age 18 months on the day of recall. For consumers, the contribution of maize meal porridge to total intake was 11% for energy and <33% for all fortified micronutrients at age 6 months; 20% for energy and ≥33% for iron, zinc, thiamine, vitamin B6, and folate at age 12 months; and 28% for energy, 40% for iron and zinc, and >50% for thiamine and folate at age 18 months (Figure 2).
Fortified bread was consumed by 11% (n = 49) of children at age 12 months and 17% (n = 37) of children at age 18 months on the day of recall. These data are not shown for age 6 months as there were too few consumers thereof (n = 5; 1%). For consumers, at both 12 and 18 months of age, bread contributed <25% towards total intake of the fortified micronutrients, except for vitamin B6 (>40%; Figure 2).
3.4.2. Total nutrient intake for consumers versus nonconsumers of fortified maize meal and bread
Total energy and nutrient intake for consumers and nonconsumers of fortified maize meal and bread are reported in Table 4. The number of nonconsumers at age 18 months on the day of recall was low (n = 10; 5%), and comparison between consumers and nonconsumers for this age group was therefore not done. At both 6 and 12 months of age, consumers had significantly (P < 0.05) higher intakes for energy, protein, carbohydrates, zinc, thiamine (12 months only), niacin (12 months only), vitamin B6, and folate but lower intakes for vitamin A (6 months only), and vitamin C compared with nonconsumers. At age 12 months, significantly more consumers than nonconsumers of fortified maize meal and bread had adequate intakes (>EAR) for all eight fortificant nutrients (51.4% vs. 25.0%; P = 0.005).
Table 4.
Total energy and nutrient intake of consumers versus nonconsumers of fortified maize meal and/or breada
| Age 6 months | Age 12 months | |||||
|---|---|---|---|---|---|---|
|
Consumers (n = 167) Median (IQR) |
Nonconsumers (n = 548) Median (IQR) |
P valueb |
Consumers (n = 362) Median (IQR) |
Nonconsumers (n = 84) Median (IQR) |
P valueb | |
| Energy (kJ) | 3,067 (2,607; 3,666) | 2,811 (2,376; 3,275) | <0.001 | 3,856 (3,137; 4,616) | 3,369 (2,612; 4,128) | <0.001 |
| Energy < EER (%) | 29.3 | 37.6 | 0.051 | 24.3 | 41.7 | 0.001 |
| Protein (g) | 13.0 (10.2; 18.8) | 12.3 (9.5; 16.2) | 0.012 | 22.3 (15.7; 29.6) | 17.8 (12.6; 24.4) | <0.001 |
| Fat (g) | 32.9 (30.4; 38.2) | 32.7 (30.0; 35.9) | 0.243 | 35.5 (25.3; 42.8) | 32.6 (26.9; 41.7) | 0.494 |
| Carbohydrates (g) | 91.3 (73.7; 113.9) | 81.7 (66.9; 100.9) | <0.001 | 122.4 (98.1; 152.4) | 102.9 (78.0; 128.1) | <0.001 |
| Calcium (mg)c | 352 (266; 463) | 363 (277; 468) | 0.302 | 362 (273; 483) | 399 (301; 537) | 0.095 |
| Calcium < EAR (%) | — | — | 77.3 | 69.0 | 0.110 | |
| Iron (mg)c | 3.3 (1.8; 6.9) | 5.9 (2.7; 10.1) | <0.001 | 5.0 (3.3; 7.2) | 5.4 (3.7; 9.3) | 0.076 |
| Iron < EAR (%) | 74.3 | 57.7 | <0.001 | 18.8 | 17.9 | 0.844 |
| Zinc (mg)c | 2.9 (2.1; 4.5) | 2.6 (1.5; 4.3) | 0.017 | 4.6 (3.3; 6.1) | 3.3 (2.1; 4.9) | <0.001 |
| Zinc < EAR (%) | 40.7 | 48.4 | 0.083 | 8.8 | 34.5 | <0.001 |
| Vitamin A (μg RAE)c | 599 (489; 770) | 650 (517; 844) | 0.003 | 589 (453; 776) | 638 (453; 891) | 0.406 |
| Vitamin A < EAR (%) | — | — | 6.9 | 4.8 | 0.473 | |
| Thiamine (mg)c | 0.39 (0.24; 0.63) | 0.42 (0.25; 0.62) | 0.765 | 0.69 (0.47; 0.91) | 0.53 (0.37; 0.81) | 0.003 |
| Thiamine < EAR (%) | — | — | 15.5 | 28.6 | 0.005 | |
| Riboflavin (mg)c | 0.56 (0.38; 0.79) | 0.59 (0.40; 0.88) | 0.338 | 0.82 (0.58; 1.16) | 0.77 (0.51; 1.03) | 0.261 |
| Riboflavin < EAR (%) | — | — | 10.2 | 10.7 | 0.893 | |
| Niacin (mg)c | 4.1 (2.7; 6.4) | 4.9 (3.1; 7.2) | 0.052 | 7.1 (5.0; 9.6) | 6.2 (4.2; 8.9) | 0.037 |
| Niacin < EAR (%) | — | — | 23.5 | 32.1 | 0.099 | |
| Vitamin B6 (mg)c | 0.40 (0.25; 0.67) | 0.34 (0.18; 0.50) | <0.001 | 0.79 (0.50; 1.05) | 0.47 (0.34; 0.64) | <0.001 |
| Vitamin B6 < EAR (%) | — | — | 13.0 | 38.1 | <0.001 | |
| Folate (μg)c | 87 (58; 146) | 56 (41; 96) | <0.001 | 152 (105; 231) | 70 (47; 127) | <0.001 |
| Folate < EAR (%) | — | — | 33.4 | 71.4 | <0.001 | |
| Vitamin B12 (μg) | 0.91 (0.67; 1.34) | 0.94 (0.74; 1.34) | 0.384 | 1.14 (0.73; 1.70) | 1.10 (0.85; 1.53) | 0.486 |
| Vitamin B12 < EAR (%) | — | — | 21.3 | 19.0 | 0.651 | |
| Vitamin C (mg) | 50 (38; 73) | 65 (48; 84) | <0.001 | 45 (32; 64) | 66 (46; 97) | <0.001 |
| Vitamin C < EAR (%) | — | — | 6.9 | 4.8 | 0.473 | |
Note. Adequate intake for all eight fortificant nutrients for age 12 months is as follows: consumers 51.4% versus nonconsumers 25.0%; P = 0.005. EAR: estimated average requirement; EER: estimated energy requirement; IQR: interquartile range; SQ‐LNS: small‐quantity lipid‐based nutrient supplements.
Total intake includes breast milk, formula milk and other feeds, and complementary foods (but excludes SQ‐LNS). Consumer of fortified maize meal and bread indicates that the child consumed these products on the day of recall; nonconsumer indicates that the child has not consumed any of these products on the day of recall. At age 6 months, 74% of consumers and 71% of nonconsumers were breastfed (P = 0.475), and at age 12 months, 55% of consumers and 61% of nonconsumers were breastfed (P = 0.317).
P < 0.05 indicates significant differences and is formatted in bold type; consumers and nonconsumers of fortified maize meal and bread were compared using the Mann–Whitney U test for median values and the chi‐square test/Fischer exact test for percentages.
Fortificant nutrients added to maize meal and wheat flour (bread).
3.4.3. Nutrient densities of the complementary diet for consumers versus nonconsumers of fortified maize meal and bread
Energy content and nutrient density of the complementary diet for consumers and nonconsumers are reported in Table 5. Energy intake and nutrient densities of zinc and folate for consumers at 6 months and energy intake and nutrient densities of zinc, folate, and vitamin B6 for consumers at 12 months were significantly higher (P < 0.05) compared with nonconsumers. Nutrient densities of calcium, iron, vitamin A, riboflavin (6 months only), niacin, and vitamin C were significantly higher (P < 0.05) for nonconsumers at ages 6 and 12 months compared with consumers.
Table 5.
Energy content and nutrient density (nutrients per 100 kcal) of the complementary diet for consumers versus nonconsumers of fortified maize meal and/or bread at ages 6 and 12 monthsa
| Age 6 months | Age 12 months | |||||
|---|---|---|---|---|---|---|
|
Consumers (n = 167) Median (IQR) |
Nonconsumers (n = 498) Median (IQR) |
P valueb |
Consumers (n = 362) Median (IQR) |
Nonconsumers (n = 84) Median (IQR) |
P valueb | |
| Energy (kJ) | 1,219 (694; 1,858) | 935 (605; 1,363) | <0.001 | 2,521 (1,884; 3,420) | 1,834 (1,294; 2,564) | <0.001 |
| Protein (g/100 kcal) | 2.4 (1.7; 3.0) | 2.2 (1.7; 3.3) | 0.398 | 2.7 (2.1; 3.4) | 2.9 (2.1; 3.5) | 0.880 |
| Fat (g/100 kcal) | 1.9 (0.8; 2.7) | 1.8 (0.84; 2.4) | 0.038 | 2.4 (1.8; 3.1) | 2.4 (1.7; 3.4) | 0.791 |
| Carbohydrates (g/100 kcal) | 16.9 (14.7; 19.1) | 16.9 (15.7; 19.6) | 0.101 | 15.2 (13.2; 16.9) | 15.3 (13.0; 17.4) | 0.780 |
| Calcium (mg/100 kcal) | 51 (24; 70) | 70 (38; 94) | <0.001 | 33 (20; 52) | 49 (27; 72) | <0.001 |
| Iron (mg/100 kcal) | 0.8 (0.6; 1.3) | 1.7 (1.2; 3.2) | <0.001 | 0.7 (0.5; 0.9) | 1.0 (0.7; 1.6) | <0.001 |
| Zinc (mg/100 kcal) | 0.5 (0.4; 0.6) | 0.4 (0.2; 0.8) | 0.005 | 0.6 (0.5; 0.7) | 0.4 (0.3; 0.6) | <0.001 |
| Vitamin A (μg RAE/100 kcal) | 54 (37; 92) | 92 (60; 186) | <0.001 | 44 (32; 72) | 62 (35; 100) | 0.028 |
| Thiamine (mg/100 kcal) | 0.10 (0.03; 0.21) | 0.12 (0.06; 0.23) | 0.094 | 0.10 (0.07; 0.11) | 0.10 (0.07; 0.13) | 0.139 |
| Riboflavin (mg/100 kcal) | 0.07 (0.05; 0.12) | 0.11 (0.07; 0.17) | <0.001 | 0.09 (0.06; 0.14) | 0.10 (0.06; 0.15) | 0.420 |
| Niacin (mg/100 kcal) | 0.81 (0.64; 1.20) | 1.24 (0.89; 1.92) | <0.001 | 0.90 (0.68; 1.26) | 1.03 (0.79; 1.41) | 0.016 |
| Vitamin B6 (mg/100 kcal) | 0.06 (0.03; 0.14) | 0.09 (0.03; 0.18) | 0.072 | 0.11 (0.08; 0.13) | 0.07 (0.06; 0.11) | <0.001 |
| Folate (μg/100 kcal) | 19.3 (12.8; 30.3) | 7.5 (5.0; 27.1) | <0.001 | 21.2 (14.8; 29.8) | 7.6 (5.1; 22.3) | <0.001 |
| Vitamin B12 (μg/100 kcal) | 0.07 (0.00; 0.16) | 0.010 (0.00; 0.19) | 0.106 | 0.10 (0.04; 0.18) | 0.11 (0.05; 0.16) | 0.724 |
| Vitamin C (mg/100 kcal) | 5 (3; 9) | 12 (8; 17) | <0.001 | 3.39 (1.43; 5.60) | 7.77 (4.30; 14.83) | <0.001 |
Note. IQR: interquartile range; RAE: retinol activity equivalents; SQ‐LNS: small‐quantity lipid‐based nutrient supplements.
Consumer of fortified maize meal and bread indicates that the child consumed these products as part of the complementary diet on the day of recall; nonconsumer indicates that the child has not consumed any of these products as part of the complementary diet on the day of recall; the complementary diet is defined as all foods and drinks except breast milk, formula milk feeds, and SQ‐LNS. The number of nonconsumers at age 6 months differs from Table 4, because of the exclusion of infants who received only breast milk and/or formula milk feeds.
P < 0.05 indicates significant differences (Mann–Whitney U test) and is formatted in bold type.
4. DISCUSSION
At age 6 months, infants consumed a predominantly commercial infant product‐based diet, and consumers of these foods had significantly higher intakes of energy and all key micronutrients compared with nonconsumers. Fewer children consumed commercial infant products at age 12 months; however, commercial infant products contributed significantly to nutrient intake of consumers' diets. Fortified staples, mostly maize meal, were widely consumed at ages 12 and 18 months, and consumers had significantly higher intakes of zinc, thiamine, niacin, vitamin B6, and folate and significantly lower intake of vitamin C compared with nonconsumers at age 12 months. At age 12 months, significantly more consumers than nonconsumers of fortified maize meal and bread had adequate intakes (>EAR) for all eight fortificant nutrients.
Commercial infant cereal was consumed by 70% of infants at age 6 months on the day of recall in the present study. This is slightly lower than the >80% that was reported for 6‐month‐old infants in a study in the Western Cape province (Budree et al., 2017). Fewer children (27%) consumed infant cereal at age 12 months, which is within the range of 20–50% that was reported for infants between 6 and 12 months of age in studies in KwaZulu‐Natal, Limpopo, and Gauteng provinces (Faber et al., 2016; Ntila et al., 2017).
For consumers, commercial infant products (of which commercial infant cereal followed by formula milk were the products most consumed) were the largest contributors of most nutrients. The significantly higher micronutrient intakes for consumers of commercial infant products compared with nonconsumers at ages 6 and 12 months are congruent with findings for 6‐ to 12‐month‐old infants in South Africa (Faber, 2005) and 9‐month‐old infants in Indonesia (Aly et al., 2017). Despite the high number of infants who consumed infant cereal at age 6 months, 61.5% had an iron intake below the EAR, highlighting the challenge of meeting iron requirements in this age group. In an Indonesian study, consumption of fortified infant foods was inversely associated with dietary diversity, which limits the infants' exposure to a variety of foods of differing textures and flavours (Aly et al., 2017). Commercial infant foods may have practical advantages in terms of convenience and hygiene, yet there are concerns with regard to sugar and salt content in some of these products (Dunford, Louie, Byrne, Walker, & Flood, 2015; Maslin & Venter, 2017). Commercial infant snack foods such as biscuits were not consumed in our study population. We need a better understanding on why commercial infant products are so widely consumed in poor communities, considering the cost of these products.
Although not widely consumed at age 6 months, maize meal porridge was consumed by most children at ages 12 and 18 months. For 6‐ and 12‐month‐old infants, the iron content of the complementary diet for consumers of fortified maize meal and bread was lower than nonconsumers. A large proportion of nonconsumers of fortified maize meal and bread are consumers of commercial infant cereals that contain higher levels of iron per 100 g than the fortified maize meal and bread. At age 6 months, 86% of nonconsumers versus 42% of consumers of fortified maize and bread ate infant cereal (P < 0.001), and at age 12 months, 54% of nonconsumers versus 20% of consumers of fortified maize and bread ate infant cereal (P < 0.001). Although we estimated the amount for breast milk intake, it is unlikely that this contributed to differences observed, as the proportions of breastfeeding infants for consumers and nonconsumers of fortified maize meal and bread did not differ significantly (age 6 months: 74% vs. 71%, P = 0.475; age 12 months: 55% vs. 61%, P = 0.317). The nutrient densities of calcium, vitamin A, riboflavin (6 months only), niacin, and vitamin C were also significantly lower (P < 0.05) for consumers of fortified maize and bread at ages 6 and 12 months compared with nonconsumers. The lower nutrient densities of these nutrients for consumers of fortified maize meal and bread compared with nonconsumers reflect consumption of foods of poor nutrient density. Despite the lower nutrient densities of the complementary diet for consumers of fortified maize and bread, consumption of these fortified staples was associated with a higher proportion of children with adequate intakes (>EAR) for all eight fortificant nutrients at age 12 months, suggesting that, even at this young age, large‐scale untargeted fortification programmes do have the potential to contribute towards dietary adequacy. In South Africa, maize meal and wheat flour are not fortified with calcium and vitamin C, and thus, one would not expect the fortified staples to contribute towards the dietary intake of these two nutrients. The low calcium intakes at ages 12 and 18 months (75% of the children had calcium intake below the EAR) are of concern. Van Stuijvenberg et al. (2015) reported lower calcium intakes in stunted versus nonstunted 2‐ to 5‐year‐old South African children, as well as higher height‐for‐age z‐scores for children who habitually drank milk compared with those who did not. Strategies to increase calcium intake in this age group are therefore needed.
Nutrient contribution of the fortified staples was calculated based on the nutrient values in the SAFCD, which are based on actual analysis of maize porridge and bread (Wolmarans et al., 2010). South African studies that determined the micronutrient content of maize meal and bread suggest inconsistent (and often inadequate) fortification, not complying to the legislative requirements (Pretorius & Schönfeldt, 2012; Van Jaarsveld, Faber, & van Stuijvenberg, 2015; Yusufali, Sunley, de Hoop, & Panagides, 2012). The reported nutrient contribution of fortified maize meal and bread may therefore vary, depending on the actual nutrient levels in the fortified products. Maize meal and wheat flour are fortified with electrolytic iron (Department of Health, South Africa, 2003), whereas commercial infant cereals are generally fortified with ferrous fumarate (according to packaging labels). The current National Food Fortification Programme in South Africa is not aimed at the complementary feeding period (Department of Health, South Africa, 2003) and the possibility of developing a targeted product, fortified at higher levels to meet the requirements of young children (6 to 23 months) should be investigated.
Vossenaar and Solomons (2012) suggested that the complementary diet will probably not meet recommended intakes of the “problem nutrients,” such as iron, without the consumption of fortified foods. Similar findings were observed in a study in 12‐ to 23‐month‐old children in Indonesia, which showed that inclusion of fortified foods in the complementary diet will contribute to nutrient adequacy of the diet, whereas exclusion of fortified foods was associated with more nutrients being inadequate (Fahmida & Santika, 2016). Fortified maize meal provided 50.7% of the requirements for iron for 6‐ to 12‐month‐old infants in Kenya (Leyvraz et al., 2018). Bioavailability of micronutrient nutrients, such as iron, from fortified foods should however be considered, whether it is commercial infant cereal or fortified staple foods. Depending on the fortificant used, bioavailability may be low, and therefore, the absorption by and effect thereof in the body are limited (Glinz et al., 2017; Kruger, 2016; Quintaes, Barbera, & Cilla, 2017).
The strength of the study is that dietary intake was assessed for a cohort of children at ages 6, 12, and 18 months. Limitations include a large dropout rate and nonrandom selection due to exclusion criteria, which limit generalisability. The children participated in a randomised controlled trial, which may be viewed as a limitation. Dietary intake at age 6 months was assessed at enrolment, before any SQ‐LNS was received. For ages 12 and 18 months, we treated the SQ‐LNS as a supplement and did not include it in the dietary analysis. There were no statistically significant differences between the three study groups within an age group for energy, either for total intake or for the complementary diet, and it is therefore unlikely that the SQ‐LNS affected usual intake. Dietary intake data do present with some limitations, and it is widely acknowledged that the use of a single 24‐hr recall limits the ability to determine adequacy of the total diet in terms of energy and nutrient intake due to large day‐to‐day within‐person variation (Murphy, Guenther, & Kretsch, 2006). A recent paper by Padilha et al. (2017) suggests that for most micronutrients (including iron, zinc, and calcium), a single 24‐hr dietary recall record has sufficient correlation with usual intakes of energy and nutrients in children younger than 23 months. Day‐to‐day variation is probably also lower for populations with low dietary variety. Furthermore, it is acknowledged that quantifying breast milk volumes and composition is challenging and that volumes used remain estimations.
In conclusion, dietary trends observed in this study population showed large numbers of infants consuming commercial infant products at 6 months and lower numbers at 18 months with an opposite trend for fortified maize meal consumption. Most children at ages 12 and 18 months consumed fortified maize meal and bread (although to a lesser extent), which contributed to micronutrient intake, but neither are fortified with calcium. At ages 12 and 18 months, ~75% of children had low calcium intake. Although consumption of fortified staples contributed to micronutrient adequacy of the diet, nutrient gaps remain.
CONFLICTS OF INTEREST
C. M. S. received travelling support from Unilever, DSM, and Sight and Life; T. M. M. received speaking honorarium from DSM. None of the other authors declared conflict of interest.
CONTRIBUTIONS
CMS was the principal investigator and conceptualised the Tswaka study; MF conceptualised the dietary intake analysis, was overall responsible for dietary data collection, and had the primary responsibility for final content of the manuscript. MR and TMM were the study coordinators and helped to execute the study; and MR was responsible to oversee the collection of dietary data. RL did the dietary analysis. ES and MF drafted the manuscript. LH‐N and MR contributed to the writing of the manuscript, and TMM and CMS edited the manuscript. All authors read and approved the final manuscript.
ACKNOWLEDGMENTS
We thank the parents and caregivers of the infants for participating in the study. We appreciate the contribution of the Tswaka team for executing the study, specifically the field workers involved in the dietary data collection. We further acknowledge the role of the dietary coders and data capturers.
Swanepoel E, Havemann‐Nel L, Rothman M, et al. Contribution of commercial infant products and fortified staple foods to nutrient intake at ages 6, 12, and 18 months in a cohort of children from a low socio‐economic community in South Africa. Matern Child Nutr. 2019;15:e12674 10.1111/mcn.12674
REFERENCES
- Abizari, A.‐R. , Ali, Z. , Essah, C. N. , Agyeiwaa, P. , & Amaniampong, M. (2017). Use of commercial infant cereals as complementary food in infants and young children in Ghana. BMC Nutrition, 3, 72. [DOI] [PMC free article] [PubMed] [Google Scholar]
- Aly, D. , Mallard, S. R. , Haszard, J. J. , Purnamasari, D. M. , Nurulazmi, I. , Herliani, P. D. , … Houghton, L. (2017). Consumption of fortified infant foods reduces dietary diversity but has a positive effect on subsequent growth in infants from Sumedang district, Indonesia. PLoS One, 12(4), e0175952. [DOI] [PMC free article] [PubMed] [Google Scholar]
- Bhutta, Z. A. , Das, J. K. , Rizvi, A. , Gaffey, M. F. , Walker, N. , Horton, S. , … The Maternal and Child Nutrition Study Group (2013). Evidence‐based interventions for improvement of maternal and child nutrition: What can be done and at what cost? Lancet, 382, 452–477. [DOI] [PubMed] [Google Scholar]
- Budree, S. , Goddard, E. , Brittain, K. , Cader, S. , Myer, L. , & Zar, H. J. (2017). Infant feeding practices in a South African birth cohort—A longitudinal study. Maternal and Child Nutrition, 13, e12371. [DOI] [PMC free article] [PubMed] [Google Scholar]
- Campos, R. , Hernandez, L. , Soto‐Mendez, M. J. , Vossenaar, M. , & Solomons, N. W. (2010). Contribution of complementary food nutrients to estimated total nutrient intakes for rural Guatemalan infants in the second semester of life. Asia Pacific Journal of Clinical Nutrition, 19, 481–490. [PubMed] [Google Scholar]
- Chetty, J. , van Graan, A. , & Links, M. (2016). Baby food group update of the South African food composition database: Highlights from data quality checks. South African Journal of Clinical Nutrition, 29, 5. [Google Scholar]
- Darnton‐Hill, I. , Neufeld, L. , Vossenaar, M. , Osendarp, S. , & Martinez, H. (2017). Large‐scale food fortification: An overview of trends and challenges in low‐ and middle‐income countries in 2017. Micronutrient Forum. Retrieved from http://micronutrientforum.org/content/user_files/2017/10/2017-09MNForum-LargeScaleFortification-FinalReport.pdf [DOI] [PMC free article] [PubMed]
- Department of Health, South Africa (2003) Regulations relating to the fortification of certain foodstuffs. (Government notice no. R504). Government Gazette, 2475, 7 Apr. Retrieved from http://faolex.fao.org
- Dewey, K. G. (2013). The challenge of meeting nutrient needs of infants and young children during the period of complementary feeding: An evolutionary perspective. Journal of Nutrition, 143, 2050–2064. [DOI] [PMC free article] [PubMed] [Google Scholar]
- Dewey, K. G. , & Adu‐Afarwuah, S. (2008). Systematic review of the efficacy and effectiveness of complementary feeding interventions in developing countries. Maternal and Child Nutrition, 4, 24–85. [DOI] [PMC free article] [PubMed] [Google Scholar]
- Dewey, K. G. , & Brown, K. H. (2003). Update on technical issues concerning complementary feeding of young children in developing countries and implications for intervention programs. Food and Nutrition Bulletin, 24, 5–28. [DOI] [PubMed] [Google Scholar]
- Dewey, K. G. , & Vitta, B. S. (2013). Strategies for ensuring adequate nutrient intake for infants and young children during the period of complementary feeding. A&T Technical Brief, Issue 7. Retrieved from http://www.aliveandthrive.org/sites/default/files/Insight%20Issue%207_Ensuring%20Adequate%20Nutrition.pdf
- Dunford, E. , Louie, J. C. , Byrne, R. , Walker, K. Z. , & Flood, V. M. (2015). The nutritional profile of baby and toddler food products sold in Australian supermarkets. Maternal and Child Health Journal, 19, 2598–2604. [DOI] [PubMed] [Google Scholar]
- Faber, M. (2005). Complementary foods consumed by 6–12‐month‐old rural infants in South Africa are inadequate in micronutrients. Public Health Nutrition, 8, 373–381. [DOI] [PubMed] [Google Scholar]
- Faber, M. , Laubscher, R. , & Berti, C. (2016). Poor dietary diversity and low nutrient density of the complementary diet for 6‐ to 24‐month‐old children in urban and rural KwaZulu‐Natal, South Africa. Maternal and Child Nutrition, 12, 528–545. [DOI] [PMC free article] [PubMed] [Google Scholar]
- Faber, M. , van Jaarsveld, P. J. , Kunneke, E. , Kruger, H. S. , Schoeman, S. E. , & van Stuijvenberg, M. E. (2015). Vitamin A and anthropometric status of South African preschool children from four areas with known distinct eating patterns. Nutrition, 31, 64–71. [DOI] [PubMed] [Google Scholar]
- Fahmida, U. , & Santika, O. (2016). Development of complementary feeding recommendations for 12–23‐month‐old children from low and middle socio‐economic status in West Java, Indonesia: Contribution of fortified foods towards meeting the nutrient requirement. British Journal of Nutrition, 116(S1), S8–S15. [DOI] [PubMed] [Google Scholar]
- Feeley, A. B. , Ndeye Coly, A. , Sy Gueye, N. Y. , Diop, E. I. , Pries, A. M. , Champeny, M. , … Huffman, S. L. (2016). Promotion and consumption of commercially produced foods among children: Situation analysis in an urban setting in Senegal. Maternal and Child Nutrition, 12(Suppl 2), 64–67. [DOI] [PMC free article] [PubMed] [Google Scholar]
- Fein, S. B. , Labiner‐Wolfe, J. , Scanlon, K. S. , & Grummer‐Strawn, L. (2008). Selected complementary feeding practices and association with maternal education. Pediatrics, 122, S91–S97. [DOI] [PubMed] [Google Scholar]
- Fotorek, K. , Hibig, A. , & Alexy, U. (2014). Breast‐feeding and weaning practices in the DONALD study: Age and time trends. Journal of Pediatric Gastroenterology and Nutrition, 58, 361–367. [DOI] [PubMed] [Google Scholar]
- Glinz, D. , Wegmuller, R. , Ouattara, M. , Diakite, V. G. , Aaron, G. J. , Hofer, L. , … Hurrel, R. F. (2017). Iron fortified complementary foods containing a mixture of sodium iron EDTA with either ferrous fumarate or ferric pyrophosphate reduce iron deficiency anemia in 12‐ to 36‐month‐old children in a malaria endemic setting: A secondary analysis of a cluster‐randomized controlled trial. Nutrients, 9, 759–774. [DOI] [PMC free article] [PubMed] [Google Scholar]
- Global Panel on Agriculture and Food Systems for Nutrition (2017). Urban diets and nutrition: Trends, challenges and opportunities for policy action. Policy Brief No. 9. Global Panel on Agriculture and Food Systems for Nutrition: London, UK. Retrieved from https://glopan.org/sites/default/files/Downloads/GlobalPanelUrbanizationPolicyBrief.pdf
- Hauta‐alus, H. H. , Korkalo, L. , Holmlund‐Suila, E. M. , Rosendahl, J. , Valkama, S. M. , Enlund‐Cerullo, M. , … Viljakainen, H. T. (2017). Food and nutrient intake and nutrient sources in 1‐year‐old infants in Finland: A cross‐sectional analysis. Nutrients, 9, 1309 10.3390/nu9121309 [DOI] [PMC free article] [PubMed] [Google Scholar]
- Hlaing, L. M. , Fahmida, U. , Htet, M. K. , Utomo, B. , Firmansyah, A. , & Ferguson, E. L. (2016). Local food‐based complementary feeding recommendations developed by the linear programming approach to improve the intake of problem nutrients among 12–23‐month‐old Myanmar children. British Journal of Nutrition, 116(S1), S16–S26. [DOI] [PubMed] [Google Scholar]
- Hoogendoorn, A. , Luthringer, C. , Parvanta, I. , & Garret, G. S. (2016). Food fortification global mapping study 2016. Landell Mills and Global Alliance for International Nutrition. Retrieved from https://ec.europa.eu/europeaid/food-fortification-global-mapping-study-2016_en (accessed 17 February 2018).
- Institute of Medicine (1998). Dietary reference intakes for thiamin, riboflavin, niacin, vitamin B6, folate, vitamin B12, pantothenic acid, biotin, and choline. Institute of Medicine: Washington, DC: The National Academies Press; Retrieved from https://www.nap.edu/search/?term=DRI [PubMed] [Google Scholar]
- Institute of Medicine (2000). Dietary reference intakes for vitamin C, vitamin E, selenium, and carotenoids. Institute of Medicine: Washington, DC: The National Academies Press; Retrieved from https://www.nap.edu/search/?term=DRI [PubMed] [Google Scholar]
- Institute of Medicine (2001). Dietary reference intakes for vitamin A, vitamin K, arsenic, boron, chromium, copper, iodine, iron, manganese, molybdenum, nickel, silicon, vanadium, and zinc. Institute of Medicine: Washington, DC: The National Academies Press; Retrieved from https://www.nap.edu/search/?term=DRI [PubMed] [Google Scholar]
- Institute of Medicine (2005). Dietary reference intakes for energy, carbohydrate, fiber, fat, fatty acids, cholesterol, protein and amino acids (macronutrients). Institute of Medicine: Washington, DC: The National Academies Press; Retrieved from https://www.nap.edu/search/?term=DRI [Google Scholar]
- Institute of Medicine (2011). Dietary reference intakes for calcium and vitamin D. Institute of Medicine: Washington, DC: The National Academies Press; Retrieved from https://www.nap.edu/search/?term=DRI [PubMed] [Google Scholar]
- Katepa‐Bwalya, M. , Mukonka, V. , Kankasa, C. , Masaninga, F. , Babaniyi, O. , & Siziya, S. (2015). Infants and young children feeding practices and nutritional status in two districts of Zambia. International Breastfeeding Journal, 10, 5. [DOI] [PMC free article] [PubMed] [Google Scholar]
- Kimmons, J. E. , Dewey, K. G. , Haque, E. , Chakraborty, J. , Osendarp, S. J. M. , & Brown, K. H. (2005). Low nutrient intakes among infants in rural Bangladesh are attributable to low intake and micronutrient density of complementary foods. Journal of Nutrition, 135, 444–451. [DOI] [PubMed] [Google Scholar]
- Kruger, J. (2016). Replacing electrolytic iron in a fortification‐mix with NaFeEDTA increases both iron and zinc availabilities in traditional African maize porridges. Food Chemistry, 205, 9–13. [DOI] [PubMed] [Google Scholar]
- Langenhoven, M. I. , Conradie, P. J. , Wolmarans, P. , & Faber, M. (1991). MRC food quantities manual, 1991 (2nd ed.). Parow: South African Medical Research Council. [Google Scholar]
- Leyvraz, M. , David‐Kigaru, D. M. , Macharia‐Mutie, C. , Aaron, G. J. , Roefs, M. , & Tumilowicz, A. (2018). Coverage and consumption of micronutrient powders, fortified staples, and iodized salt among children aged 6 to 23 months in selected neighborhoods of Nairobi County, Kenya. Food and Nutrition Bulletin, 39, 107–115. [DOI] [PubMed] [Google Scholar]
- Maslin, K. , & Venter, C. (2017). Nutritional aspects of commercially prepared infant foods in developed countries: A narrative review. Nutrition Research Reviews, 30, 138–148. [DOI] [PubMed] [Google Scholar]
- Murphy, S. P. , Guenther, P. M. , & Kretsch, M. J. (2006). Using the dietary reference intakes to assess intakes of groups: Pitfalls to avoid. Journal of the American Dietetic Association, 106, 1550–1553. [DOI] [PubMed] [Google Scholar]
- Ntila, S. , Siwela, M. , Kolanisi, U. , Abdelgadir, H. , & Ndhlala, A. (2017). An assessment of the food and nutrition security status of weaned 7–12 months old children in rural and peri‐urban communities of Gauteng and Limpopo provinces, South Africa. International Journal of Environmental Research and Public Health, 14, 1004. [DOI] [PMC free article] [PubMed] [Google Scholar]
- Osendarp, S. J. , Broersen, B. , van Liere, M. J. , De‐Regil, L. M. , Bahirathan, L. , Klassen, E. , & Neufeld, L. M. (2016). Complementary feeding diets made of local foods can be optimized, but additional interventions will be needed to meet iron and zinc requirements in 6‐ to 23‐month‐old children in low‐ and middle‐income countries. Food and Nutrition Bulletin, 37, 544–570. [DOI] [PubMed] [Google Scholar]
- Padilha, L. L. , França, A. K. T.d. C. , da Conceição, S. I. O. , Carvalho, W. R. C. , Batalha, M. A. , & da Silva, A. A. M. (2017). Nutrient intake variability and the number of days needed to estimate usual intake in children aged 13–23 months. British Journal of Nutrition, 117, 287–294. [DOI] [PubMed] [Google Scholar]
- Pretorius, B. , & Schönfeldt, H. C. (2012). Vitamin A content of fortified maize meal and porridge as purchased and consumed in South Africa. Food Research International, 47, 128–133. [Google Scholar]
- Pries, A. M. , Huffman, S. L. , Adhikary, I. , Upreti, S. R. , Dhungel, S. , Champeny, M. , & Zehner, E. (2016). High consumption of commercial food products among children less than 24 months of age and product promotion in Kathmandu Valley, Nepal. Maternal and Child Nutrition, 12(Suppl 2), 22–37. [DOI] [PMC free article] [PubMed] [Google Scholar]
- Pries, A. M. , Huffman, S. L. , Mengkheang, K. , Kroeun, H. , Champeny, M. , Roberts, M. , & Zehner, E. (2016). High use of commercial food products among infants and young children and promotions for these products in Cambodia. Maternal and Child Nutrition, 12(Suppl 2), 52–63. [DOI] [PMC free article] [PubMed] [Google Scholar]
- Quintaes, K. D. , Barbera, R. , & Cilla, A. (2017). Iron bioavailability in iron‐fortified cereal foods: The contribution of in vitro studies. Critical Reviews in Food Science and Nutrition, 57, 2028–2041. [DOI] [PubMed] [Google Scholar]
- Shisana, O. , Labadarios, D. , Rehle, T. , Simbayi, L. , Zuma, K. , Dhansay, A. , … SANHANES‐1 Team (2013). South African National Health and Nutrition Examination Survey (SANHANES‐1). Data analysis on infant feeding practices, and anthropometry in children under five years of age: South Africa 2012. Cape Town: HSRC Press. [Google Scholar]
- Steyn, N. P. , Nel, J. , & Labadarios, D. (2008). Will fortification of staple foods make a difference to the dietary intake of South African children? South African Journal of Clinical Nutrition, 21, 22–26. [Google Scholar]
- Van Graan, A. , Chetty, J. , & Links, M. R. (2016). Adapting FAO/INFOODS guidelines into a customised checklist for quality assurance of baby food composition data prior to publication. South African Journal of Clinical Nutrition, 29, 24. [Google Scholar]
- Van Jaarsveld, P. J. , Faber, M. , & van Stuijvenberg, M. E. (2015). Vitamin A, iron, and zinc content of fortified maize meal and bread at the household level in 4 areas of South Africa. Food and Nutrition Bulletin, 36, 315–326. [DOI] [PubMed] [Google Scholar]
- Van Stuijvenberg, M. E. , Nel, J. , Schoeman, S. E. , Lombard, C. J. , du Plessis, L. M. , & Dhansay, M. A. (2015). Low intake of calcium and vitamin D, but not zinc, iron or vitamin A, is associated with stunting in 2‐ to 5‐year‐old children. Nutrition, 31, 841–846. [DOI] [PubMed] [Google Scholar]
- Vossenaar, M. , Hernández, L. , Campos, R. , & Solomons, N. W. (2013). Several ‘problem nutrients’ are identified in complementary feeding of Guatemalan infants with continued breastfeeding using the concept of ‘critical nutrient density’. European Journal of Clinical Nutrition, 67, 108–114. [DOI] [PubMed] [Google Scholar]
- Vossenaar, M. , & Solomons, N. W. (2012). The concept of “critical nutrient density” in complementary feeding: The demands on the “family foods” for the nutrient adequacy of young Guatemalan children with continued breastfeeding. American Journal of Clinical Nutrition, 95, 859–866. [DOI] [PubMed] [Google Scholar]
- Wolmarans, P. , Danster, N. , Dalton, A. , Rossouw, K. , & Schönfeldt, H. (2010). Condensed food composition tables for South Africa. Cape Town: Medical Research Council. [Google Scholar]
- World Health Organization (1998). Complementary feeding of young children in developing countries: A review of current scientific knowledge. WHO/NUT/98.1. Geneva: World Health Organization. [Google Scholar]
- Yusufali, R. , Sunley, N. , de Hoop, M. , & Panagides, D. (2012). Flour fortification in South Africa: Post implementation survey of micronutrient levels at point of retail. Food and Nutrition Bulletin, 33(4 Suppl), S321–S329. [DOI] [PubMed] [Google Scholar]