

Abstract
Poor infant and young child feeding (IYCF) practices are associated with linear growth faltering. Our objective was to evaluate the impact of a nutrition and water and sanitation for health intervention on three IYCF indicators—minimum dietary diversity (MDD), minimum meal frequency (MMF), and minimum acceptable diet (MAD) in Kenyan children. Households were randomized into one of eight groups: (a) active control; (b) passive control; (c) water quality (W); (d) sanitation (S); (e) handwashing (H); (f) combined Water, Sanitation, and Handwashing; (g) nutrition (N); and (h) combined WSH + N. In the N and WSH + N arms, community‐based promoters counselled households on optimal IYCF practices, and small‐quantity lipid‐based nutrient supplements (SQ‐LNS) were provided to children 6–24 months of age. Twelve months (Year 1) and 24 months (Year 2) after interventions began, enumerators surveyed mothers to ascertain IYCF practices. We made pairwise comparisons of each intervention arm versus the active control arm using log binomial models. In total, 3,652 caretakers were surveyed at Year 1 and 4,987 caretakers at Year 2. Compared with the active control, there were no differences in any of the arms in MDD, MMF, or MAD, aside from an increase in MDD at Year 1 in the nutrition only arm but not in the combined WSH + N arm (N: 68%; WSH + N: 61%; C: 61%; N arm prevalence ratio: 1.13 95% CI [1.01, 1.25]). In this setting, a nutrition behaviour change communication intervention had little impact on IYCF indicators. The provision of SQ‐LNS was not detrimental to current IYCF indicators in the community.
Keywords: behaviour change communication (BCC), child feeding, cluster‐randomized trial, complementary foods, infant and young child feeding (IYCF) indicators, Kenya, lipid‐based nutrient supplement
Key messages.
The behaviour change communication nutrition intervention had a minimal impact on increasing the proportion of children who met the complementary feeding indicators.
The provision of small‐quantity lipid‐based nutrient supplements did not reduce the proportion of children meeting the complementary feeding indicators.
To encourage behaviour changes regarding complementary feeding, the contacts between the community health promoter and the families may need to be at a greater frequency than one time per month.
Abbreviations
- BCC
behaviour change communication
- CF
complementary feeding practices
- IYCF
infant and young child feeding
- LAZ
length‐for‐age z‐score
- MAD
minimum acceptable diet
- MDD
minimum dietary diversity
- MMF
minimum meal frequency
- MNP
micronutrient powders
- SQ‐LNS
small‐quantity lipid‐based nutrient supplement
- WSH
water, sanitation, and handwashing
1. INTRODUCTION
Though the prevalence of undernutrition worldwide is decreasing, an estimated 155 million children were stunted as of 2016, and 38% of these children live in Africa (Joint child malnutrition estimates—Levels and trends, 2017). In Kenya, stunting impacts 26% of children under five and 36% of children aged 18–23 months (Kenya Demographic and Health Survey, 2014). Improvements in infant and young child feeding (IYCF) practices and reductions in infection are key strategies to decreasing the prevalence of stunting. IYCF recommendations and methods for measurement have been proposed by the World Health Organization (WHO) to guide programmes and policies in low‐income countries to monitor and improve feeding practices (WHO, 2003, 2008, 2010; WHO/PAHO, 2001). The WHO's IYCF recommendations include guidance on exclusive breastfeeding, continued breastfeeding, the timely introduction of safe and nourishing complementary foods, dietary diversity, and feeding frequency.
However, in resource‐constrained settings, behaviour modification usually cannot address all the dietary inadequacies. A study conducted in western Kenya found that in children, adequate intake of vitamins and most minerals could be achieved through caretaker behaviour modification focusing on increasing consumption of locally available foods, though for calcium, iron, and zinc, adequacy would be achievable only through fortification or supplementation (Ferguson, Chege, Kimiywe, Wiesmann, & Hotz, 2016). The authors point out, however, that it would be challenging for those living in poverty to afford to feed children the amounts required to achieve nutrient adequacy for even those nutrients which might be available through the local food supply. Point‐of‐use home fortification methods, such as micronutrient powders and small‐quantity lipid‐based nutrient supplements (SQ‐LNS), have the potential to fill in the nutrient gaps (Adu‐Afarwuah & Dewey, 2008). SQ‐LNS is also under investigation as a potential intervention to prevent stunting (Adu‐Afarwuah et al., 2016; Dewey et al., 2017; Hess et al., 2014).
Behaviour change communication (BCC) interventions focused on improving complementary feeding practices have been effective in increasing dietary quality for infants and children in developing countries (Fabrizio, van Liere, & Pelto, 2014; Hotz & Gibson, 2005; Kapur, Sharma, & Agarwal, 2003; Penny et al., 2005; Roy et al., 2005; Sanghvi, Seidel, Baker, & Jimerson, 2017). Less is known about the impact of BCC interventions on IYCF practices when nutrient supplements are also given. Several trials have demonstrated that nutrient supplements do not displace breastmilk (Kumwenda et al., 2013) or foods from the diet (Arimond et al., 2017; Flax, Siega‐Riz, Reinhart, & Bentley, 2015; Mirkovic et al., 2016), even though most of these trials did not have an extensive BCC component. However, only one trial reported on IYCF indicators (Arimond et al., 2017), whereas the others reported on nutrient intake alone. More evidence is needed on the impact of an extensive BCC intervention on IYCF indicators, within the context of providing a nutrient supplement such as SQ‐LNS. Furthermore, there is also limited evidence on the effectiveness of IYCF messages when delivered in the context of an integrated intervention package, such as with concurrent water and sanitation for health (WASH) messages.
To investigate the impact of the interventions, we conducted a cluster‐randomized, controlled trial in western Kenya evaluating the independent and combined impacts of water (W), sanitation (S), handwashing (H), and nutrition (N) interventions on child growth and development. We have found that there were improvements in child length‐for‐age z‐scores (LAZ) in the two groups that received the nutrition intervention package, which included the provision of SQ‐LNS in addition to the BCC component of maternal, infant, and young child nutrition counselling. There were no significant improvements in LAZ in the W, S, H, or the combined WSH group (Null et al., 2018).
Therefore, the primary objective of this study was to examine the impact of the interventions on minimum dietary diversity (MDD), minimum meal frequency (MMF), and a composite of the two—minimum acceptable diet (MAD) from non‐SQ‐LNS foods. Our secondary objective was to explore whether the nutrition intervention package was associated with improvements in reported intakes of iron, zinc, calcium, and riboflavin from nonbreastmilk foods and fluids, investigating the diet both with the inclusion and exclusion of SQ‐LNS.
2. METHODS
2.1. Study overview and participants
This study was nested within the WASH Benefits trial, details of which are published elsewhere (Arnold et al., 2013; Null et al., 2018). Conducted in rural, western Kenya, the trial was partially masked, controlled, and cluster‐randomized, with primary outcomes of LAZ at 24 months and diarrhoea prevalence from pooled data at Year 1 and Year 2. The study began with the roll‐out of the interventions to the enrolled households in September 2012 to 10 districts within Bungoma, Kakamega, and Vihiga counties. These counties are rural, and most of the population consists of farmers. The main subsistence and cash crops are maize and sugar cane, respectively. Christianity is the most commonly practised religion.
Villages were eligible for selection into the study if they were rural, relied on communal water sources, had unimproved sanitation facilities, and there were no other ongoing WSH or nutrition programmes. Within selected villages, women were eligible to participate if they reported that they were in their second or third trimester of pregnancy, planned to continue to live at their current residence for the next 2 years, and could speak Kiswahili, Luhya, or English. Participants were identified through a complete census of eligible villages. The fetus which was in utero during the census became the index child and was followed for ~2 years.
Clusters were defined as one to two villages with a minimum of six women per cluster. After enrolment, groups of nine adjacent clusters were block‐randomized into one of eight arms: (a) active control (double‐sized); (b) passive control; (c) improved water quality (W); (d) improved sanitation (S); (e) improved handwashing (H); (f) combined WSH; (g) improved nutrition (N); and (h) combined WSH + N. The active control arm received monthly visits from a community‐based promoter who measured either the mother's abdomen or child's arm circumference, whereas the passive control group received no such visits. A statistician at the University of California, Berkeley, generated a random sequence which block‐randomized each cluster to an intervention arm. All data analysis was done by masked statisticians; however, the study staff in Kenya were aware of which intervention arms were assigned to each household and participants were informed of their intervention group assignment.
2.2. Interventions
For each intervention arm, a series of BCC messages adapted for the local culture were developed. All intervention messages were tested and adapted to the local culture during the pilot phase of the study, details of which are provided elsewhere (Christensen et al., 2015). Training materials and visit scripts were developing during the pilot phases and are available at https://osf.io/fs23x. Community‐based promoters were trained by study staff on the messages to be delivered to the families. A detailed description of recruitment and training has been described previously (Null et al., 2018). In brief, the initial BCC training sessions for the promoters lasted 6 days for the single intervention groups and 7 days for the combined intervention groups. Re‐trainings were conducted at 6, 12, and 18 months. Promoters used visual aids, songs, and pledges to engage not only the primary caretaker but also the father and any older children living in the compound. The promoters carried with them a set of frequently asked questions designed to help answer common questions and address barriers. In addition to the technical information provided to the promoters, key behavioural constructs such as aspiration, nurture, and self‐efficacy underpinned the messages. The promoters were instructed to visit the families monthly in all arms except for the passive control arm. Visits were planned to last approximately 45–65 min in intervention arms. Study staff held monthly calls with the promoters to collect information on their activities and to provide support. The active control arm did not have a BCC component, but promoters were trained for 2 days on how to conduct monthly household visits. The visits were planned to last ~10 min, and the promoters were instructed to measure either the pregnant mother's abdominal circumference or the child's arm circumference.
The nutrition BCC messages were based on UNICEF/WHO best practices for IYCF (WHO, 2003; WHO/PAHO, 2001). During the formative phase, the messages and content of the BCC intervention were carefully developed to ensure that visual aids, songs, pledges, and other engagement materials were tailored to the study participants' cultural norms. For example, we used images that were representative of the study populations and their villages and developed songs based on existing cultural references. Each session in the nutrition arms had messages timed to the age of the child and included information about early initiation of breastfeeding, exclusive breastfeeding from 0 to 6 months, continued breastfeeding through 24 months, when to introduce complementary foods, dietary diversity, how often to offer complementary foods based on the child's age, and feeding during illness.
In addition to the BCC and counselling component of each intervention arm, households were provided with materials (hardware) specific to the intervention arm. Households randomized to the one of water (W) arms were provided with chlorine dispensers at the point of collection, and every 6 months were given a 1‐L bottle for point‐of‐use water treatment; in the sanitation (S) arms, households were provided with tools to clean up children's faeces in the compound, child potties, and were given pit latrines or pit latrine upgrades, as needed; households in the handwashing (H) arms were given handwashing stations and soap near the kitchen and latrine; and in the nutrition (N) arms, children 6–24 months were given a daily dose of two 10‐g SQ‐LNS (Nutriset, Malaunay, France). SQ‐LNS is a semisolid paste made of peanuts, vegetable oil, sugar, and milk powder, with added micronutrients targeted to meet the needs of children aged 6–24 months (Table SS1). The promoter advised the caretakers to give 10 g of SQ‐LNS (one packet) mixed into the child's complementary food twice per day after the child had reached 6 months of age. Each household was given a small, pest‐proof plastic container for storing the SQ‐LNS, with a sticker on the container to serve as a reminder. Additional SQ‐LNS was also provided for other children in the household who were between the ages of 6–24 months during the time the target child received SQ‐LNS to reduce sharing among children in the household.
2.3. Procedures
Data collection for the WASH Benefits trial occurred at three time points: baseline (enrolment), Year 1 (~12 months after intervention delivery began), and Year 2 (~24 months after intervention delivery began). Household interviews were conducted at all three time points with the primary caretaker; however, questions regarding household and demographic characteristics were only asked at baseline. Household food insecurity was assessed using the Household Hunger Scale (Ballard, Coates, Swindale, & Deitchler, 2011).
At the Year 1 and Year 2 visits, an IYCF survey was administered to each respondent, in all arms except the passive control arm. Given that the study objectives were to measure the impact of the intervention after 2 years, uptake of IYCF practices was assessed in 50% of the sample at Year 1. Families were randomly selected by treatment arm for inclusion in the Year 1 survey activities. At Year 2, we attempted to follow up with all households recruited at baseline to administer the IYCF survey.
An in‐home, detailed, quantitative 24‐hr recall survey of foods consumed by a smaller subset of 185 total participants from four intervention arms (WSH, N, WSH + N, and control) was carried out by study enumerators during the Year 1 follow‐up. Procedures were based on a 24‐hr recall carried out with the mothers earlier in the study (Williams et al., 2016). The recalls were conducted in the participants' homes using the utensils, cups, and plates with which the child had been fed the previous day, picture cards, measuring cups, and spoons. A visual aid also guided the enumerator in estimating portion sizes. The four‐pass interview method was programmed into data collection tablets, which guided the enumerator through the four steps of the 24‐hr recall: recalling the food and drinks consumed, probing for detail about each food or drink, estimating portion size, and reviewing the list (Gibson & Ferguson, 2008). Standard recipes of common dishes were collected prior to beginning the 24‐hr recalls and were preprogrammed into the tablets, along with commonly consumed foods in the region. Recipes could be modified by using the tablet to add or subtract ingredients from the standard recipe.
Energy and nutrient intakes were calculated by linking dietary intakes with the WorldFood Dietary Assessment database (FAO), a Harvest Plus technical monograph (Hotz, Abdelrahman, Sison, Moursi, & Loechl, 2012), and the USDA database (USDA, n.d.). We calculated the estimated daily intakes of energy, iron, zinc, calcium, riboflavin, and phytates from complementary foods. Nutrient densities were calculated based on nutrients per 100 kcal and were compared with the desired nutrient densities for infants and children, as described previously (Dewey & Brown, 2003).
2.4. Outcomes
The IYCF indicators we report in this paper are MDD, MMF, and MAD (WHO, 2008). The consumption of the SQ‐LNS was not included in the calculation of these indicators, as we wanted to determine the effect of the intervention on the child's diet of locally available foods. MDD is defined as consuming at least four out of seven key food groups during the previous day—grains or tubers; legumes or nuts; dairy products; animal flesh foods including insects; eggs; Vitamin A‐rich fruits and vegetables; and other fruits and vegetables. MMF is defined as two feeds per day of complementary foods for children ages 6–8 months and three feeds for children aged 9–23 months. MAD is defined by reaching both the MMD and the MMF in breastfeeding children; nonbreastfeeding children have an additional requirement of at least two milk feeds per day. The primary outcomes of interest included the proportion of index children who (a) met the WHO criterion for MDD, (b) met the WHO criterion for MMF, and (c) met the WHO criteria for MAD. The outcomes are reported separately for children who were breastfeeding and those who were not at both Year 1 and Year 2. Secondary outcomes were the estimated daily intakes of energy and the estimated daily intakes and nutrient densities of iron, zinc, calcium, and riboflavin. Energy and micronutrient intakes were analysed looking at the diet both with and without the contribution of nutrients from SQ‐LNS. Based on recent evidence that micronutrients needs are more likely to be met if cow's milk, fortified cereals, green leafy vegetables, legumes, meat, fish, or eggs are consumed three to five times per week (Ferguson et al., 2016), we also investigated which food groups were consumed in four out of 7 days of dietary recall.
2.5. Sample size
The sample size of the main trial was based on the two primary outcomes of LAZ and diarrhoeal prevalence (Arnold et al., 2013). A sample size of 2,000 children for the active control arm and 1,000 per each of the other arms for a total of 8,000 participants in 800 clusters was determined to detect an effect size of 0.15 standard deviation in LAZ, accounting for a 10% loss to follow‐up. For logistical reasons, only half of the participants were surveyed at Year 1 to assess uptake and adherence, which included the IYCF survey. For this analysis, we calculated the minimum detectable differences in the IYCF indicators assuming a stratification on breastfeeding status. We estimated that 88% of children would still be breastfeeding at Year 1, compared with 61% of children at Year 2 (Kenya Demographic and Health Survey, 2014). We also assumed a prevalence of 41.1% for MDD, 23.4% for MMF, and 9.1% for MAD in nonbreastfed children, based on previously reported data in western Kenya (Kenya Demographic and Health Survey, 2014). Therefore, we calculated the minimum detectable differences based on 39% of the total sample size calculated for the main trial, which is the sample of nonbreastfeeding children at Year 2. Based on these assumptions, we estimated that we would be able to detect a minimum difference of 10.1% in the prevalence of achieving MDD, 8.6% in achieving MMF, and 6.3% in achieving MAD in the subsample of nonbreastfed children at Year 2, with a significance level of 0.05 and power of 0.80.
The sample size estimates for the subset with 24‐hr recalls were based on the number of children in each group needed to detect a difference (with a significance level of 0.05 and power of 0.80) of 1 mg of iron intake, assuming a standard deviation of 1.7 (Ndiku, Jaceldo‐Siegl, & Sabate, 2010). This is consistent with the magnitude of the difference found in previous studies (Hotz & Gibson, 2005). The target sample size per group was 74 children, to compare children in the two nutrition groups combined (N and WSH + N) to the nonnutrition groups combined (WSH and C). Children were randomly sampled equally from each of the four intervention arms.
2.6. Statistical analyses
Data were analysed using R (version 3.3.1) and Stata (v. 14, StataCorp, College Station, TX). All analyses were performed using the treatment arm assignment as randomized. For the purposes of this analysis, we have restricted comparisons to children aged at least 6 months old at the time of the visit but did not exclude children over 23 months. Because of their skewed distributions, daily intakes of iron, zinc, and riboflavin were square root transformed and calcium intake was log‐transformed prior to analysis. For the 24‐hr recall data analysis, we collapsed the four groups from which this subsample was drawn (C, WSH, N, and WSH + N) into two groups as prespecified in the analysis plan, and results are presented between the nutrition and nonnutrition arms (N and WSH + N vs. C and WSH).
For the young child feeding indicators (MDD, MMF, and MAD), we calculated the prevalence ratio between intervention arms and control arms with generalized linear models using a binomial distribution with a log link, with robust standard errors clustered at the study block level. Our primary endpoints were the unadjusted between‐group differences in these parameters. In exploratory analyses, we investigated differences in food group intakes by treatment arm using the same model. We estimated the mean difference in intake of each of the micronutrients between the nutrition and nonnutrition groups using generalized linear models, with robust standard errors clustered at the study block level.
In secondary analyses, models were additionally adjusted for prespecified baseline covariates that were potentially associated with the outcomes: age, sex, birth order, maternal age, maternal height, maternal education level, household hunger score category, number of children <18 years in the household, number of individuals living in the compound, distance to the primary water source, housing materials, household assets, animal ownership, and season.
2.7. Ethics
Ethical approval for the study protocol and consent procedure was provided by the Institutional Review Boards of the Kenya Medical Research Institute (protocol number SSC‐2271) and by the University of California, Berkeley (protocol number 2011‐09‐3654). This trial was registered at http://clinicaltrials.gov (NCT01704105). Innovations for Poverty Action implemented the intervention delivery and collected the data. Mothers provided written informed consent for themselves and their children at each data collection encounter.
3. RESULTS
Data collection occurred from October 2012 to July 2016. At baseline, a total of 702 clusters with 8,246 pregnant women were enrolled and randomized into one of eight intervention arms (Figure 1). At Year 1, 3,652 caretakers were surveyed on complementary feeding practices, and at Year 2, 4,987 caretakers were surveyed. 24‐hr recall surveys were conducted among 185 participants at Year 1 from four intervention arms (WSH, N, N + WSH, and C). Household and maternal baseline characteristics were balanced across all intervention arms (Table 1). At enrolment, the mothers were 26 years old on average, and nearly half had at least a primary education. Seventy‐six percent of the women were multiparous at enrolment. Eleven percent of households reported moderate to severe hunger. At the Year 1 visit, the children were 12 months old on average, ranging from 6 to 17.5 months; and at the Year 2 visit, the children were 24 months old, ranging from 15 to 30 months.
Figure 1.
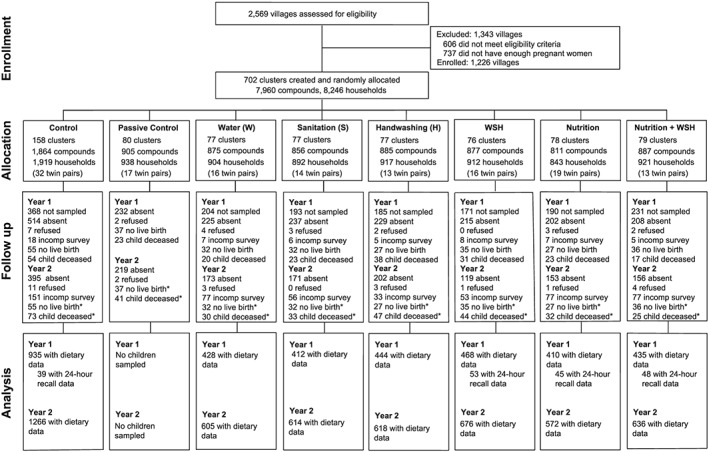
Participant flow diagram
Table 1.
Participant characteristics
| Control | Water (W) | Sanitation (S) | Handwashing (H) | WSH | Nutrition (N) | WSH + N | |
|---|---|---|---|---|---|---|---|
| Maternal characteristics at baseline | |||||||
| N | 1,919 | 904 | 892 | 917 | 912 | 843 | 921 |
| Age (y), mean ± SD | 26 ± 6 | 26 ± 6 | 26 ± 7 | 26 ± 6 | 26 ± 6 | 26 ± 6 | 26 ± 6 |
| At least primary education (%) | 47.8 | 49.5 | 48.2 | 43.9 | 47.1 | 48.5 | 47.7 |
| Multiparous (%) | 74.4 | 77.3 | 75.1 | 77.3 | 79.1 | 75.6 | 75.5 |
| Household characteristics at baseline | |||||||
| Moderate or severe hunger (%) | 10.6 | 11.8 | 10.2 | 10.1 | 11.1 | 11.6 | 11.3 |
| Number of persons, mean ± SD | 5.1 ± 2.4 | 5.1 ± 2.3 | 5.0 ± 2.3 | 5.0 ± 2.3 | 5.0 ± 2.3 | 5.1 ± 2.4 | 5.2 ± 2.4 |
| Child characteristics at year one follow‐up | |||||||
| N of subsample for IYCF outcomes | 1,246 | 594 | 607 | 610 | 567 | 563 | 626 |
| Male (%) | 48.6 | 47.2 | 48.0 | 47.9 | 47.9 | 54.6 | 47.4 |
| Age, months, mean ± SD | 11.9 ± 1.9 | 11.7 ± 2.0 | 11.9 ± 1.9 | 11.9 ± 1.9 | 11.9 ± 1.9 | 12.0 ± 1.9 | 11.8 ± 1.8 |
| Breastfeeding (%) | 93.6 | 96.7 | 94.1 | 94.7 | 94.1 | 94.5 | 95.1 |
| Child characteristics at 24‐hr recall follow‐up | |||||||
| N of subsample for 24‐hr recall | 39 | ‐‐ | ‐‐ | ‐‐ | 53 | 45 | 48 |
| Male (%) | 46.1 | ‐‐ | ‐‐ | ‐‐ | 45.2 | 53.3 | 45.8 |
| Age, months, mean ± SD | 15.1 ± 1.7 | ‐‐ | ‐‐ | ‐‐ | 15.7 ± 1.8 | 15.6 ± 1.8 | 15.0 ± 2.3 |
| Child characteristics at year two follow‐up | |||||||
| N | 1266 | 605 | 614 | 618 | 676 | 572 | 636 |
| Male (%) | 49.4 | 48.7 | 48.1 | 48.2 | 47.8 | 53.5 | 47.6 |
| Age, months, mean ± SD | 24 ± 2 | 24 ± 2 | 24 ± 2 | 24 ± 2 | 24 ± 2 | 24 ± 2 | 24 ± 2 |
| Breastfeeding (%) | 35.7 | 37.6 | 33.4 | 35.5 | 35.7 | 37.2 | 37.5 |
Note. SD: standard deviation.
3.1. Differences in young child feeding indicators
At the Year 1 follow‐up, 95% of children were breastfeeding; therefore, the outcomes are presented for breastfeeding children only. In the control arm, 61% of children met the MDD criteria, 71% achieved the MMF, and 47% reached the criteria for a MAD. A greater proportion of children in the nutrition‐only arm (N) met the MDD criteria (68%) compared with the control arm, though the increase was small and not present in the N + WSH arm (Table 2, N prevalence ratio: 1.13 95% CI [1.01–1.25]). A larger proportion of children in the N arm also met the criteria for MAD; however, this was a statistically marginal increase (Table 2, C: 47%; N: 54%; prevalence ratio: 1.17, 95% CI [0.99, 1.37]). There was no difference by arm in the proportion of children meeting the MMF. The children, who were provided with SQ‐LNS, in the nutrition arms were not less likely than the children in the control arms to meet the three indicators.
Table 2.
Prevalence ratios of young child feeding indicators at Year 1
|
Breastfeeding children |
Control | Water (W) | Sanitation (S) | Handwashing (H) | WSH | Nutrition (N) | WSH + N |
|---|---|---|---|---|---|---|---|
| N | 847 | 396 | 376 | 414 | 431 | 365 | 399 |
| Minimum dietary diversity | |||||||
| Prevalence | 61.0 | 59.2 | 56.2 | 58.1 | 62.0 | 67.7 | 61.0 |
| Prevalence ratio (95% CI) | 0.96 [0.85, 1.09] | 0.93 [0.84, 1.02] | 0.98 [0.87, 1.10] | 1.02 [0.91, 1.14] | 1.13 [1.01, 1.25] | 1.02 [0.92, 1.14] | |
| Minimum meal frequency | |||||||
| Prevalence | 71.1 | 74.9 | 73.9 | 76.1 | 73.3 | 74.7 | 74.6 |
| Prevalence ratio (95% CI) | 1.07 [0.95, 1.20] | 1.03 [0.92, 1.16] | 1.09 [0.97, 1.21] | 1.01 [0.90, 1.13] | 1.05 [0.95, 1.17] | 1.06 [0.95, 1.18] | |
| Minimum acceptable diet | |||||||
| Prevalence | 46.5 | 47.3 | 42.2 | 45.6 | 47.0 | 54.2 | 46.4 |
| Prevalence ratio (95% CI) | 1.03 [0.87, 1.21] | 0.91 [0.77, 1.08] | 1.01 [0.86, 1.20] | 0.99 [0.84, 1.18] | 1.17 [0.99, 1.37] | 1.03 [0.88, 1.20] | |
At Year 2, 36% of children were breastfeeding, so we report results stratified by breastfeeding status (Table 3). In the control arm, after 2 years of the intervention, 82% of children met the MDD, with 63% of breastfeeding children and 65% of nonbreastfeeding children achieving the MMF. In the control arm, there was a lower prevalence of children meeting the MAD among those who were nonbreastfeeding (9%) compared with those who were still breastfeeding (56%). There were no differences in the proportion of children meeting the MDD, MMF, or MAD criteria in any of the intervention arms at Year 2 among breastfed and nonbreastfed children. Similar to Year 1, at Year 2 the children, who were provided with SQ‐LNS, in the nutrition arms were not less likely than the children in the control arms to meet the three indicators. Adjusting for covariates at both year one and year two did not alter the findings; therefore, we only present the unadjusted estimates, as was pre‐specified in our analysis plan.
Table 3.
Prevalence ratios of infant and young child feeding (IYCF) indicators at Year 2
| Control | Water (W) | Sanitation (S) | Handwashing (H) | WSH | Nutrition (N) | WSH + N | |
|---|---|---|---|---|---|---|---|
| Breastfeeding children (N) | 435 | 220 | 196 | 216 | 200 | 201 | 229 |
| Minimum dietary diversity | |||||||
| Prevalence | 82.0 | 83.6 | 78.6 | 81.5 | 79.5 | 85.5 | 82.5 |
| Prevalence ratio (95% CI) | 1.01 [0.93, 1.09] | 0.93 [0.85, 1.03] | 1.01 [0.93, 1.09] | 0.97 [0.87, 1.08] | 1.05 [0.96, 1.13] | 1.02 [0.95, 1.09] | |
| Minimum meal frequency | |||||||
| Prevalence | 62.9 | 66.4 | 59.2 | 63.9 | 58.0 | 64.0 | 69.4 |
| Prevalence ratio (95%CI) | 1.02 [0.89, 1.17] | 0.86 [0.74, 1.00] | 1.05 [0.90, 1.24] | 0.88 [0.73, 1.05] | 0.96 [0.85, 1.09] | 1.09 [0.97, 1.22] | |
| Minimum acceptable diet | |||||||
| Prevalence | 56.0 | 61.8 | 51.0 | 56.5 | 52.5 | 59.0 | 59.4 |
| Prevalence ratio (95% CI) | 1.04 [0.90, 1.21] | 0.82 [0.68, 1.00] | 1.06 [0.88, 1.28] | 0.90 [0.73, 1.10] | 0.99 [0.86, 1.14] | 1.04 [0.90, 1.20] | |
| Nonbreastfeeding children (N) | 783 | 365 | 390 | 392 | 361 | 340 | 381 |
| Minimum dietary diversity | |||||||
| Prevalence | 82.2 | 85.6 | 84.6 | 85.9 | 83.9 | 86.7 | 84.3 |
| Prevalence ratio (95% CI) | 1.04 [0.99, 1.10] | 1.02 [0.97, 1.08] | 1.04 [0.98, 1.11] | 1.00 [0.94, 1.06] | 1.04 [0.98, 1.11] | 1.03 [0.96, 1.10] | |
| Minimum meal frequency | |||||||
| Prevalence | 65.1 | 65.8 | 66.6 | 60.9 | 64.8 | 68.4 | 68.2 |
| Prevalence ratio (95% CI) | 1.01 [0.92, 1.11] | 1.01 [0.93, 1.09] | 0.94 [0.86, 1.04] | 0.96 [0.87, 1.05] | 1.01 [0.92, 1.10] | 1.07 [0.99, 1.14] | |
| Minimum acceptable diet | |||||||
| Prevalence | 8.7 | 10.4 | 12.1 | 7.9 | 8.6 | 11.2 | 10.8 |
| Prevalence ratio (95% CI) | 1.10 [0.77, 1.57] | 1.29 [0.87, 1.90] | 1.11 [0.70, 1.76] | 0.99 [0.61, 1.58] | 1.27 [0.89, 1.81] | 1.24 [0.84, 1.81] | |
The consumption of food groups in the past 24 hr, reported by intervention arm, can be seen in Table 4. Grains were the most commonly consumed food group, with 98% consuming grains in the previous 24 hr across intervention arms but consumption was significantly higher in the H, N, and N + WSH arms as compared with the control. Dairy products, vitamin A‐rich fruits and vegetables, and other fruits and vegetables were also commonly consumed (74%, 63%, and 81%, respectively) across all arms; however, significantly more caretakers in the nutrition arm reported giving other fruits and vegetables. Eggs were consumed infrequently with 3% of children consuming them in the past 24 hr across intervention arms, and there were no differences in intakes across arms.
Table 4.
Percentages reporting consumption of food groups in the past 24 hr after 1 and 2 years of intervention
| Food groups consumed (%) | Control | Water (W) | Sanitation (S) | Handwashing (H) | WSH | Nutrition (N) | WSH + N |
|---|---|---|---|---|---|---|---|
| Year 1 | |||||||
| Grains | 96.9 | 97.6 | 96.8 | 98.6* | 96.5 | 99.5* | 99.2* |
| Legumes & nuts | 12.8 | 12.8 | 13.7 | 13.2 | 12.1 | 13.1 | 16.5 |
| Dairy foods and drinks | 76.4 | 72.6 | 73.9 | 72.1 | 75.2 | 76.9 | 69.8 |
| Flesh foods | 31.2 | 30.4 | 30.4 | 31.5 | 30.0 | 34.7 | 33.2 |
| Eggs | 2.6 | 2.9 | 1.8 | 2.3 | 2.2 | 2.8 | 4.1 |
| Vit. A‐rich fruits & vegetables | 62.2 | 58.5 | 58.9 | 61.6 | 68.7 | 66.3 | 63.7 |
| Other fruits & vegetables | 79.8 | 76.8 | 78.6 | 81.0 | 81.1 | 87.2* | 81.6 |
| Year 2 | |||||||
| Grains | 99.3 | 99.0 | 99.2 | 99.2 | 99.5 | 99.3 | 99.2 |
| Legumes & nuts | 32.6 | 31.3 | 34.2 | 32.7 | 31.6 | 31.6 | 35.3 |
| Dairy foods and drinks | 86.0 | 87.2 | 84.4 | 86.7 | 85.4 | 89.7 | 86.4 |
| Flesh foods | 39.4 | 39.6 | 40.6 | 43.0 | 37.4 | 45.3* | 43.0 |
| Eggs | 3.8 | 5.9* | 5.0 | 3.5 | 4.6 | 5.7 | 3.7 |
| Vit. A‐rich fruits & vegetables | 73.0 | 74.3 | 73.6 | 71.1 | 77.4 | 76.7 | 74.3 |
| Other fruits & vegetables | 92.6 | 92.7 | 90.1 | 91.5 | 90.7 | 94.7 | 93.5 |
Note. Differences were estimated using generalized linear models (GLM), with robust standard errors at the study block level.
P < 0.05 comparing differences in proportion of children consuming the food group as compared with the control.
The consumption pattern of food groups at Year 2 was similar to Year 1 (Table 4). The most commonly consumed food groups were grains with 99% of children consuming this food group the day prior, whereas 86% of caretakers reported that their children consumed dairy, 74% consumed vitamin A‐rich fruits and vegetables, and 93% consumed other vegetables. The caretakers in the N arm reported giving more foods from the animal flesh foods group, but there were no other differences by group. Again, at Year 2, egg consumption was low at 4% across all arm, but more children in the W arm had eaten eggs in the past 24 hr.
At Year 2, the proportion of children consuming animal source foods from any source (meat, poultry, fish, eggs, or dairy) was high in the past 4 out of 7 days at 82% (Table 5). However, the high prevalence was driven by the frequent consumption of cow's milk, and not animal flesh foods or eggs. From our 24‐hr recall subsample, caretakers reported giving 45.9 g of dairy foods per day, primarily in the form of milk tea (black tea made with 1/3 to 1/4 cup milk per cup of tea). Fewer children in the WSH arm had consumed animal flesh foods, but more children in the N + WSH arm had consumed vitamin A‐rich fruits and/or vegetables.
Table 5.
Percentages reporting consumption of food groups in the past four out of even days after 2 years of intervention
| Food groups consumed (%) | Control | Water (W) | Sanitation (S) | Handwashing (H) | WSH | Nutrition (N) | WSH + N |
|---|---|---|---|---|---|---|---|
| All animal source foods | 82.8 | 82.7 | 82.0 | 80.1 | 78.6 | 82.8 | 82.1 |
| Animal flesh foods only | 3.9 | 4.1 | 4.2 | 3.1 | 3.2* | 4.5 | 3.3 |
| Eggs | 2.8 | 3.8 | 2.7 | 3.6 | 2.7 | 2.2 | 3.4 |
| Dairy foods and drinks | 80.6 | 78.5 | 78.6 | 77.8 | 74.9* | 80.5 | 78.2 |
| Vit. A‐rich fruits & vegetables | 4.4 | 4.5 | 5.7 | 4.1 | 5.7 | 4.8 | 6.4* |
Note. Differences were estimated using generalized linear models (GLM), with robust standard errors at the study block level.
P < 0.05 comparing differences in proportion of children consuming the food group four out of 7 days as compared with the control.
3.2. Micronutrient intake
In the analysis in which we excluded the intake of SQ‐LNS, reported iron intake was higher in the nutrition arms (mean, 95% CI non‐N arms: 4.3, (95% CI 3.8, 4.8) mg/day; N arms: 5.1, (95% CI 4.6, 5.6) mg/day, P < 0.05). Zinc, calcium, and riboflavin intakes did not differ significantly between groups. The nutrient density from non‐SQ‐LNS foods was not different between the nutrition and nonnutrition arms (Table 6). The phytate:iron and phytate:zinc molar ratios were higher in the nutrition arms, as compared with the nonnutrition arms (Table 6).
Table 6.
Nutrient, energy and phytate intakes, and nutrient densities of foods consumed by children aged 9–19 monthsa
| Nonnutrition arms (C and WSH) n = 92 | Nutrition arms (N and WSH + N) n = 93 | |||||
|---|---|---|---|---|---|---|
| Micronutrients | Back transformed mean (95% CI)b | Median density (mg/100 kcal) | Back transformed mean (95% CI) | P | Median density (mg/100 kcal) | P |
| Energy (kcal/day) | ||||||
| Excluding SQ‐LNSc | 586 [528, 643] | ‐ | 649 [595, 702] | 0.097 | ‐ | ‐ |
| Including SQ‐LNS | ‐ | ‐ | 751 [692, 809] | <0.001 | ‐ | ‐ |
| Iron (mg/day) | ||||||
| Excluding SQ‐LNS | 4.3 [3.8, 4.8] | 0.67 | 5.1 [4.6, 5.6] | 0.007 | 0.76 | 0.382 |
| Including SQ‐LNS | ‐ | ‐ | 13.0 [11.7, 14.2] | <0.001 | 1.56 | <0.001 |
| Zinc (mg/day) | ||||||
| Excluding SQ‐LNS | 2.6 [2.2, 2.9] | 0.41 | 2.9 [2.6, 3.1] | 0.062 | 0.43 | 0.363 |
| Including SQ‐LNS | ‐ | ‐ | 9.8 [8.8, 10.9] | <0.001 | 1.14 | <0.001 |
| Calcium (mg/day) | ||||||
| Excluding SQ‐LNS | 124.3 [100.0, 154.6] | 23.49 | 129.8 [108.4, 155.6] | 0.695 | 21.95 | 0.431 |
| Including SQ‐LNS | ‐ | ‐ | 359.6 [312.6, 413.0] | <0.001 | 52.19 | <0.001 |
| Riboflavin (mg/day) | ||||||
| Excluding SQ‐LNS | 0.4 [0.3, 0.5] | 0.06 | 0.5 [0.4, 0.5] | 0.088 | 0.07 | 0.529 |
| Including SQ‐LNS | ‐ | ‐ | 0.9 [0.8, 1.0] | <0.001 | 0.11 | <0.001 |
| Phytate:iron molar ratio | ||||||
| Excluding SQ‐LNS | 13.3 [12.2, 14.5] | ‐ | 15.6 [15.0, 16.2] | 0.001 | ‐ | ‐ |
| Including SQ‐LNS | ‐ | ‐ | 6.5 [5.8, 7.3] | <0.001 | ‐ | ‐ |
| Phytate:zinc molar ratio | ||||||
| Excluding SQ‐LNS | 25.6 [23.1, 29.0] | ‐ | 31.9 [28.0, 34.1] | 0.003 | ‐ | ‐ |
| Including SQ‐LNS | ‐ | ‐ | 10.4 [9.0, 11.9] | <0.001 | ‐ | ‐ |
Differences in transformed micronutrient values and proportion achieving minimum nutrient density were estimated using generalized linear models (GLM), with robust standard errors at the study block level. P values were generated comparing nutrition arms with the nonnutrition arms.
Energy, zinc, iron, and riboflavin were square root transformed. Calcium was log transformed. The phytate ratios were not transformed.
Nutrient densities calculated assuming an average intake of breastmilk and desired nutrient densities were based on recommendations published in Dewey and Brown, 2003.
SQ‐LNS stands for small‐quantity lipid‐based nutrient supplement.
When factoring in the consumption of SQ‐LNS, intakes of iron, zinc, calcium, and riboflavin were significantly higher in the nutrition arms when compared with the nonnutrition arms (Table 6). Additionally, the nutrient density was significantly higher for all measured nutrients in the nutrition arms (Table 6). The phytate:iron and phytate:zinc molar ratios decreased significantly when considering the inclusion of SQ‐LNS. The results for the micronutrient intakes did not change when adjusted for the full set of covariates; therefore, only the unadjusted estimates are presented, as was prespecified in our analysis plan.
4. DISCUSSION
In this cluster‐randomized controlled trial, we found little difference in MDD, MMF, and MAD by intervention arm at either Year 1 or Year 2 of follow‐up. At Year 1, children in the nutrition‐only arm were more likely to achieve the MDD as compared with the control arm, but this difference was small, and not seen in the nutrition + WSH arm. At Year 2, we found no effect of the intervention on complementary feeding practices. In a subsample measured at Year 1, iron intake from non‐SQ‐LNS foods was higher in the nutrition arms as compared with the control arm. Intakes of zinc, calcium, and riboflavin from non‐SQ‐LNS foods did not significantly differ between the nutrition arms and nonnutrition arms. We found no negative impact on MDD, MMF, MAD, or nutrient intakes from the provision of SQ‐LNS.
The proportion achieving MDD increased in all intervention arms from Year 1 to Year 2 across intervention arms, likely reflecting the fact that older children are given more food and thus are more likely to meet the MDD. The proportion meeting MMF decreased slightly during that same period, as the requirement for minimum feeding frequency increases with age. The proportion achieving MAD increased slightly in the breastfeeding group between Year 1 and Year 2 but decreased precipitously in the nonbreastfeeding group. An explanation for this decrease lies in the criteria for meeting the MAD; nonbreastfeeding children must fulfil an additional requirement of two milk feeds per day in addition to meeting the MDD and MMF (WHO, 2008).
The most commonly consumed food groups in the child diets were grains, dairy foods, Vitamin A‐rich fruits and vegetables, and other fruits and vegetables. However, only 3.8% of children reportedly consumed animal flesh foods at least four out of the past 7 days, corroborating our finding from the 24‐hr recall subset that iron and zinc intakes from non‐SQ‐LNS foods were low in this population.
For reasons that are unclear, the proportion of children achieving MDD, MMF, and MAD was higher in our study than previously reported for the region in the Kenya Demographic and Health Surveys. In the western region of Kenya, which in the Demographic and Health Surveys (DHS) encompasses Kakamega, Bungoma, Vihiga, and Busia counties, the prevalence of complementary feeding indicators were as follows: MDD (26.4%), MMF (24.9%), and MAD (10.3%) among breastfeeding children aged 6–23 mos. (Kenya Demographic and Health Survey, 2014) For nonbreastfeeding children, the prevalence of meeting the indicators was for 41.4% for MDD, 23.4% for MMF, and 9.1% for MAD (Kenya Demographic and Health Survey, 2014). The sample size of the Kenya DHS for western Kenya was much smaller (n = 298) compared to ours and was spread across four counties rather than three, which may explain the discrepancy between the DHS and our study. However, our high proportion of children achieving MDD is similar to results of another study conducted in the Rift Valley region of Kenya (Wyatt, Yount, Null, Ramakrishnan, & Girard, 2015).
In our 24‐hr recall subsample, iron was the only nutrient that was higher in the nutrition arms as compared with the nonnutrition arms, though the overall iron density was lower in the diet due to an increase in energy intake. A similar study, conducted in Zimbabwe, also found that iron intake increased due to an intervention containing culturally adapted BCC messages combined with the provision of SQ‐LNS, but contrary to our study, they found that calcium and zinc intakes from non‐SQ‐LNS foods increased as well (Paul et al., 2012).
The provision of SQ‐LNS improved the intakes of iron, zinc, riboflavin, and calcium significantly, though since SQ‐LNS includes only 56% of the Recommended Nutrient Intake for calcium, intakes appear low. However, more recent requirements reflect a decreased need to calcium based on a higher amount that is absorbed from breastmilk (Vitta & Dewey, 2012), therefore the calcium intake in this population is not likely to be a concern.
We found there to be a high phytate intake among children in this study. The high phytate content of the typical Kenyan diet also impairs the absorption of a number of nutrients, but the phytate:iron and phytate:zinc molar ratio decreased in those taking the SQ‐LNS, thus making the iron and zinc more bioavailable. It is interesting to note that the phytate:iron and phytate:zinc molar ratios of non‐SQ‐LNS foods were higher in the nutrition arms than in the nonnutrition arms, indicating that while the children were taking in more iron and zinc, those foods also contained nutrient‐binding phytates. Overall, in this population, we found that while many of the children met the MDD, many did not meet the nutrient requirements for iron, zinc, and calcium without SQ‐LNS.
It is unclear why the BCC messaging did not have a larger impact on complementary feeding outcomes or micronutrient intakes, but in this population with a relatively high proportion meeting the criteria for MDD, MMF, and MAD in the control arm, the opportunity for making an improvement may have been small. We attempted to address barriers to achieving optimal practices, but perhaps the promoters would have been more effective with an initial training of a longer duration, in addition to more frequent re‐trainings. A study in Ethiopia found that community health workers' knowledge was associated with a decrease in childhood stunting, which illustrates the importance of training and community health worker comprehension for programme effectiveness (Abebe, Haki, & Baye, 2016). Additionally, it is possible that the once‐monthly contacts with the family were not as frequent as necessary to induce behaviour change. As reported previously, participants had been visited by a study promoter 68% of the time in the past month; this dropped to 35% in Year 2 (Null et al., 2018). We saw only a modest effect on MDD at Year 1 and no effect at Year 2. In contrast, the WASH Benefits trial in Bangladesh showed an improvement in complementary feeding practices after the community health workers visited twice monthly (Jannat et al., 2018). Additionally, other BCC programmes that have been effective at improving complementary feeding outcomes have had a mass media component, which our programme lacked (Sanghvi et al., 2017).
Though the BCC intervention was largely not effective at inducing behaviour change, the provision of the nutrient supplement (in this case, SQ‐LNS) was not detrimental to complementary feeding behaviours. We found no evidence that the provision of SQ‐LNS negatively impacted any of the complementary feeding indicators, a finding that is corroborated by the four‐country iLiNS Project trials (Arimond et al., 2017). We also did not find evidence for the displacement of nutrient intakes from non‐SQ‐LNS foods, a finding that is in agreement with a study conducted in Honduras (Flax et al., 2015) and a study conducted in Malawi (Hemsworth et al., 2016). These findings are encouraging, as lipid‐based nutrient supplement was designed to fill in nutrient gaps in locally available diets and not displace complementary foods.
4.1. Strengths and limitations
This study has several strengths, the most important being that these data were collected from a cluster‐randomized trial with a large sample size. All data were collected electronically, which improves accuracy in data collection, and the dietary records were measured using the four‐pass 24‐hr recall method, which is the gold standard in 24 hr recall dietary data collection (Gibson & Ferguson, 2008).
As with any investigation that relies on participant reporting, the inherent biases of self‐reported outcomes, such as social desirability bias and recall bias, are limitations of this study. Also, due to the nature of the intervention, masking of the participants was not feasible. The 24‐hr recall method provides a crude estimate of micronutrient intake, subject to incorrect reporting of foods and amounts, though the enumerators were trained to obtain the most accurate information possible. Because we collected only 1 day of 24‐hr recall data, our data do not represent precise measures of individual intake, as they were intended to assess differences between groups. As we could not account for the within‐person variation in intake, our estimates are likely imprecise, reducing our ability to detect differences between the groups (Dodd et al., 2006). However, the diets for young children in Kenya are generally monotonous (Ngala, Akter, Mwangi, & Brouwer, 2015), thus assessing within‐person variation may not have provided us with much more information.
5. CONCLUSION
Overall, the intervention had limited impact on complementary feeding practices. Our results suggest the provision of SQ‐LNS did not displace the intake of any micronutrient‐rich foods or negatively impact complementary feeding practices, which is consistent with findings in other settings. A higher intensity of promoter training and visit frequency may be needed to see sustained improvements in complementary feeding practices.
CONFLICTS OF INTEREST
The authors declare that they have no conflicts of interest.
CONTRIBUTIONS
KB drafted the research protocol and manuscript with input from all listed co‐authors. AW, HND, RO, and OK designed the nutrition intervention and implemented the interventions. GR, MK, BA, and HND assisted with sample and survey collection. BA developed the R package used to analyse the data. KB developed the analytical approach, conducted the statistical analysis, and constructed the tables and figures, with input from CPS and CDA. CN, JC, KGD, and CPS oversaw the main trial, gave feedback on the study protocol, and contributed to the interpretation of results. All authors have read, contributed to, and approved the final version of the manuscript.
Supporting information
Table S1. Nutrient composition of small‐quantity lipid‐based nutrient supplement (SQ‐LNS). Percent of RNI calculated based on WHO/FAO Recommended Nutrient Intakes (RNI) WHO/FAO for infants100
ACKNOWLEDGMENTS
We are indebted to the study participants and promoters who participated in the trial, the study staff who delivered the interventions and collected the data, and the dozens of managers who ensured that everything ran smoothly.
Byrd K, Dentz HN, Williams A, et al. A behaviour change intervention with lipid‐based nutrient supplements had little impact on young child feeding indicators in rural Kenya. Matern Child Nutr. 2019;15:e12660 10.1111/mcn.12660
REFERENCES
- Abebe, Z. , Haki, G. D. , & Baye, K. (2016). Health extension workers' knowledge and knowledge‐sharing effectiveness of optimal infant and young child feeding are associated with mothers' knowledge and child stunting in rural Ethiopia. Food and Nutrition Bulletin, 37(3), 353–363. 10.1177/0379572116651209 [DOI] [PubMed] [Google Scholar]
- Adu‐Afarwuah, S. , & Dewey, K. G. (2008). Systematic review of the efficacy and effectiveness of complementary feeding interventions in developing countries. Maternal & Child Nutrition. [DOI] [PMC free article] [PubMed] [Google Scholar]
- Adu‐Afarwuah, S. , Lartey, A. , Okronipa, H. , Ashorn, P. , Peerson, J. M. , Arimond, M. , … Dewey, K. G. (2016). Small‐quantity, lipid‐based nutrient supplements provided to women during pregnancy and 6 mo postpartum and to their infants from 6 mo of age increase the mean attained length of 18‐mo‐old children in semi‐urban Ghana: A randomized controlled trial. The American Journal of Clinical Nutrition, 104(3), 797–808. 10.3945/ajcn.116.134692 [DOI] [PMC free article] [PubMed] [Google Scholar]
- Arimond, M. , Abbeddou, S. , Kumwenda, C. , Okronipa, H. , Hemsworth, J. , Jimenez, E. Y. , … Dewey, K. G. (2017). Impact of small quantity lipid‐based nutrient supplements on infant and young child feeding practices at 18 months of age: Results from four randomized controlled trials in Africa. Maternal & Child Nutrition, 13(3), e12377‐n/a 10.1111/mcn.12377 [DOI] [PMC free article] [PubMed] [Google Scholar]
- Arnold, B. F. , Null, C. , Luby, S. P. , Unicomb, L. , Stewart, C. P. , Dewey, K. G. , … Colford, J. M. Jr. (2013). Cluster‐randomized controlled trials of individual and combined water, sanitation, hygiene and nutritional interventions in rural Bangladesh and Kenya: The WASH Benefits study design and rationale. BMJ Open, 3, e003476 10.1136/bmjopen-2013-003476 [DOI] [PMC free article] [PubMed] [Google Scholar]
- Ballard, T. , Coates, J. , Swindale, A. , & Deitchler, M. (2011). Household hunger scale: Indicator definition and measurement guide. Retrieved from. Washington, DC. [Google Scholar]
- Christensen, G. , Dentz, H. N. , Pickering, A. J. , Bourdier, T. , Arnold, B. F. , Colford, J. M. Jr. , & Null, C. (2015). Pilot cluster randomized controlled trials to evaluate adoption of water, sanitation, and hygiene interventions and their combination in rural western Kenya. The American Journal of Tropical Medicine and Hygiene, 92(2), 437–447. 10.4269/ajtmh.14-0138 [DOI] [PMC free article] [PubMed] [Google Scholar]
- Dewey, K. G. , & Brown, K. H. (2003). Update on technical issues concerning complementary feeding of young children in developing countries and implications for intervention programs. Food and Nutrition Bulletin, 24, 5–28. [DOI] [PubMed] [Google Scholar]
- Dewey, K. G. , Mridha, M. K. , Matias, S. L. , Arnold, C. D. , Cummins, J. R. , Khan, M. S. A. , … Vosti, S. A. (2017). Lipid‐based nutrient supplementation in the first 1000 d improves child growth in Bangladesh: A cluster‐randomized effectiveness trial. The American Journal of Clinical Nutrition, 105(4), 944–957. [DOI] [PubMed] [Google Scholar]
- Dodd, K. W. , Guenther, P. M. , Freedman, L. S. , Subar, A. F. , Kipnis, V. , Midthune, D. , … Krebs‐Smith, S. M. (2006). Statistical methods for estimating usual intake of nutrients and foods: A review of the theory. Journal of the American Dietetic Association, 106(10), 1640–1650. 10.1016/j.jada.2006.07.011 [DOI] [PubMed] [Google Scholar]
- Fabrizio, C. S. , van Liere, M. , & Pelto, G. (2014). Identifying determinants of effective complementary feeding behaviour change interventions in developing countries. Maternal & Child Nutrition, 10(4), 575–592. 10.1111/mcn.12119 [DOI] [PMC free article] [PubMed] [Google Scholar]
- FAO . International Network of Food Data Systems. Retrieved from http://www.fao.org/infoods/infoods/tables-and-databases/faoinfoods-databases/en
- Ferguson, E. , Chege, P. , Kimiywe, J. , Wiesmann, D. , & Hotz, C. (2016). Zinc, iron and calcium are major limiting nutrients in the complementary diets of rural Kenyan children. Maternal & Child Nutrition, 11, 6–20. 10.1111/mcn.12243 [DOI] [PMC free article] [PubMed] [Google Scholar]
- Flax, V. L. , Siega‐Riz, A. M. , Reinhart, G. A. , & Bentley, M. E. (2015). Provision of lipid‐based nutrient supplements to Honduran children increases their dietary macro‐ and micronutrient intake without displacing other foods. Maternal & Child Nutrition, 11, 203–213. 10.1111/mcn.12182 [DOI] [PMC free article] [PubMed] [Google Scholar]
- Gibson, R. S. , & Ferguson, E. L. (2008). An interactive 24‐hour recall for assessing the adequacy of iron and zinc intakes in developing countries. Washington DC and Cali: International Food Policy Research Institute (IFPRI) and International Center for Tropical Agriculture (CIAT).
- Hemsworth, J. , Kumwenda, C. , Arimond, M. , Maleta, K. , Phuka, J. , Rehman, A. M. , … Ferguson, E. L. (2016). Lipid‐based nutrient supplements increase energy and macronutrient intakes from complementary food among Malawian infants. The Journal of Nutrition, 146(2), 326–334. 10.3945/jn.115.215327 [DOI] [PubMed] [Google Scholar]
- Hess, S. , Abbeddou, S. , Jimenez, E. , Some, J. W. , Vosti, S. A. , Ouedraogo, Z. P. , … Brown, K. H. (2014). Small‐quantity lipid‐based nutrient supplements, regardless of their zinc content, increase growth and reduce the prevalence of stunting and wasting in young burkinabe children: A cluster‐randomized trial. PLoS One, 10 10.1371/, 10.6084/m9.figshare.1301239, 10.1371/journal.pone.0122242 [DOI] [PMC free article] [PubMed] [Google Scholar]
- Hotz, C. , Abdelrahman, L. , Sison, C. , Moursi, M. M. , & Loechl, C. (2012). A food composition table for Eastern and Central Uganda. Retrieved from
- Hotz, C. , & Gibson, R. S. (2005). Participatory nutrition education and adoption of new feeding practices are associated with improved adequacy of complementary diets among rural Malawian children: A pilot study. European Journal of Clinical Nutrition, 59(2), 226–237. 10.1038/sj.ejcn.1602063 [DOI] [PubMed] [Google Scholar]
- Jannat, K. , Luby, S. P. , Unicomb, L. , Rahman, M. , Winch, P. J. , Parvez, M. S. , … Stewart, C. P. (2018). Complementary feeding practices among rural Bangladeshi mothers: Results from WASH Benefits study. Maternal & Child Nutrition, e12654. 10.1111/mcn.12654 [DOI] [PMC free article] [PubMed] [Google Scholar]
- Joint child malnutrition estimates—Levels and trends . (2017). Retrieved from
- Kapur, D. , Sharma, S. , & Agarwal, K. N. (2003). Effectiveness of nutrition education, iron supplementation or both on iron status in children. Indian Pediatrics, 40. [PubMed] [Google Scholar]
- Kenya Demographic and Health Survey . (2014). Retrieved from Nairobi, Kenya:
- Kumwenda, C. , Dewey, K. G. , Hemsworth, J. , Ashorn, P. , Maleta, K. , & Haskell, M. J. (2013). Lipid‐based nutrient supplements do not decrease breast milk intake of Malawian infants. The American Journal of Clinical Nutrition, 99(3), 617–623. [DOI] [PubMed] [Google Scholar]
- Mirkovic, K. R. , Perrine, C. G. , Subedi, G. R. , Mebrahtu, S. , Dahal, P. , & Jefferds, M. E. (2016). Micronutrient powder use and infant and young child feeding practices in an integrated program. [综合方案中微量营养素粉的使用和婴幼儿喂养方法]. Asia Pacific Journal of Clinical Nutrition, 25(2), 350–355. 10.6133/apjcn.2016.25.2.19 [DOI] [PubMed] [Google Scholar]
- Ndiku, M. , Jaceldo‐Siegl, K. , & Sabate, J. (2010). Dietary patterns of infant and preschool children in Mwingi and Makueni districts of Ukambani region, eastern Kenya. African Journal of Food, Agriculture, Nutrition and Development, 10(7). [Google Scholar]
- Ngala, S. A. , Akter, S. , Mwangi, A. , & Brouwer, I. (2015). Development of food based dietary guidelines for Kenyan women using linear programming. [Google Scholar]
- Null, C. , Stewart, C. P. , Pickering, A. J. , Dentz, H. N. , Arnold, B. F. , Arnold, C. D. , … Colford, J. M. Jr. (2018). Effects of water quality, sanitation, handwashing, and nutritional interventions on diarrhoea and child growth in rural Kenya: A cluster‐randomised controlled trial. The Lancet Global Health., 6, e316–e329. 10.1016/S2214-109X(18)30005-6 [DOI] [PMC free article] [PubMed] [Google Scholar]
- Paul, K. H. , Muti, M. , Chasekwa, B. , Mbuya, M. N. N. , Madzima, R. C. , Humphrey, J. H. , & Stoltzfus, R. J. (2012). Complementary feeding messages that target cultural barriers enhance both the use of lipid‐based nutrient supplements and underlying feeding practices to improve infant diets in rural Zimbabwe. Maternal & Child Nutrition, 8(2), 225–238. 10.1111/j.1740-8709.2010.00265.x [DOI] [PMC free article] [PubMed] [Google Scholar]
- Penny, M. E. , Creed‐Kanashiro, H. M. , Robert, R. C. , Narro, M. R. , Caulfield, L. E. , & Black, R. E. (2005). Effectiveness of an educational intervention delivered through the health services to improve nutrition in young children: A cluster‐randomised controlled trial. The Lancet, 365(9474), 1863–1872. 10.1016/S0140-6736(05)66426-4 [DOI] [PubMed] [Google Scholar]
- Roy, S. K. , Fuchs, G. J. , Mahmud, Z. , Ara, G. , Islam, S. , Shafique, S. , … Chakraborty, B. (2005). Intensive nutrition education with or without supplementary feeding improves the nutritional status of moderately‐malnourished children in Bangladesh. Journal of Health, Population, and Nutrition, 23. [PubMed] [Google Scholar]
- Sanghvi, T. , Seidel, R. , Baker, J. , & Jimerson, A. (2017). Using behavior change approaches to improve complementary feeding practices. Maternal & Child Nutrition, 13, e12406‐n/a 10.1111/mcn.12406 [DOI] [PMC free article] [PubMed] [Google Scholar]
- USDA . Nutrient Database. Retrieved from http://www.ars.usda.gov/nutrientdata
- Vitta, B. S. , & Dewey, K. (2012). Identifying micronutrient gaps in the diets of breastfed 6–11‐month‐old infants in Bangladesh, Ethiopia and Vietnam using linear programming. Washington, DC: Alive & Thrive. [Google Scholar]
- WHO (2003). Global strategy for infant and young child feeding. Retrieved from. Geneva, Switzerland. [Google Scholar]
- WHO (2008). Indicators for assessing young child feeding ()Part I: definitions Retrieved from. Geneva, Switzerland. [Google Scholar]
- WHO (2010). Indicators for assessing infant and young child feeding practices ()Part II: measurement Retrieved from. Geneva, Switzerland. [Google Scholar]
- WHO/PAHO (2001). Guiding principles for complementary feeding of the breastfed child. Retrieved from. Washington DC. [Google Scholar]
- Williams, A. M. , Chantry, C. J. , Young, S. L. , Achando, B. S. , Allen, L. H. , Arnold, B. F. , … Stewart, C. P. (2016). Vitamin B‐12 concentrations in breast milk are low and are not associated with reported household hunger, recent animal‐source food, or vitamin B‐12 intake in women in rural Kenya. The Journal of Nutrition, 146(5), 1125–1131. 10.3945/jn.115.228189 [DOI] [PMC free article] [PubMed] [Google Scholar]
- Wyatt, A. J. , Yount, K. M. , Null, C. , Ramakrishnan, U. , & Girard, A. W. (2015). Dairy intensification, mothers and children: An exploration of infant and young child feeding practices among rural dairy farmers in Kenya. Maternal & Child Nutrition, 11(1), 88–103. 10.1111/mcn.12074 [DOI] [PMC free article] [PubMed] [Google Scholar]
Associated Data
This section collects any data citations, data availability statements, or supplementary materials included in this article.
Supplementary Materials
Table S1. Nutrient composition of small‐quantity lipid‐based nutrient supplement (SQ‐LNS). Percent of RNI calculated based on WHO/FAO Recommended Nutrient Intakes (RNI) WHO/FAO for infants100