

The crystal structure is reported of a three-dimensional anionic CuICN network with noncoordinated protonated N-methylethanolamine cations providing charge neutrality. Pairs of cuprophilic Cu atoms are bridged by μ3-cyanide groups which link these units into 43 spirals along the c axis, and these are linked together by other cyanide groups. On heating the compound to 280 °C, a CuCN residue is formed, while further heating leaves a residue of elemental copper, isolated as the oxide.
Keywords: copper cyanide, 3D network, thermogravimetric analysis, crystal structure, decomposition study, ethanolamine, cuprophilic interaction, spiral configuration
Abstract
The compound poly[2-hydroxy-N-methylethan-1-aminium [μ3-cyanido-κ3 C:C:N-di-μ-cyanido-κ4 C:N-dicuprate(I)]], {(C3H10NO)[Cu2(CN)3]}n or [meoenH]Cu2(CN)3, crystallizes in the tetragonal space group P43. The structure consists of a three-dimensional (3D) anionic CuICN network with noncoordinated protonated N-methylethanolamine cations providing charge neutrality. Pairs of cuprophilic Cu atoms are bridged by the C atoms of μ3-cyanide ligands, which link these units into a 43 spiral along the c axis. The spirals are linked together into a 3D anionic network by the two other cyanide groups. The cationic moieties are linked into their own 43 spiral via N—H⋯O and O—H⋯O hydrogen bonds, and the cations interact with the 3D network via an unusual pair of N—H⋯N hydrogen bonds to one of the μ2-cyanide groups. Thermogravimetric analysis indicates an initial loss of the base cation and one cyanide as HCN at temperatures in the range 130–250 °C to form CuCN. We show how loss of a specific cyanide group from the 3D CuCN structure could form the linear CuCN structure. Further heating leaves a residue of elemental copper, isolated as the oxide.
Introduction
Copper cyanide networks have been studied extensively in light of their interesting and unpredictable topologies, their photoluminescence, and the possible applications of their physical properties (see, for example: Grifasi et al., 2016 ▸; Pike 2012 ▸; Dembo et al., 2010 ▸; Tronic et al., 2007 ▸). The CuICN–base networks in the literature either involve the base coordinated to Cu or the CuCN network carrying a net negative charge, requiring a cation in the network to provide neutrality. Our program of structural studies on mixed-valence copper cyanide complexes has sought to prepare neutral CuCN networks by incorporating divalent copper ions into CuI networks, the CuII atoms being stabilized by coordination to one or more chelating ligands in the form of nitrogen bases. The synthesis and structural analysis of the title compound, poly[2-hydroxy-N-methylethan-1-aminium [μ3-cyanido-κ3
C:C:N-di-μ-cyanido-κ4
C:N-dicuprate(I)]], (I), arose from an initial attempt to prepare such a neutral mixed-valence complex by partial reduction of Cu2+(aq) with the cyanide ion in the presence of N-methylethanolamine (meoen) as the stabilizing chelating ligand, a method which has previously produced crystalline products when chelating diamines were used (see, for example: Corfield & Sabatino, 2017 ▸). After many unsuccessful attempts, mixtures containing crystalline compound (I) resulted, as described in the Experimental (§2) section. Although we have been unable so far to prepare a crystalline mixed-valence copper cyanide compound involving this base, we developed modified procedures to synthesize pure compound (I) in light of its interesting structural properties. Detailed thermogravimetric analyses of (I) were carried out in order to understand the structure further. Prompted by this work, our laboratory is now carrying out similar studies on a number of other CuCN networks based upon N-alkylethanolamines.
Experimental
Reagents were used as supplied by the manufacturers without further purification. IR spectra were obtained with a Thermo Scientific Nicolet iS50 FT–IR instrument, while thermal degradation studies were carried out under nitrogen with a TA Instruments TGA-Q500 instrument. Scanning electron microscopy images were obtained with a Zeiss EVO MA-10 instrument equipped with an LaB6 filament. Images were collected with an accelerating voltage of 15 kV in variable pressure mode with a system vacuum of 40 Pa. SEM samples were prepared by drop-casting the powders dispersed in hexanes onto ultraflat p-doped Si wafers, which were dried under vacuum before analysis. Powder X-ray diffraction measurements were made with a Bruker D8 Advance Eco instrument. Elemental analyses were performed by Robertson–Microlit Laboratories, Ledgewood, NJ, USA.
Synthesis and crystallization
[meoenH]Cu2(CN)3 was initially synthesized by adding NaCN to solutions containing CuSO4 and N-methylethanolamine, with the expectation of partial reduction of the CuII component to CuI and formation of our desired mixed-valent copper cyanide network. In general, preparations yielded heterogeneous green powders. The following preparation was the first to yield any crystalline material: CuSO4·5H2O (0.506 g, 2.03 mmol) was dissolved in water (10 ml) and stirred with a solution of meoen (0.779 g, 10.4 mmol) in water (5 ml), resulting in a deep-purple solution. A solution of NaCN (0.0968 g, 1.97 mmol) in water (10 ml) was added and the mixture heated to near boiling over a period of 90 min. Filtration after one week yielded a light-green solid material. Examination of the material under an optical microscope revealed a mixture of microcrystalline conglomerates and material that seemed noncrystalline. Further examination with a scanning electron microscope (SEM) confirmed the presence of two morphologies: one that was facetted and appeared more crystalline (Fig. 1 ▸ a) and one that appeared amorphous (Fig. 1 ▸ b). It was evident that small spherical domains of the amorphous material were on the surface of the facetted single crystal and polycrystalline material (Fig. 1 ▸ a), giving the sample a uniformly green color.
Figure 1.

Electron microscope image showing (a) the crystalline and (b) the amorphous material in the initially synthesized heterogeneous green sample.
A small single crystal was selected after laborious examination of the sample. X-ray diffraction data were collected and data analysis resulted in a structure essentially the same as that reported in this article. The structure is made up of an anionic CuICN network, with noncoordinated protonated meoen molecules providing charge neutrality; the molecular formula is [meoenH]Cu2(CN)3. H atoms bonded to N and O atoms were visible in difference maps and could be refined, confirming that the meoen base was protonated and that each of the Cu atoms in the structure was monovalent. However, a small sample of the product gave an electron spin resonance (ESR) signal clearly indicating the presence of CuII in the sample. The majority of the remaining material was then used to obtain a powder X-ray diffraction (PXRD) pattern (Fig. 2 ▸). All peaks in the PXRD pattern matched the peaks expected from the single-crystal structure and there was little or no evidence for a second diffracting phase. It appeared that the ESR signal observed for the heterogeneous mixture was from the green amorphous component observed in the SEM images, and that this component did not give a PXRD pattern. In order to confirm this conclusion, syntheses along the original lines were repeated until a green noncrystalline product was obtained, shown by optical microscopy and SEM analysis to consist almost completely of the previously identified amorphous morphology shown in Fig. 1 ▸(b). The PXRD pattern of this sample did indeed show mostly background scattering, and only one or two minor peaks (Fig. 2 ▸).
Figure 2.

PXRD patterns for the heterogeneous green sample containing both crystalline and amorphous material (black), the sample containing the isolated green amorphous material (blue), together with the PXRD pattern expected from our single-crystal structure of [meoenH]Cu2(CN)3 (red), calculated from GSAS II (Toby et al., 2013 ▸).
The synthetic procedure was modified to increase the likelihood of the formation of a pure sample of the crystalline compound by adding meoenH+ as the chloride salt to NaCN/CuCN mixtures instead of as the meoen base. A typical preparation such as the following produces a colorless crystalline product: the base meoen (0.751 g, 10.0 mmol) in water (30 ml) was titrated with 1 M HCl (11 ml) to a pH of 4.2; to a solution of NaCN (0.196 g, 4.0 mmol) in water (20 ml) was added CuCN(s) (0.224 g, 2.50 mmol) and further water (10 ml), and the mixture was stirred until all of the solid dissolved; the two solutions were combined and left to evaporate slowly. Colorless crystals of [meoenH]Cu2(CN)3 developed over a period of one or two weeks. Data crystals 3 and 4 were taken from such product samples and were shown to have exactly the same structure as found previously. These samples were ESR silent, as expected. Elemental analysis (%) on a colorless sample gave C 25.42, H 3.27, N 19.72, and Cu 45.14, agreeing well with the calculated values of 25.62, 3.58, 19.92, and 45.19%, respectively. Strong IR stretches were observed at 2083 and 2104 (C≡N), and 3110 and 3167 cm−1 (N—H). There was a sharp peak at 3529 cm−1 (hydrogen-bonded O—H) superimposed upon a broad peak in the O—H stretching region.
Refinement
Crystal data, data collection and structure refinement details for the title compound are summarized in Table 1 ▸. We collected data from crystals taken from four separate preparations of the compound, in order to confirm the identity of samples of both the green and colorless crystalline compounds described above. Each set of data was successfully refined in the space group P43 with Flack parameters indistinguishable from zero. Refinement in the enantiomeric space group P41 gave significantly higher R factors, and Flack parameters of 1.0. Details of the four data sets and their refinements are presented in the supporting information. Reflection data from the four crystals were merged with the program SORTAV (Blessing, 1989 ▸), giving R int = 0.0426, with the expectation that the use of averaged data from the four crystals would give an improved structure, as well as clarifying the H-atom positions on the disordered hydroxy group. [Data for each crystal were first averaged with SCALEPACK (Otwinowski & Minor, 1997 ▸) in the KappaCCD server software (Nonius, 1997 ▸).] The crystal size given in Table 1 ▸ is given for crystal 4. Crystals 1 and 2 were of similar size, but crystal 3 was much larger than the others; data from this crystal were used to help improve signal-to-noise ratios for the weaker reflections. In all, 14 469 intensities processed from the four crystals were merged to give the 3908 data used in this study. SORTAV rejected 407 reflections from the merge based upon statistical tests, including 371 stronger reflections from crystal 3 which were rejected because they had significantly less intensity than reflections from the other crystals, presumably due to detector saturation for the strong reflections from the larger crystal 3.
Table 1. Experimental details.
| Crystal data | |
| Chemical formula | (C3H10NO)[Cu2(CN)3] |
| M r | 281.26 |
| Crystal system, space group | Tetragonal, P43 |
| Temperature (K) | 303 |
| a, c (Å) | 8.8994 (5), 11.3750 (11) |
| V (Å3) | 900.89 (13) |
| Z | 4 |
| Radiation type | Mo Kα |
| μ (mm−1) | 4.68 |
| Crystal size (mm) | 0.30 × 0.07 × 0.07 |
| Data collection | |
| Diffractometer | Enraf–Nonius KappaCCD |
| Absorption correction | Part of the refinement model (ΔF) (Otwinowski & Minor, 1997 ▸) |
| T min, T max | 0.56, 0.77 |
| No. of measured, independent and observed [I > 2σ(I)] reflections | 3962, 3962, 3685 |
| R int | 0.043 |
| (sin θ/λ)max (Å−1) | 0.806 |
| Refinement | |
| R[F 2 > 2σ(F 2)], wR(F 2), S | 0.025, 0.048, 1.08 |
| No. of reflections | 3962 |
| No. of parameters | 134 |
| No. of restraints | 8 |
| H-atom treatment | H atoms treated by a mixture of independent and constrained refinement |
| Δρmax, Δρmin (e Å−3) | 0.49, −0.41 |
| Absolute structure | Flack x determined using 1606 quotients [(I +) − (I −)]/[(I +) + (I −)] (Parsons et al., 2013 ▸) |
| Absolute structure parameter | 0.008 (8) |
CN occupancies for the C and N atoms of the cyanide groups were refined at a late stage. None of the C/N occupancy factors differed significantly from 100/0%, so that we have refined all of the cyanide groups as ordered. In the case of the μ3-bridging cyanide C3≡N3, this ordering was expected, as the C and not the N atom is usually preferentially bound to the pair of close Cu atoms in such cases. The clear choice of orientation taken by the two other cyanide groups is possibly due to interactions with the cations, as discussed below.
Methylene H atoms in the N-methylethanolamine moiety were constrained to positions calculated assuming a tetrahedral geometry at the C atom and a C—H distance of 0.97 Å. H atoms on the methyl group were constrained similarly, with C—H distances of 0.96 Å and the methyl group was allowed to rotate. We have modeled a 50:50 disordered hydroxy group. The disordered hydroxy H atoms and the two H atoms on the charged N atom were allowed to refine individually, with restraints on the N/O—H distances, and displacement parameters were constrained to be equal for the two pairs.
Results and discussion
Description of the structure
Displacement ellipsoids for the asymmetric unit of the structure are shown in Fig. 3 ▸. The structure is composed of a three-dimensional (3D) anionic CuI network, with the molecular formula [Cu2(CN)3]−. Charge neutrality is maintained by protonated N-methylethanolamine molecules, [meoenH]+, situated in the network cavities. The CuCN network is built up from dimeric Cu2(CN)6 units (see Scheme), with the two Cu atoms in each unit held together in a cuprophilic interaction by one μ3-bridging CN group (Fig. 3 ▸). The Cu⋯Cu distance is 2.5822 (5) Å and the two Cu—C distances to the μ3-C atom are 2.007 (2) and 2.138 (2) Å. The Cu⋯Cu distance is usually found to be shortest when bridging distances are more symmetrical (Stocker et al., 1999 ▸; Corfield et al., 2016 ▸). In this case, the Cu—C distances differ significantly and the Cu⋯Cu distance is intermediate, perhaps also because there is only one μ3-bridging cyanide instead of the two that are often found. Of the two Cu atoms, Cu1 is bound to four cyanide groups in a distorted tetrahedral arrangement, with bond angles ranging from 97.87 (9)° for N2—Cu1—C3 to 124.80 (10)° for C1—Cu1—C3. The Cu2 atom is trigonally bound to three cyanide groups, with bond angles of 104.47 (10)° for C3—Cu2—N3, 121.26 (10)° for C2—Cu2—C3, and 127.14 (10)° for C2—Cu2—N3. The sum of the bond angles around Cu2 is 352.87 (6)°, which implies a significant distortion from planarity for this atom. The Cu—C/N distances vary from 1.910 (2) to 2.138 (2) Å, with a mean of 2.02 (3) Å. Each of the three CN groups bridges Cu atoms, with a mean C—N distance of 1.147 (2) Å and angles within 12° of linearity for the two μ2-CN groups. There are no terminal CN groups.
Figure 3.

The asymmetric unit of the title compound, showing displacement ellipsoids for heavier atoms at the 70% probability level and H atoms at an arbitrary scale. Both of the disordered hydroxy O atoms are shown. The dashed line indicates the cuprophilic interaction. In this figure, as well as in Figs. 4 ▸ and 5 ▸, the color code is: Cu magenta; O red; N blue; C black.
The μ3-C3≡N3 group of the asymmetric unit bridges to a Cu2 atom related by the 43 crystallographic axis at x = 0, y = 0, so as to link the dimers into a spiral chain (Fig. 4 ▸
a). Fig. 4 ▸(b) shows a projection of the CuCN network down the c axis, with this spiral structure bolded. Cyanide groups C1≡N1 also link Cu1 atoms into a spiral related by the 43 axis at x =  , y = , seen as a square structure inside the unit-cell outline in Fig. 4 ▸(b). The C2≡N2 cyanide groups link these two sets of spirals into the 3D network.
Figure 4.

(a) Projection along the a axis of the spiral chain of Cu2(CN)5 and C3≡N3 units related by the 43 axis at x = 0, y = 0. Generic atom labels without symmetry codes have been used. (b) Packing diagram showing a projection along the c axis. The projection of the spiral chain shown in Fig. 4 ▸(a) is highlighted in bold. Only the cations within the unit cell are shown, with bonds drawn in green.
The hydroxy O atom in the guest cation is in a gauche configuration with respect to the extended conformation of the rest of the molecule. These meoenH+ cations are linked via N—H⋯O and O—H⋯O hydrogen bonds into their own spiral structure around the 43 axis at x = , y = (Table 2 and Fig. 5 ▸). Formation of the O—H⋯O hydrogen bonds requires that the disordered –OH groups assume a cis conformation with respect to the neighboring CH2 group. The disordered model for the hydroxy H atoms mean that O—H⋯O hydrogen-bonded chains can point either up or down the spiral chains. In addition, there are hydrogen-bonding N—H⋯N interactions between the protonated amine groups and the N atom of bridging cyanide C2≡N2 of the CuCN anionic 3D structure (Fig. 5 ▸), which doubtless favors the orientation found for this cyanide group in the structure. The N⋯N distances are 3.089 (3) and 3.093 (3) Å, and the N—H⋯N hydrogen-bond angles are 144 (3) and 152 (3)°. The N⋯N interactions are almost at right angles to the Cu—C≡N—Cu chain, with N13⋯N2—Cu1 and N13⋯N2—C2 angles of 97.48 (9) and 92.0 (2)° for the H13A hydrogen bond, and 94.54 (9) and 88.4 (2)° for the H13B hydrogen bond.
Figure 5.
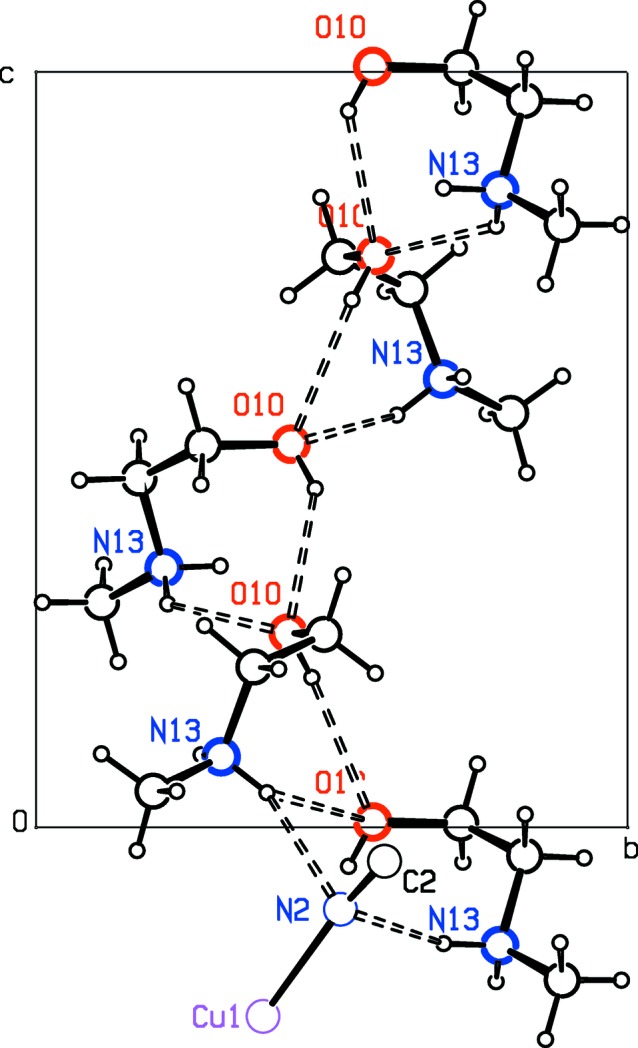
Projection along the a axis of the spiral chain of hydrogen-bonded meoenH+ ions. Only one of the disordered hydroxy O atoms is shown.
Intrigued by these unusual hydrogen-bond interactions, we explored occurrences of N—H and Cu—C≡N—Cu interactions in the Cambridge Structural Database (CSD, Version 2.0.3; Groom et al., 2016 ▸). A search for such N⋯N contacts less than the sum of the van der Waals radii + 0.5 Å yielded 225 cases of such contacts in 109 entries, with 27 of the contacts involving N+—H hydrogen bonds, and the rest N—H interactions. A histogram of the N⋯N contacts found (Fig. 6 ▸ a) indicates only three structures with distances as close as seen in the present structure, indicating that this interaction is rare, though not unique. While all of the N⋯N—Cu angles cluster broadly around 90°, Fig. 6 ▸(b) shows that angles close to 90° are found especially for shorter N⋯N distances. The shortest such N⋯N distance is found in the structure of [NH3(CH2)5NH3]3Cu8(CN)14·3H2O (Pretsch & Hartl, 2004 ▸). Here, one of the Cu—C≡N—Cu chains has two such contacts to the cyanide N atom in the chain, at 158° to one another. The N⋯N distances are 3.04 and 3.25 Å, and the N—H⋯N hydrogen-bond angles are 162 and 158°. One of the other examples of shorter N⋯N distances that we had not previously noted occurs in our own structure of [(C2H5)2NH(CH2)2OH]Cu2(CN)3 (Corfield et al., 2016 ▸), where the N⋯N distance is 3.13 Å and the N—H⋯N angle is 145°.
Figure 6.

Histograms of N—H⋯Cu—C≡N—Cu contacts (a) and angles (b).
Thermal decomposition studies
Fig. 7 ▸(a) shows the percent mass loss when a sample of the title compound was heated at 4 °C min−1 to 400 °C and maintained at that temperature for 2 h. An initial loss of 36% is complete by 280 °C and corresponds to a mass loss of 101 u. This mass closely approximates the mass of the meoen moiety plus HCN (75.1 + 27.0 = 102 u) which would leave behind material with the composition CuCN. The continued weight loss to 52% represents the loss of cyanide, leaving mostly elemental copper behind. The reproducible weight gain at the end of the experiment was puzzling. The black material remaining gave a PXRD pattern that matched that for copper(II) oxide (Fig. 7 ▸ b), and showed %N < 0.1% upon elemental analysis. We conclude that there must be some source of oxygen in the apparatus, either from a leak or from the nitrogen cylinder. In a separate thermogravimetric analysis (TGA) experiment with 20 mg of sample, heating was stopped at 280 °C, and the cream-colored solid remaining was examined to verify its composition. The IR spectrum of this solid showed CN stretches at 2122 and 2166 cm−1, identical to the CN stretching frequencies found in an IR sample of a freshly prepared CuCN sample. Elemental analysis (%) of the 280 °C residue was reported at C 13.52, H 0.16, and N 15.41, compared with the values of C 13.41, H 0, and N 15.64 expected for CuCN. The residue gave a PXRD pattern very similar to that for a sample of CuCN (Fig. 7 ▸ b). The 280 °C residue is clearly CuCN.
Figure 7.

(a) Thermogravimetric analysis data for [meoenH]Cu2(CN)3. The temperature was ramped at 4 °C min−1 to 400 °C (left), producing the first mass loss of 36%. The temperature was held at 400 °C for 120 min to produce the second mass loss of 52% of the initial mass in an isothermal step (right). (b) PXRD data collected after TGA of samples heated to 280 and 400 °C. The PXRD pattern for our synthesized CuCN and a standard pattern for CuO (COD 90144580) are also shown.
We propose a mechanism by which the 3D CuCN network structure shown in Fig. 4 ▸ could transform to the linear Cu—C≡N—Cu chains of CuCN on heating to 280 °C with loss of a cyanide and the guest base cation. We note that the spiral CuCN chains at x = 0, y = 0, shown in Fig. 4 ▸(a). involve a continuous Cu2—C3≡N3—Cu2—C3≡N3—Cu2 sequence, and that the spirals shown in Fig. 4 ▸(b) at x = , y = involve a continuous Cu1—C1≡N1—Cu1—C1≡N1—Cu1 sequence. These spirals are connected by the bridging cyanide C2≡N2 groups. The release of cyanide C2≡N2 from the structure, together with the breakage of the C3—Cu1 bond and the release of the Cu atoms from their cuprophilic interaction can leave the two separate spirals free to reorganize into the linear structure found in the room temperature orthorhombic CuCN crystalline phase which was obtained.
We have also explored further the compound(s) lost during the initial heating phase in the TGA experiment. Samples of the title compound were heated in a glass sublimation apparatus to ∼200 °C, and the liquid sublimate on the water-cooled cold finger was collected. Carrying out the sublimation in air gave a complex mixture, as indicated by the IR and NMR spectra, as well as by GC/MS results. When the experiment was repeated under an argon atmosphere, the GC/MS results indicated a mixture of three species. The predominant compound (80%) had a fragmentation pattern that closely matched that expected for meoen, but it was not possible to identify the two minority compounds. The IR spectrum of the mixture included peaks expected for meoen, together with a strong peak at 1665 cm−1, which must be due to one of the minority species formed, perhaps by thermal decomposition of the hot base.
Supplementary Material
Crystal structure: contains datablock(s) I, global. DOI: 10.1107/S2053229620004477/op3005sup1.cif
Structure factors: contains datablock(s) I. DOI: 10.1107/S2053229620004477/op3005Isup2.hkl
Supplemental data on the four individual crystals. DOI: 10.1107/S2053229620004477/op3005sup3.txt
CCDC reference: 1993944
Acknowledgments
We gratefully acknowledge the assistance of colleagues in the Chemistry Department at Fordham University: Dr Chris Bender performed the ESR measurements; Dr James Ciaccio took NMR measurements and obtained the GC/MS results; Dr Julia Schneider assisted us with the sublimation experiments. Assistance also from undergraduate student Patricia Phuong is acknowledged. Funding for this research was provided by Fordham College at Rose Hill, Dean’s Office (research grant to Leena Rachid).
References
- Blessing, R. H. (1989). J. Appl. Cryst. 22, 396–397.
- Burnett, M. N. & Johnson, C. K. (1996). ORTEPIII. Report ORNL6895. Oak Ridge National Laboratory, Tennessee, USA.
- Corfield, P. W. R., Cleary, E. & Michalski, J. F. (2016). Acta Cryst. E72, 892–896. [DOI] [PMC free article] [PubMed]
- Corfield, P. W. R. & Sabatino, A. (2017). Acta Cryst. E73, 141–146. [DOI] [PMC free article] [PubMed]
- Dembo, M. D., Dunaway, L. E., Jones, J. S., Lepekhina, E. A., McCullough, S. M., Ming, J. L., Li, X., Baril-Robert, F., Patterson, H. H., Bayse, C. A. & Pike, R. D. (2010). Inorg. Chim. Acta, 364, 102–114.
- Farrugia, L. J. (2012). J. Appl. Cryst. 45, 849–854.
- Grifasi, F., Priola, E., Chierotti, M. R., Diana, E., Garino, C. & Gobetto, R. (2016). Eur. J. Inorg. Chem. 2016, 2975–2983.
- Groom, C. R., Bruno, I. J., Lightfoot, M. P. & Ward, S. C. (2016). Acta Cryst. B72, 171–179. [DOI] [PMC free article] [PubMed]
- Nonius (1997). KappaCCD Server Software. Nonius BV, Delft, les Pays-Bas.
- Otwinowski, Z. & Minor, W. (1997). Methods in Enzymology, Vol. 276, Macromolecular Crystallography, Part A, edited by C. W. Carter Jr & R. M. Sweet, pp. 307–326. New York: Academic Press.
- Parsons, S., Flack, H. D. & Wagner, T. (2013). Acta Cryst. B69, 249–259. [DOI] [PMC free article] [PubMed]
- Pike, R. D. (2012). Organometallics, 31, 7647–7660.
- Pretsch, T. & Hartl, H. (2004). Z. Anorg. Allg. Chem. 630, 1581–1588.
- Sheldrick, G. M. (2015a). Acta Cryst. A71, 3–8.
- Sheldrick, G. M. (2015b). Acta Cryst. C71, 3–8.
- Stocker, F. F., Staeva, T. P., Rienstra, C. M. & Britton, D. (1999). Inorg. Chem. 38, 984–991. [DOI] [PubMed]
- Toby, B. H. & Von Dreele, R. B. (2013). J. Appl. Cryst. 46, 544–549.
- Tronic, T. A., deKrafft, K. E., Lim, M. J., Ley, A. N. & Pike, R. D. (2007). Inorg. Chem. 46, 8897–8912. [DOI] [PubMed]
- Westrip, S. P. (2010). J. Appl. Cryst. 43, 920–925.
Associated Data
This section collects any data citations, data availability statements, or supplementary materials included in this article.
Supplementary Materials
Crystal structure: contains datablock(s) I, global. DOI: 10.1107/S2053229620004477/op3005sup1.cif
Structure factors: contains datablock(s) I. DOI: 10.1107/S2053229620004477/op3005Isup2.hkl
Supplemental data on the four individual crystals. DOI: 10.1107/S2053229620004477/op3005sup3.txt
CCDC reference: 1993944