

Abstract

Mass spectrometry imaging is a field that promises to become a mainstream bioanalysis technology by allowing the combination of single-cell imaging and subcellular quantitative analysis. The frontier of single-cell imaging has advanced to the point where it is now possible to compare the chemical contents of individual organelles in terms of raw or normalized ion signal. However, to realize the full potential of this technology, it is necessary to move beyond this concept of relative quantification. Here we present a nanoSIMS imaging method that directly measures the absolute concentration of an organelle-associated, isotopically labeled, pro-drug directly from a mass spectrometry image. This is validated with a recently developed nanoelectrochemistry method for single organelles. We establish a limit of detection based on the number of isotopic labels used and the volume of the organelle of interest, also offering this calculation as a web application. This approach allows subcellular quantification of drugs and metabolites, an overarching and previously unmet goal in cell science and pharmaceutical development.
Keywords: nanoSIMS, mass spectrometry imaging, subcellular concentration, organelles, nanoscale
The concentration of metabolites and drugs in biological matrices is the principal read-out in the fields of metabolomics and pharmacokinetics. However, the typical format of these matrices—biofluids, tissue, and cell lysates—is not sufficient to further our understanding of biochemistry, particularly at the level of the single cell or organelle.1−3 While the cell is the basic unit of life, metabolic and disease-associated pathways are regulated at the subcellular level. Thus, it is important to measure concentrations of relevant molecules in subcellular compartments in order to better understand and modulate the biochemical environment of the intact cell.4−7
One contemporary method of visualizing subcellular domains is mass spectrometry imaging.2,8 Mass spectrometry imaging has been increasingly applied to investigate the organization of different biomolecules for fundamental studies of cell biology as well as in pharmaceutical and medical research. This bioimaging approach could be made even more powerful if it were possible to apply it to absolute quantification of biomolecules at the nanoscale level. Although approaches to absolutely quantify concentrations of metabolites and drugs at the nanoscale with mass spectrometry bioimaging are broadly important, this has remained a neglected area in the field3 owing to several substantial challenges, of which the major ones are a lack of appropriate standards and limited complementary techniques.
Nanoscale secondary ion mass spectrometry (nanoSIMS) imaging, in particular, offers an incredible opportunity here as Steinhauser and Lechene have previously articulated. The advantages are as follows: (i) the use of nontoxic labels, (ii) high spatial resolution, and (iii) the ability to quantify down to as low as 1 ppm over a wide dynamic range.9,10 These advantages have been exquisitely demonstrated by several groups who have shown subcellular distribution of drugs and metabolites in the context of the intact cell.11−17 Importantly, relative quantification18 has also been demonstrated at the subcellular level. For example, in an adipocyte model it was possible to quantify the amount of 13C-labeled fatty acid transferred from the extracellular space to cytoplasmic lipid droplets.19 This was done by assuming that the percentage 13C enrichment of each region could be scaled to the known 13C concentration of the incubation media. Relative quantification of exogenous isotopically labeled fatty acids and cholesterol has also been demonstrated by direct comparison of isotopic ratios, with added spatial resolution provided by back scattering electron microscopy.20−22 Additionally, incorporation and subsequent redistribution of an 15N-labeled nucleoside was tracked by imaging segregation of chromosomes during stem cell division. A relative comparison of isotopic ratios from labeled cells showed that the nucleosides were distributed randomly in stem cells.23 These previous works clearly show the enormous utility of carrying out subcellular measurements using nanoSIMS; however, all used relative quantification.
To assess more accurately the intracellular concentrations of drugs and metabolites, several methods have been developed that can be used to estimate the concentrations of compounds partitioned at the subcellular level.5−7 However, these methods rely on the perturbation of intact cells and tissue, and it is extremely difficult to gauge how these perturbations affect the measurement. The challenge in evaluating subcellular concentration in drug discovery, specifically for drug exposure at intracellular targets, is illustrated by the fact that 60% of the targets for FDA approved drugs are located on the cell membrane, where only 22% of proteins encoded in the human genome are found.24 This highlights that there is a critical opportunity beyond the cell membrane to access important therapeutic targets. Indeed, there is an increasing effort in drug discovery toward intracellular drug targets.4
To overcome the major challenges inherent in carrying out absolute quantitative imaging, an ideal standard consisting of a known amount of the analyte incorporated into the same matrix under investigation, termed “matrix matched”, should be used.25 For example, in the semiconductor industry known amounts of a dopant are implanted into the material of interest,26 whereas geologists utilize minerals from nature with well-characterized chemical compositions.27 In principle one can use a combination of both of these approaches to arrive at an isotopic ratio to concentration conversion.
In this work, we have set out to achieve absolute versus relative quantification of carbon species in subcellular mass spectrometry imaging. The foundation of this work is that a standard procedure for sample preparation of cells and tissues for nanoSIMS is to embed the biological material in epoxy. We have herein determined that epoxy is well matched to the cell biomass in terms of carbon concentration. This allows the use of a material science approach where we treat the entire embedded biomass as a matrix under analysis. Furthermore, we complement our measured concentration using a well-characterized biological system. Recently, the Ewing lab has devised an electrochemical method to quantify the electroactive content of individual secretory vesicles in situ in an individual cell. Since this measurement is performed in the correct biological context, the result is a more accurate representation of the real concentration contained within the vesicles8,28,29 and provides the necessary complementary approach for validation, albeit on an ensemble of vesicles where there is no imaging or individual sizing. Using nanoSIMS, we show that it is possible to determine a validated concentration of a pro-drug-derived compound at subcellular spatial resolution. This approach, validated with electrochemistry, is applicable to imaging a broad range of nonelectroactive as well as electroactive substances in specific identifiable organelles.
Results and Discussion
Definition of the Material (Resin-Embedded Cells)
The approach that we explored here was to treat the biological sample as a carbon material composed of a mixture of three components. Figure 1a shows the basic concept of a cell pellet embedded in epoxy resin; the pellet is then sectioned to a thickness between 300 nm and 1 μm as depicted in Figure 1b. Here, the three carbon-containing components are indicated as follows: yellow shows the epoxy resin, black is the biomass, and green shows the 13C-labeled drug or metabolite. In Figure 1c, we deconstruct the three carbon-containing components and emphasize that only the 13C-labeled drug or metabolite contributes to isotopic enrichment. Applying this model to the measurement of isotopic ratio, a measurement acquired from a part of the section outside of the cell material, exosomes or cellular debris, will reflect the isotopic ratio of the epoxy, while a measurement from inside the cell will reflect the isotopic ratio of the mixture of the epoxy and the biomass. We assume that the epoxy replaces all the water in the cell, and thus the majority of the carbon contributing to the intracellular isotopic measurement is derived from the epoxy since the cell consists of 60–70% water. Finally, any isotopic measurement of the 13C-labeled drug-metabolite-containing organelle will consist of all three components. The key to using this model for quantification lies in the ability to determine the contribution of each component, thus allowing the contribution of the 13C-labeled drug to be converted to a concentration.
Figure 1.

Three-component resin-embedded cell material. (a) Schematic of a resin-embedded cell pellet. (b) Schematic of a 300 nm to 1 μm thick section from a resin-embedded cell pellet. (c) Deconstruction of the three major carbon sources of the resin-embedded cell material: the epoxy, the biomass, and the 13C-labeled drug or metabolite, where the epoxy and the biomass have no enrichment in 13C and where the labeled drug will introduce 13C enrichment.
Optimization of NanoSIMS Parameters for the Resin-Embedded Cell Material
The first step toward understanding the relative contributions of the three-component system was to investigate carbon ion emission across individual resin-embedded cells. In order to make a precise isotopic measurement, one must consider mass resolution slit settings and transmission (see NanoSIMS Parameters), but potentially the most important requirement was that the secondary ion emission had to reach a steady state. We found that variations in the isotopic ratio in the transient state could be greater than 50‰. Figure 2 shows that a steady state in ion emission begins as the fluence approaches 1 × 10¹⁷ Cs+·cm–2. Thus, to ensure a high precision isotopic measurement of this material, implantation of 1 × 10¹⁷ Cs+·cm–2 was carried out before analysis.
Figure 2.
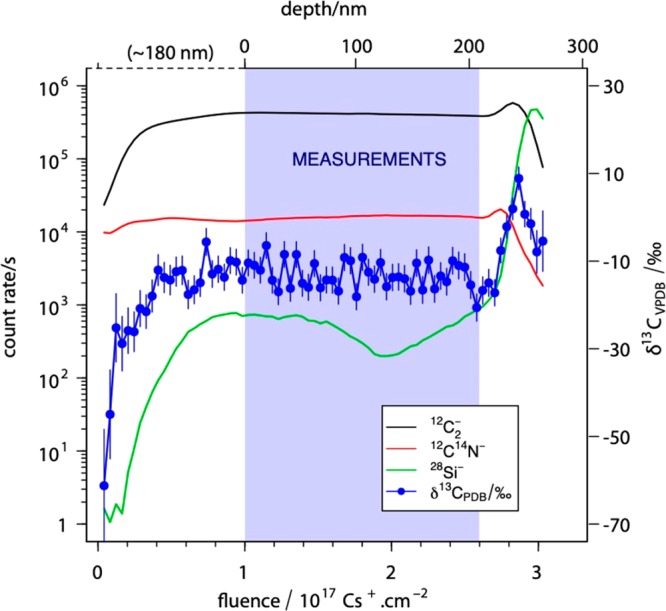
12C14N–, 12C2–, and 28Si– secondary ion count rates and δ13CVPDBvs Cs+ ion dose. During the first part of sputtering, the transient state (0 to 1017 Cs+·cm–2, from 0 to ∼180 nm depth), the sputtering rate changed. At steady state (>1017 Cs+·cm–2, >∼180 nm depth) the sputtering rate was constant, and it is in this region where measurements were performed until reaching the silicon wafer. Vpdb stands for the Vienna Pee Dee Belemnite standard.
Characterization of Resin-Embedded Cell Material
Using the optimized nanoSIMS parameters it was possible to routinely obtain images of resin-embedded cells, such as the example of a rat pheochromocytoma (PC12) cell shown in Figure 3. The primary observation here is that the C2– signal (Figure 3a) shows very little contrast between the epoxy and the cell region (epoxy + biomass) as compared to the CN– signal shown in Figure 3b. To further characterize this observation, we analyzed the ion yield of C2– and CN– relative to the frequency of the arrival of Cs+ ions, in other words the number of C2– or CN– ions measured for every Cs+ delivered to the surface. For all measurements in Figure 3c, the C2–/Cs+ ratios vary from 0.021 to 0.028 cps/cps within the 16–84% interval The specific regions in the image had similar ranges of 0.023 to 0.027 for epoxy regions, 0.021 to 0.029 for cytoplasm regions, 0.021 to 0.029 for the nucleus, and 0.021 to 0.031 for the dense regions in the nucleus that indicate the nucleolus. In contrast, Figure 3d shows that the CN–/Cs+ for all regions spans a wide range from 0.0008 to 0.015, while the yields from the specific regions scale with the inclusion of the embedded cell biomass. Thus, the lowest yield is from the epoxy, between 0.00075 and 0.00098, and the highest yield (0.015 to 0.0184) was measured in the nucleolus region, which logically contained a higher amount of biomass. It was found that while the biomass displaced the pure epoxy enough to increase the yield of CN– 20 times, the displacement did not greatly affect the ion yield of C2–. The observation that the 12C2– emission from the cell was similar to the 12C2– emission from the collective epoxy and biomass mixture supports the idea that the concentration of carbon in the resin-embedded cell material can be treated as a uniform carbon matrix containing areas of 13C-labeled drug-metabolite enrichment.
Figure 3.

Submicrometer scale variation in carbon signal. (a) Secondary ion image of 12C2–. (b) Secondary ion image on CN– across the resin-embedded cell material, scale in counts per second (Cps). (c) Box plots of C2–/Cs+ ratios measured across several regions for n = 5 embedded cells. (d) Box plots of CN−/Cs+ ratios measured across several regions for n = 5 embedded cells.
To determine if the comparable C2– ion emission resulted from an equimolar carbon concentration between the biological material and the resin, we carried out elemental analysis of both the epoxy resin (AGAR 100) and the biomass of the PC12 cells. The pie charts in Figure 4 demonstrate that the proportion of carbon is in fact quite similar, and when corrected for the density of each material, we find that each component has between 51.6 and 55.5 M carbon (see Supporting Information). Thus, the relative amount of each material does not greatly affect the general carbon density of the resin-embedded cell material, consistent with the uniformity we observed from the nanoSIMS image. However, in light of the fact that the two components are not identical, we refined the value to 54 M C by assuming a 70:30 ratio epoxy to biomass based on the approximate water content that was replaced by the epoxy. This greatly simplified the approach, as it was appropriate to treat this material as a two-component material, specifically a 54 M carbon concentration in the combined epoxy and biomass material, containing a trace amount of a 13C-labeled drug-metabolite. Thereafter, the enrichment from a 13C-labeled drug-metabolite was scaled relative to the 54 M carbon from the resin-embedded cell material to arrive at an absolute concentration.
Figure 4.

Elemental analysis of Agar100 epoxy resin and PC12 biomass. Elemental analysis and density, ρ, of AGAR 100 epoxy and PC12 biomass showing the contribution from each component. C, carbon; O, oxygen; S, sulfur; H, hydrogen content. (*Oxygen content was inferred for both materials, see Supporting Information 1 and 2, while the **biomass density was not measured but obtained from the literature.30)
The elemental analysis was also used to determine the atomic ratio of H:C for each component. The atomic ratio of hydrogen to carbon has been shown to influence matrix ionization effects. Specifically, the matrix effect for δ13C in organic material varies with a systematic error of 4‰ from graphite to highly aliphatic materials spanning a range of H:C ratios from 0 to 1.7.27 The epoxy and biomass give H:C ratios of 1.4 and 1.7, respectively. Over this range the systematic error is comparatively low when considering the precision of the nanoSIMS measurement (5–10‰).
Calculation of the Fraction of 13C-Labeled Drug or Metabolite in the Resin-Embedded Cell Material
Figure 1 shows that the 13C/12C ratio measured in a given region of interest (ROI) represents a mixture of the three components in various proportions (epoxy, biomass, and 13C-labeled drug/metabolite). The proportions of each component are linked to the isotopic ratio by a simple formula (eq 1), where each term (13/12Ccomponent) is the number of 13C or 12C isotopes in a given component.
| 1 |
After rearrangement of the equation above, the fraction of the 13C-labeled drug-metabolite (fdrug.met) is defined as the number of 12C contributed by the drug-metabolite divided by the total number of 12C. It is preferred to express fdrug.met in terms of 12C because it allows the ratios to be expressed in the standard form as a function of 13C/12C (see Supporting Information, part S2). Additionally, and as shown in Figure 1, the value of 13C/12Cepoxy is equal to 13C/12Cbiomass and therefore collapsed into a single term, which was defined as the control. Thus, fdrug.met is determined from the ratio measured from the ROI minus the ratio of the control divided by the true ratio of the drug-metabolite again minus the ratio of the control (eq 2). The true ratio of the drug-metabolite is obtained from the chemical formula. In the following experiments, 13C6-dopamine was used (Figure 5d), which contains six 13C and two 12C atoms; thus for 13C6-dopamine, fdrug.met is equal to 3.
 |
2 |
Figure 5.

Quantification of 13C-labeled dopamine in PC12 cell vesicles. (a) δ13C image of a single PC12 cell, which has undergone transporter-mediated uptake of 13C6-dopamine. (b) Depth projection of 28 ROIs indicated in (a). (c) A version eq 6 that displays the value of the 13Cdrug.met term is shown with the 13C6-dopamine molecule. (d) 28 vesicle images plotted with concentration on the z axis.
We simplified this expression by introducing the deviation of the isotopic ratio, δ13C, in parts-per-thousand or per mille (‰) relative to a reference. By convention, the reference is the Vienna Pee Dee Belemnite (VPDB) where rVPDB is equal to 0.0112372.31 This allows fdrug.met to be calculated by the product of the measured enrichment and a constant determined by the ratio of VPDB to the true ratio of the drug.
| 3 |
Here, rdrug.met is the isotopic ratio 13C/12Cdrug.met of the 13C-labeled drug/metabolite. To extract the absolute concentration from fdrug.met, we used our measurement of the homogeneous carbon density of 54 M in the resin-embedded cell material and that the concentration of the drug is relative to the number of 12C atoms in the drug-metabolite. This produces the simple relationship in eq 4, where the [drug_met] in mol/L is expressed as
| 4 |
Substituting the equation for fdrug.met in eq 1 into eq 4, the concentration in moles per liter from the measurements in per mille is obtained in eq 5. We note here that this substitution cancels the 12Cdrug.met term making 13Cdrug.met the relevant value.
| 5 |
For the specific case of dopamine in secretory vesicles, we input the number of 13C labels on the molecule where the enrichment is scaled using a constant (0.101) as shown in eq 6.
| 6 |
This expression shows that a carbon concentration of 54 M gives a 13C concentration of 0.606 M when standardized to VPDB, which is divided by 6 to account for the 6 13C atoms per drug molecule to finally give a factor of 0.101 for 13C6-dopamine. The concentration of the drug or metabolite, in the case of dopamine, can be expressed as the simple relationship where the difference between δ13CROIVPDB and δ13CcontrolVPDB in per mille is scaled by a factor that represents the concentration of 13C in the resin-embedded cell material divided by the number of 13C atoms in the drug or metabolite.
Quantification of 13C-Labeled Dopamine in PC12 Cell Vesicles
A two-dimensional isotopic image compiled from 50 planes through a PC12 cell is shown in Figure 5a. This image represents the δ13C in per mille, showing clearly that the 13C dopamine has been loaded into the PC12 cell vesicles via the vesicular monoamine transporter. To convert the enrichment to a concentration, we had to consider that the vesicle diameters are generally smaller than the thickness of the section. The two-dimensional accumulation image was therefore found to be cumbersome to use for a quantitative measurement, as it is impossible to accumulate a number of planes that could accommodate all the vesicles under investigation. Accumulation of planes ultimately created a dilution effect, leading to an underestimation of the concentration. Indeed, using this method we find the concentration of 13C6-dopamine is 30 ± 9 mM (Supporting Information Table S2 and Figure S2). To demonstrate this further, we compared the image to the depth profiles representing the 28 vesicles (Figure 5b). The concentration of the 13C-dopamine was calculated at different planes using eq 6, which is also displayed in Figure 5c. Here, we found that the maximum values in depth were as much as double the maxima found in the accumulated image. We also found the profiles were both symmetric and asymmetric, thus indicating a partitioning of the 13C-dopamine. In addition, Figure 5d presents surface plots where the appropriate planes for each vesicle were accumulated based on the depth profiles from Figure 5b. These plots show that the peak values, over a range of 20–80 mM 13C-dopamine, did not distribute evenly across the vesicle, but instead formed a concentration gradient where there is an accumulation at a hot spot, thought to be the location of the protein dense core, inside the vesicle. This is also supported by our previous findings.11
Validation of Quantification of 13C-Labeled Dopamine in PC12 Cell Vesicles
The secretory vesicles of PC12 cells are an ideal model to validate this method, as they are structures at the 100 nm scale containing a high concentration of dopamine and are suitable for quantitative nanoSIMS imaging at high spatial resolution. Most importantly, the concentration of catecholamine in nanometer vesicles can be calculated with electrochemistry to determine the molecular quantity in individual vesicles32,33,36 divided by a mean vesicular volume. This provides a benchmark by which to validate our quantitative nanoSIMS approach. Electrochemical experiments indicate that while the number of molecules per vesicle can vary, especially following l-DOPA treatment, the concentration is largely conserved, presumably due to a swelling of the vesicle to accommodate a larger number of molecules.34 The box plots in Figure 6b show the comparison between electrochemical measurements36 and the nanoSIMS measurements presented in Figure 5. To make this comparison, we needed to define the perimeter of the vesicle so as not to underestimate the concentration. The small size of the vesicle makes this challenging. Specifically, the diameter of the Cs+ analysis beam is comparable to the diameter of the vesicle, making it virtually impossible to avoid some degree of dilution associated with the primary ion source, known as beam mixing. Thus, we defined four regions as illustrated in Figure 6a. From the depth profile we averaged the values at 50%, 75%, and 90% of the maximum and took the value at the maximum. Although the mean concentration trends upward for these cross sections, as we move from 50% to the maximum in order to minimize the contribution of beam mixing (Figure 6b), the values are not statistically different from the spread in the averaged concentrations found using electrochemistry. Furthermore, a histogram of vesicle number versus concentration (Figure 6c) shows clear overlap between the methods (histograms of nanoSIMS data for the other values are shown in the SI, Figure S3). It is important to realize that there is a range of vesicle content between different PC12 cell populations, and we are well within this range. We further sought to minimize beam mixing by analyzing the same vesicles using a standard and a reduced diameter ion probe. By reducing the D1 aperture from 200 μm (D1_3) to 100 μm (D1_5) the primary current can be reduced by a factor of 4 to provide a smaller albeit less intense primary ion beam. We present images in Figure S4a and S4b to show that, in addition to the increased spatial resolution, the vesicle signal is more intense when using a reduced probe size. When comparing the individual vesicles, we find that in all cases the higher resolution vesicle measurements give a higher value (Figure S4c), indicative of a reduction in beam mixing. This is also shown with box plots for the mean values in Figure S4d, where the standard probe ROIs have a median value of 30.5 mM with a range from 17 to 39 mM. This is similar to the value measured for the accumulated images (as shown in Figure S2) measured under identical comparable conditions. The reduced probe, by comparison, shows a median value of 53.5 over a spread from 47 to 81 mM and is similar to the results found for the maximum values extracted from the depth profile and the electrochemical measurement. The intensive property of the nanoSIMS measurements shows that it directly measures the concentration of dopamine and does not rely on subsequent estimation of the vesicle volumes.
Figure 6.

Concentration comparisons with electrochemistry measurements. (a) Concentration depth profile showing how concentration was determined for each percentage. (b) Box plots of the calculated concentrations from 50%, 75%, 90%, and the maximum concentration through the depth of vesicle (n = 28 for these measurements and error bars are standard deviation), compared to spread across 84 measurements of averaged vesicle content using electrochemistry. (c) Histogram of the number of individual vesicles vs concentration at the maximum of the depth profiles shown in Figure 5b for 13C dopamine (blue, nanoSIMS) and 84 measurements of the concentration of native 12C dopamine (red, echem).
Detection Limit of 13C-Labeled Drugs and Metabolites
To this point, we have discussed measuring absolute concentrations of drugs or metabolites in cellular nanostructures. An important consideration of any concentration determination is, what is the lower detection limit? The detection limit of the drug/metabolite in a given volume is defined here simply as its minimum detectable enrichment within a 16–84% (1 sigma) confidence interval. Mathematically, the definition of a detectable enrichment is the condition where the enrichment minus its own uncertainty ε is above 0‰ as (δ13CROIVPDB – δ13CcontrolVPDB) – ε > 0. This definition of the detection limit is based on intrinsic measurement of the isotopic ratio rather than the usual measurement of the precision of extrinsic parameters, such as a relative sensitivity factor or more generally the use of calibration curves.
The collection of the measured ions, the 12C2– and 13C12C– ions, counts 12C2– and 13C12C– ion arrivals at the detectors for a given period of time. This results in a variation in count rate for a given ion species that follows a Poisson distribution. This distribution appears when the ion arrivals to a detector of the nanoSIMS are constant yet rare in time.35,36 An important property of the Poisson distribution is its standard deviation equals the square root of its mean. The destructive nature of SIMS forces the assumption that the total number of collected ions sputtered from a given volume is only measured once and is a good estimation of the average contribution. Both the denominator and numerator of an isotopic ratio in a given volume have their respective uncertainties equal to the square root of their total collected counts. The uncertainty of an isotopic ratio is obtained by propagating the uncertainties quadratically from the total number of counts for both the numerator and denominator. The relative variation of the total number of counts in the most abundant ion, 12C2–, is negligible in relation to the rarest events (13C12C–). As a result, the uncertainty (ε) on the enrichment (δ13CROIVPDB – δ13CcontrolVPDB) simply equals 1000/√(∑13C12C–) where ∑13C12C– is the total number of 13C12C– collected in a given volume. Consequently, the larger the volume of the sample, the lower the uncertainty.
In a homogeneous carbon material, like the embedding epoxy, the number of 13C12C– ions sputtered away in a given volume is always constant. The volume (VROI) in which the isotopic ratio is measured is defined by the area of the ROI and the depth sputtered or the number of cycles selected by the operator. In a chemically homogeneous material like the epoxy, the depth sputtered away can be controlled by adjusting the sputter time and primary current of a given measurement and knowing the sputtering rate(s) of the material. The sputtering rate of the epoxy is measured here in the steady state regime, where it is constant (it varies by orders of magnitude in the transient state37). As a composite parameter, the sputtering rate is expressed as the depth excavated into the sample in nanometers for a given unit primary ion current and time within a unit area. The volume, VROI, is sputtered away with a time, tROI, given in seconds within a chosen ROI with a primary current, Ip, in pA, as shown in eq 7.
| 7 |
The total number of counts of ∑13C12C– is simply the count rate (Cps) of 13C12C– times the time (tROI) required to sputter away a given volume. The ∑13C12C– is expressed in eq 8 from the volume VROI and their common factor, tROI, from eq 7.
| 8 |
The uncertainty of the enrichment in 13C/12C of a given volume is expressed in eq 9.
| 9 |
Here, the ratio of primary current over secondary current, Ip/Cps, is fixed for a given type of epoxy and the nanoSIMS settings (transmission and detection). The sputtering rate is fixed for a given material and for primary ion energy and angle of incidence. As a consequence, again assuming that all parameters are fixed, the uncertainty of a given enrichment depends mainly on the analyzed volume. Then the detection limit in mM is obtained by combining eq 6 and eq 9 to give eq 10.
| 10 |
To better illustrate this concept, we have developed a web application tool to determine the concentration detection limit for nanometer cell applications. This tool is freely available at http://molcat.it.gu.se. The application was developed to model the feasibility of imaging labeled drugs and metabolites for researchers that may not be familiar with nanoSIMS parameters, and thus it has only three basic inputs. The output for the app is a plot of sampling depth vs uncertainty in concentration. Figure 7 shows how the molecular content calculator can be used to design a 13C6-dopamine measurement for a 200 nm vesicle. The first input is six 13C per dopamine molecule, the diameter of the target structure is set to 200 nm, and in this instance the section thickness entered is 300 nm. The first 180 nm of the section will be eroded during implantation and is plotted below the zero line. The predicted uncertainty is plotted with respect to the remaining section depth. Three simulated measurements are shown in Figure 7. The first point with an uncertainty at 3 ± 2.7 mM would be difficult to detect at the shallow depth, whereas the second at 6 ± 0.9 mM would be detectable at a reasonable depth and a higher concentration. The ideal scenario is the third measurement, with a large depth and a high concentration of 10 ± 0.7 mM. However, at such a high concentration, this tool also shows that it is not necessary to probe to such a great depth, allowing for the estimation of the time required for a sufficiently sensitive quantitative measurement. This shows that even at shallow depths of under 50 nm, the detection limit for 13C6-dopamine will be on the order of 1 mM and would be easily detectable in vesicles at the reported concentrations of approximately 60 mM.38
Figure 7.

Detection limit calculator. Screenshot of the 13C-labeled molecular content calculator available at http://molcat.it.gu.se. The user inputs the number 13C contained in the drug or metabolite, the diameter of the structure of interest, and the thickness of the resin-embedded cell material. The output is an interactive plot of the predicted uncertainty in concentration with respect to the depth of the material probed. Double clicking on the plot will produce a concentration measurement with a predicted uncertainty.
Conclusions
The development of this approach to measure accurate concentrations from nanoSIMS images provides several important insights and possibilities. The first is the observation that the epoxy used for embedding the cells under analysis is well matched to the carbon content of the cell biomass. This is highly useful, as the proportion of each material does not greatly affect the concentration of carbon in the area analyzed. This is evident from the nanoSIMS image, where there are only slight variations in the carbon ion emission from the epoxy relative to the embedded biomass. The decisive finding in this work has been that the concentration measured in the resin-embedded cell material is an accurate representation of what is found in cell substructures before the sample preparation. This has been verified with electrochemical measurements, which were performed on PC12 cells and show that the concentration of dopamine in vesicles of these cells is found at the range of 60 mM, the same range we measure with our quantitative nanoSIMS method. The third point is that the limit of detection is primarily attenuated not by ionization efficacy but rather by the background concentration of 13C in the resin-embedded cell material. This background is determined to be on the order of 600 mM. Consequently, an isotopic measurement with a precision of 10‰ will translate to a limit of detection of approximately 6 mM or in the case of a molecule such as 13C6-dopamine, with six labeled atoms, a concentration limit of detection of 1 mM. This also shows that the utility of 13C-labeled drug-metabolites is limited to compounds at or above this concentration, which typically is achieved when they are highly concentrated in small cellular structures.
The work presented here provides a template for absolute subcellular quantitative SIMS imaging of drugs and metabolites. We aim to make our approach accessible to biologists and chemists who want to image epoxy embedded samples but are not accustomed to nanoSIMS parameters. To this end we have established a limit of detection based on the number of 13C labels incorporated in the target analyte and the volume of the structure of interest. This calculation is available in the form of a freely available web application.
It should be noted that quantification of 13C-labeled dopamine was feasible owing to the susceptibility of the analyte to fixation during sample preparation. Dopamine contains a primary amine, which is aldehyde fixable and is not cleared away despite being a small metabolite. Thus, optimization of sample preparation for other samples is still important. Up to this point there has not been an accurate way to determine the retention of analyte for a given sample preparation method, but our results show retention is extensive for dopamine in cellular vesicles. The approach we present to obtain the actual concentration of small molecules in nanometer compartments should enable quantitative experiments in nanoSIMS imaging. This is an important first step that will allow the use of nanoSIMS both for determining the spatial distribution of drugs and metabolites in subcellular regions and organelles and for measuring their concentration and for spatial distribution in subcellular regions and organelles, a critical advance needed in the areas of pharmacokinetics and metabolomics.
Methods
Cell Culture and l-DOPA Treatment
PC12 cells were cultured as previously described39 and were plated in T-75 flasks coated with collagen IV (Falcon, Fisher Scientific, Sweden) for 5–6 days to obtain confluence (approximately 2.2 million cells/plate). The PC12 cells were treated with stable isotope labeled l-3,4-dihydroxyphenylalanine (l-DOPA) (99%, 13C6-dopamine, Cambridge Isotope Laboratories Inc., MA, USA) for the nanoSIMS experiments and unlabeled l-DOPA (Sigma-Aldrich, Sweden) for the electrochemistry measurements. Both l-DOPA solutions were prepared as stock solutions in phosphate-buffered saline, PBS (Sigma-Aldrich, Sweden), in the dark and with a simultaneous argon purge (6.0, AGA Sweden). A final l-DOPA solution with a concentration of 150 μM was obtained by diluting the stock solution in warm cell media. Cells were treated for 12 h with l-DOPA. Treatments were done in an incubator at 37 °C in a water-saturated atmosphere containing 5% CO2. The PC12 cells were then washed two times with Dulbecco’s PBS without calcium or magnesium (Sigma-Aldrich, Sweden), enzymatically harvested with TrypLE Express (Gibco, Fisher Scientific, Sweden), then resuspended in PBS before chemical fixation.
Chemical Fixation and Embedding
The PC12 cells were incubated at 4 °C overnight in a modified Karnovsky fixative40 containing 0.01% sodium azide (BDH, UK), 1% formaldehyde (Sigma-Aldrich, Sweden), and 1.25% glutaraldehyde (Agar Scientific Ltd., UK). Cells were then washed with 150 mM sodium cacodylate buffer (Agar Scientific Ltd., UK) and postfixed using 1% osmium tetroxide (Agar Scientific Ltd., UK) at 4 °C for 2 h followed by 0.5% uranyl acetate (Merck, Sigma-Aldrich, Sweden) at room temperature in the dark for 1 h. Postfixation was done, as samples sometimes are used for transmission electron microscopy, but not in this study. Thereafter dehydration was performed using rising concentrations of ethanol (70%, 85%, 95%, and 99.5%) followed by 100% acetone. Embedding was done in Agar 100 resin (Agar Scientific Ltd., UK). Sections of 300 nm to 1 μm thick were cut using a Leica EM UC6 ultramicrotome and then placed onto Formvar-coated copper grids (FCF200F1-Cu, EMS, USA). Poststaining of the samples using uranyl acetate and Reynolds lead citrate was performed directly on the grids.41
NanoSIMS Parameters
The measurements were performed using a 16 keV Cs+ beam of ∼2 pA (D1_2) and a spatial resolution of 150 nm (normal probe) or using a 16 keV Cs+ beam of ∼0.5 pA (D1_5) and a spatial resolution of <100 nm (reduced probe). The transmission was set up at 35% and a mass resolving power of 10 000 (CAMECA definition) to ensure proper interference separation with an entrance slit of 15 μm width, an aperture slit of 150 μm width, and the energy slit full open. The saturation fluence of 1017Cs+·cm–2 was implanted prior to each measurement. ROIs were identified in the images by manual thresholding the features of vesicles in the images and then depth profiling to confirm.
Vesicle Impact Electrochemical Cytometry (VIEC)
To carry out VIEC, 33 μm diameter carbon fiber disk-shaped electrodes were placed in concentrated PC12 vesicle stock solution and allowed to stand for 10 min at 4 °C. The electrodes were then transferred to homogenizing buffer (381 mOsm/kg, contains 0.3 M sucrose, 1 mM EDTA, 1 mM MgSO4, 10 mM HEPES, 10 mM KCl, and cOmplete Protease Inhibitor) for 10 min at 37 °C to record VIEC events. The electrodes were rebeveled and reloaded with vesicles for each experimental run. The electrochemical recording of individual vesicular content was performed by applying a constant potential of +700 mV (vs Ag/AgCl) to the working electrode using a potentiostat (Axopatch 200B, Molecular Devices, Sunnyvale, CA, USA). Signals were filtered at 2 kHz using a 4-pole Bessel filter and digitized at 10 kHz using a Digidata model 1440A instrument with Axoscope 10.3 software (Axon Instruments Inc., Sunnyvale, CA, USA). Amperometric trace processing was done with IgorPro 6.22 software from Columbia University.42 The current was filtered at 1 kHz (binomial sm.). Peak detection was at a threshold five times the standard deviation of the noise. Traces of peaks were inspected, and false positives were manually rejected. Only experimental runs with more than 20 peaks were used in the analysis in order to minimize the variance of the means.
Acknowledgments
We thank Lisa Orrstam from Pharmaceutical Science at AstraZeneca for her help with the density measurement of the epoxy, Stefan Gustafson at Chalmers University of Technology for elemental analysis of the materials in this work, Magnus Norling and Martin Burman from the IT Operations unit of Gothenburg University for their assistance in setting up the web application, and Amanda Halme from Product Development at AstraZeneca for her assistance with AFM. We also thank Jelena Lovrić for the multitude of resin-embedded cells she processed. NanoSIMS measurements were obtained at the Chemical Imaging Infrastructure, University of Gothenburg and Chalmers University of Technology. Funding for the work was, in part, from the European Research Council, the Knut and Alice Wallenberg Foundation, and the Swedish Vetenskapsrådet. N.N. and E.K. are funded by the AstraZeneca post doc program.
Supporting Information Available
The Supporting Information is available free of charge at https://pubs.acs.org/doi/10.1021/acsnano.9b09804.
Additional information (PDF)
Author Contributions
A.T., N.P., P.M., M.K., S.A., M.E.K., and A.G.E. designed the research. A.T., N.N., F.P., X.L., E.K., P.P.U., M.E.K. carried out the research. A.T. and M.E.K. developed the quantification application. A.T., P.M., E.K., N.P., M.E.K., and A.G.E. wrote and edited the manuscript. All authors have given approval to the final version of the manuscript.
The authors declare no competing financial interest.
Supplementary Material
References
- Monro A. M. Interspecies Comparisons in Toxicology: The Utility and Futility of Plasma Concentrations of the Test Substance. Regul. Toxicol. Pharmacol. 1990, 12, 137–160. 10.1016/S0273-2300(05)80055-8. [DOI] [PubMed] [Google Scholar]
- Nilsson A.; Goodwin R. J. A.; Shariatgorji M.; Vallianatou T.; Webborn P. J. H.; Andrén P. E. Mass Spectrometry Imaging in Drug Development. Anal. Chem. 2015, 87, 1437–1455. 10.1021/ac504734s. [DOI] [PubMed] [Google Scholar]
- Dollery C. T. Intracellular Drug Concentrations. Clin. Pharmacol. Ther. 2013, 93, 263–236. 10.1038/clpt.2012.240. [DOI] [PubMed] [Google Scholar]
- Hann M. M.; Simpson G. L. Intracellular Drug Concentration and Disposition--The Missing Link?. Methods 2014, 68, 283–285. 10.1016/j.ymeth.2014.05.009. [DOI] [PubMed] [Google Scholar]
- Mateus A.; Gordon L. J.; Wayne G. J.; Almqvist H.; Axelsson H.; Seashore-Ludlow B.; Treyer A.; Matsson P.; Lundback T.; West A.; Hann M. M.; Artursson P. Prediction of Intracellular Exposure Bridges the Gap between Target- and Cell-Based Drug Discovery. Proc. Natl. Acad. Sci. U. S. A. 2017, 114, E6231–E6239. 10.1073/pnas.1701848114. [DOI] [PMC free article] [PubMed] [Google Scholar]
- Friden M.; Bergstrom F.; Wan H.; Rehngren M.; Ahlin G.; Hammarlund-Udenaes M.; Bredberg U. Measurement of Unbound Drug Exposure in Brain: Modeling of pH Partitioning Explains Diverging Results between the Brain Slice and Brain Homogenate Methods. Drug Metab. Dispos. 2011, 39, 353–362. 10.1124/dmd.110.035998. [DOI] [PubMed] [Google Scholar]
- Friden M.; Ducrozet F.; Middleton B.; Antonsson M.; Bredberg U.; Hammarlund-Udenaes M. Development of a High-Throughput Brain Slice Method for Studying Drug Distribution in the Central Nervous System. Drug Metab. Dispos. 2009, 37, 1226–1233. 10.1124/dmd.108.026377. [DOI] [PubMed] [Google Scholar]
- Phan N. T.; Li X.; Ewing A. G. Measuring Synaptic Vesicles Using Cellular Electrochemistry and Nanoscale Molecular Imaging. Nat. Rev. Chem. 2017, 1, 1–18. 10.1038/s41570-017-0048. [DOI] [Google Scholar]
- Steinhauser M. L.; Lechene C. P. Quantitative Imaging of Subcellular Metabolism with Stable Isotopes and Multi-Isotope Imaging Mass Spectrometry. Semin. Cell Dev. Biol. 2013, 24, 661–667. 10.1016/j.semcdb.2013.05.001. [DOI] [PMC free article] [PubMed] [Google Scholar]
- Hoppe P.; Cohen S.; Meibom A. Nano SIMS: Technical Aspects and Applications in Cosmochemistry and Biological Geochemistry. Geostand. Geoanal. Res. 2013, 37, 111–154. 10.1111/j.1751-908X.2013.00239.x. [DOI] [Google Scholar]
- Lovric J.; Dunevall J.; Larsson A.; Ren L.; Andersson S.; Meibom A.; Malmberg P.; Kurczy M. E.; Ewing A. G. Nano Secondary Ion Mass Spectrometry Imaging of Dopamine Distribution across Nanometer Vesicles. ACS Nano 2017, 11, 3446–3455. 10.1021/acsnano.6b07233. [DOI] [PubMed] [Google Scholar]
- Jiang H.; Passarelli M. K.; Munro P. M.; Kilburn M. R.; West A.; Dollery C. T.; Gilmore I. S.; Rakowska P. D. High-Resolution Sub-Cellular Imaging by Correlative NanoSIMS and Electron Microscopy of Amiodarone Internalisation by Lung Macrophages as Evidence for Drug-Induced Phospholipidosis. Chem. Commun. (Cambridge, U. K.) 2017, 53, 1506–1509. 10.1039/C6CC08549K. [DOI] [PubMed] [Google Scholar]
- Passarelli M. K.; Pirkl A.; Moellers R.; Grinfeld D.; Kollmer F.; Havelund R.; Newman C. F.; Marshall P. S.; Arlinghaus H.; Alexander M. R.; West A.; Horning S.; Niehuis E.; Makarov A.; Dollery C. T.; Gilmore I. S. The 3D OrbiSIMS-Label-Free Metabolic Imaging with Subcellular Lateral Resolution and High Mass-Resolving Power. Nat. Methods 2017, 14, 1175–1183. 10.1038/nmeth.4504. [DOI] [PubMed] [Google Scholar]
- Legin A. A.; Schintlmeister A.; Jakupec M. A.; Galanski M.; Lichtscheidl I.; Wagner M.; Keppler B. K. NanoSIMS Combined with Fluorescence Microscopy as a Tool for Subcellular Imaging of Isotopically Labeled Platinum-Based Anticancer Drugs. Chem. Sci. 2014, 5, 3135–3143. 10.1039/c3sc53426j. [DOI] [PMC free article] [PubMed] [Google Scholar]
- Lee R. F.; Escrig S.; Croisier M.; Clerc-Rosset S.; Knott G. W.; Meibom A.; Davey C. A.; Johnsson K.; Dyson P. J. NanoSIMS Analysis of an Isotopically Labelled Organometallic Ruthenium (II) Drug to Probe Its Distribution and State In Vitro. Chem. Commun. (Cambridge, U. K.) 2015, 51, 16486–16489. 10.1039/C5CC06983A. [DOI] [PubMed] [Google Scholar]
- Wedlock L. E.; Kilburn M. R.; Liu R.; Shaw J. A.; Berners-Price S. J.; Farrell N. P. NanoSIMS Multi-Element Imaging Reveals Internalisation and Nucleolar Targeting for a Highly-Charged Polynuclear Platinum Compound. Chem. Commun. (Cambridge, U. K.) 2013, 49, 6944–6946. 10.1039/c3cc42098a. [DOI] [PMC free article] [PubMed] [Google Scholar]
- Lee R. F.; Riedel T.; Escrig S.; Maclachlan C.; Knott G. W.; Davey C. A.; Johnsson K.; Meibom A.; Dyson P. J. Differences in Cisplatin Distribution in Sensitive and Resistant Ovarian Cancer Cells: A TEM/NanoSIMS Study. Metallomics 2017, 9, 1413–1420. 10.1039/C7MT00153C. [DOI] [PubMed] [Google Scholar]
- Ostrowski S. G.; Kurczy M. E.; Roddy T. P.; Winograd N.; Ewing A. G. Secondary Ion MS Imaging to Relatively Quantify Cholesterol in the Membranes of Individual Cells from Differentially Treated Populations. Anal. Chem. 2007, 79, 3554–3560. 10.1021/ac061825f. [DOI] [PMC free article] [PubMed] [Google Scholar]
- Kleinfeld A. M.; Kampf J. P.; Lechene C. Transport of 13C-Oleate in Adipocytes Measured Using Multi Imaging Mass Spectrometry. J. Am. Soc. Mass Spectrom. 2004, 15, 1572–1580. 10.1016/j.jasms.2004.07.010. [DOI] [PubMed] [Google Scholar]
- He C.; Fong L. G.; Young S. G.; Jiang H. NanoSIMS Imaging: An Approach for Visualizing and Quantifying Lipids in Cells and Tissues. J. Invest. Med. 2017, 65, 669–672. 10.1136/jim-2016-000239. [DOI] [PMC free article] [PubMed] [Google Scholar]
- He C.; Hu X.; Jung R. S.; Weston T. A.; Sandoval N. P.; Tontonoz P.; Kilburn M. R.; Fong L. G.; Young S. G.; Jiang H. High-Resolution Imaging and Quantification of Plasma Membrane Cholesterol by NanoSIMS. Proc. Natl. Acad. Sci. U. S. A. 2017, 114, 2000–2005. 10.1073/pnas.1621432114. [DOI] [PMC free article] [PubMed] [Google Scholar]
- He C.; Weston T. A.; Jung R. S.; Heizer P.; Larsson M.; Hu X.; Allan C. M.; Tontonoz P.; Reue K.; Beigneux A. P.; Ploug M.; Holme A.; Kilburn M.; Guagliardo P.; Ford D. A.; Fong L. G.; Young S. G.; Jiang H. NanoSIMS Analysis of Intravascular Lipolysis and Lipid Movement across Capillaries and into Cardiomyocytes. Cell Metab. 2018, 27, 1055–1066. 10.1016/j.cmet.2018.03.017. [DOI] [PMC free article] [PubMed] [Google Scholar]
- Steinhauser M. L.; Bailey A. P.; Senyo S. E.; Guillermier C.; Perlstein T. S.; Gould A. P.; Lee R. T.; Lechene C. P. Multi-Isotope Imaging Mass Spectrometry Quantifies Stem Cell Division and Metabolism. Nature 2012, 481, 516–519. 10.1038/nature10734. [DOI] [PMC free article] [PubMed] [Google Scholar]
- Overington J. P.; Al-Lazikani B.; Hopkins A. L. How Many Drug Targets Are There?. Nat. Rev. Drug Discovery 2006, 5, 993–996. 10.1038/nrd2199. [DOI] [PubMed] [Google Scholar]
- Davission M.; Weber P.; Pett-Ridge J.; Singer S.. Development of Standards for NanoSIMS Analyses of Biological Materials; LLNL-TR-406039; Lawrence Livermore National Lab (LLNL): Livermore, CA, USA, 2008. [Google Scholar]
- Wilson R.; Novak S. Systematics of Secondary-Ion-Mass Spectrometry Relative Sensitivity Factors versus Electron Affinity and Ionization Potential for a Variety of Matrices Determined from Implanted Standards of More Than 70 Elements. J. Appl. Phys. 1991, 69, 466–474. 10.1063/1.347687. [DOI] [Google Scholar]
- Sangély L.; Chaussidon M.; Michels R.; Huault V. Microanalysis of Carbon Isotope Composition in Organic Matter by Secondary Ion Mass Spectrometry. Chem. Geol. 2005, 223, 179–195. 10.1016/j.chemgeo.2005.06.001. [DOI] [Google Scholar]
- Li X.; Majdi S.; Dunevall J.; Fathali H.; Ewing A. G. Quantitative Measurement of Transmitters in Individual Vesicles in the Cytoplasm of Single Cells with Nanotip Electrodes. Angew. Chem., Int. Ed. 2015, 54, 11978–11982. 10.1002/anie.201504839. [DOI] [PMC free article] [PubMed] [Google Scholar]
- Ren L.; Mellander L. J.; Keighron J.; Cans A.-S.; Kurczy M. E.; Svir I.; Oleinick A.; Amatore C.; Ewing A. G.. The Evidence for Open and Closed Exocytosis as the Primary Release Mechanism. Q. Rev. Biophys. 2016, 49, 10.1017/S0033583516000081. [DOI] [PubMed] [Google Scholar]
- Howard J.Mass, Stiffness, and Damping of Proteins. Mechanics of Motor Proteins and the Cytoskeleton 1; 1Sinauer Associates, Inc: MA, 2001; Vol. 1, p 30. [Google Scholar]
- Craig H. Isotopic Standards for Carbon and Oxygen and Correction Factors for Mass-Spectrometric Analysis of Carbon Dioxide. Geochim. Cosmochim. Acta 1957, 12, 133–149. 10.1016/0016-7037(57)90024-8. [DOI] [Google Scholar]
- Majdi S.; Berglund E. C.; Dunevall J.; Oleinick A. I.; Amatore C.; Krantz D. E.; Ewing A. G. Electrochemical Measurements of Optogenetically Stimulated Quantal Amine Release from Single Nerve Cell Varicosities in Drosophila Larvae. Angew. Chem. 2015, 127, 13813–13816. 10.1002/ange.201506743. [DOI] [PMC free article] [PubMed] [Google Scholar]
- Li X.; Majdi S.; Dunevall J.; Fathali H.; Ewing A. G. Quantitative Measurement of Transmitters in Individual Vesicles in the Cytoplasm of Single Cells with Nanotip Electrodes. Angew. Chem., Int. Ed. 2015, 54, 11978–11982. 10.1002/anie.201504839. [DOI] [PMC free article] [PubMed] [Google Scholar]
- Colliver T. L.; Pyott S. J.; Achalabun M.; Ewing A. G. VMAT-Mediated Changes in Quantal Size and Vesicular Volume. J. Neurosci. 2000, 20, 5276–5282. 10.1523/JNEUROSCI.20-14-05276.2000. [DOI] [PMC free article] [PubMed] [Google Scholar]
- Fitzsimons I.; Harte B.; Clark R. SIMS Stable Isotope Measurement: Counting Statistics and Analytical Precision. Mineral. Mag. 2000, 64, 59–84. 10.1180/002646100549139. [DOI] [Google Scholar]
- Ulianov A.; Müntener O.; Schaltegger U. The ICPMS Signal as a Doubly Stochastic Poisson Process. J. Anal. At. Spectrom. 2015, 30, 1297–1321. 10.1039/C4JA00319E. [DOI] [Google Scholar]
- Gates S. D.; Condit R. C.; Moussatche N.; Stewart B. J.; Malkin A. J.; Weber P. K. High Initial Sputter Rate Found for Vaccinia Virions Using Isotopic Labeling, NanoSIMS, and AFM. Anal. Chem. 2018, 90, 1613–1620. 10.1021/acs.analchem.7b02786. [DOI] [PubMed] [Google Scholar]
- Li X.; Dunevall J.; Ewing A. G. Electrochemical Quantification of Transmitter Concentration in Single Nanoscale Vesicles Isolated from PC12 Cells. Faraday Discuss. 2018, 210, 353–364. 10.1039/C8FD00020D. [DOI] [PubMed] [Google Scholar]
- Kozminski K. D.; Gutman D. A.; Davila V.; Sulzer D.; Ewing A. G. Voltammetric and Pharmacological Characterization of Dopamine Release from Single Exocytotic Events at Rat Pheochromocytoma (PC12) Cells. Anal. Chem. 1998, 70, 3123–3130. 10.1021/ac980129f. [DOI] [PubMed] [Google Scholar]
- Karnovsky M.; J A. Formaldehyde-glutaraldehyde Fixative of High Osmolality for Use in Electron Microscopy. J. Cell Biol. 1965, 27, 137–138A. [Google Scholar]
- Reynolds E. S. The Use of Lead Citrate at High pH as an Electron-Opaque Stain in Electron Microscopy. J. Cell Biol. 1963, 17, 208–212. 10.1083/jcb.17.1.208. [DOI] [PMC free article] [PubMed] [Google Scholar]
- Mosharov E. V.; Sulzer D. Analysis of Exocytotic Events Recorded by Amperometry. Nat. Methods 2005, 2, 651–658. 10.1038/nmeth782. [DOI] [PubMed] [Google Scholar]
Associated Data
This section collects any data citations, data availability statements, or supplementary materials included in this article.