

Abstract
Polycystic ovary syndrome (PCOS) is associated with high rates of obesity and metabolic dysfunction. Repeated passive heat exposure (termed heat therapy) is a novel lifestyle intervention for improving health in obese women with PCOS. The purpose of this study was to examine changes in metabolic function in obese women with PCOS following heat therapy. Eighteen age- and BMI-matched obese women with PCOS (age: 27 ± 1 yr, BMI: 41.3 ± 1.1 kg/m−2) were assigned to heat therapy (HT) or time control (CON). HT participants underwent 30 one-hour hot tub sessions over 8–10 wk, while CON participants completed all testing but did not undergo heat therapy. Before (Pre), at the mid-point (Mid), and following (Post) 8–10 wk of heat therapy, metabolic health was assessed using a 2-h oral glucose tolerance test, a subcutaneous abdominal fat biopsy (Pre-Post only), and other blood markers relating to metabolic function. HT participants exhibited improved fasting glucose (Pre: 105 ± 3, Post: 89 ± 5mg/dl; P = 0.001), glucose area under the curve (AUC) (Pre: 18,698 ± 1,045, Post: 16,987 ± 1,017 mg·dl−1·min−1; P = 0.028) and insulin AUC (Pre: 126,924 ± 11,730, Post: 91,233 ± 14,429 IU l−1·min−1; P = 0.012). Adipocyte insulin signaling (p-AKT at Ser-473 with 1.2 nM insulin) increased in HT (Pre: 0.29 ± 0.14, Post: 0.93 ± 0.29 AU; P = 0.021). Additionally, serum testosterone declined in HT participants (Pre: 51 ± 7, Post: 34 ± 4 ng/dl; P = 0.033). No parameters changed over time in CON, and no change in BMI was observed in either group. HT substantially improved metabolic risk profile in obese women with PCOS. HT also reduced androgen excess and may improve PCOS symptomology.
Keywords: adipose tissue inflammation, heat shock protein, insulin resistance, passive heating
INTRODUCTION
Polycystic ovary syndrome (PCOS) is a complex neuroendocrine disorder that affects up to 15% of women (18, 56) and is characterized by clinical hyperandrogenism, menstrual dysfunction, and polycystic ovarian morphology (54). In addition to well-described reproductive health issues, the metabolic and hormonal profiles in women with PCOS greatly increase the risk for obesity, insulin resistance, and diabetes (40). The PCOS phenotype displays insulin resistance across a spectrum of BMI from lean to obese (59); however, over 50% of women with PCOS are classified as obese (22) and the combination of obesity and PCOS exacerbates insulin resistance (58). Obese women with PCOS exhibit marked insulin resistance (58) and an elevated risk of developing Type 2 diabetes (48) compared with body mass index (BMI)-matched women.
Insulin signaling is disrupted in adipose tissue in obese PCOS women (12, 20), resulting in reduced glucose uptake and impaired suppression of free fatty acid release into the circulation (71). These circulating fatty acids can accumulate in the liver and skeletal muscle and produce fatty acid intermediates, such as diacylglycerol, ceramides, and long-chain fatty acid-acyl CoA (35), all of which can inhibit intracellular insulin signaling by activation of JNK (46) or inhibitor of κB kinase β (IKKβ) (2, 69). JNK and IKKβ impair intracellular insulin signaling by serine phosphorylation of the insulin receptor substrate, preventing downstream signaling (68). This results in systemic insulin resistance with an impaired ability of muscle and adipose tissue to transport glucose and impaired suppression of glucose production in hepatocytes, creating a hyperglycemic, hyperinsulinemic profile in PCOS (11). This insulin resistance is exacerbated by factors, such as elevated serum androgens, low-serum adiponectin, elevated systemic inflammation, and disruptions in the PI3K-Akt signaling pathway in PCOS (39). While medications, such as metformin (62), and lifestyle interventions, such as diet and exercise (14, 23), can improve this metabolic dysfunction, most research suggests that they are unable to fully restore insulin sensitivity, therefore warranting investigation of alternative or adjunctive therapies. In addition, exercise compliance is often low in clinical populations (10), with dropout rates as high as 45% in some exercise intervention studies in PCOS (26).
Repeated heat exposure, through hot water immersion, has been investigated in human and animal models of diabetes and insulin resistance. Promising reductions in fasting blood glucose were seen in Type 2 diabetics (30) and overweight men (29) after 2 wk of hot tub use. In animals exposed to repeated heat shock, improvements in glucose tolerance and skeletal muscle glucose uptake were observed (24). Similar results were seen in select white adipose tissue in rats, with improved insulin signaling following a single bout of heat treatment (53). These improvements were associated with increased heat shock protein (Hsp) abundance in muscle and adipose tissue, which acted to inhibit accumulation and activation of inflammatory proteins, such as JNK and IKKβ. Specifically, Hsp27 is associated with inhibition of the inflammatory compound IKKβ (50), while Hsp70 inhibits the activation of JNK (49) and is additionally involved in the repair of damaged insulin receptors (70) through its well-described roles in molecular chaperoning and protein refolding (37). Hsp90 does not appear to play a role in insulin signaling, but it is involved in adipocyte differentiation and fat mass accumulation (17). In support of the relationship between Hsp abundance and metabolic health in humans, low levels of Hsps in adipose tissue have been observed in patients with Type 2 diabetes (31). In concert, these studies show great potential for heat therapy to improve insulin signaling and glucose tolerance in insulin-resistant humans, but no study has yet investigated the effect of heat therapy on markers of metabolic health and adipose tissue-specific insulin signaling and inflammation in humans.
Therefore, the purpose of this study was to observe the impact of heat therapy (HT) on metabolic health in obese women with PCOS, compared with an age and BMI-matched time control group (CON) of obese women with PCOS. Assessment of metabolic health included body mass and composition, fasting blood markers of metabolic health, an oral glucose tolerance test (OGTT), and changes in inflammation, Hsp expression, and insulin signaling in subcutaneous adipose tissue to examine potential mechanisms behind changes in systemic glucose regulation. In addition, we examined serum testosterone and tracked menstrual status as indicators of PCOS symptomology, which is intricately related to insulin resistance (18). This study was part of a larger investigation of the impact of heat therapy on cardiometabolic health in obese women (Clinical trial registration: NCT03644524; https://clinicaltrials.gov/ct2/show/NCT03644524), and the same participants underwent cardiovascular and autonomic health assessments, including blood pressure, arterial stiffness, muscle sympathetic nerve activity, and other biomarkers of cardiovascular risk over the course of heat therapy that are reported elsewhere (Ely BR, Francisco MA, Halliwill JR, Bryan SD, Comrada LN, Larson EA, Brunt VE, Minson CT; unpublished data). Demographic data, heat acclimation responses, and relevant fasting blood data (glucose, insulin, cholesterol, and total testosterone) are included in both studies, as they are relevant to both cardiovascular and metabolic outcome variables.
We hypothesized that heat therapy would improve glucose tolerance and enhance insulin signaling in adipocytes, and that these changes would occur in the absence of changes in BMI or body composition. On the basis of previous work in animals exposed to heat treatment (24, 53), we additionally hypothesized that Hsp abundance would increase and inflammatory markers would decrease in subcutaneous adipose tissue. Lastly, we hypothesized that fasting glucose and glucose area under the curve (AUC) in response to OGTT would be reduced following heat therapy.
METHODS
Participants.
Eighteen obese [body mass index (BMI): 30–45] women with PCOS participated in this study (age: 27 ± 2 yr; BMI: 40.9 ± 1.1 kg/m2). All participants provided oral and written informed consent before participation, in accordance with the guidelines established by the Declaration of Helsinki. All experimental procedures were approved by the Institutional Review Board at the University of Oregon. Participants were diagnosed with PCOS by a physician using the Rotterdam criteria (54). This diagnosis is made through the presence of two of the three following criteria: biochemical or clinical hyperandrogenism (elevated testosterone or free androgen index; presence of hirsutism or male pattern baldness) oligo- or anovulation (menstrual cycles >35 days apart), and polycystic ovarian morphology upon ultrasound examination. Although the Rotterdam criteria do not identify the women with the highest metabolic risk (67), the combination of a BMI >30 and diagnosed PCOS resulted in a participant pool that displayed substantial impairment in glucose tolerance at baseline.
All participants were nonsmokers, not diagnosed with overt cardiovascular disease or diabetes, and were not taking medications known to impact insulin sensitivity (metformin, spironolactone), with the exception of one participant in each group (1 HT, 1 CON) taking oral contraceptives. In addition, two subjects in each group were taking selective serotonin reuptake inhibitors for treatment of depression or anxiety, at a constant dose throughout the study. Participants were matched for age, BMI, and medications, and assigned to HT or CON groups. Of these 18 participants, adipose tissue biopsies were performed in 16 of them (8 HT, 8 CON).
Heat therapy intervention.
Heat therapy occurred over an 8- to 10-wk period, with a total of 30 × 1-h sessions scheduled 3 or 4/wk in all participants enrolled in the HT group. Control participants were not exposed to heat but completed all other testing at matched time points. Passive hot water immersion was selected as the method of heat stress because it is capable of increasing core temperature at a rate similar to moderate-intensity exercise (34), while also allowing high skin temperature and sweating rate, all requisite components for adaptation to heat (9, 21).
Participants reported to the laboratory to undergo passive heating, which entailed 60 min of water immersion in a bath set to 40.5°C. Previous research in our laboratory suggests this temperature is optimal to raise core temperature ≥ 38.5°C within 20–30 min (6). Once core temperature rose to 38.5°C, participants sat upright (immersed to the waist) for the remainder of the 1-h session to maintain core temperature between 38.5 and 39.0°C. If the temperature dropped below 38.5, participants were asked to submerge again. After 60 min of exposure, participants were asked to sit next to the tub until core temperature fell below 38.5°C (10–15 min) for safety monitoring, and for monitoring the total exposure duration in which core temperature was above 38.5°C. This threshold was selected on the basis of human heat acclimation literature using isothermic models (21) and is additionally important as a threshold for induction of heat shock proteins (63).
On each heat therapy day, participants provided a urine sample for measurement of specific gravity (USG) to confirm euhydration (USG ≤ 1.02) before heat exposure. Participants were also weighed pre- and post-heat exposure (nude, towel-dried, behind a privacy screen) and given water to drink ad libitum during heat exposure and post-heat exposure if necessary to match fluid losses. Heart rate was monitored throughout heating using commercially available heart rate monitors (Polar Electro, New York, NY), while rectal temperature (Tre) was monitored throughout passive heating by rectal thermistor [Yellow Springs Instruments (YSI), Yellow Springs, OH].
Oral glucose tolerance test.
Selection of a 2-h, 75-g OGTT was based on its wide clinical utility, well-established thresholds for impaired fasting glucose and impaired glucose tolerance, and its inclusion as part of recommended screening for all obese women diagnosed with PCOS (3). An OGTT was performed in all participants at the beginning (Pre, 0 HT sessions, or time control), midpoint (Mid, 14–16 HT sessions or equivalent 4–5 wk time control), and end (Post, 36–72 h after 30th heat session or equivalent 8–10 wk time control). Participants arrived at the laboratory following an overnight fast (≥12 h) and having refrained from caffeine and alcohol for 12 h, vitamin supplements and medications for 24 h, and heavy exercise or heat exposure for >24 h. In addition, diet was recorded using a 24-h food recall worksheet to ensure similar macronutrient composition between tests for each participant.
Upon arrival, body mass index [BMI = weight in kg/(height in m)2], waist, and hip circumference, and three-site skinfold thickness (tricep, suprailiac, and thigh) were assessed using established techniques. Following anthropometric assessment, participants were seated in a comfortable chair for a minimum of 15 min before catheter placement. A venous catheter was inserted into a vein in the antecubital space or hand, and baseline samples were drawn into syringes, and then placed into appropriate tubes. Samples were placed in EDTA tubes for an analysis of glucose and serum separator tubes (SST) for an analysis of insulin. The EDTA tubes were immediately placed on ice and centrifuged, while the SSTs were allowed to clot at room temperature for 30 min before centrifugation. In addition, fasting samples were also drawn for measurement of various cytokines and adipokines associated with impaired metabolic health. All samples were centrifuged at 1,500 g for 10 min at 4°C, and plasma or serum was aliquoted into cryovials and placed in −80°C freezer.
After baseline (fasted) sampling, a 75-g glucose drink was ingested in a 3- to 5-min period, and blood samples were taken at 15, 30, 45, 60, 90, and 120 min for analysis of blood glucose and insulin. Glucose was analyzed using the glucose oxidase method (YSI 2300 Stat Plus), and insulin samples were frozen at −80°C for batch analysis by Oregon Clinical and Translational Research Institute. Insulin was analyzed in duplicate using a chemiluminescent immunometric method (Siemens Immulite 1000).
The resulting glucose and insulin curves provide an indication of glucose tolerance and insulin sensitivity through measurement of the area under the curve for both glucose and insulin. In addition, commonly used ratios of glucose and insulin were calculated as assessments of insulin resistance (51). These included the homeostatic model assessment for insulin resistance: HOMA-IR = (glucose mg·dl·insulin−1 mU·l−1)/405]; quantitative insulin sensitivity check index: QUICKI = 1/[Log(glucose) + Log(insulin)]; and the Matsuda insulin sensitivity index: (ISI = 10,000/√(Fasting Glucose × Fasting Insulin × Mean Glucose × Mean Insulin) (44).
Fasting blood samples were additionally drawn for measurement of adipokines, inflammatory cytokines, total testosterone, total cholesterol, and serum free fatty acids. Adipokines (LegendPlex human metabolic panel kit; Biolegend, San Diego, CA) and inflammatory markers (BD human inflammatory cytokine kit; Becton Dickinson, Franklin Lakes, NJ) were measured using cytometric bead array kits on a Beckman-Coulter (Brea, CA) Gallios flow cytometer and quantified relative to a standard curve, while total testosterone (Enzo Life Sciences, Farmingdale, NY) and nonesterified fatty acids (Sigma-Aldrich, St. Louis, MO) were measured using commercial assay kits. Total cholesterol was analyzed by the Oregon Health Sciences University (OHSU) Lipid Laboratory (COBAS 311; Roche Diagnostics, Minneapolis, MN).
Adipose tissue biopsies.
Subcutaneous white adipose tissue samples were obtained after a 4-h fast from the peri-umbilical area at the before (Pre) and 36–72 h after (Post) the 30th heat session or equivalent 8–10 wk time control in HT and CON participants, respectively. This tissue depot was selected because of the high proportion of abdominal obesity in PCOS, the ease of sampling, and relative comfort of participants. The sampling area was cleaned with antiseptic (Chloraprep), and a local anesthesia was induced by intracutaneous and subcutaneous injection of 5 ml of 1% lidocaine near the site of incision in the side of the umbilicus. Following local anesthesia, a 3-mm wide skin incision was made with a sterile scalpel at the edge of the umbilicus, and 15-cm-long, 16-gauge infiltration cannula (Millennium Surgical, Narbeth, PA) was advanced through the incision. This cannula was connected to a 60-ml syringe containing a mixture of 50 ml of 0.9% sterile saline and 7.5 ml of 1% lidocaine. This fluid was injected in the subcutaneous fat in a fan-like fashion from the incision site, covering a total area of ~5×5 cm. Next, an 11 gauge aspiration cannula (Millennium Surgical) connected to a 20-ml sterile syringe was advanced in the same fan-like fashion while gentle suction was applied. A total sample of 10–12 ml of fluid and fat was taken over the active sampling period (~2 min), resulting in an adipose tissue sample of 4–7 ml. This sample was collected and washed three times in sterile saline before a portion of whole adipose tissue was snap-frozen in liquid nitrogen for later analysis of Hsps and inflammatory markers. The remaining sample was placed in PBS for adipocyte and stromal vascular fraction (SVF) isolation. Markers of inflammation and Hsps were measured in whole adipose tissue, while insulin signaling was measured in isolated primary adipocytes, in accordance with other adipose tissue research in PCOS (12, 19, 43).
Primary adipocytes were isolated by digesting tissue with collagenase at 37°C, in a protocol adapted from Majka et al. (41), with adipocyte digestion buffer consisting of 2% BSA (rather than FBS), 2.5 mM glucose, 200 µM adenosine, 1 mg/ml collagenase (Sigma TypeVIII-C2139) in KRH buffer (120 mM NaCl, 4.7 mM KCl, 2.2 mM CaCl2, 10 mM HEPES, 1.2 mM KH2PO4, and 1.2 mM MgSO4). When tissue appeared homogenous (no visible chunks), the sample was passed through a 250-µm Pierce tissue strainer (Thermo Fisher Scientific, Rockford, IL) and washed with an equal volume of wash buffer (KRH buffer with 10 µl adenosine and 2% BSA) before centrifugation at 500 g for 5 min. The wash buffer and centrifugation process were repeated, then 3 × 100 µl cell samples were each placed in wash buffer for a 2-h serum-starved incubation at 37°C (61). The SVF was additionally isolated during centrifugation and snap-frozen in liquid N2 for subsequent analysis.
After incubation, one sample was left untreated, and 20-µl insulin (Humulin-R; Eli Lilly, Indianapolis, IN) was added to the second and third samples in physiological (1.2 nM) and supraphysiological (12 nM) concentrations (45). These samples were placed in a 37°C incubator for 5 min before adipocytes were extracted and snap-frozen in liquid nitrogen for later analysis of insulin signaling by measuring phosphorylated AKT (p-AKT) at Ser-473. Isolated adipocytes were thawed and combined with a 1:1 volume of protease inhibitor cocktail for tissue homogenization. Homogenized samples were rotated at 4°C for 1 h, and then spun at 1,200 g for 15 min before protein subnatant extraction and quantification. Analysis of p-AKT (Ser-473; Cell Signaling Technology, Danvers, MA; 1:250) was completed using Wes (ProteinSimple, BioTechne, San Jose, CA), as previously described (25), and GAPDH (1:2,000) was used as a loading control.
Whole adipose tissue samples were thawed and combined with a cocktail of 10× Pierce RIPA (Thermo Fisher Scientific) and protease inhibitors [1 mg/ml aprotinin, 1 mg/ml leupeptin, 1 mg/ml pepstatin, 6 mg/ml Pefabloc SC, and phosphatase inhibitor cocktail 2 and 3 (Sigma-Aldrich, San Jose, CA)] in a 1:1 sample:cocktail mixture before homogenization. Homogenized samples were spun at 1,500 g for 10 min, and protein extract was isolated from beneath the lipid layer of each sample. Samples were analyzed for Hsp27 (1:5,000 sc-13132: Santa Cruz Biotechnology, Santa Cruz, CA), Hsp70 (1:2,000 ab79852- AbCam, Cambridge, MA), Hsp90 (1:200 ab1429; AbCam) and inflammatory markers JNK (sc-7345), p-JNK (sc-6254), and IKKβ (sc-8014, each 1:300; Santa Cruz Biotechnology, Santa Cruz, CA) using Western blot analysis, with α-vinculin (1:1,000 sc-73614; Santa Cruz Biotechnology) used as a loading control. All blots were digitized and protein quantification was done (Image Studio, Li-Cor Biosciences, Lincoln, NE) by a blinded investigator.
Statistics.
All data are presented as means ± SE. Results were analyzed using mixed-model ANOVA in GraphPad Prism 6 (GraphPad, San Diego, CA), with repeated measures within HT or CON groups for each participant over time, and nonrepeated measures comparison between groups of participants. If a significant main effect was observed, Holm-Sidak post hoc analysis was used to examine within- or between-group effects over time. For measures with multiple time points (Individual blood glucose and insulin responses to OGTT, p-AKT with stepwise insulin doses), a two-way repeated-measures ANOVA was used to compare within each treatment group, and Holm-Sidak post hoc analysis was used when significant main effects were observed.
RESULTS
Participants were well matched for age (HT: 26 ± 6; CON: 27 ± 6 yr) and BMI (HT: 41.8 ± 4.0; CON: 40.7 ± 5.4 kg/m2). Nine HT participants completed the heat therapy intervention, whereas one CON participant withdrew before Post testing, and was, therefore, not included in the analyses. HT participants exhibited classic signs of heat acclimation, including a lower resting core temperature (Session 1: 37.6 ± 0.6°C, Session 30: 37.2 ± 0.6°C; P < 0.001) and increased sweating rate during heating (Session 1: 0.71 ± 0.57 l/h, Session 30: 1.21 ± 0.60 l/h; P < 0.001).
CON and HT participants did not exhibit any changes in BMI, waist circumference, waist-to-hip ratio, or skinfold thickness over the course of 8–10 wk (Table 1). Despite this lack of change in body mass or composition, HOMA-IR significantly decreased in HT (group × time interaction: P = 0.021), while QUICKI (group × time interaction: P = 0.026) and Matsuda ISI (group × time interaction P = 0.013) both significantly increased in HT, indicating increased insulin sensitivity. Both total cholesterol and nonesterified fatty acids (NEFA) decreased over time in HT as well. NEFA were significantly higher at baseline in HT than CON (Table 1; 492 vs. 360 µmol/l, P = 0.017), but HT participants experienced a decrease over time such that HT and CON participants did not differ in Post (P = 0.66). When examined as a percent change from baseline, HT participants experienced a −19.5 ± 6.2% (P = 0.039) change in NEFA, while CON participants did not change (6.8 ± 7.4%; P = 0.48).
Table 1.
A summary of anthropometric and blood variables related to metabolic health in heat therapy and control participants
| Group | Pre | Mid | Post | |
|---|---|---|---|---|
| BMI, kg/m2 | HT | 41.8 ± 1.4 | 41.9 ± 1.4 | 41.8 ± 1.5 |
| CON | 39.9 ± 1.9 | 39.8 ± 1.8 | 39.5 ± 1.8 | |
| Waist circumference, cm | HT | 111 ± 2 | 111 ± 2 | 110 ± 3 |
| CON | 109 ± 4 | 109 ± 4 | 109 ± 4 | |
| Waist:Hip ratio | HT | 0.85 ± 0.01 | 0.85 ± 0.01 | 0.84 ± 0.01 |
| CON | 0.86 ± 0.02 | 0.86 ± 0.02 | 0.85 ± 0.02 | |
| Sum of skinfolds, | HT | 137 ± 6 | 138 ± 8 | 135 ± 7 |
| mm | CON | 132 ± 8 | 134 ± 7 | 138 ± 8 |
| Fasting glucose, mg/dl | HT | 105 ± 3 | 100 ± 5 | 89 ± 5*† |
| CON | 106 ± 3 | 102 ± 4 | 108 ± 3 | |
| Fasting insulin, mIU/l | HT | 24 ± 3 | 21 ± 4 | 24 ± 4 |
| CON | 26 ± 2 | 25 ± 2 | 22 ± 2 | |
| Fasting cholesterol, mmol/l | HT | 5.4 ± 0.4 | 5.2 ± 0.3 | 5.0 ± 0.3* |
| CON | 4.8 ± 0.2 | 4.7 ± 0.2 | 4.8 ± 0.3 | |
| Fasting NEFA, µmol/l | HT | 492 ± 32 | 415 ± 33 | 403 ± 48* |
| CON | 360 ± 28 | 417 ± 29 | 376 ± 24 | |
| HOMA-IR | HT | 5.9 ± 0.9 | 5.5 ± 1.2 | 4.9 ± 0.9*† |
| CON | 6.4 ± 0.5 | 6.3 ± 0.5 | 6.2 ± 0.5 | |
| QUICKI | HT | 0.30 ± 0.01 | 0.31 ± 0.01 | 0.31 ± 0.01*† |
| CON | 0.29 ± 0.01 | 0.29 ± 0.01 | 0.29 ± 0.01 | |
| Matsuda ISI | HT | 1.40 ± 0.21 | 1.79 ± 0.28* | 1.83 ± 0.23*† |
| CON | 1.33 ± 0.16 | 1.27 ± 0.14 | 1.34 ± 0.07 |
Data are presented as means ± SE. BMI, body mass index; CON, control (n = 8 subjects); HOMA-IR, the homeostatic model assessment for insulin resistance; HT, heat therapy (n = 9 subjects); ISI, insulin sensitivity index; NEFA, nonesterified fatty acid; QUICKI, quantitative insulin sensitivity check index.
Significant difference (P < 0.05) different from Pre.
Significant difference (P < 0.05) different from CON.
OGTT.
All participants exhibited abnormalities in the OGTT at baseline, including impaired fasting glucose, elevated 2-h glucose, or both. No glucose parameters significantly changed in CON or HT participants at the midpoint of the study (P = 0.377); however, at the end of the intervention, HT participants displayed reduced fasting glucose (P = 0.028) and lower blood glucose values beginning at 45 min during the OGTT (Fig. 1; Group × Time interaction: P = 0.0196). These reductions in glucose resulted in six of nine HT participants changing risk classification and a significantly decreased glucose AUC (Fig. 1, insets) in HT participants at Post-testing (P = 0.027). Fasting insulin did not change over HT (P = 0.717), but insulin during the OGTT was significantly reduced at the 45-, 60-, 90-, and 120-min time points in Post, resulting in a decreased insulin AUC in HT participants (P = 0.012). Insulin AUC was also significantly reduced at the midpoint in HT participants (P = 0.040). All glucose and insulin data for HT and CON participants are displayed in Fig. 1.
Fig. 1.

Glucose (A and B) and insulin (C and D) curves during a 2-h, 75-g oral glucose tolerance test (OGTT) at before (Pre), at the mid-point (Mid), and following (Post) for heat therapy (HT; left) and control (CON; right), for n = 9 HT and n = 8 CON participants. Insets: glucose and insulin area under the curve (AUC) are displayed in each graph. *Significantly different (P < 0.05) compared with Pre using mixed-model ANOVA and Holm-Sidak post hoc testing.
Serum testosterone.
Most participants had elevated total testosterone at Pre (>30 ng/ml), excluding one participant in each group taking oral contraceptives (Fig. 2; lowest Pre value in each group represents participant taking oral contraceptives). Total testosterone significantly decreased over time in HT participants (P = 0.03), with no change in CON (P = 0.21). Within the group of eight participants who underwent HT and were not taking oral contraceptives, five (~63%) reported beginning menstrual cycles by the midpoint of the study.
Fig. 2.
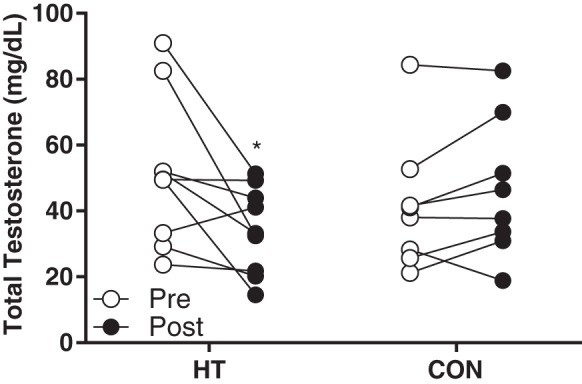
Individual serum testosterone at Pre and Post in heat therapy (HT; n = 8) and control (CON; n = 8). *Significantly different (P < 0.05) compared with Pre using mixed-model ANOVA and Holm-Sidak post hoc testing.
Cytokines and adipokines.
Inflammatory cytokine data from serum and stromal vascular fraction samples are presented in Table 2. Some analytes (IL-10, IL-12p70, and serum IL-8) fell below detection limits in the majority of participants and are, therefore, not presented due to a low sample size. In serum, IL-1β (P = 0.015), IL-6 (P = 0.046), and TNF (P = 0.029) significantly decreased over time in HT participants, with no change in CON. In the stromal vascular fraction, IL-1β (P = 0.047) and IL-8 (P = 0.035) were significantly decreased in HT participants in Post. No significant difference in adiponectin (P = 0.728) or leptin (P = 0.732) were observed over time in HT or CON. Individual responses are displayed in Fig. 3.
Table 2.
Serum and stromal vascular fraction cytokines over time in heat therapy and time control participants
| Group | Pre | Mid | Post | |
|---|---|---|---|---|
| Serum | ||||
| IL-1β, pg/ml | HT | 22.5 ± 6.8 | 12.0 ± 5.0* | 12.5 ± 6.2 |
| CON | 15.9 ± 3.9 | 27.0 ± 9.9 | 27.7 ± 9.1 | |
| IL-6, pg/ml | HT | 19.5 ± 9.9 | 10.2 ± 7.7* | 1.2 ± 1.1*† |
| CON | 13.7 ± 2.5 | 20.1 ± 7.5 | 15.6 ± 4.9 | |
| TNF, pg/ml | HT | 23.5 ± 7.1 | 12.6 ± 6.2 | 8.9 ± 5.9* |
| CON | 12.5 ± 2.7 | 17.1 ± 2.3 | 12.3 ± 3.3 | |
| Stromal Vascular Fraction | ||||
| IL-1β, pg/ml | HT | 295.8 ± 93.1 | 106.1 ± 18.7* | |
| CON | 171.9 ± 23.5 | 255.5 ± 89.6 | ||
| IL-6, pg/ml | HT | 162.0 ± 64.3 | 52.6 ± 11.5 | |
| CON | 108.2 ± 33.7 | 147.9 ± 71.1 | ||
| IL-8, pg/ml | HT | 903.1 ± 311.2 | 272.2 ± 57.0*† | |
| CON | 579.8 ± 97.6 | 920.1 ± 229.5 | ||
| TNF, pg/ml | HT | 91.0 ± 31.3 | 74.2 ± 31. | |
| CON | 80.1 ± 11.1 | 52.7 ± 20.2 | ||
Data are presented as means ± SE. CON, control (n = 9 subjects); HT, heat therapy (n = 8 subjects); SVF, stromal vascular fraction.
Significant difference compared with Pre within group.
Significant difference (P < 0.05) compared with CON.
Fig. 3.
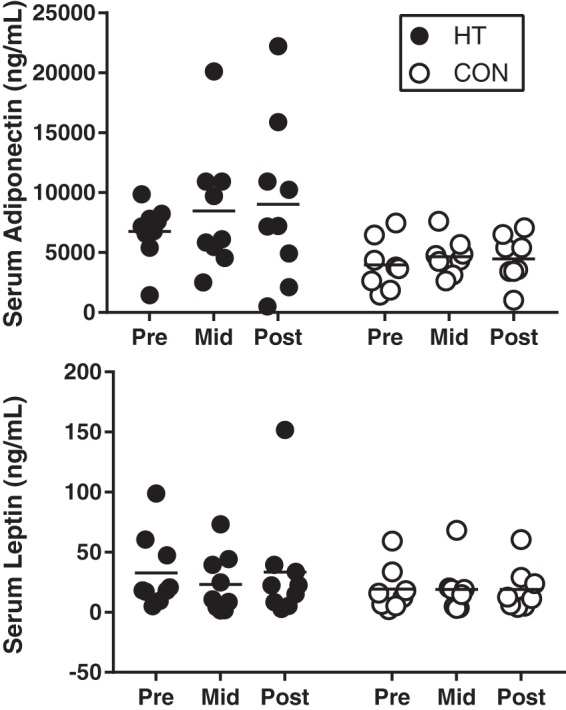
Individual serum adiponectin and leptin at Pre, Mid, and Post in heat therapy (HT; n = 8) and control (CON; n = 8). Results were analyzed using a mixed-model ANOVA, and no significant group, time, or group × time effects were observed.
Insulin signaling.
Seven biopsy samples from each group were exposed to physiological (1.2 nM) and supraphysiological (12 nM) insulin doses. Participants in both HT and CON displayed a stepwise increase in phosphorylated AKT (p-AKT) at Ser-473 with increasing insulin dose in Pre samples (Fig. 4; Main effect of dose in HT; P = 0.033; main effect of dose in CON; P = 0.039). In Post samples, this stepwise increase was still evident in CON, but in HT participants, physiological and supraphysiological doses were not different, indicating that the physiological dose may have been sufficient to elicit a maximal response after HT. In HT participants, a significant time × dose interaction was also evident (P = 0.045), and post hoc analysis revealed that p-AKT at Ser-463 increased (P = 0.008) in response to the physiological insulin dose following HT. Importantly, this change represented a five-fold increase in insulin signaling from Pre to Post. Individual data for all participants in HT and CON at each dose are displayed in Fig. 4.
Fig. 4.
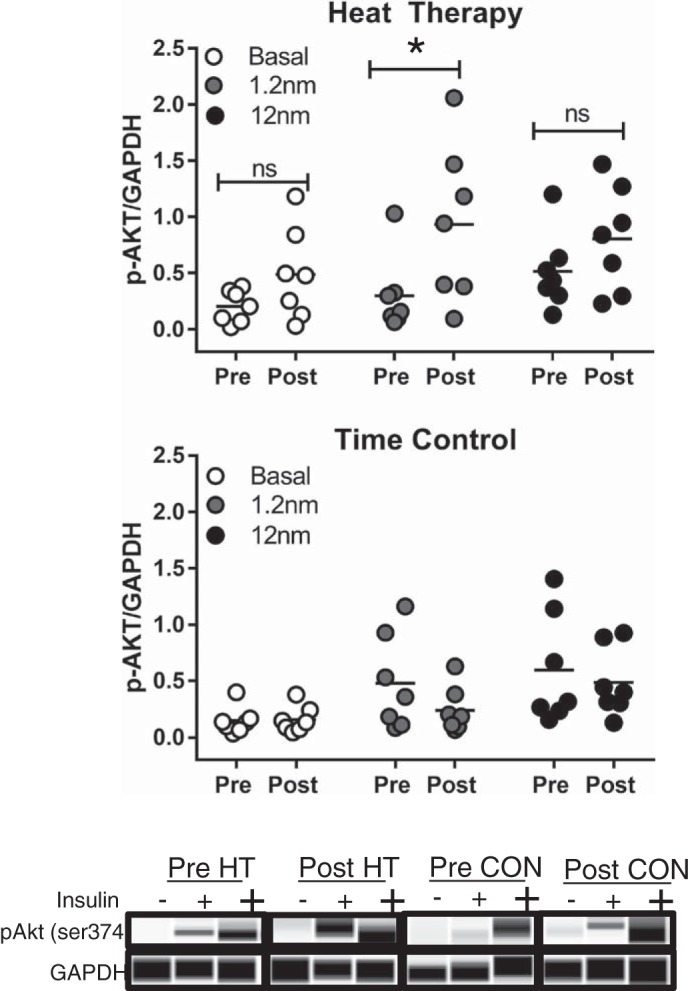
Insulin signaling (p-AKT at Ser-473) relative to loading control (GAPDH) at basal (no insulin), physiological (1.2 nM), and supraphysiological (12 nM) insulin doses in heat therapy (HT; n = 7) (top) and control (CON; n = 7) (middle) in isolated primary adipocytes. Bottom: representative blots for each insulin dose and condition are displayed at the bottom of the figure. Results were analyzed for each group using a two-way, repeated-measures ANOVA, and Holm-Sidak post hoc testing was used when a significant main effect was observed. *Significantly different (P < 0.05) from Pre; ns, not significantly different.
To examine potential cellular signals that may be driving this increase in insulin signaling, inflammatory markers IKKβ, JNK, and p-JNK were examined in whole adipose tissue. As seen in Fig. 5, top, right ~40% decrease in IKKβ (P = 0.024) was observed following HT, with no change in CON participants (P = 0.49). While JNK and p-JNK in most HT participants tended to decrease from Pre to Post, changes in JNK (~28% decrease; P = 0.09 and p-JNK (~27% decrease; P = 0.11) were not statistically significant following HT, and the ratio of pJNK/JNK (P = 0.70) did not change. No changes were observed in CON participants for JNK (P = 0.32), p-JNK (P = 0.42), or p-JNK/JNK (P = 0.29). Hsp27 abundance increased in HT participants (P = 0.008), with a mean increase of ~70% and no change in CON (P = 0.72). However, no changes in Hsp70 (P = 0.79) or Hsp90 abundance (P = 0.50) were observed following HT. All individual Hsp results are displayed in Fig. 5.
Fig. 5.

Top: individual Hsp27, IKKβ, Hsp70, JNK, Hsp90, p-JNK, and abundance in heat therapy (HT; n = 8) and control (CON; n = 8) in subcutaneous adipose tissue, expressed relative to loading control (vinculin). Bottom: representative blots for each protein and condition are displayed at the bottom of the figure. The representative blots for JNK and p-JNK are from the same participant in each condition, so that the ratio of p-JNK/JNK is visible; therefore, the loading control (vinculin) is identical. *Significant difference (P < 0.05) compared with Pre using mixed-model ANOVA and Holm-Sidak post hoc testing.
DISCUSSION
This study examined the impact of a 30-session, 8- to 10-wk heat therapy intervention on markers of metabolic health in obese women with PCOS. Our primary findings indicate that heat therapy improved glucose tolerance, reduced markers of inflammation, and improved insulin sensitivity in a population with marked insulin resistance. Additionally, heat therapy caused significant improvements in clinical indicators of PCOS (reduced serum testosterone and improved menstrual function in the majority of HT participants), indicating that the global stress of repeated heat exposure is a powerful stimulus to impact both metabolic and ovarian function. Importantly, these improvements occurred in the absence of any changes in BMI or body composition. This lack of change in anthropometric measures suggests that heat therapy-mediated improvements are body mass-independent and could, therefore, complement lifestyle modifications or pharmaceutical interventions that lead to weight loss in obese women with PCOS.
Common pharmacological interventions in women with PCOS focus on managing the menstrual dysfunction (oral contraceptives), symptoms related to excess testosterone (oral contraceptives and/or spironolactone), and insulin resistance (metformin) that are hallmarks of the syndrome. Although these medications are effective in reducing signs and symptoms of PCOS, including irregular menses, acne, and hirsutism, few have a substantial impact on cardiometabolic health, and some, such as oral contraceptives, may even exacerbate metabolic dysfunction in overweight/obese women with PCOS (38). In contrast, heat therapy appears to target androgen excess and menstrual dysfunction, while also substantially improving cardiometabolic risk, making it an ideal lifestyle-based therapeutic intervention for obese women with PCOS that may complement pharmaceutical therapies or other lifestyle interventions.
Current recommended lifestyle interventions for obese women with PCOS emphasize weight loss through dietary modification and exercise training. The most commonly reported health outcomes with exercise training interventions in PCOS are weight loss, improved insulin resistance, and improved ovulation (26). However, women with PCOS have been described as “nonresponders” (55) to exercise interventions based on body mass loss, and some studies report no change in glucose tolerance (13, 47) following 16–27 wk of aerobic training. Perhaps because of these marginal health improvements, exercise compliance is low in clinical populations (10), with drop-out rates as high as 45% in some exercise intervention studies in PCOS (26). In our small cohort, all participants completed the 30-session heat therapy intervention as outlined in 8–10 wk (three or four sessions per week) and reported a desire to continue heat therapy after the study concluded. In addition, the magnitude of changes in glucose tolerance and total testosterone were greater than observed in a 6-mo exercise intervention in overweight PCOS women, and the decrease in HOMA-IR was similar to changes in this 6-mo exercise intervention (47). However, given that exercise can additionally improve body composition and provide an energetic avenue for excess lipids stored in skeletal muscle, the additive benefits of a combination of heat and exercise therapy may produce more robust metabolic health outcomes in obese women with PCOS.
The improvements in blood glucose during an OGTT in HT participants are on par with those observed in hot yoga interventions in obese men and women (32), and greater than those observed in exercise training interventions in PCOS (13). Additionally, the decrease in fasting glucose was larger than observed in overweight men with a 2-wk (10 sessions) heat therapy intervention (29). Importantly, the decrease in fasting and 2-h glucose during the OGTT in HT individuals changed the risk category for six of the nine HT participants (from prediabetic to impaired, or from impaired to optimal classification). Although we realize an OGTT is not specifically a measure of insulin sensitivity, results correlate well with gold standard measures of insulin sensitivity (euglycemic-hyperinsulinemic clamp technique) (16), especially in insulin-resistant individuals (51, 60). We are also aware of the limitations in reproducibility of the OGTT (4); however, the stability of measures in our CON participants suggests that this did not substantially impact our results. Additionally, we observed a significant decrease in HOMA-IR and insulin AUC, and a significant increase in QUICKI and Matsuda ISI, which, in concert, indicate increased whole body insulin sensitivity. HOMA-IR and QUICKI values for the women in this study met established thresholds for insulin resistance (>2.0 and ≤0.30, respectively), and the changes in these values were clinically meaningful, although not large enough to alter risk classification.
The systemic improvement in markers of insulin sensitivity and insulin-stimulated glucose uptake during the OGTT were supported by changes in insulin signaling in subcutaneous adipose tissue samples. Although visceral fat appears to have a stronger relationship with metabolic dysfunction (66) and insulin resistance (52), in obesity, obese women with PCOS exhibit dysfunction in both visceral and subcutaneous depots in the abdominal region (20). The improvement in insulin signaling observed in subcutaneous white adipose tissue along with a reduction in IKKβ and increase in Hsp27 creates a possible mechanism for heat-mediated improvements in whole body glucose disposal, as well as a reduction in circulating NEFAs (see Fig. 6 for summary of insulin signaling pathways). It appears that heat stress, potentially through changes in Hsp27 abundance, reduced adipose tissue inflammation, and improved insulin signaling. On the basis of the increased glucose uptake despite a decreased insulin response during the OGTT, heat therapy also likely improved insulin sensitivity in other tissues (i.e., skeletal muscle) as well. Although we did not examine Hsps, inflammatory proteins, or insulin signaling in skeletal muscle, muscle is the largest glucose sink and primarily responsible for glucose uptake in an OGTT (64). Therefore, the reduced blood glucose after 45 min would suggest improvements in skeletal muscle glucose uptake and insulin signaling, as seen in animal heat stress models (24).
Fig. 6.

Schematic representation of the interrelationship between heat shock proteins (HSPs), inflammatory compounds JNK (c-Jun NH2-terminal kinase), and IKKβ (inhibitor of κB kinase β, IKKβ), insulin signaling (p-AKT; phosphorylated PKB), and nonesterified fatty acid (NEFA) release mediated by hormone-sensitive lipase (HSL) in adipocytes. All components that were measured in this study are noted with an asterisk (*). In heat therapy (HT) participants, a significant increase in HSP27 abundance and decrease in IKKβ may have resulted in increased insulin signaling (p-AKT), which increased glucose uptake and decreased NEFA release into the bloodstream.
There are multiple potential mechanisms for the observed changes in whole body and adipose tissue-specific changes in glucose tolerance and insulin sensitivity. As stated above, the increase in Hsp27 and decrease in IKKβ observed in adipose tissue is likely, in part, responsible for enhanced insulin signaling in adipocytes. Although adipose tissue plays a relatively small role in whole body glucose uptake, insulin’s role in suppressing hormone-sensitive lipase can impact systemic insulin sensitivity and glucose uptake, as enhanced suppression of lipolysis in HT participants would reduce circulating NEFA (as observed in this study), and potentially reduce proinflammatory lipid accumulation in other tissues. Because lipid accumulation in the liver and skeletal muscle is involved in obesity-induced systemic inflammation and insulin resistance, future work examining changes in insulin sensitivity, glucose uptake, Hsp, and inflammatory protein abundance in skeletal muscle biopsies can elucidate the impact of heat therapy on other tissues. In addition, heat acclimation in human (5) and animal models (42) increases angiogenic signals, which could impact blood supply to adipose tissue and, therefore, reduce the hypoxia and inflammation associated with hypertrophic adipocytes. Additionally, acute heat exposure provides protection from ischemia-reperfusion injury (7), and chronic heat therapy provides protective effects from hypoxia-reoxygenation injury in human endothelial cells (8), so inflammatory stress signals may be similarly reduced in response to hypoxia in human adipose tissue. Therefore, the decreased inflammatory cytokines in circulation and in the stromal vascular fraction observed in this study may be evidence for either improved adipose tissue blood flow or improved tolerance to hypoxia. In particular, IL-8 is released by human macrophages in response to hypoxia (28). Therefore, the ~70% decrease in stromal vascular fraction IL-8 could signify improved hypoxic tolerance or adipose tissue blood supply and oxygen delivery. The women in this study also experienced a ~40% decrease in sympathetic outflow, coupled with a 10-mmHg decrease in blood pressure (Ely BR, Ely BR, Francisco MA, Halliwill JR, Bryan SD, Comrada LN, Larson EA, Brunt VE, Minson CT; unpublished data) and decreased serum testosterone, which may have impacted adipose tissue function by reducing catecholamine-induced fatty acid release and decreasing the promotion of adipocyte hypertrophy, respectively. Finally, while adiponectin did not significantly increase over time in HT, several HT participants experienced large increases, which may have contributed to observed systemic improvements in those individuals.
Although the systemic and adipose-tissue-specific changes in inflammation, glucose uptake, and insulin signaling show great promise for obese women with PCOS, this experiment had several limiting factors to consider. First, changes in insulin signaling, inflammation, and Hsps in subcutaneous abdominal adipose tissue may not reflect other subcutaneous and visceral adipose tissue beds, given that animal models report depot-specific responses to acute heat treatment (53). Second, as skeletal muscle is the largest glucose sink during an OGTT (64), changes in insulin signaling in skeletal muscle biopsies may have provided additional mechanistic insight into changes in the OGTT in HT participants. Future work examining multiple adipose tissue and skeletal muscle depots, as well as extracellular Hsps (36) will provide greater insight into systemic and tissue-specific insulin sensitivity in humans undergoing heat therapy. Future work may also include Post testing follow-up to examine the duration of the benefits that we observed. In regard to experimental design, our time control group was not a true sham treatment, and it was not possible to blind participants to treatment group. However, previous work in our laboratory that used a thermoneutral water immersion sham treatment did not observe any health improvements in the control participants (6), and similar untreated time control groups have been used in many lifestyle (exercise intervention) studies in women with PCOS (1, 57, 65). The lack of change in BMI and skinfold thickness in both HT and CON participants suggests that lifestyle (diet and exercise) changes beyond the study intervention did not explain the changes in metabolic health. Future work with a control group receiving standard treatment to improve metabolic health in PCOS (metformin, diet, and exercise intervention) may allow a more direct assessment of the impact of HT when compared with conventional care. In addition, future work in this population should focus on examining a more comprehensive hormone profile (sex hormone binding globulin, free testosterone) to fully elucidate any changes in androgen exposure. Our participants were matched for age and BMI rather than randomly assigned, which may be viewed as a limitation, but we felt it was necessary given the range of BMI and spectrum of metabolic dysfunction evident in PCOS. We additionally enrolled several women taking medications, which were also matched between groups. Our intent was to exclude all medications from this study, but women with PCOS have extremely high prescription rates, with oral contraceptives considered a first-line treatment (33), and high rates of depression and anxiety (15), often treated with selective serotonin reuptake inhibitors. Other than lower total testosterone levels in women taking oral contraceptives, we did not observe any differences in response between medicated and unmedicated participants. However, we recognize that the interindividual variety in BMI, medications, and baseline metabolic dysfunction in our participants may have made our study underpowered to see changes in some variables (JNK, p-JNK, adipokines).
In summary, repeated heat exposure improved PCOS symptomology, whole body glucose uptake, systemic insulin sensitivity, and insulin signaling in subcutaneous adipose tissue in obese women with PCOS. These improvements may be related to decreased systemic inflammation, decreased serum testosterone, increased Hsp27 abundance, and reduced IKKβ abundance in subcutaneous adipose tissue. However, given the global and multifaceted stimulus of heat therapy, future work should examine the contribution of other potential underpinnings in these profound improvements, including changes in visceral fat, liver, and skeletal muscle insulin signaling, potential adipose tissue angiogenesis, and circulating catecholamines.
GRANTS
This project was funded by American Heart Association Fellowship 16PRE27780085, the Eugene and Clarissa Evonuk Memorial Fellowship, and the Kenneth and Kenda Singer endowment.
DISCLOSURES
No conflicts of interest, financial or otherwise, are declared by the authors.
AUTHOR CONTRIBUTIONS
B.R.E., Z.S.C., C.E.M., J.P., and C.T.M. conceived and designed research; B.R.E., Z.S.C., C.E.M., J.P., K.W.N., and L.N.C. performed experiments; B.R.E., Z.S.C., K.W.N., and L.N.C. analyzed data; B.R.E., Z.S.C., C.E.M., K.W.N., and C.T.M. interpreted results of experiments; B.R.E. prepared figures; B.R.E. drafted manuscript; B.R.E., Z.S.C., C.E.M., J.P., K.W.N., and C.T.M. edited and revised manuscript; B.R.E., Z.S.C., C.E.M., J.P., K.W.N., L.N.C., and C.T.M. approved final version of manuscript.
ACKNOWLEDGMENTS
We thank Emily Larson, Michael Francisco, Samantha Bryan, and Byron Hetrick for assistance with data collection. We also like thank the participants who volunteered their time for this study.
Present address: B. R. Ely, Department of Sport and Movement Science, Salem State University, Salem, MA 01970.
REFERENCES
- 1.Almenning I, Rieber-Mohn A, Lundgren KM, Shetelig Løvvik T, Garnæs KK, Moholdt T. Effects of high intensity interval training and strength training on metabolic, cardiovascular and hormonal outcomes in women with polycystic ovary syndrome: a pilot study. PLoS One 10: e0138793, 2015. doi: 10.1371/journal.pone.0138793. [DOI] [PMC free article] [PubMed] [Google Scholar]
- 2.Arkan MC, Hevener AL, Greten FR, Maeda S, Li ZW, Long JM, Wynshaw-Boris A, Poli G, Olefsky J, Karin M. IKK-β links inflammation to obesity-induced insulin resistance. Nat Med 11: 191–198, 2005. doi: 10.1038/nm1185. [DOI] [PubMed] [Google Scholar]
- 3.Azziz R, Carmina E, Dewailly D, Diamanti-Kandarakis E, Escobar-Morreale HF, Futterweit W, Janssen OE, Legro RS, Norman RJ, Taylor AE, Witchel SF; Androgen Excess Society . Criteria for defining polycystic ovary syndrome as a predominantly hyperandrogenic syndrome: an androgen excess society guideline. J Clin Endocrinol Metab 91: 4237–4245, 2006. doi: 10.1210/jc.2006-0178. [DOI] [PubMed] [Google Scholar]
- 4.Bartoli E, Fra GP, Carnevale Schianca GP. The oral glucose tolerance test (OGTT) revisited. Eur J Intern Med 22: 8–12, 2011. doi: 10.1016/j.ejim.2010.07.008. [DOI] [PubMed] [Google Scholar]
- 5.Brunt V, Needham K, Comrada L, Francisco M, Minson C.. Passive heat therapy as a novel approach for inducing angiogenesis in humans: roles of nitric oxide (Abstract). FASEB J 30: 1211.1, 2016. [Google Scholar]
- 6.Brunt VE, Howard MJ, Francisco MA, Ely BR, Minson CT. Passive heat therapy improves endothelial function, arterial stiffness and blood pressure in sedentary humans. J Physiol 594: 5329–5342, 2016. doi: 10.1113/JP272453. [DOI] [PMC free article] [PubMed] [Google Scholar]
- 7.Brunt VE, Jeckell AT, Ely BR, Howard MJ, Thijssen DHJ, Minson CT. Acute hot water immersion is protective against impaired vascular function following forearm ischemia-reperfusion in young healthy humans. Am J Physiol Regul Integr Comp Physiol 311: R1060–R1067, 2016. doi: 10.1152/ajpregu.00301.2016. [DOI] [PMC free article] [PubMed] [Google Scholar]
- 8.Brunt VE, Wiedenfeld-Needham K, Comrada LN, Minson CT. Passive heat therapy protects against endothelial cell hypoxia-reoxygenation via effects of elevations in temperature and circulating factors. J Physiol 596: 4831–4845, 2018. doi: 10.1113/JP276559. [DOI] [PMC free article] [PubMed] [Google Scholar]
- 9.Buono MJ, Numan TR, Claros RM, Brodine SK, Kolkhorst FW. Is active sweating during heat acclimation required for improvements in peripheral sweat gland function? Am J Physiol Regul Integr Comp Physiol 297: R1082–R1085, 2009. doi: 10.1152/ajpregu.00253.2009. [DOI] [PMC free article] [PubMed] [Google Scholar]
- 10.Burgess E, Hassmén P, Welvaert M, Pumpa KL. Behavioural treatment strategies improve adherence to lifestyle intervention programmes in adults with obesity: a systematic review and meta-analysis. Clin Obes 7: 105–114, 2017. doi: 10.1111/cob.12180. [DOI] [PubMed] [Google Scholar]
- 11.Burghen GA, Givens JR, Kitabchi AE. Correlation of hyperandrogenism with hyperinsulinism in polycystic ovarian disease. J Clin Endocrinol Metab 50: 113–116, 1980. doi: 10.1210/jcem-50-1-113. [DOI] [PubMed] [Google Scholar]
- 12.Ciaraldi TP, Morales AJ, Hickman MG, Odom-Ford R, Olefsky JM, Yen SSC. Cellular insulin resistance in adipocytes from obese polycystic ovary syndrome subjects involves adenosine modulation of insulin sensitivity. J Clin Endocrinol Metab 82: 1421–1425, 1997. [DOI] [PubMed] [Google Scholar]
- 13.Costa EC, DE Sá JCF, Stepto NK, Costa IBB, Farias-Junior LF, Moreira SDNT, Soares EMM, Lemos TMAM, Browne RAV, Azevedo GD. Aerobic training improves quality of life in women with polycystic ovary syndrome. Med Sci Sports Exerc 50: 1357–1366, 2018. doi: 10.1249/MSS.0000000000001579. [DOI] [PubMed] [Google Scholar]
- 14.Covington JD, Tam CS, Pasarica M, Redman LM. Higher circulating leukocytes in women with PCOS is reversed by aerobic exercise. Biochimie 124: 27–33, 2016. doi: 10.1016/j.biochi.2014.10.028. [DOI] [PMC free article] [PubMed] [Google Scholar]
- 15.Deeks AA, Gibson-Helm ME, Teede HJ. Anxiety and depression in polycystic ovary syndrome: a comprehensive investigation. Fertil Steril 93: 2421–2423, 2010. doi: 10.1016/j.fertnstert.2009.09.018. [DOI] [PubMed] [Google Scholar]
- 16.DeFronzo RA, Tobin JD, Andres R. Glucose clamp technique: a method for quantifying insulin secretion and resistance. Am J Physiol Endocrinol Metab 237: E214–E223, 1979. doi: 10.1152/ajpendo.1979.237.3.E214. [DOI] [PubMed] [Google Scholar]
- 17.Desarzens S, Liao W-H, Mammi C, Caprio M, Faresse N. Hsp90 blockers inhibit adipocyte differentiation and fat mass accumulation. PLoS One 9: e94127, 2014. doi: 10.1371/journal.pone.0094127. [DOI] [PMC free article] [PubMed] [Google Scholar]
- 18.Dunaif A. Insulin resistance and the polycystic ovary syndrome: mechanism and implications for pathogenesis. Endocr Rev 18: 774–800, 1997. [DOI] [PubMed] [Google Scholar]
- 19.Dunaif A, Wu X, Lee A, Diamanti-Kandarakis E. Defects in insulin receptor signaling in vivo in the polycystic ovary syndrome (PCOS). Am J Physiol Endocrinol Metab 281: E392–E399, 2001. doi: 10.1152/ajpendo.2001.281.2.E392. [DOI] [PubMed] [Google Scholar]
- 20.Echiburú B, Pérez-Bravo F, Galgani JE, Sandoval D, Saldías C, Crisosto N, Maliqueo M, Sir-Petermann T. Enlarged adipocytes in subcutaneous adipose tissue associated to hyperandrogenism and visceral adipose tissue volume in women with polycystic ovary syndrome. Steroids 130: 15–21, 2018. doi: 10.1016/j.steroids.2017.12.009. [DOI] [PubMed] [Google Scholar]
- 21.Fox RH, Goldsmith R, Kidd DJ, Lewis HE. Acclimatization to heat in man by controlled elevation of body temperature. J Physiol 166: 530–547, 1963. doi: 10.1113/jphysiol.1963.sp007121. [DOI] [PMC free article] [PubMed] [Google Scholar]
- 22.Gambineri A, Pelusi C, Vicennati V, Pagotto U, Pasquali R. Obesity and the polycystic ovary syndrome. Int J Obes Relat Metab Disord 26: 883–896, 2002. doi: 10.1038/sj.ijo.0801994. [DOI] [PubMed] [Google Scholar]
- 23.Giallauria F, Palomba S, Maresca L, Vuolo L, Tafuri D, Lombardi G, Colao A, Vigorito C, Francesco O. Exercise training improves autonomic function and inflammatory pattern in women with polycystic ovary syndrome (PCOS). Clin Endocrinol (Oxf) 69: 792–798, 2008. doi: 10.1111/j.1365-2265.2008.03305.x. [DOI] [PubMed] [Google Scholar]
- 24.Gupte AA, Bomhoff GL, Swerdlow RH, Geiger PC. Heat treatment improves glucose tolerance and prevents skeletal muscle insulin resistance in rats fed a high-fat diet. Diabetes 58: 567–578, 2009. doi: 10.2337/db08-1070. [DOI] [PMC free article] [PubMed] [Google Scholar]
- 25.Harris VM. Protein detection by simple WesternTM analysis. Methods Mol Biol 1312: 465–468, 2015. doi: 10.1007/978-1-4939-2694-7_47. [DOI] [PubMed] [Google Scholar]
- 26.Harrison CL, Lombard CB, Moran LJ, Teede HJ. Exercise therapy in polycystic ovary syndrome: a systematic review. Hum Reprod Update 17: 171–183, 2011. doi: 10.1093/humupd/dmq045. [DOI] [PubMed] [Google Scholar]
- 28.Hirani N, Antonicelli F, Strieter RM, Wiesener MS, Ratcliffe PJ, Haslett C, Donnelly SC. The regulation of interleukin-8 by hypoxia in human macrophages—a potential role in the pathogenesis of the acute respiratory distress syndrome (ARDS). Mol Med 7: 685–697, 2001. doi: 10.1007/BF03401959. . [DOI] [PMC free article] [PubMed] [Google Scholar]
- 29.Hoekstra SP, Bishop NC, Faulkner SH, Bailey SJ, Leicht CA. Acute and chronic effects of hot water immersion on inflammation and metabolism in sedentary, overweight adults. J Appl Physiol (1985) 125: 2008–2018, 2018. doi: 10.1152/japplphysiol.00407.2018. [DOI] [PubMed] [Google Scholar]
- 30.Hooper PL. Hot-tub therapy for type 2 diabetes mellitus. N Engl J Med 341: 924–925, 1999. [DOI] [PubMed] [Google Scholar]
- 31.Hooper PL, Hooper PL. Inflammation, heat shock proteins, and type 2 diabetes. Cell Stress Chaperones 14: 113–115, 2009. doi: 10.1007/s12192-008-0073-x. [DOI] [PMC free article] [PubMed] [Google Scholar]
- 32.Hunter SD, Dhindsa M, Cunningham E, Tarumi T, Alkatan M, Tanaka H. Improvements in glucose tolerance with Bikram Yoga in older obese adults: a pilot study. J Bodyw Mov Ther 17: 404–407, 2013. doi: 10.1016/j.jbmt.2013.01.002. [DOI] [PubMed] [Google Scholar]
- 33.Jin P, Xie Y. Treatment strategies for women with polycystic ovary syndrome. Gynecol Endocrinol 34: 272–277, 2018. doi: 10.1080/09513590.2017.1395841. [DOI] [PubMed] [Google Scholar]
- 34.Kenny GP, Giesbrecht GG, Thoden JS. A comparison of human thermoregulatory response following dynamic exercise and warm-water immersion. Eur J Appl Physiol Occup Physiol 74: 336–341, 1996. doi: 10.1007/BF02226930 . [DOI] [PubMed] [Google Scholar]
- 35.Koves TR, Ussher JR, Noland RC, Slentz D, Mosedale M, Ilkayeva O, Bain J, Stevens R, Dyck JRB, Newgard CB, Lopaschuk GD, Muoio DM. Mitochondrial overload and incomplete fatty acid oxidation contribute to skeletal muscle insulin resistance. Cell Metab 7: 45–56, 2008. doi: 10.1016/j.cmet.2007.10.013. [DOI] [PubMed] [Google Scholar]
- 36.Krause M, Ludwig MS, Heck TG, Takahashi HK. Heat shock proteins and heat therapy for type 2 diabetes: pros and cons. Curr Opin Clin Nutr Metab Care 18: 374–380, 2015. doi: 10.1097/MCO.0000000000000183. [DOI] [PubMed] [Google Scholar]
- 37.Kregel KC. Heat shock proteins: modifying factors in physiological stress responses and acquired thermotolerance. J Appl Physiol (1985) 92: 2177–2186, 2002. doi: 10.1152/japplphysiol.01267.2001 . [DOI] [PubMed] [Google Scholar]
- 38.Legro RS, Dodson WC, Kris-Etherton PM, Kunselman AR, Stetter CM, Williams NI, Gnatuk CL, Estes SJ, Fleming J, Allison KC, Sarwer DB, Coutifaris C, Dokras A. Randomized controlled trial of preconception interventions in infertile women with polycystic ovary syndrome. J Clin Endocrinol Metab 100: 4048–4058, 2015. doi: 10.1210/jc.2015-2778. [DOI] [PMC free article] [PubMed] [Google Scholar]
- 39.Li T, Mo H, Chen W, Li L, Xiao Y, Zhang J, Li X, Lu Y. Role of the PI3K-Akt signaling pathway in the pathogenesis of polycystic ovary syndrome. Reprod Sci 24: 646–655, 2017. doi: 10.1177/1933719116667606. [DOI] [PubMed] [Google Scholar]
- 40.Luque-Ramírez M, Escobar-Morreale HF. Polycystic ovary syndrome as a paradigm for prehypertension, prediabetes, and preobesity. Curr Hypertens Rep 16: 500, 2014. doi: 10.1007/s11906-014-0500-6. [DOI] [PubMed] [Google Scholar]
- 41.Majka SM, Miller HL, Helm KM, Acosta AS, Childs CR, Kong R, Klemm DJ. Analysis and isolation of adipocytes by flow cytometry. Methods Enzymol 537: 281–296, 2014. doi: 10.1016/B978-0-12-411619-1.00015-X. [DOI] [PMC free article] [PubMed] [Google Scholar]
- 42.Maloyan A, Eli-Berchoer L, Semenza GL, Gerstenblith G, Stern MD, Horowitz M. HIF-1α-targeted pathways are activated by heat acclimation and contribute to acclimation-ischemic cross-tolerance in the heart. Physiol Genomics 23: 79–88, 2005. doi: 10.1152/physiolgenomics.00279.2004. [DOI] [PubMed] [Google Scholar]
- 43.Marsden PJ, Murdoch AP, Taylor R. Tissue insulin sensitivity and body weight in polycystic ovary syndrome. Clin Endocrinol (Oxf) 55: 191–199, 2001. doi: 10.1046/j.1365-2265.2001.01303.x. [DOI] [PubMed] [Google Scholar]
- 44.Matsuda M, DeFronzo RA. Insulin sensitivity indices obtained from oral glucose tolerance testing: comparison with the euglycemic insulin clamp. Diabetes Care 22: 1462–1470, 1999. doi: 10.2337/diacare.22.9.1462. [DOI] [PubMed] [Google Scholar]
- 45.McCurdy CE, Schenk S, Holliday MJ, Philp A, Houck JA, Patsouris D, MacLean PS, Majka SM, Klemm DJ, Friedman JE. Attenuated Pik3r1 expression prevents insulin resistance and adipose tissue macrophage accumulation in diet-induced obese mice. Diabetes 61: 2495–2505, 2012. doi: 10.2337/db11-1433. [DOI] [PMC free article] [PubMed] [Google Scholar]
- 46.Nguyen MTA, Satoh H, Favelyukis S, Babendure JL, Imamura T, Sbodio JI, Zalevsky J, Dahiyat BI, Chi N-W, Olefsky JM. JNK and tumor necrosis factor-α mediate free fatty acid-induced insulin resistance in 3T3-L1 adipocytes. J Biol Chem 280: 35361–35371, 2005. doi: 10.1074/jbc.M504611200. [DOI] [PubMed] [Google Scholar]
- 47.Orio F, Muscogiuri G, Giallauria F, Savastano S, Bottiglieri P, Tafuri D, Predotti P, Colarieti G, Colao A, Palomba S. Oral contraceptives versus physical exercise on cardiovascular and metabolic risk factors in women with polycystic ovary syndrome: a randomized controlled trial. Clin Endocrinol (Oxf) 85: 764–771, 2016. doi: 10.1111/cen.13112. [DOI] [PubMed] [Google Scholar]
- 48.Ovalle F, Azziz R. Insulin resistance, polycystic ovary syndrome, and type 2 diabetes mellitus. Fertil Steril 77: 1095–1105, 2002. doi: 10.1016/S0015-0282(02)03111-4. [DOI] [PubMed] [Google Scholar]
- 49.Park H-S, Lee JS, Huh SH, Seo JS, Choi EJ. Hsp72 functions as a natural inhibitory protein of c-Jun N-terminal kinase. EMBO J 20: 446–456, 2001. doi: 10.1093/emboj/20.3.446. [DOI] [PMC free article] [PubMed] [Google Scholar]
- 50.Park K-J, Gaynor RB, Kwak YT. Heat shock protein 27 association with the IκB kinase complex regulates tumor necrosis factor α-induced NF-κB activation. J Biol Chem 278: 35272–35278, 2003. doi: 10.1074/jbc.M305095200. [DOI] [PubMed] [Google Scholar]
- 51.Piché M-È, Lemieux S, Corneau L, Nadeau A, Bergeron J, Weisnagel SJ. Measuring insulin sensitivity in postmenopausal women covering a range of glucose tolerance: comparison of indices derived from the oral glucose tolerance test with the euglycemic-hyperinsulinemic clamp. Metabolism 56: 1159–1166, 2007. doi: 10.1016/j.metabol.2007.04.002. [DOI] [PubMed] [Google Scholar]
- 52.Preis SR, Massaro JM, Robins SJ, Hoffmann U, Vasan RS, Irlbeck T, Meigs JB, Sutherland P, D’Agostino RB Sr, O’Donnell CJ, Fox CS. Abdominal subcutaneous and visceral adipose tissue and insulin resistance in the Framingham heart study. Obesity (Silver Spring) 18: 2191–2198, 2010. doi: 10.1038/oby.2010.59. [DOI] [PMC free article] [PubMed] [Google Scholar]
- 53.Rogers RS, Beaudoin M-S, Wheatley JL, Wright DC, Geiger PC. Heat shock proteins: in vivo heat treatments reveal adipose tissue depot-specific effects. J Appl Physiol (1985) 118: 98–106, 2015. doi: 10.1152/japplphysiol.00286.2014. [DOI] [PMC free article] [PubMed] [Google Scholar]
- 54.Rotterdam ESHRE/ASRM-Sponsored PCOS Consensus Workshop Group Revised 2003 consensus on diagnostic criteria and long-term health risks related to polycystic ovary syndrome (PCOS). Hum Reprod 19: 41–47, 2004. doi: 10.1093/humrep/deh098. [DOI] [PubMed] [Google Scholar]
- 55.Scott D, Harrison CL, Hutchison S, de Courten B, Stepto NK. Exploring factors related to changes in body composition, insulin sensitivity and aerobic capacity in response to a 12-week exercise intervention in overweight and obese women with and without polycystic ovary syndrome. PLoS One 12: e0182412, 2017. doi: 10.1371/journal.pone.0182412. [DOI] [PMC free article] [PubMed] [Google Scholar]
- 56.Spritzer PM, Lecke SB, Satler F, Morsch DM. Adipose tissue dysfunction, adipokines, and low-grade chronic inflammation in polycystic ovary syndrome. Reproduction 149: R219–R227, 2015. doi: 10.1530/REP-14-0435. [DOI] [PubMed] [Google Scholar]
- 57.Sprung VS, Cuthbertson DJ, Pugh CJA, Aziz N, Kemp GJ, Daousi C, Green DJ, Cable NT, Jones H. Exercise training in polycystic ovarian syndrome enhances flow-mediated dilation in the absence of changes in fatness. Med Sci Sports Exerc 45: 2234–2242, 2013. doi: 10.1249/MSS.0b013e31829ba9a1. [DOI] [PubMed] [Google Scholar]
- 58.Stepto NK, Cassar S, Joham AE, Hutchison SK, Harrison CL, Goldstein RF, Teede HJ. Women with polycystic ovary syndrome have intrinsic insulin resistance on euglycaemic-hyperinsulaemic clamp. Hum Reprod 28: 777–784, 2013. doi: 10.1093/humrep/des463. [DOI] [PubMed] [Google Scholar]
- 59.Stovall DW, Bailey AP, Pastore LM. Assessment of insulin resistance and impaired glucose tolerance in lean women with polycystic ovary syndrome. J Womens Health (Larchmt) 20: 37–43, 2011. doi: 10.1089/jwh.2010.2053. [DOI] [PMC free article] [PubMed] [Google Scholar]
- 60.Stumvoll M, Mitrakou A, Pimenta W, Jenssen T, Yki-Järvinen H, Van Haeften T, Renn W, Gerich J. Use of the oral glucose tolerance test to assess insulin release and insulin sensitivity. Diabetes Care 23: 295–301, 2000. doi: 10.2337/diacare.23.3.295 . [DOI] [PubMed] [Google Scholar]
- 61.Tan S-X, Fisher-Wellman KH, Fazakerley DJ, Ng Y, Pant H, Li J, Meoli CC, Coster ACF, Stöckli J, James DE. Selective insulin resistance in adipocytes. J Biol Chem 290: 11337–11348, 2015. doi: 10.1074/jbc.M114.623686. [DOI] [PMC free article] [PubMed] [Google Scholar]
- 62.Tang T, Glanville J, Hayden CJ, White D, Barth JH, Balen AH. Combined lifestyle modification and metformin in obese patients with polycystic ovary syndrome. A randomized, placebo-controlled, double-blind multicentre study. Hum Reprod 21: 80–89, 2006. doi: 10.1093/humrep/dei311. [DOI] [PubMed] [Google Scholar]
- 63.Taylor NAS. Human heat adaptation. Compr Physiol 4: 325–365, 2014. doi: 10.1002/cphy.c130022. [DOI] [PubMed] [Google Scholar]
- 64.Thiebaud D, Jacot E, DeFronzo RA, Maeder E, Jequier E, Felber JP. The effect of graded doses of insulin on total glucose uptake, glucose oxidation, and glucose storage in man. Diabetes 31: 957–963, 1982. doi: 10.2337/diacare.31.11.957. [DOI] [PubMed] [Google Scholar]
- 65.Vigorito C, Giallauria F, Palomba S, Cascella T, Manguso F, Lucci R, De Lorenzo A, Tafuri D, Lombardi G, Colao A, Orio F. Beneficial effects of a three-month structured exercise training program on cardiopulmonary functional capacity in young women with polycystic ovary syndrome. J Clin Endocrinol Metab 92: 1379–1384, 2007. doi: 10.1210/jc.2006-2794. [DOI] [PubMed] [Google Scholar]
- 66.Wajchenberg BL, Giannella-Neto D, da Silva ME, Santos RF. Depot-specific hormonal characteristics of subcutaneous and visceral adipose tissue and their relation to the metabolic syndrome. Horm Metab Res 34: 616–621, 2002. doi: 10.1055/s-2002-38256. [DOI] [PubMed] [Google Scholar]
- 67.Welt CK, Gudmundsson JA, Arason G, Adams J, Palsdottir H, Gudlaugsdottir G, Ingadottir G, Crowley WF. Characterizing discrete subsets of polycystic ovary syndrome as defined by the Rotterdam criteria: the impact of weight on phenotype and metabolic features. J Clin Endocrinol Metab 91: 4842–4848, 2006. doi: 10.1210/jc.2006-1327. [DOI] [PubMed] [Google Scholar]
- 68.Yin M-J, Yamamoto Y, Gaynor RB. The anti-inflammatory agents aspirin and salicylate inhibit the activity of IκB kinase-β. Nature 396: 77–80, 1998. doi: 10.1038/23948. [DOI] [PubMed] [Google Scholar]
- 69.Yuan M, Konstantopoulos N, Lee J, Hansen L, Li ZW, Karin M, Shoelson SE. Reversal of obesity- and diet-induced insulin resistance with salicylates or targeted disruption of Ikkbeta. Science 293: 1673–1677, 2001. doi: 10.1126/science.1061620. [DOI] [PubMed] [Google Scholar]
- 70.Zachayus JL, Benatmane S, Plas C. Role of Hsp70 synthesis in the fate of the insulin-receptor complex after heat shock in cultured fetal hepatocytes. J Cell Biochem 61: 216–229, 1996. doi:. [DOI] [PubMed] [Google Scholar]
- 71.Zierath JR, Livingston JN, Thörne A, Bolinder J, Reynisdottir S, Lönnqvist F, Arner P. Regional difference in insulin inhibition of non-esterified fatty acid release from human adipocytes: relation to insulin receptor phosphorylation and intracellular signalling through the insulin receptor substrate-1 pathway. Diabetologia 41: 1343–1354, 1998. doi: 10.1007/s001250051075. [DOI] [PubMed] [Google Scholar]