

Abstract
The susceptibility of CD4 T cells to human immunodeficiency virus 1 (HIV-1) infection is regulated by glucose and glutamine metabolism, but the relative contributions of these nutrients to infection are not known. Here we show that glutaminolysis is the major pathway fuelling the tricarboxylic acid (TCA) cycle and oxidative phosphorylation (OXPHOS) in T-cell receptor-stimulated naïve, as well as memory CD4, subsets and is required for optimal HIV-1 infection. Under conditions of attenuated glutaminolysis, the α-ketoglutarate (α-KG) TCA rescues early steps in infection; exogenous α-KG promotes HIV-1 reverse transcription, rendering both naïve and memory cells more sensitive to infection. Blocking the glycolytic flux of pyruvate to lactate results in altered glucose carbon allocation to TCA and pentose phosphate pathway intermediates, an increase in OXPHOS and augmented HIV-1 reverse transcription. Moreover, HIV-1 infection is significantly higher in CD4 T cells selected on the basis of high mitochondrial biomass and OXPHOS activity. Therefore, the OXPHOS/aerobic glycolysis balance is a major regulator of HIV-1 infection in CD4 T lymphocytes.
The susceptibility of CD4 T lymphocytes to HIV-1 infection is significantly increased following activation by cognate foreign antigen or cytokines. On activation, T cells undergo a rapid clonal expansion and it is generally accepted that the intracellular environment associated with cell cycle entry is conducive to HIV-1 infection1. Indeed, extensive research has focused on the roles of cytokines, chemokines and antigenic signals in promoting HIV-1 infection, but more recent data indicate that, at a fundamental level, cellular metabolism regulates T-cell function together with susceptibility to infection.
Glucose and glutamine both fuel cell metabolism, providing carbons and nitrogens for ATP production, nucleotide synthesis and lipid production. The transport of glucose into cells, facilitated by the conserved GLUT family of transporters, is critical for a multitude of cellular functions2–4. Furthermore, glutamine, the most abundant circulating amino acid in the body, can be converted into α-ketoglutarate (α-KG), directly fuelling the TCA cycle in a process known as anaplerosis. Glutamine and glucose metabolism are interrelated; uptake of glutamine via its transporter SLC1A5/ASCT2 is a rate-limiting step in the activation of the mTOR pathway, a key sensor of the cell energy status, which then upregulates GLUT1 (refs.5–8). The interplay between glucose and glutamine metabolism has also been shown to play a role at the level of viral infection. For instance, replication of Semliki Forest, Sindbis and Dengue viruses are dependent on glycolysis, while vaccinia, adenovirus and white spot syndrome virus require glutaminolysis for their replication9–13. Viruses can also impact the metabolic state of their host cell, as observed following cytomegalovirus infection where the nutrient requirement of infected cells switches from glucose to glutamine14,15.
In the context of HIV-1, we and others have shown that the uptake of glucose by GLUT1 regulates the susceptibility of CD4 T cells to infection16–20. Additionally, HIV-1 infection has been found to be associated with increased intracellular glutamine levels21. Thus, augmented cell metabolism appears to support HIV-1 infection in CD4 T lymphocytes. However, glucose and glutamine are involved in distinct, as well as overlapping, metabolic pathways and the precise contributions of glucose and glutamine to infection remain to be identified. Both nutrients can potentially be used to generate nucleotides and precursors for the TCA cycle. Furthermore, while both GLUT1-mediated glucose uptake22 and ASCT2-mediated glutamine uptake23 have been shown to be critical for the optimal activation of murine CD4 T cells, the interplay of these pathways in conditioning human CD4 T-cell stimulation has not yet been elucidated. Here, we demonstrate that naïve and memory CD4 T cells upregulate both aerobic glycolysis and oxidative phosphorylation (OXPHOS) in response to T-cell receptor (TCR) stimulation. However, in both subsets, glutaminolysis is the major factor regulating human CD4 T-cell proliferation and early steps in HIV-1 infection. Notably though, while exogenous deoxyribonucleosides augment T-cell division in glutamine-deprived conditions, they do not enhance susceptibility to HIV-1 infection. Rather, we found that glutamine-derived carbons are the major source of TCA cycle intermediates and identified at least one such intermediate, α-KG, as a key metabolic regulator of metabolic status and infection. Furthermore, conditions promoting carbon allocation to the TCA cycle and/or OXPHOS in CD4 T cells, via provision of α-KG or blockade of the pyruvate to lactate conversion, significantly increase HIV-1 infection. Finally, CD4 T cells selected on the basis of a high mitochondrial biomass (MitoHigh) are significantly more susceptible to HIV-1 infection than cells with low mitochondrial biomass (MitoLow), with the former exhibiting a significantly higher oxygen consumption, a measure of OXPHOS. Thus, a CD4 T cell with an increased energetic state, due to a high level of glutaminolysis, exhibits augmented susceptibility to HIV-1 infection.
Results
Glutaminolysis controls T-cell activation and HIV infection.
The response of CD4 T cells to TCR stimulation is dependent on increased metabolism as demonstrated by the TCR-induced transcription and translation of glucose and amino acid transporters22,24–26. Indeed, engagement of the TCR on human CD4 T cells resulted in the cell-surface induction of both the GLUT1 glucose transporter and the ASCT2 glutamine transporter, as well as corresponding 10–50-fold increases in the uptake of these nutrients (Fig. 1a). Notably, the upregulation of GLUT1 and ASCT2 occurred extremely rapidly, with increased cell-surface levels detected as early as 2 h following stimulation, prior to detection of the CD25 activation marker, and concomitant with the upregulation of the early CD69 marker (Supplementary Fig. 1a). Furthermore, while long-term T-cell stimulation induces a metabolic reprogramming favouring aerobic glycolysis27,28, both glycolysis and oxidative phosphorylation were rapidly augmented in both naïve (T4N) and memory (T4M) CD4 T cells following TCR engagement. The kinetics of this upregulation were similar in naïve and memory subsets, as monitored by increases in the rates of extracellular acidification (ECAR) and oxygen consumption (OCR), but OCR levels were higher in T4M than in T4N cells at late time points (that is, 48 h, Fig. 1b).
Fig. 1 |. TCr stimulation of naïve and memory CD4 T cells results in a rapid induction of glucose and glutamine metabolism that is required for optimal T-cell proliferation and HIV-1 infection.

a, Non-stimulated and αCD3/αCD28-stimulated human CD4 T cells (48 h) were assessed for cell-surface expression of the GLUT1 glucose and ASCT2 glutamine transporters. Control immunofluorescence is shown in grey histograms and specific staining in black line histograms (top). Glucose and glutamine uptakes were assessed by incubation with 2-deoxy-d[1-3H]glucose (2 μCi) or l-[3,4-3H(N)]glutamine (0.5 μCi), respectively, and uptake is expressed as mean counts per minute (cpm) for triplicate samples, error bars indicate s.e.m. (n = 6 replicates from two biologically independent samples). b, OCR and ECAR, measures of OXPHOS and glycolysis, respectively, were monitored following stimulation of naïve and memory CD4 T lymphocytes for 0, 2, 6, 18, 24 and 48 h. Mean levels ± s.e.m. are presented (n = 5 replicates per time point, representative experiment of two biologically independent samples). c, Schematic representation of the replication-incompetent HIV-1 vector harbouring the GFP transgene downstream of the SFFV (spleen focus-forming virus) promoter. LTR, long terminal repeat; SD, splice donor; SA, splice acceptor; ψ, packaging signal; GA-RRE, truncated gag sequence with the rev responsive element; cPPT, central polypurine tract; and LTR-SIN, self-inactivating 3′ LTR (deleted of 400 bp in the U3 region). d, Naïve (T4N) and memory CD4 T cells (T4M) were activated as above and, at 24 h, cells were infected with these HIV-1 virions expressing GFP. Infection was monitored 48 h later as a function of GFP expression. Representative dot plots showing the percentages of infected cells are presented (left) as well as a quantification of the means ± s.e.m. of HIV-GFP+ cells (right; n = 5 biologically independent samples and experiments; two-tailed Student’s t-test; P = 0.001). e, Schematic of the protocol used to evaluate HIV-1 infection following TCR stimulation under nutrient deprivation conditions. f, Following 19 h of TCR stimulation, T4N and T4M were transferred to complete (Nutr+), glucose-deprived (−GLC) or glutamine-deprived (−GLN) media and infection monitored as above. Representative plots (top) and quantification of the mean ± s.e.m. of HIV-GFP+ cells (bottom) are presented (n = 5 biologically independent samples, two-tailed Student’s t-test). *P < 0.05; ***P < 0.001; ****P < 0.0001. All precise P values are presented in Supplementary Table 3.
As both glucose and glutamine can feed overlapping metabolic pathways, it was of interest to determine whether the relative availability of these nutrients differentially affects the susceptibility of CD4 T cells to HIV-1 infection. First, we assessed the relative susceptibility of TCR-activated T4N and T4M lymphocytes to single-round replication-incompetent HIV-1 virions. The self-inactivating vector was pseudotyped with VSV-G and harbours the GFP reporter under the control of a constitutively active promoter, thereby providing a read-out of early stages of HIV-1 infection from reverse transcription to integration (Fig. 1c). Under full nutrient conditions, we found that infection levels in T4M lymphocytes were significantly higher than in T4N lymphocytes, with mean levels of 20.3 ± 1.6% and 26.8 ± 1.9%, respectively (P < 0.01; Fig. 1d). However, in both T4N and T4M lymphocytes, these early steps in infection were significantly more impacted by deprivation of glutamine than of glucose (Fig. 1e,f), with a mean reduction of 73–77% in the former, compared with only a 15–29% reduction in the latter (P < 0.01; Fig. 1f).
Notably, activation markers such as CD69 and CD25 were upregulated in both nutrient-deprived conditions (Supplementary Fig. 1b) and cell viability was maintained, with equivalent cell numbers during the first 48 h (Supplementary Fig. 2a). Nevertheless, cell expansion was minimal in nutrient-deprived conditions at 72 h and proliferation was not rescued by galactose, a nutrient that supports mitochondrial respiration (P < 0.01 relative to nutrient-replete conditions, Supplementary Fig. 2a,b). These data point to the importance of glycolysis at early time points of human T-cell activation and are in accord with previous data in murine T cells, showing that galactose-mediated respiration can fuel proliferation—but only when cells are switched to this metabolic environment at later time points (2 d postactivation)29.
The dramatic impact of glutamine deprivation on early steps of HIV-1 infection, monitored as a function of the HIV-1 transgene, was not due to an inability to express the GFP transgene—GFP+ cells were significantly higher under conditions where T cells were deprived of glutamine following infection (48–72 h) compared with during infection (19–72 h; P < 0.001, Supplementary Fig. 2c). The dependence of CD4 T cells on glutaminolysis was detected over a range of different multiplicities of infection (MOI, Supplementary Fig. 2c). Thus, glutamine appears to be a critical nutrient in controlling the susceptibility of naïve and memory T cells to HIV-1 infection.
Exogenous nucleosides do not rescue HIV-1 infection.
Both glucose and glutamine metabolism allow for the de novo synthesis of nucleotides30. Importantly, HIV-1 infection is restricted under conditions of limiting intracellular nucleotide pools, due to an inability to reverse transcribe the entering HIV-1 RNA31–34. Furthermore, it appears that both glucose- and glutamine-derived nucleotides allow for optimal T-cell proliferation27,28,35–37. However, the relative impact of glycolysis and glutaminolysis in supporting the nucleotide-dependent proliferation of naïve and memory CD4 T cells is not known. We found that TCR engagement induced similar levels of division in naïve and memory T cells under optimal conditions. Moreover, proliferation of both subsets was negatively impacted by glutamine deprivation and more minimally affected by glucose deprivation—in a representative experiment, the percentages of naïve and memory CD4 T cells that underwent >1 division by day 3 poststimulation decreased to 40–60% in the absence of glucose, but plummeted to <20% in both subsets in the absence of glutamine (Fig. 2a, P < 0.0001).
Fig. 2 |. Exogenous nucleosides promote the proliferation of glutamine-deprived CD4 T cells without enhancing HIV-1 infection.
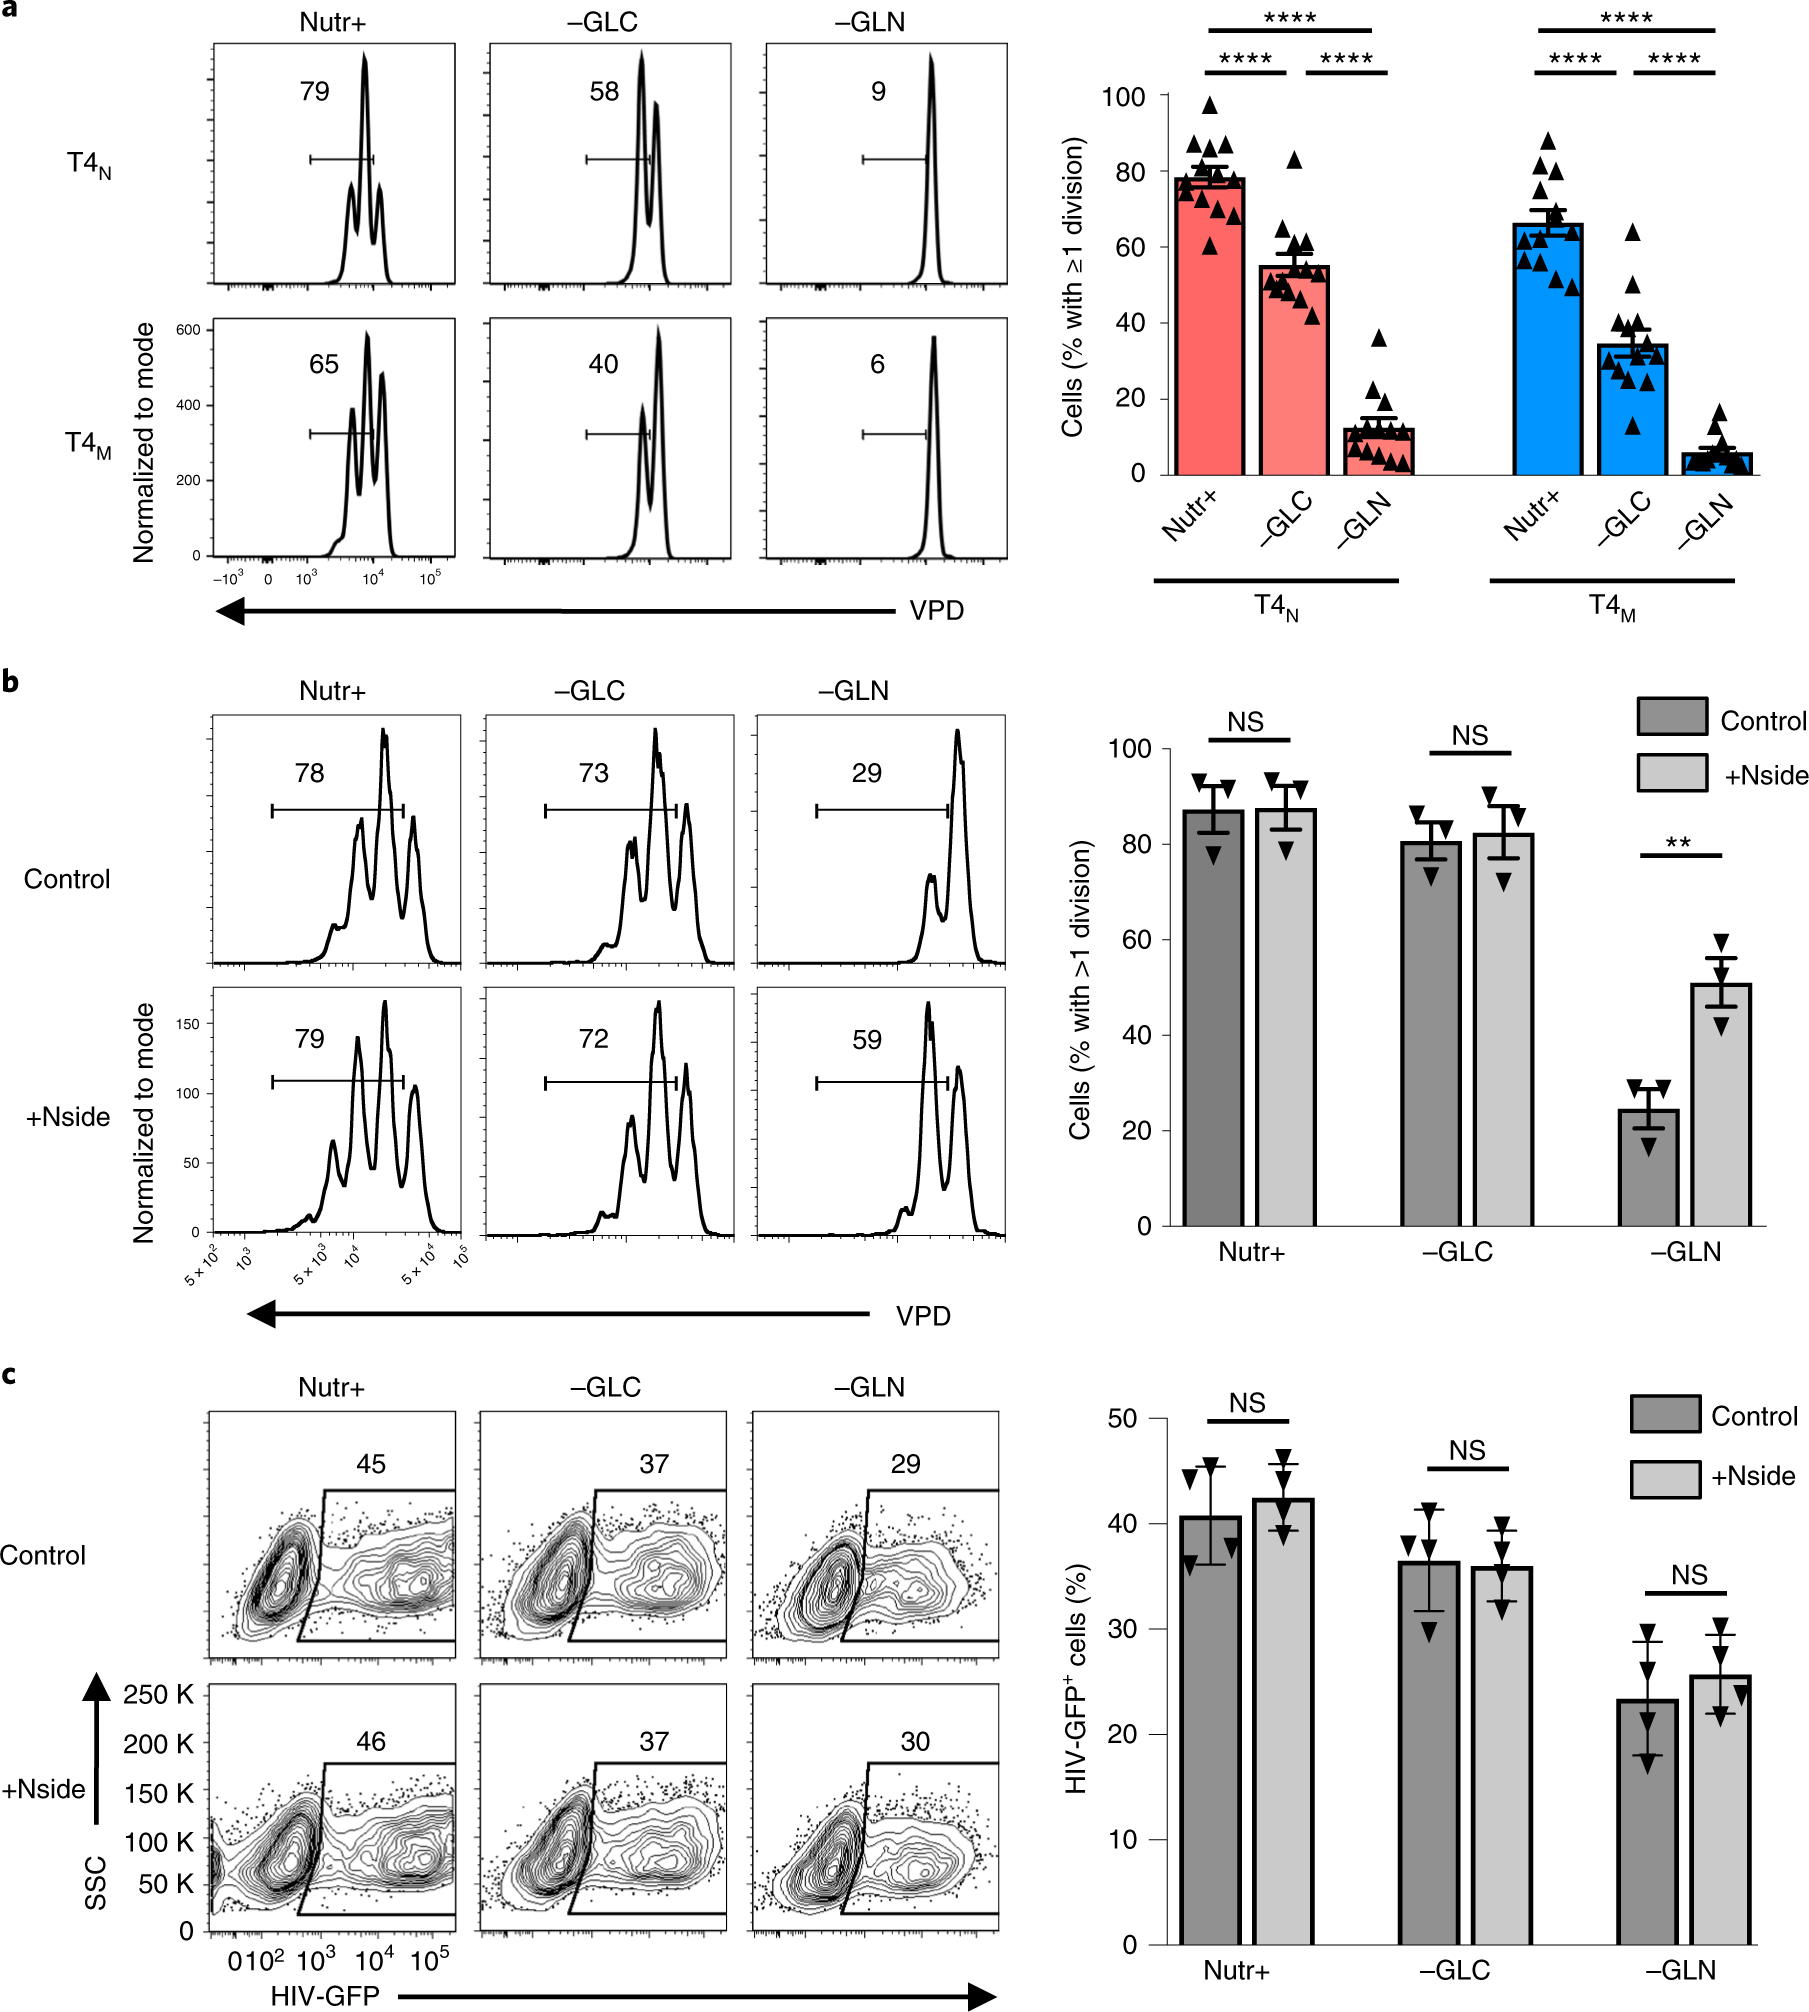
a, Proliferation of naïve (T4N) and memory CD4 T cells (T4M), activated for 19 h and then transferred into either complete (Nutr+), glucose-deprived (−GLC) or glutamine-deprived (−GLN) media, was monitored as a function of VPD450 dilution. Representative data are presented at day 3 post-TCR stimulation. The percentages of cells having undergone ≥1 division are indicated in each histogram and quantifications of the mean ± s.e.m. (right) are presented (n = 13 biologically independent samples, two-tailed Student’s t-test). b, CD4 T cells were activated with CD3/CD28 monoclonal antibodies and, at 19 h postactivation, they were transferred to the indicated nutrient conditions in the absence (Control) or presence of exogenous nucleosides (+Nside). The percentages of cells that underwent ≥1 division are indicated in each histogram and quantifications are shown on the right (mean ± s.e.m., n = 3 biologically independent samples, two-tailed Student’s t-test, P = 0.3802, P = 0.5681 and P = 0.0062, respectively). c, CD4 T cells, activated as in b, in the presence or absence of nucleosides, were infected with single-round HIV-GFP virions and infection was monitored 48 h later. Representative FACS data are shown (left) and quantification of cells harbouring HIV-GFP ± s.e.m. is presented relative to control conditions (mean ± s.e.m., n = 4 biologically independent samples, two-tailed Student’s t-test). NS, not significant; P > 0.05; **P < 0.01, ****P < 0.0001. Horizontal lines represent means and all precise P values are presented in Supplementary Table 3.
The severely reduced level of CD4 T-cell proliferation in conditions of glutamine deprivation suggested the possibility that suboptimal intracellular nucleotide pools negatively impact both cell proliferation and HIV-1 RNA reverse transcription. We therefore assessed whether supplementing CD4 lymphocytes with exogenous nucleosides would rescue T-cell proliferation. Notably, exogenous nucleosides had no impact on proliferation in full nutrient conditions, or even in glucose-deprived conditions, but partially rescued the proliferation of glutamine-deprived CD4 T cells (29% to 59% in a representative experiment; Fig. 2b). Since these data indicated that nucleotide levels were limiting in glutamine-deprived conditions, we expected that exogenous nucleosides would also increase the susceptibility of glutamine-deprived T cells to HIV-1 infection. However, the addition of nucleosides did not significantly alter HIV-1 infection in any of the stimulation conditions (Fig. 2c), strongly suggesting that decreased nucleotide pools were not the major parameter regulating infection in glutamine-deprived CD4 T cells.
Extracellular nutrients alter mTOR activity and OXPHOS.
While exogenous nucleosides did not increase HIV-1 infection in nutrient-deprived conditions, it was interesting to note that their addition did not fully rescue TCR-induced T-cell proliferation (Fig. 2b). Proliferation is regulated by multiple pathways, amongst which are the mTOR signalling cascades, integrating environmental cues from nutrients such as glucose and glutamine into the cellular response36,38–40. In this regard, it is significant that the phosphorylation status of ribosomal protein S6, a downstream mTOR substrate, mirrored the proliferation of CD4 T cells—glucose deprivation only minimally impacted S6 phosphorylation in T4N and T4M subsets but there was a striking reduction on glutamine deprivation (84% to 19% and 76% to 31% in T4N and T4M, respectively; P < 0.0001; Fig. 3a).
Fig. 3 |. The metabolic state of activated human CD4 T cells is regulated by the relative utilization of extracellular glucose and glutamine.
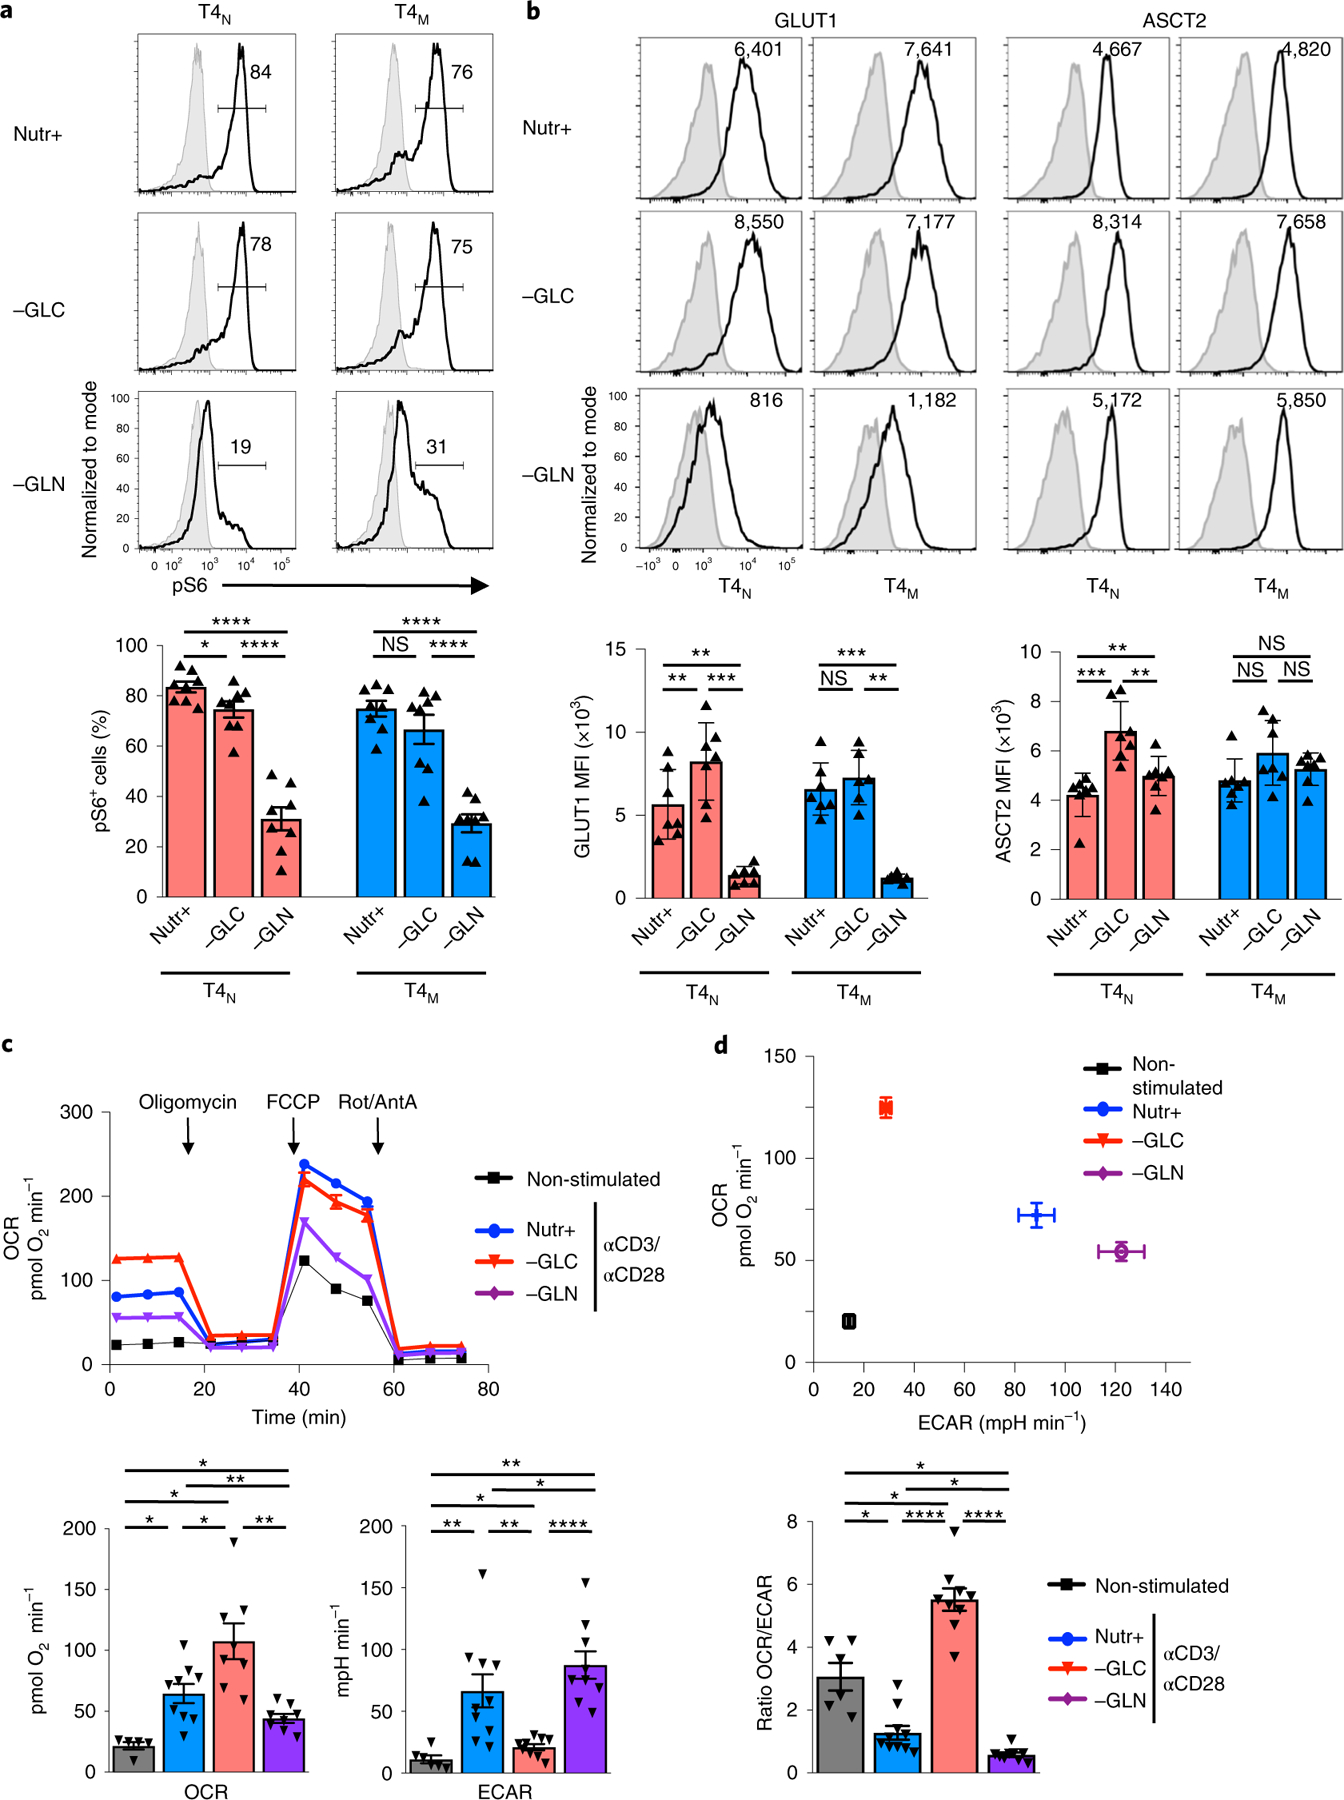
a, Phosphorylation of the S6 ribosomal protein, an mTOR downstream effector, was monitored in TCR-stimulated T4N and T4M cells by intracellular staining at 48 h poststimulation in control, glucose-deprived (−GLC) or glutamine-deprived (−GLN) conditions. Representative histograms are presented with isotype staining presented in grey and control staining in black (top). The mean percentages of pS6+ cells ± s.e.m. are presented (bottom; n = 8 biologically independent samples; two-tailed Student’s t-test). b, Surface GLUT1 and ASCT2 levels were monitored at 48 h as a function of nutrient conditions and representative histograms of seven individual donors, including mean fluorescence intensity (MFI) are presented (top). The mean MFIs ± s.e.m. are presented (bottom). c, OCR and ECAR were monitored in non-stimulated CD4 T lymphocytes or following TCR stimulation (αCD3/αCD28) in the indicated conditions (n = 5 replicates per condition) (top) on a Seahorse XFe96 analyzer following sequential injection of oligomycin, FCCP and antimycin A (AntA)/rotenone (Rot) (arrows). Mean basal OCR and ECAR levels ± s.e.m. are presented (bottom; n = 5 biologically independent samples for non-stimulated, n = 9 biologically independent samples for Nutr+, n = 8 biologically independent samples for −GLC and −GLN conditions; two-tailed Student’s t-test). d, A plot presenting mean basal OCR and ECAR levels (top) and OCR/ECAR ratios (bottom) ± s.e.m. are presented (n = 5 biologically independent samples for non-stimulated, n = 9 biologically independent samples for Nutr+, n = 8 biologically independent samples for −GLC and −GLN conditions; two-tailed Student’s t-test). P > 0.05; *P < 0.05; **P < 0.01; ***P < 0.001; ****P < 0.0001. All precise P values are presented in Supplementary Table 3.
mTOR signalling in murine T lymphocytes has been shown to be regulated by the uptake of multiple nutrients, including glucose, leucine and glutamine22,24,37,41. We therefore assessed whether there were differences in glucose and glutamine transporter profiles in human CD4 T cells activated under glucose versus glutamine deprivation conditions. Notably, in the absence of glucose, neither GLUT1 nor ASCT2 levels were significantly decreased in T4N or T4M subsets and, indeed, they were even augmented in T4N cells. However, in the absence of glutamine, GLUT1 levels were decreased in both subsets by a mean of 0.2-fold (Fig. 3b). Thus, under conditions of glutamine deprivation, CD4 T cells did not exhibit a compensatory increase in GLUT1 transporter levels, and this may have contributed to the decreased mTOR signalling detected under these conditions.
The data presented above strongly suggested that changes in extracellular glucose and glutamine differentially modulate the metabolism of an activated CD4 T cell. Indeed, the relative induction of OXPHOS and aerobic glycolysis, measured as a function of OCR and ECAR, respectively, were altered in nutrient depletion conditions. In the absence of glucose, there was a significant increase in OXPHOS while in the absence of glutamine, OXPHOS was minimal but glycolysis was significantly increased (Fig. 3c,d). These changes resulted in a massively altered OCR/ECAR ratio in CD4 T cells activated in glucose-depleted versus glutamine-depleted conditions (P < 0.0001; Fig. 3d), unveiling distinct impacts of extracellular nutrients on the metabolic state of an activated T cell as well as on the plasticity of cellular metabolism.
Inhibition of aerobic glycolysis increases HIV-1 infection.
The data presented above suggested that in the absence of glutaminolysis, a high level of glucose metabolism is not sufficient to support HIV-1 infection. It was therefore of interest to determine how glucose is being used in activated CD4 T cells. To this end, we traced the fate of glucose carbons in activated CD4 T cells and found the vast majority of lactate produced by aerobic glycolysis was the result of glucose metabolism; the fractional of the intracellular lactate pool incorporating glucose-derived 13C atoms was >60%, whereas the contribution of carbons of glutamine to the lactate pool was less than 2% (Fig. 4a).
Fig. 4 |. Inhibiting glycolysis results in increased susceptibility of CD4 T cells to HIV-1 infection.
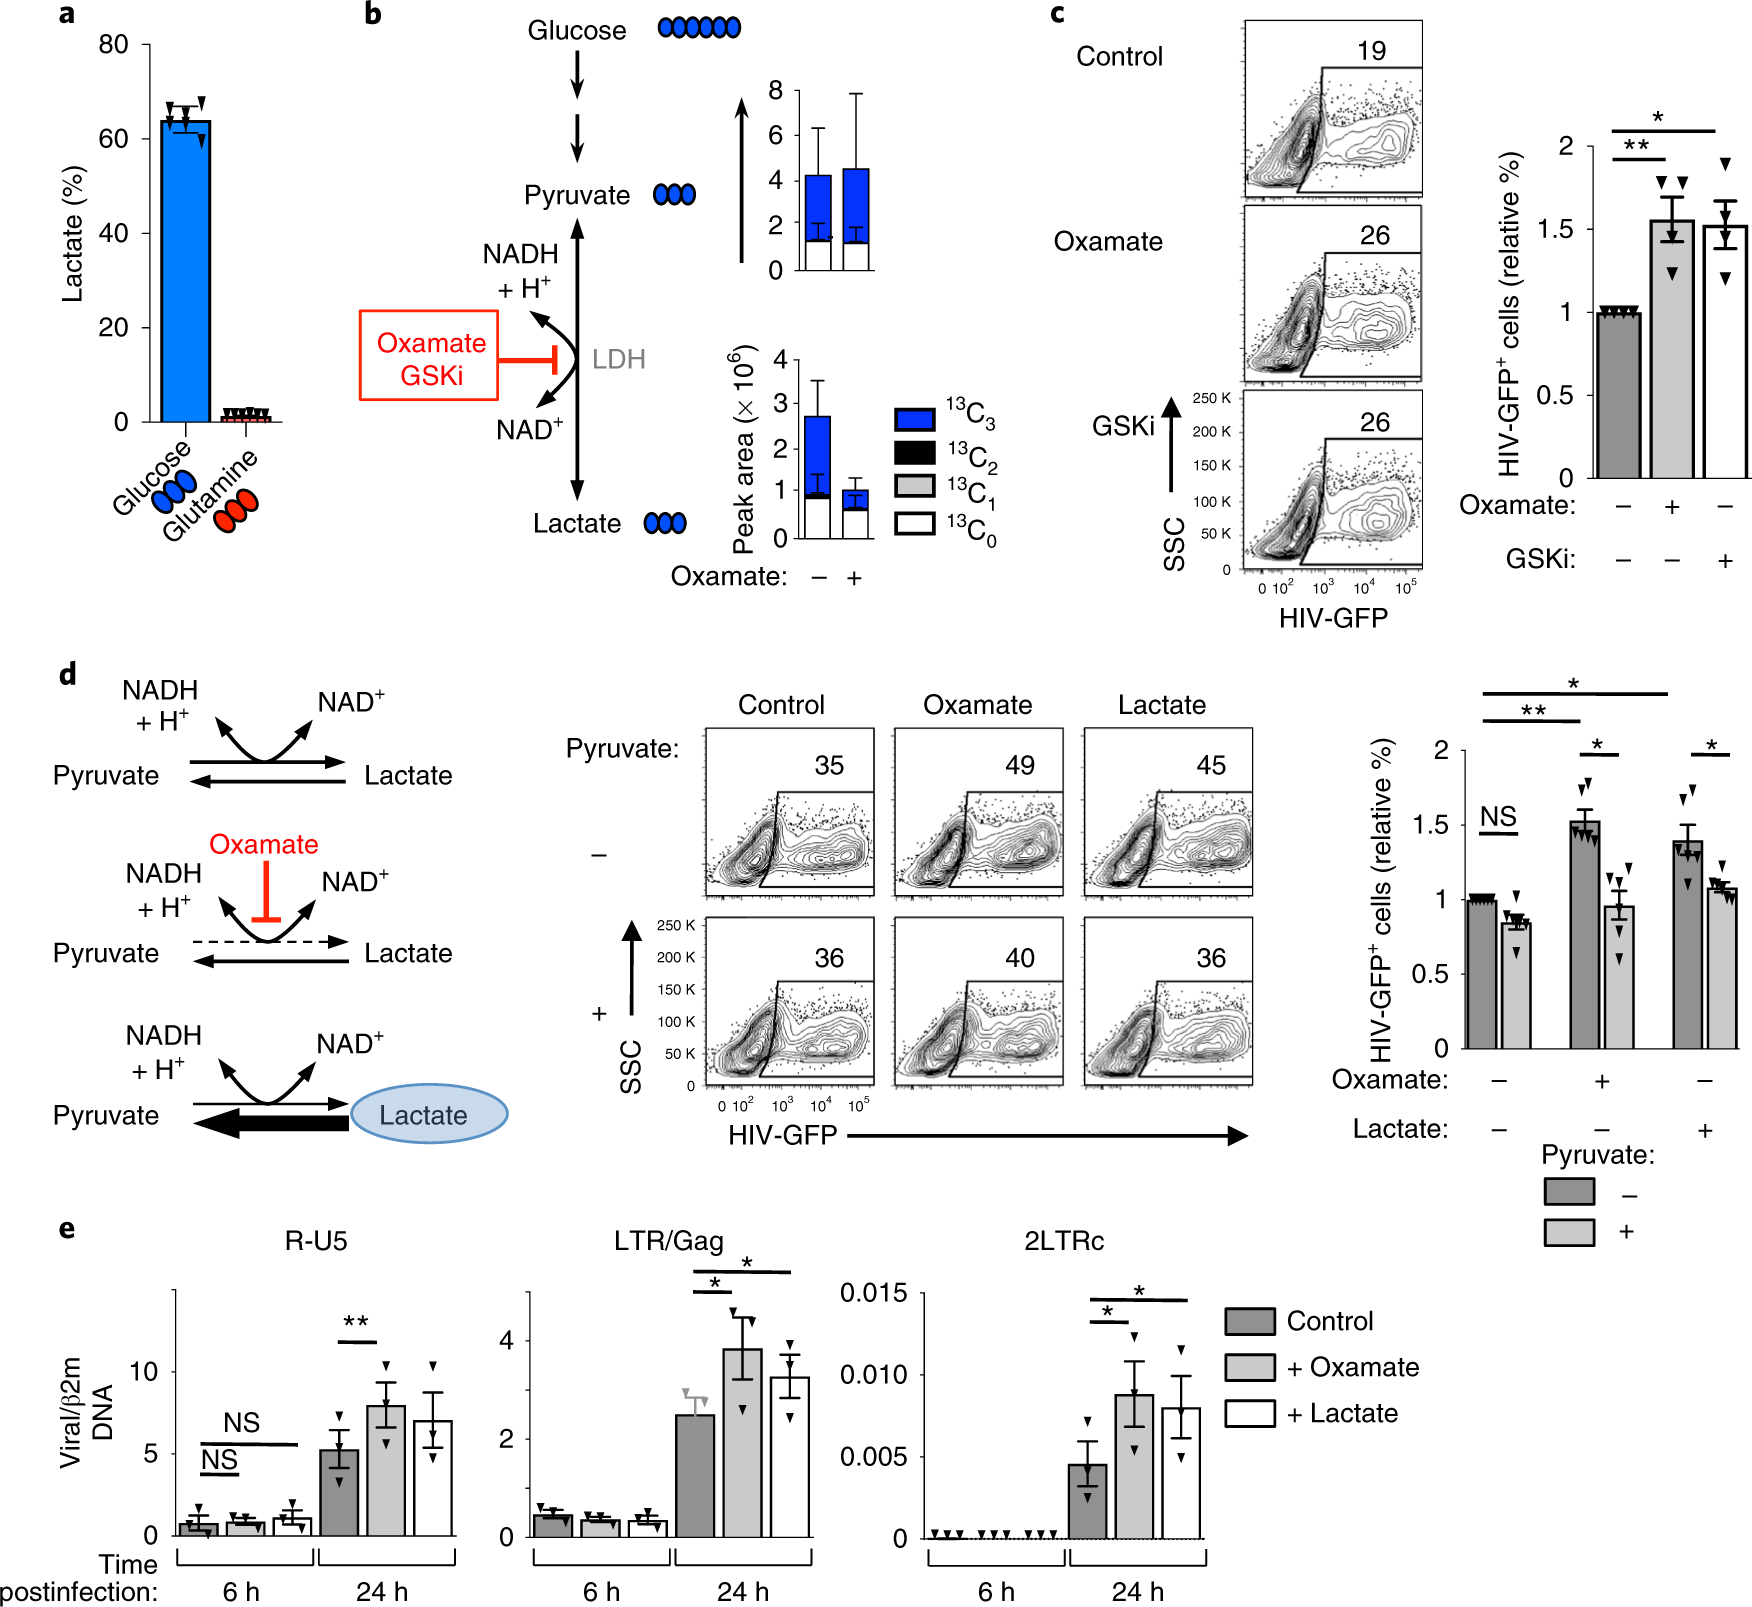
a, Relative abundance of 13C3-lactate in 48 h TCR-activated CD4 T cells (mean ± s.e.m., n = 6 technical replicates from two biologically independent samples). b, 13C3-lactate and 13C3-pyruvate levels were assessed following TCR stimulation of CD4 T cells under control conditions or following LDH inhibition with the competitive pyruvate analogue oxamate. Total pool size and distribution of isotopologues are presented (mean ± s.e.m., n = 6 technical replicates from two biologically independent samples). c, CD4 T cells were activated in the presence or absence of oxamate or the competitive LDHA inhibitor, GSK2837808. Cells were infected at 24 h with single-round HIV-GFP virions and representative dot plots are shown 48 h later (left panels). Quantification ± s.e.m. of HIV infection in the different conditions is presented (right; n = 4 biologically independent samples, two-tailed Student’s t-test). *P = 0.0347; **P = 0.0067. d, Schematic representation of the effects of the pyruvate analogue oxamate (red) and exogenous lactate (blue circle) on the LDH-mediated forward and reverse conversions between pyruvate and lactate (left). Representative plots (middle plots) and mean levels of HIV-GFP+ cells ± s.e.m. (right histograms) are presented (n = 6 individual donors, one-way ANOVA plus Tukey’s test). e, CD4 T cells were activated in the absence or presence of lactate or oxamate as above. The presence of early (R-U5) and late (LTR-Gag) reverse-transcript viral DNAs, as well as 2-LTR circles, a surrogate of successful nuclear entry, were monitored by qPCR at 6 h and 24 h postinfection. Mean levels ± s.e.m. in each condition relative to β2m DNA are presented (technical triplicates of three biologically independent samples; two-tailed Student’s t-test). P > 0.05; *P < 0.05; **P < 0.01; ***P < 0.001. All precise P values are provided in Supplementary Table 3.
This result raised the possibility that glucose-fuelled aerobic glycolysis is not required for early steps in HIV-1 infection. To test this hypothesis, we traced 13C6-glucose in activated CD4 T cells incubated with oxamate, a competitive inhibitor of lactate dehydrogenase (LDHi). In oxamate-treated cells, the levels of total lactate, as monitored by mass spectrometry (MS), were significantly lower and glucose-derived lactate (13C3) decreased from a mean of 64% to 37% (Fig. 4b). It is important to note that LDHi did not inhibit global glucose metabolism in TCR-stimulated CD4 T cells. In fact, while markedly decreasing the levels of glycolytic intermediates downstream of the glyceraldehyde 3-phosphate dehydrogenase reaction, LDH inhibition favoured the shunting of glucose carbons into the pentose phosphate pathway (PPP, Supplementary Fig. 3a). Furthermore, the entry of glucose carbons into the TCA cycle, as monitored by the presence of heavy carbons in α-KG, was significantly increased from 30.8 ± 0.18% to 42.7 ± 0.59%, (n = 6, P < 0.0001; Supplementary Fig. 3b). Under these conditions, LDH inhibition by oxamate increased HIV-1 infection in CD4 T cells by a mean of 1.5-fold (P < 0.01; Fig. 4c). A competitive inhibitor of the LDHA subunit of LDH42, GSK2837808A (GSKi), also augmented HIV-1 infection to similar levels (P < 0.05; Fig. 4c). Thus, aerobic glycolysis is not required for optimal HIV-1 infection and infection is increased under conditions where glucose carbons are shunted into the PPP and TCA cycle.
The above experiments were performed in the context of pharmacological inhibitors and, as such, it was important to assess whether the detected effects were specifically due to alterations in the targeted LDH pathway. We therefore targeted LDH activity by directly altering lactate and pyruvate levels, which affect the direction of the LDH-catalysed reaction (that is. intracellular lactate inhibits the LDH-mediated reduction of pyruvate to lactate while, conversely, intracellular pyruvate reverses this effect; Fig. 4d, left). Indeed, as observed for oxamate, exogenous lactate significantly increased the percentage of infected cells (P < 0.05; Fig. 4d). Importantly, this effect was directly due to an inhibition of LDH-mediated pyruvate reduction, since the stimulatory consequences of both oxamate and lactate on HIV-1 infection were abrogated by exogenous pyruvate (P < 0.05; Fig. 4d).
To determine whether the negative impact of aerobic glycolysis on HIV-1 infection occurred following virus entry, we monitored viral reverse transcription (RT) products at early and late time points postinfection (6 h and 24 h). We found that the increased infection of CD4 T cells under conditions of attenuated glycolysis was not associated with increased RT at early time points (6 h) but, importantly, by 24 h postinfection, early (R-U5) and late RT products (LTR-Gag) accumulated to higher levels in CD4 T cells where glycolysis was inhibited, revealing an increased level of reverse transcription (P < 0.05 for LDH inhibition and lactate supplementation; Fig. 4e). Furthermore, 2-LTR circle products, surrogate markers of complete reverse transcription and nuclear entry, were augmented by even higher levels (100%) in LDH-inhibited and lactate-treated cells compared with control TCR-activated CD4 T cells (P < 0.05; Fig. 4e). These data demonstrate that retrotranscription and nuclear import of full-length HIV-1 RT products are promoted under conditions of diminished aerobic glycolysis (that is, in the presence of LDH inhibition or exogenous lactate) and indicate that the negative impact of LDHA-mediated reduction of pyruvate to lactate on HIV-1 infection operates at an early post entry level.
α-KG enhances infection in glutamine-deprived conditions.
The augmented level of HIV-1 infection in CD4 T cells with decreased aerobic glycolysis, together with the significantly reduced level of HIV-1 infection in glutamine-deprived cells, raised a question as to the role of the TCA cycle and/or OXPHOS in HIV-1 infection. Notably, we found that inhibiting mitochondrial respiration (at 24 h poststimulation) with either oligomycin, an inhibitor of ATP synthase, or antimycin A, a complex III-specific inhibitor of the electron transport chain, completely blocked infection under conditions of glucose deprivation (Fig. 5a). However, the low level of infection in glutamine-deprived cells was not impacted by oligomycin or antimycin (Fig. 5a). Thus, OXPHOS is a sine qua non for HIV-1 infection under conditions where glucose metabolism is compromised.
Fig. 5 |. under conditions of glutamine deprivation, α-ketoglutarate rescues early steps in HIV-1 infection.
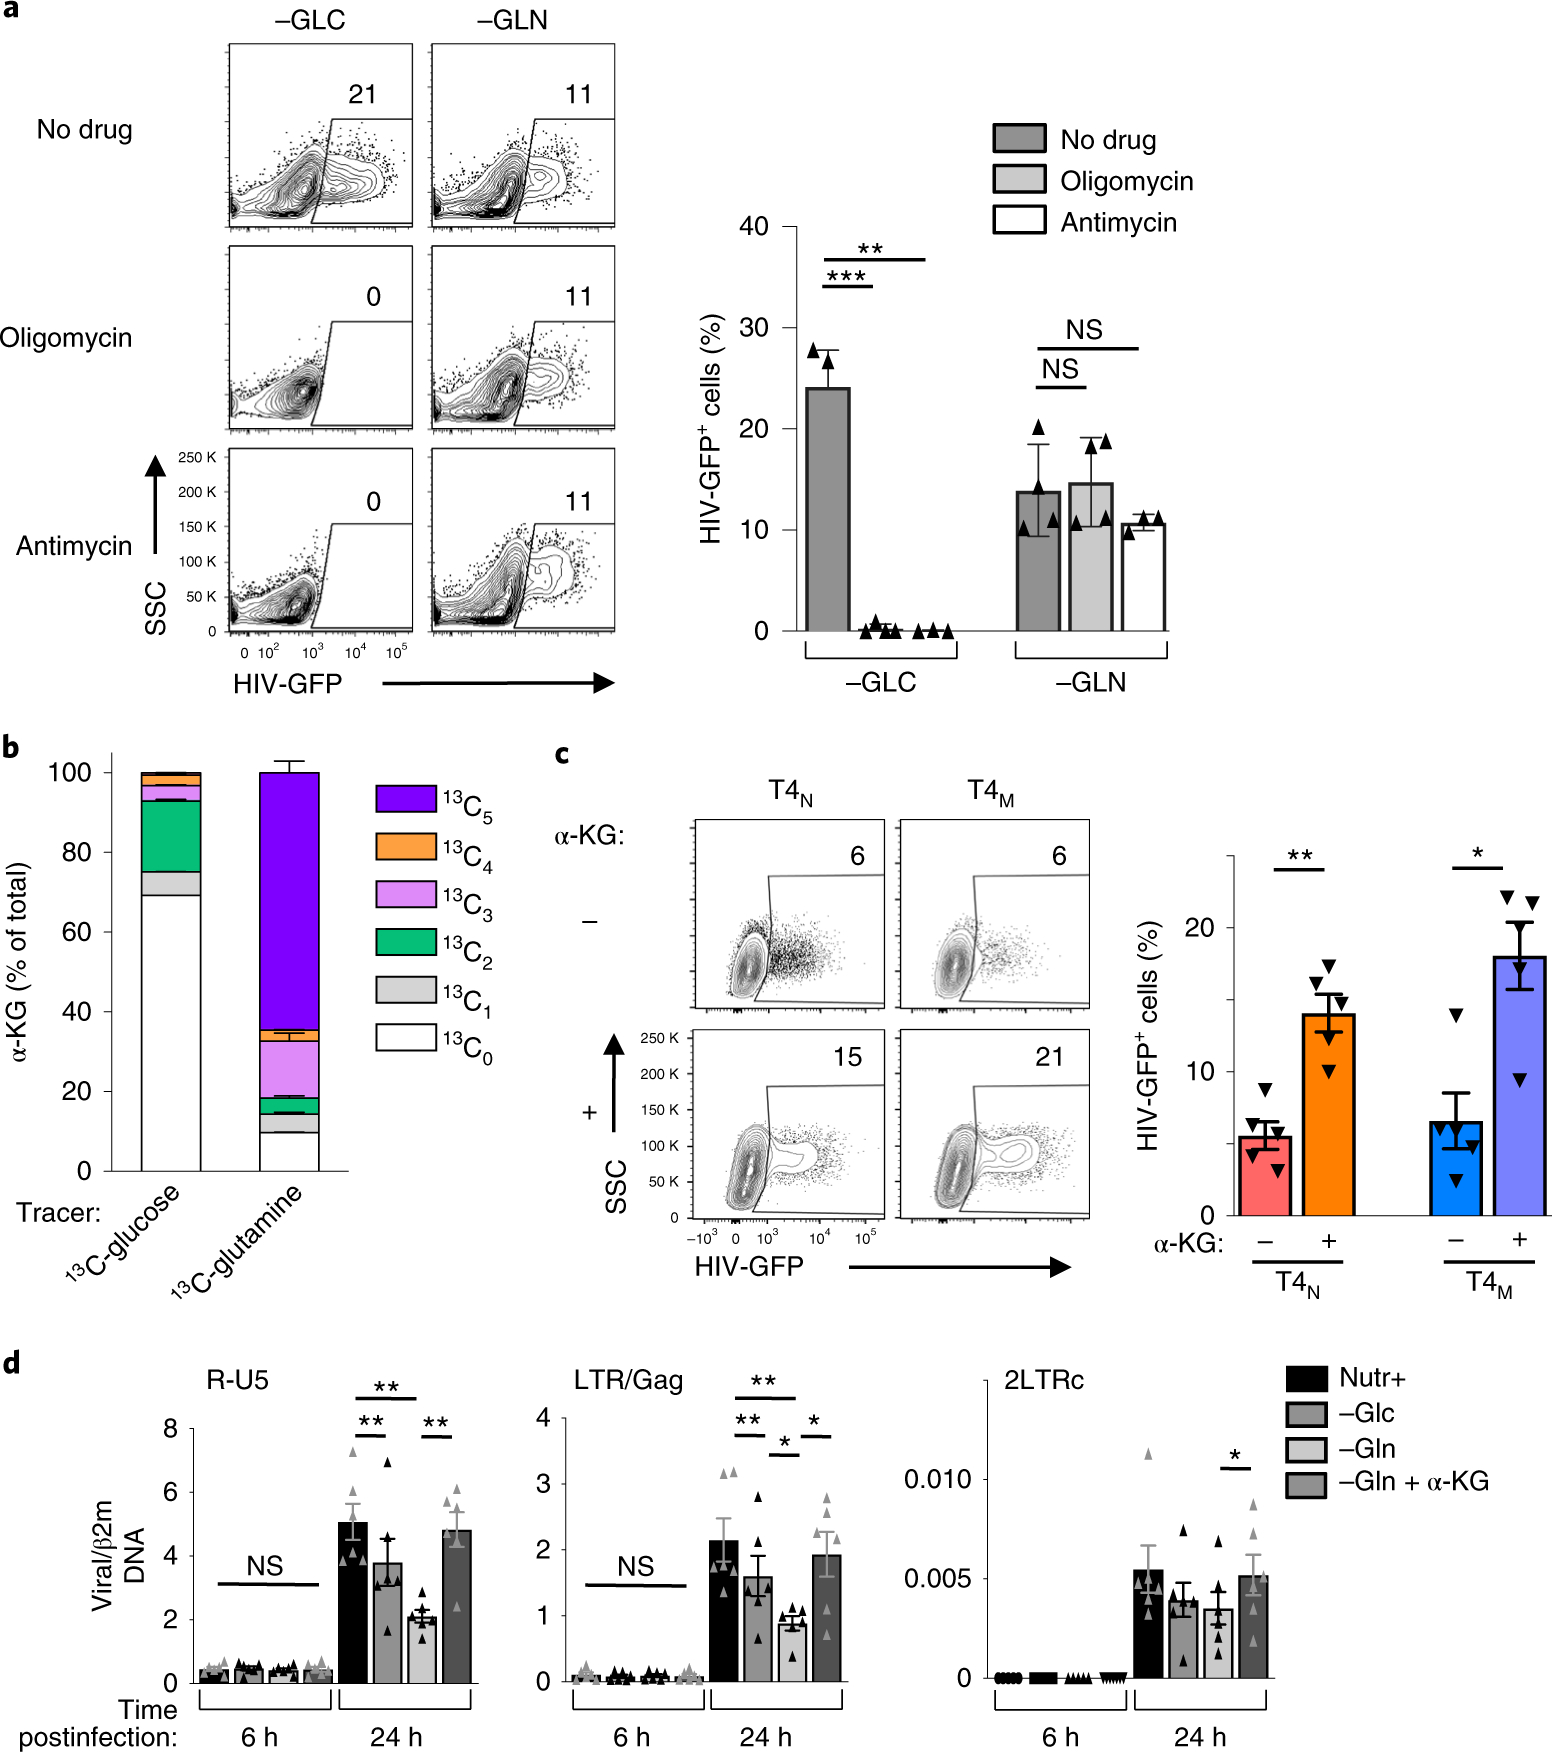
a, CD4 T cells were activated in glucose-deprived or glutamine-deprived conditions in the absence or presence of oligomycin or antimycin A (1 μM). Cells were infected with HIV-1-GFP virions and reporter expression was monitored 48 h later. Representative dot plots are shown (left panels) and mean percentages ± s.e.m. are presented (right; n = 4 biologically independent samples for no drug and antimycin A conditions and n = 3 biologically independent samples for oligomycin condition; two-tailed Student’s t-test, ***P = 0.0008, **P = 0.0089, NS P = 0.5807 and P = 0.3965, respectively). b, The distribution of α-KG isotopologues from 13C-glucose and 13C-glutamine to α-KG are shown (mean ± s.e.m.; n = 6 technical replicates from two biologically independent samples). c, T4N and T4M lymphocytes were activated in glutamine-deprived conditions in the absence or presence of α-KG (dimethyl α-KG), as indicated, and infected at 24 h with single-round HIV-GFP virions. Representative dot plots are shown 48 h later (left panels). Quantification ± s.e.m. of HIV infection in the different conditions is presented (right; n = 5 biologically independent samples, two-tailed Student’s t-test, **P = 0.0059 for T4N and *P = 0.0135 for T4M). d, CD4 T cells were activated in complete (Nutr+), glucose-deprived (−GLC) or glutamine-deprived (−GLN) media in the absence or presence of α-KG, as indicated. The presence of early (R-U5) and late (LTR-Gag) reverse-transcript viral DNAs, as well as 2-LTR circles (LTRc), a surrogate of successful nuclear entry, was monitored by qPCR at 6 h and 24 h postinfection. Mean levels ± s.e.m. in each condition relative to β2m DNA are presented (means of technical triplicates from six biologically independent samples; two-tailed Student’s t-test). NS P > 0.05; *P < 0.05; **P < 0.01. All precise P values are presented in Supplementary Table 3.
To begin to assess the relative contributions of glucose- and glutamine-derived intermediates to the TCA cycle, we first evaluated the generation of α-KG, a metabolite that can be produced from either glucose or glutamine carbons. Tracing of glucose or glutamine, uniformly labelled with heavy carbon (13C) atoms, in activated CD4 T cells demonstrated that the percentage of total α-KG incorporating heavy carbon atoms derived from glutamine was significantly higher than that for glucose (~90% and 30%, respectively; Fig. 5b). Indeed, in activated CD4 T cells, glutamine carbons abundantly entered into the TCA cycle; 13C5-α-KG represented ~65% of the total α-KG pool and 13C5-α-KG progressed through a second turn of the cycle, as indicated by an ~15% fraction of 13C3-α-KG in the total pool (Fig. 5b and Supplementary Fig. 3c). Thus, the anaplerotic contribution of glutamine is critical for TCA cycle activity in activated CD4 T lymphocytes.
α-KG directly activates mTORC1 signalling in transformed and primary cell lines22,24,37,41,43. We therefore assessed whether cell-permeable α-KG (dimethyl ketoglutarate) increases mTORC1 signalling in glutamine-deprived T4N and T4M lymphocytes. Notably, α-KG significantly increased phosphorylation of the downstream mTOR substrate, S6, in both naïve and memory CD4 T cells (Supplementary Fig. 4). Even more importantly, we found that the addition of α-KG significantly increased the susceptibility of both T4N and T4M lymphocytes to HIV-1 infection under glutamine-deprived conditions (**P < 0.01 for T4N and *P < 0.05 for T4M; Fig. 5c). Moreover, in glutamine-deprived conditions, exogenous nucleosides did not further increase the α-KG-mediated augmentation in infection (Supplementary Fig. 5).
It is important to note that the impact of nutrient deprivation on HIV-1 infection, as well as the rescue of infection by α-KG, was due to post fusion steps. First, the cellular uptake of Gag p24 following a short 2-h exposure to virus particles was equivalent in all conditions, as assessed by the levels of p24 relative to the cellular ZAP-70 protein (Supplementary Fig. 6a). Second, we assessed the role of fusion using HIV-1 virions incorporating beta-lactamase-Vpr (BlaM-Vpr). In this system, fusion can be detected following loading of cells with CCF2 as this fluorescent dye is a target of BlaM and, following its cleavage, its fluorescence emission changes to the blue spectrum (447 nm)44,45. Importantly, CCF2 cleavage was not altered by nutrient deprivation nor by α-KG supplementation, indicating that these metabolic changes modulated infection at a post fusion level (Supplementary Fig. 6b). Moreover, we found that while nutrient deprivation resulted in attenuated early (R-U5) and late (LTR-Gag) RT products at 24 h postinfection, the presence of α-KG significantly increased R-U5, LTR-Gag and 2-LTR circles in glutamine-deprived conditions (P < 0.05 or P < 0.01; Fig. 5d). Thus, a TCA intermediate, α-KG, can alter the susceptibility of CD4 T cells to infection.
Wiring CD4 cell metabolism to OXPHOS augments HIV infection.
The findings presented, namely that both LDH inhibition and exogenous α-KG stimulated HIV-1 infection in CD4 T lymphocytes, strongly suggested that infection is promoted by increased TCA cycling and/or OXPHOS. Addition of α-KG promoted OXPHOS in both naïve and memory CD4 T cells stimulated under glutamine deprivation conditions, as evaluated by their OCR (Fig. 6a). Moreover, this was a direct effect, as injection of α-KG into the flux analyser immediately increased oxygen consumption (P < 0.001; Fig. 6a). Under these α-KG-supplemented conditions, ECAR was also decreased, resulting in a heavily skewed OXPHOS/glycolysis ratio (Fig. 6a). Similarly, LDH inhibition, by oxamate or lactate, increased OXPHOS while massively decreasing glycolysis. Thus, this metabolite change also resulted in a skewed OXPHOS/glycolysis ratio (Fig. 6b). It is important to note that under conditions of LDH inhibition as well as α-KG supplementation, the increased levels of OCR were associated with an augmented mitochondrial ATP production (Fig. 6a,b), an increase that would correlate with a higher OXPHOS. Altogether, these data show that a high OCR/ECAR ratio, and a corresponding increase in mitochondrial ATP, probably reflecting increased mitochondrial biosynthetic capacity, positively correlates with the level of HIV-1 infection.
Fig. 6 |. Enhanced respiratory capacity is associated with increased levels of HIV-1 infection.
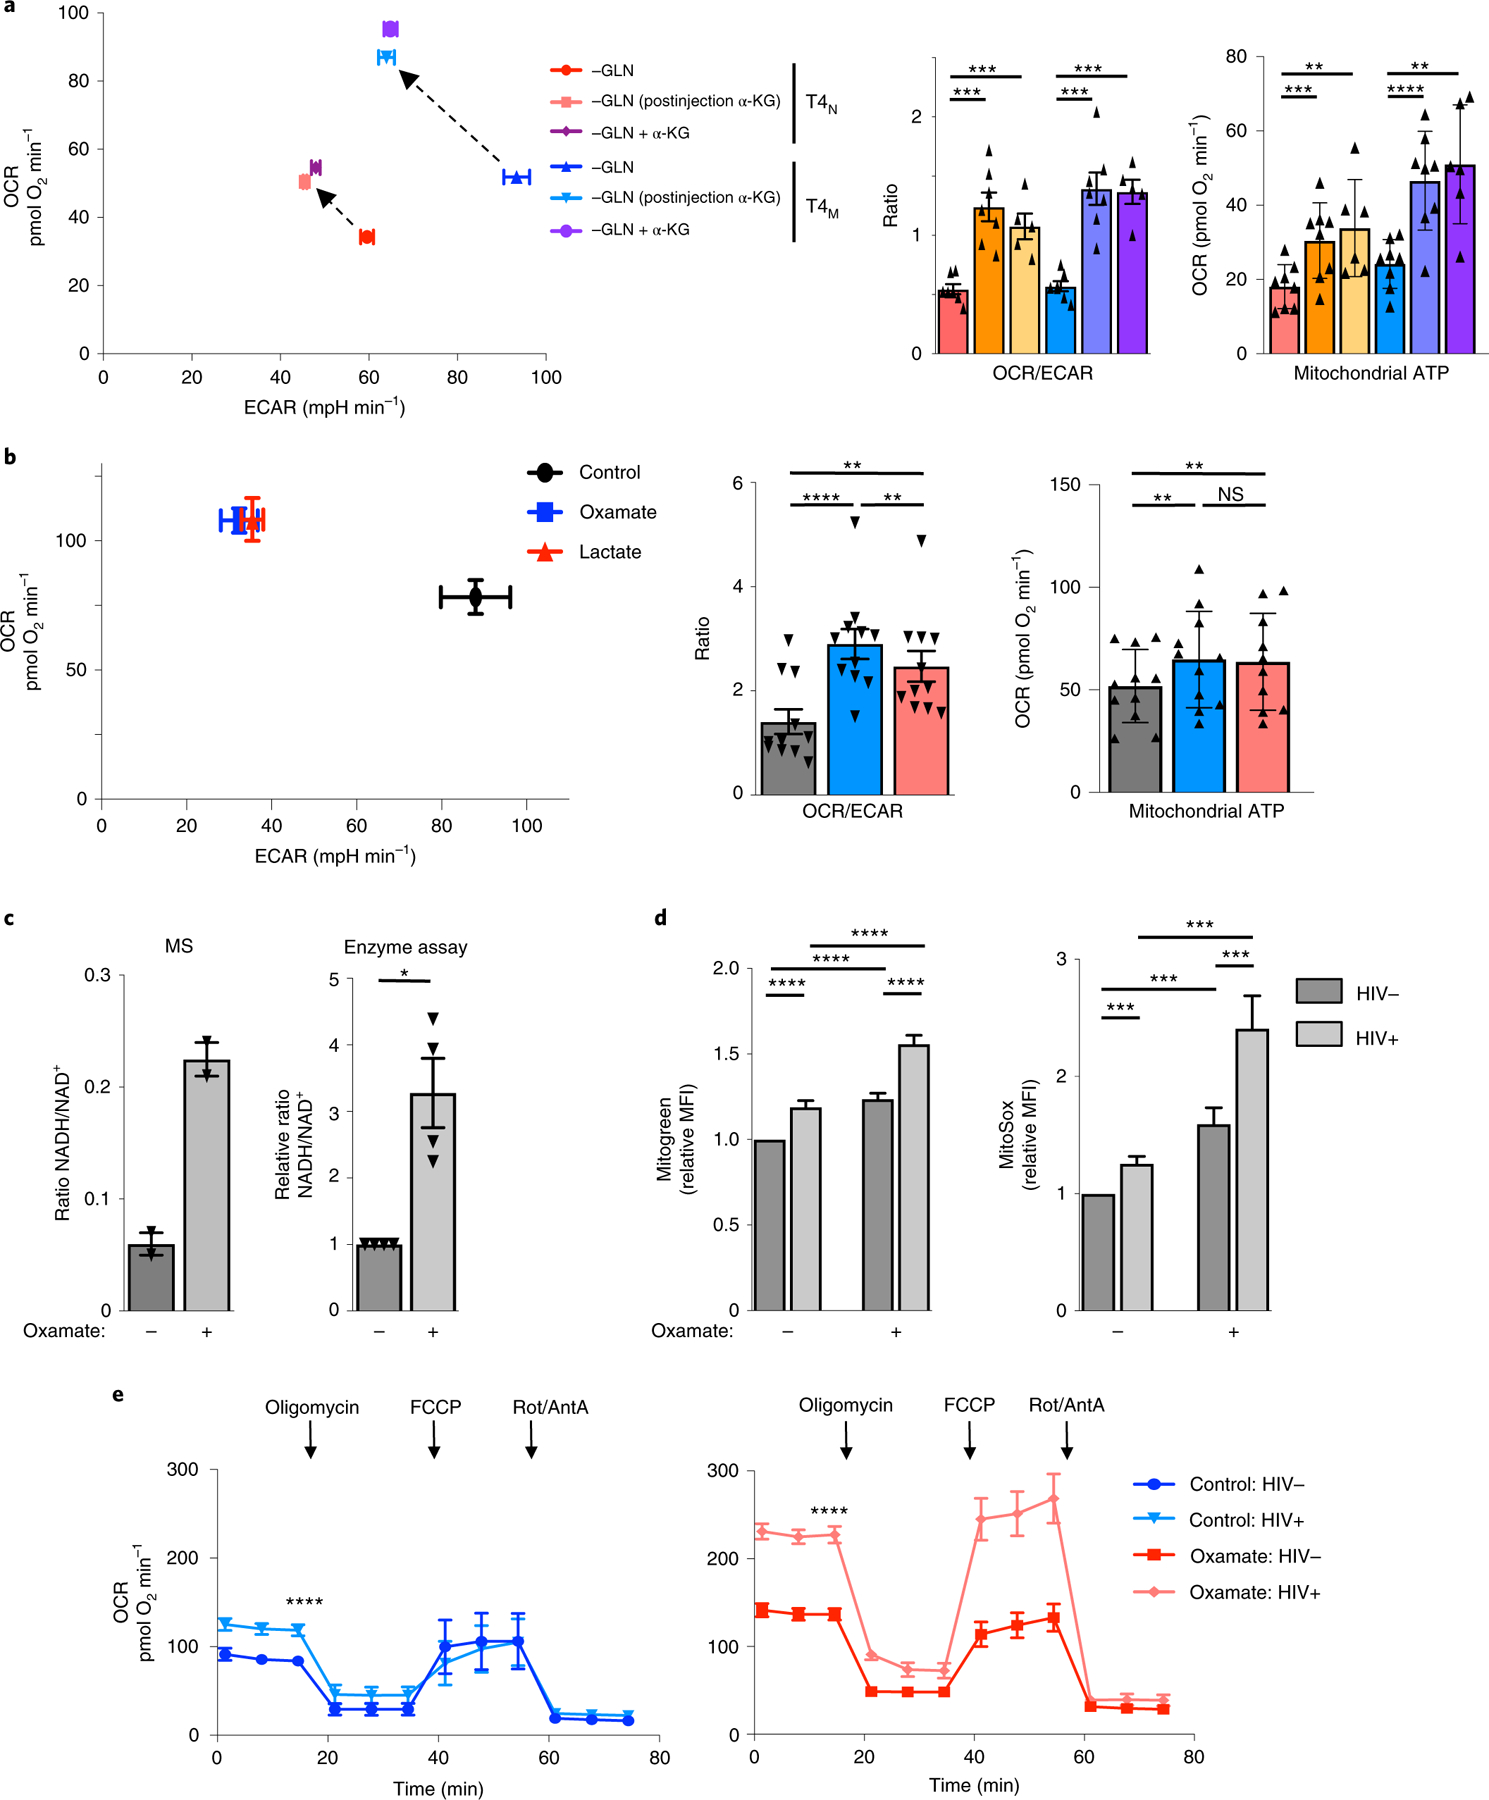
a, OCR and ECAR levels were assessed in TCR-stimulated glutamine-deprived T4N and T4M lymphocytes (48 h) in the absence or presence of α-KG and immediately following injection of α-KG (dimethyl α-KG) into the XFe96 flux analyser (dashed arrows; left). Quantification ± s.e.m. of OCR/ECAR ratios and mitochondrial ATP production in the indicated conditions are presented (right; n = 7 biologically independent samples for all conditions except for ‘−GLN+ α-KG’ where n = 5 biologically independent samples were used; two-tailed Student’s t-test; ***P = 0.0003, P = 0.0010, P = 0.0002, P = 0.0002). b, Mean OCR and ECAR levels in CD4 T cells, activated in the presence or absence of oxamate or lactate (48 h), are presented with measure of centre reflecting the mean levels of both OCR and ECAR ± s.e.m. of each parameter (left). Mean OCR/ECAR ratios as well as mitochondrial ATP production ± s.e.m. are shown (n = 11 biologically independent samples; two-tailed Student’s t-test; **P = 0.0014 for control versus lactate, P = 0.0073 for oxamate versus lactate, ****P < 0.0001). c, The ratio of NADH/NAD+ was assessed in T cells activated in the absence or presence of LDH inhibition by mass spectrometry (MS; left panel), assessing only the light isotopologues (M+0, mean ± s.e.m., n = 6 technical replicates in two biologically independent samples), and by an enzymatic assay (right panel, mean ± s.e.m., n = 4 biologically independent samples, two-tailed Student’s t-test; *P = 0.0222). d, Mitochondrial biomass and mitochondrial ROS were evaluated by MitoGreen and MitoSox staining, respectively. Relative MFIs (mean ± s.e.m., defined as the ratio of the MFI in each independent sample relative to the control condition in the absence of oxamate) in HIV− and HIV+ CD4 T-cell subsets are presented (n = 18 biologically independent samples for MitoGreen and n = 15 biologically independent samples for MitoSox; two-tailed Student’s t-test; ***P < 0.001; ****P < 0.0001). e, CD4 T cells, activated in the absence or presence of oxamate, were infected with single-round HIV-1 virions harbouring a truncated CD8 molecule. At 48 h later, infected cells were sorted on the basis of CD8 expression and OCR was then monitored in HIV− and HIV+ subsets as indicated. Representative data are shown and mean levels ± s.e.m. are presented (n = 5 biologically independent samples, two-tailed Student’s t-test, ****P < 0.0001). All precise P values are presented in Supplementary Table 3.
An accumulation of NADH stores has been shown to shift a cell’s metabolic equilibrium towards OXPHOS46,47 and indeed, LDH inhibition was coupled to a 3–4-fold increase in the NADH/NAD+ ratio (P < 0.05, Fig. 6c). The metabolic shift in CD4 T cells was also coupled to a significantly increased mitochondrial mass and the production of reactive oxygen species (ROS) following LDH inhibition (P < 0.001 and P < 0.0001, respectively; Fig. 6d). Moreover, a direct comparison of non-infected and infected CD4 T cells revealed a significantly higher mitochondrial biomass and level of reactive oxygen species in the latter, irrespective of LDH inhibition (Fig. 6d). These results suggested that CD4 T cells infected by HIV-1 would exhibit higher levels of OXPHOS than their non-infected counterparts. To assess this point, we infected CD4 T cells with a replication-incompetent HIV-1 harbouring a truncated CD8 receptor, allowing infected cells to be positively sorted. Importantly, basal rates of oxygen consumption were significantly higher in HIV-1-infected CD4 T cells compared with non-infected cells, and this was the case in control TCR-stimulated CD4 T cells and following activation under conditions of LDH inhibition (Fig. 6e).
The data presented here revealed a higher level of OXPHOS in infected compared with non-infected CD4 T cells. To assess whether mitochondrial function and biosynthetic activity directly impacts on the susceptibility of CD4 T cells to early steps in HIV-1 infection, we sorted activated lymphocytes by fluorescence-activated cell sorting (FACS) on the basis of their mitochondrial biomass, monitored as a function of MitoTracker Green staining (Fig. 7a and Supplementary Fig. 7). To confirm that sorted cells with the 10% lowest (MitoLow) and highest (MitoHigh) MitoTracker Green staining exhibited the expected differences in respiration, oxygen consumption was assessed. As shown in Fig. 7a, MitoHigh CD4 lymphocytes exhibited significantly higher OCR levels than MitoLow cells (P < 0.01). The relative susceptibility of these subsets to infection was then assessed by a short exposure (2 h) of MitoLow and MitoHigh T cells to HIV-1 virions under coculture conditions where they were distinguished by violet proliferation dye (VPD). To avoid any potential VPD-related bias, VPD-stained MitoLow cells were cocultured at a 1:1 ratio with unstained MitoHigh cells and the inverse was also performed (Fig. 7b). Notably, MitoHigh T cells exhibited a significantly higher susceptibility to HIV-1 infection, as assessed by the percentage of infected cells and the level of reporter expression (Fig. 7b). Together these data reveal the critical role of mitochondrial metabolism, with an environment rich in TCA intermediates such as α-KG, in regulating the susceptibility of CD4 T cells to HIV-1 infection.
Fig. 7 |. Mitochondrial biomass regulates the susceptibility of CD4 T cells to HIV-1 infection.
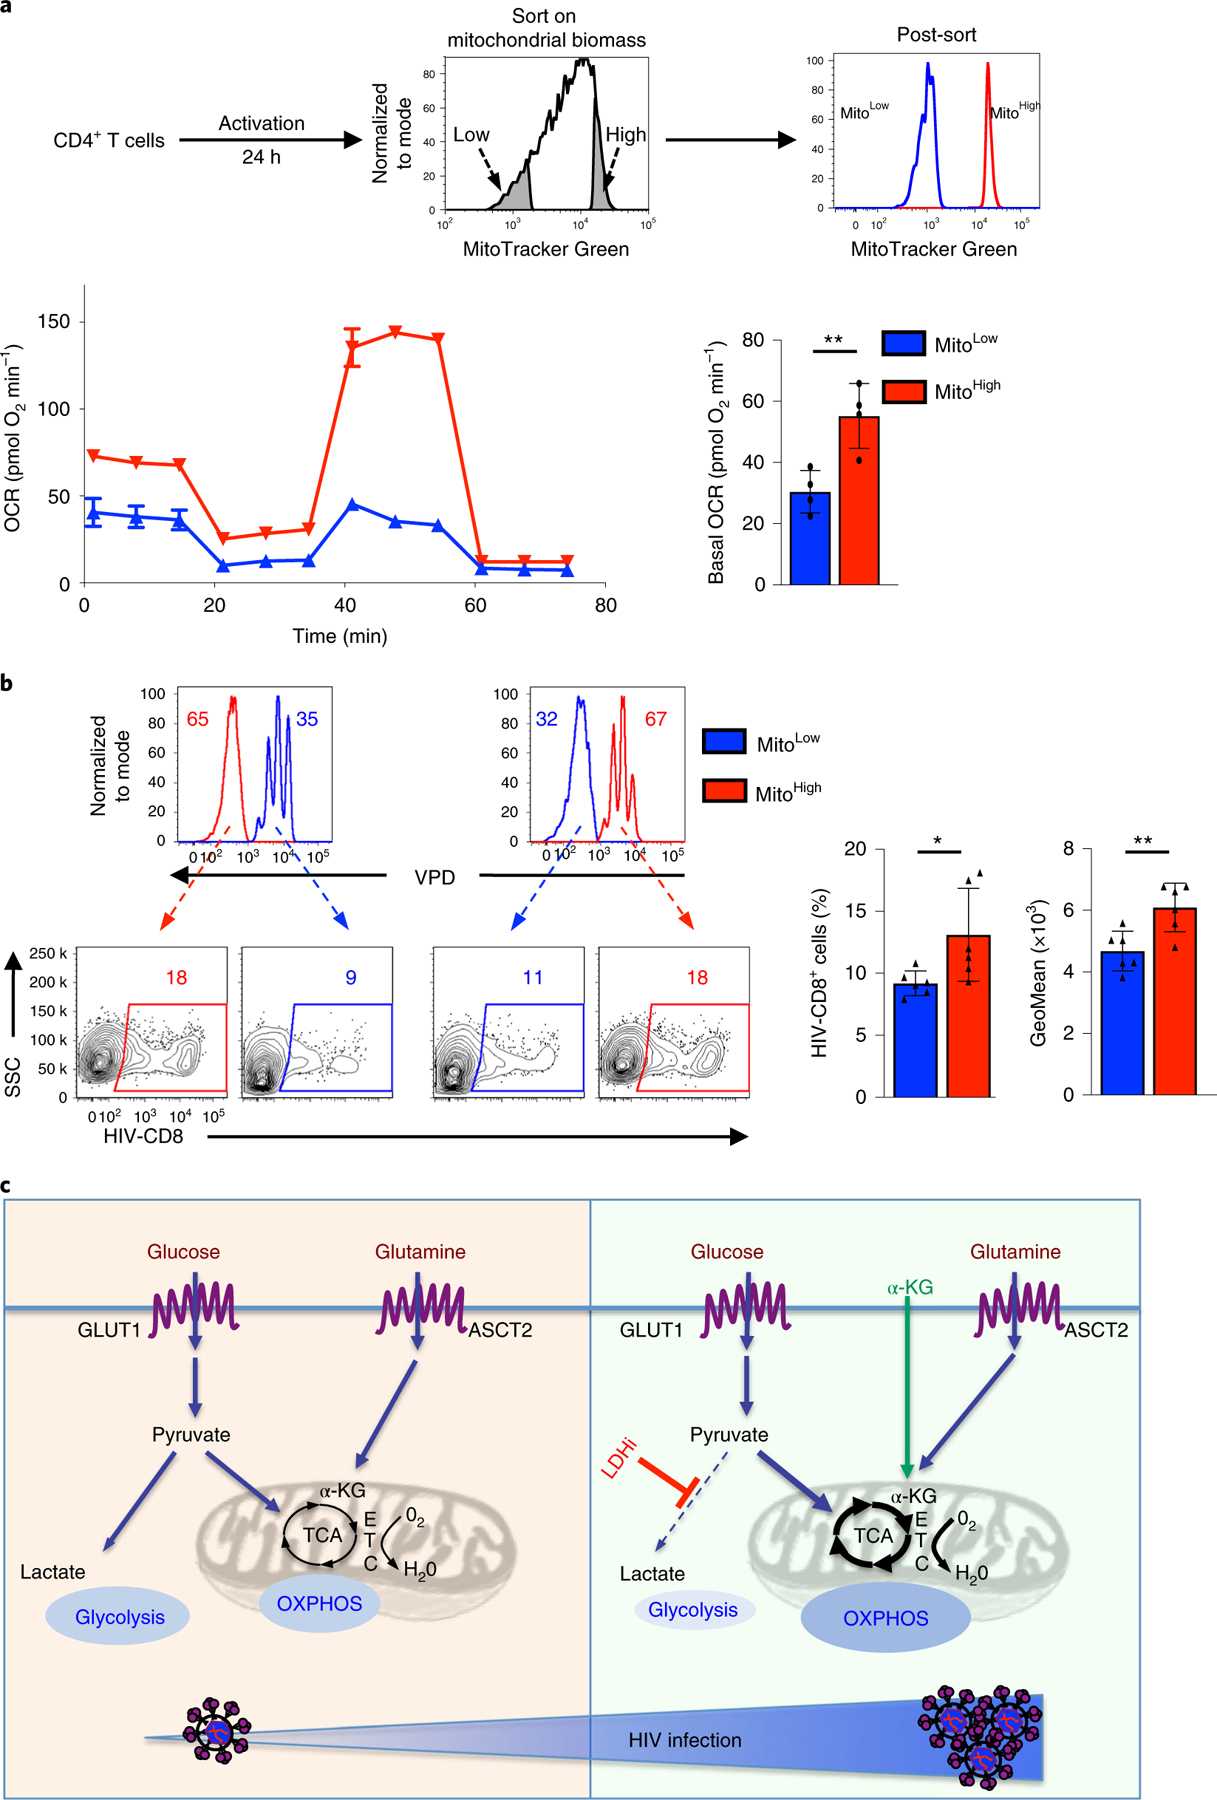
a, CD4 T cells were activated for 24 h and sorted by MitoTracker Green staining. The 10% of cells with the lowest (blue histogram) and highest (red histogram) mitochondrial biomass were sorted as shown and representative histograms showing the sorted populations are shown. Mitochondrial function on the sorted CD4 T cells was assessed by monitoring OCR (mean ± s.e.m.; n = 3 biologically independent samples per condition; left bottom). Basal OCR was quantified and measure of centre reflects means levels ± s.e.m. are presented (n = 4 biologically independent samples, two-tailed Student’s t-test; **P = 0.0015; right bottom). b, To assess the relative infection of CD4 T cells with high (MitoHigh) and low (MitoLow) mitochondrial biomass, sorted populations were distinguished by VPD staining and mixed prior to infection. MitoLow CD4 T cells were VPD-stained and mixed with unstained MitoHigh T cells (left) or MitoHigh CD4 T cells were VDP-stained and mixed with unstained MitoLow T cells (right). Mixed cells were exposed to single-round HIV-1 virions harbouring a truncated CD8 molecule for 2 h (immediately following sorting) and then washed to remove free virions. The percentages of VPD− and VPD+ cells were evaluated by flow cytometry (48 h) and representative histograms are presented (top). HIV-1 infection was evaluated on the basis of CD8 expression and percentage infection is shown (bottom left). Quantification of HIV-1-infected MitoLow and MitoHigh cells ± s.e.m. are presented (middle) as well as the geometric mean ± s.e.m. of transgene staining in infected cells (n = 6 technical replicates from three biologically independent samples, two-tailed Student’s t-test). *P = 0.0450; **P = 0.0016 All precise P values are presented in Supplementary Table 3. c, Schematic of HIV-1 infection following TCR stimulation. Induction of GLUT1 and ASCT2 transporters following TCR stimulation results in increased aerobic glycolysis and oxidative phosphorylation (OXPHOS), respectively (left). Under conditions where glucose is shunted into the TCA cycle by LDH inhibition (LDHi) or exogenous α-KG directly feeds the TCA cycle, there is an increased fuelling of the electron transport chain (ETC) and an increased OXPHOS (right). This metabolic reprogramming, with an augmented OXPHOS/aerobic glycolysis ratio, is associated with an enhanced level of HIV-1 infection (bottom).
Discussion
The energetics of T cells are dramatically altered following TCR stimulation, allowing them to proliferate in response to antigen. While the new energetic and biosynthetic demands of an activated T lymphocyte can be met by different nutrients, several elegant studies have shown that the phenotype and fate of the cell are conditioned by the pathways by which a given nutrient is used (reviewed in refs.48,49). In the context of HIV-1 infection, recent work has shown the importance of an increased metabolic activity in promoting HIV-1 infection in CD4 T lymphocytes, but it was not known whether the pathways by which these nutrients are used regulate infection. Here, we identify a metabolic environment in both naïve and memory CD4 T lymphocytes, with increased oxidative phosphorylation relative to aerobic glycolysis, as a critical factor for HIV-1 infection. Intriguingly, under conditions of limiting glutaminolysis where low nucleotide levels restrained T-cell proliferation, exogenous nucleosides augmented proliferation but not HIV-1 infection. Rather, the glutamine-derived generation of TCA cycle intermediates was a key element, with ectopic α-KG leading to an increase in OXPHOS and HIV-1 infection. Furthermore, decreasing the utilization of glucose through aerobic glycolysis resulted in a significantly increased oxygen consumption and an augmented level of infection. However, it is notable that HIV-1 infection was not rescued in cells cultured in galactose, which forces respiration without aerobic glycolysis. Rather, infection was increased under conditions of LDH inhibition. Under these conditions, the conversion of pyruvate to lactate was attenuated but the entry of glucose carbons into the PPP was dramatically augmented. Thus, early steps of HIV-1 infection are supported by entry of glucose and glutamine carbons into the PPP and TCA cycle, respectively.
Previous studies from our laboratory and others have pointed to the importance of GLUT1 induction and downstream glycolysis in supporting HIV-1 infection16–20. While our present study highlights the contribution of glutamine carbons to the TCA cycle and subsequent OXPHOS as the critical determinants in HIV-1 infection, it is important to note that in the context of glucose deprivation, both GLUT1 and the ASCT2 glutamine transporter were highly upregulated (Fig. 3b). However, under conditions of decreased glutaminolysis, the upregulation of GLUT1 is compromised. Thus, the TCR-regulated cross-talk between glycolysis and glutaminolysis can only be fully evaluated under conditions of glutamine catabolism as the latter is a sine qua non for GLUT1 induction. Importantly, Valle-Casuso et al. recently revealed that HIV-1-infected cells, selected on the basis of GLUT1, also exhibit a significantly increased level of OXPHOS, pointing to the concordant upregulation of nutrient transport and susceptibility to HIV-1 infection50.
TCR stimulation results in a massive upregulation in aerobic glycolysis but mitochondrial metabolism is critical; within 15 min of TCR stimulation, mitochondrial ROS are generated, creating a positive feedback loop for TCR signalling51,52. Indeed, mitochondrial metabolism alone can support T-cell proliferation and mitochondrial ROS, generated as by-products of mitochondrial respiration, are a prerequisite for antigen-specific expansion and function53–55. Our present study reveals the importance of mitochondrial function in early steps of HIV-1 infection. Infected CD4 T cells exhibited higher respiratory capacity than uninfected cells. Moreover, on sorting CD4 T cells on the basis of their mitochondrial biomass, we detected significantly higher levels of infection in Mitochondrial-high compared with Mitochondrial-low lymphocytes. The importance of mitochondrial activity has been shown in the context of human cytomegalovirus (HCMV) infection where viral growth is dependent on the HCMV-mediated upregulation of mitochondrial biogenesis56. Thus, early steps of HIV-1 infection are facilitated by an enhanced mitochondrial biosynthetic activity. It will be important to assess whether this effect is directly due to increased engagement of carbons in the TCA cycle and/or whether this process is regulated by the generation of mitochondrial ROS.
The experiments performed in our study made use of single-round HIV-1 virions pseudotyped with the VSV-G envelope. This allowed us to assess the metabolic programs regulating the early stages of viral infection in CD4 T cells, without the confounding effects of viral receptor expression or viral-induced cell death, and under conditions where metabolic changes did not impact on viral entry/fusion. The earliest viral complementary DNA detectable after fusion and uncoating is the strong-stop cDNA spanning the R-U5 region of the viral LTR57. At early time points postinfection (6 h), neither this reverse-transcribed DNA nor full-length viral DNAs were detected at higher levels in T cells with abrogated LDH activity compared with control T cells (Fig. 4e). However, by 24 h postinfection, accumulation of full-length reverse-transcribed DNAs and 2-LTR circles, a surrogate marker of nuclear import of viral DNA58, were significantly higher in LDH-inhibited T cells. Similarly, the low level of reverse-transcribed viral DNAs in glutamine-deprived CD4 T cells was significantly increased by the α-KG metabolite (Fig. 5d). Furthermore, the impact of metabolism on these steps of infection was independent of a SAMHD1-mediated restriction on the overall level of dNTPs cells32,59–61 as infection was not augmented by exogenous nucleosides (Fig. 2c). Therefore, the OXPHOS/glycolysis balance is critical for the control of HIV reverse transcription and nuclear import, as shown schematically in Fig. 7c.
Our finding that a metabolic environment favouring mitochondrial activity, PPP utilization and a higher NADH/NAD+ ratio results in an increased susceptibility to HIV-1 infection opens new strategic avenues for controlling disease progression. Interestingly, the significantly higher susceptibility of memory CD4 T cells to HIV-1 infection, compared with their naïve counterpart, correlated with higher levels of OXPHOS in the former (Fig. 1b). In future work, it will be important to determine whether the potential of the HIV-1 Vpu accessory protein to downregulate SNAT1-mediated alanine transport and subsequent alanine metabolism62,63 modulates, or is modulated by, the level of oxidative phosphorylation of the T cell. Furthermore, the interplay between alanine, glucose and glutamine metabolism in regulating HIV-1 infection in CD4 T-cell subsets that exhibit distinct metabolic requirements36,64–66 merits further study. Indeed, Th17 lineage cells, a CD4 T-cell subset that displays a high level of OXPHOS67–69, have been found to be highly permissive to HIV-1 infection and replication70,71. The ensemble of our data demonstrates that a bias in the OXPHOS/glycolysis balance towards the former promotes HIV-1 infection of CD4 T cells.
Methods
CD4 T-cell isolation and culture.
Blood from anonymous healthy donors was obtained from the Etablissement Francçais du Sang (French Blood Bank) under approval number 21/PLER/MTP/CNR02/2013–0076a. CD4 T cells were purified using negative-selection Rosette tetramers (StemCell Technologies) and the purity of the cell population was monitored on a FACS-Canto II (BD Biosciences). Naïve and memory CD4 T cells were purified by negative selection using IgG Pan Mouse Dynabeads (Dynal) following incubation with anti-CD45RO (clone UCHL1, Becton Dickinson) and anti-CD45RA (clone 5H9, Becton Dickinson), respectively, according to the manufacturer’s instructions. Purities were always greater than 92%. Sample gating strategies for lymphocytes are shown in Supplementary Fig. 7. Lymphocytes (1 × 10⁶ per well in a 24-well plate) were cultured in RPMI medium 1640 + GlutaMAX (Gibco-Life Technologies) supplemented with 10% fetal calf serum (FCS) and 1% penicillin/streptomycin (Gibco-Life Technologies). As indicated, cells were stimulated for 19 h in complete medium and then cultured in media containing FCS but without glucose or glutamine (Fig. 1e) or in the presence of the Embryomax nucleoside mix (Merck-Millipore), 25 mM sodium oxamate (Sigma-Aldrich), 60 μM GSK2837808A (Tocris Bioscience), 50 mM sodium lactate (Sigma-Aldrich), 10 mM sodium pyruvate (Sigma-Aldrich) and cell-permeable dimethyl α-KG (3.5 mM, Sigma-Aldrich), as indicated. For TCR stimulation, 24-well plates were coated with anti-CD3 (clone OKT3, Biolegend) and antiCD28 (clone 9.3, kindly provided by C. June) at a concentration of 1 μg ml−1. Cell proliferation was monitored by labelling with VPD450 (Becton Dickinson; 1 μM) for 3 min at 37 °C.
Flow cytometry analyses.
To detect expression of surface markers, cells were incubated with the appropriate fluorochrome-conjugated monoclonal antibodies and expression was monitored in comparison with isotype controls. Antibodies against CD4, CD25 and CD69 were from Beckman Coulter. Surface GLUT1 and ASCT2 expression was monitored by binding to their respective retroviral envelope ligands fused to eGFP and rFC (METAFORA Biosystems) at room temperature and, for rFc-coupled ligand, binding was revealed with an AlexaFluor647conjugated anti-mouse IgG (Invitrogen)72–75. Phosphorylation of S6 was assessed by staining with an anti-pS6 antibody (clone 91B2; Cell Signaling) and revealed with a secondary anti-rabbit IgG coupled to AlexaFluor647 (Life Technologies). The presence of mitochondrial mass and superoxide production were assessed by staining with MitoTracker Green (1 μM and 25 nM for cell sort experiments) and MitoSox Red (1 μM) indicator (ThermoFisher Scientific). All antibodies are listed in Supplementary Table 1. Cells were assessed on a FACS-Canto II or BD LSR II-Fortessa (BD Biosciences) and data were analysed using Diva (BD Biosciences; v.8.0.1) or FlowJo (Tree Star) software (v.10). Antibody validity information is provided in the Reporting Summary.
Virus production and infections.
Self-inactivating HIV-1-derived viruses were generated by transient transfection of 293 T cells76. Briefly, for HIV vector production, cotransfection was performed with PsPax2, encoding Gag, Pol, Rev and Tat, and the GFP-encoding HIV-1-derived SIN vector pHIV-SFFV-GFP, and the VSV-G pseudotyping envelope, pCMV-VSV-G. The medium was changed after 16 h of transfection and virus was collected 48 h later. Concentration of virus was performed by ultracentrifugation for 2 h at 4 °C at 25,000 r.p.m. In indicated experiments, HIV virions harbouring a truncated cell-surface CD8 molecule were used (kindly provided by C. Goujon) and in fusion assays, virions incorporating BlaM-Vpr were produced by cotransfection. Viral supernatant was collected 48 h posttransfection, centrifuged, filtered and concentrated on a 20% sucrose cushion for 2 h at 125,000g in a Beckman Optima X Series ultracentrifuge. Titres were assessed on Jurkat cells to determine transducing units (TU ml−1). For single-round infections of CD4 T cells, viral supernatants were added at the indicated MOI. Infection was determined as the percentage of GFP+ cells by flow cytometry. CD4 T cells infected with HIV-CD8 virions were purified by positive selection using CD8-coated magnetic beads (Miltenyi) according to the manufacturer’s instructions.
PCR analyses for reverse transcripts.
For experiments wherein RT was evaluated, viral stocks were treated with DNaseI (Roche) for 1 h at room temperature prior to infection. Total DNA was then extracted from cells at 6 h and 24 h postinfection using the QiaAmp DNA blood mini kit (Qiagen) and quantitative PCR for R-U5, LTR-Gag and 2-LTR circles was performed using the primers listed in Supplementary Table 2. Quantitative PCR (qPCR) was performed using the Quantitect SYBR green PCR Master mix (Roche) with 10 ng of DNA and 0.5 μM primers in a final volume of 10 μl. Amplification of DNAs was performed using the LightCycler 480 (Roche). Each sample was amplified in triplicate. Relative expression was calculated by normalization to β2m.
Virus fusions assays.
CD4 T cells activated in the indicated conditions were exposed to virions for 2 h at 37 °C and then directly lysed. Extracts were resolved on SDS–PAGE gels (10%), transferred electrophoretically to PVDF membranes, immunoblotted with anti-p24 (NIH3537) and anti-ZAP-70 (2F3.2) and revealed with a horseradish peroxidase-conjugated α-mouse secondary antibody using enhanced chemiluminescence. p24 levels were quantified using ImageJ software and normalized to ZAP-70.
To assess fusion by CCF2 cleavage, CD4 lymphocytes were exposed to control virions or virions incorporating the BlaM-Vpr chimeric protein for 2 h at 37 °C and, as a negative control, cells were incubated with ammonium chloride (50 mM). Cells were then loaded with CCF2-AM dye for 1 h at room temperature (GeneBLAzer detection kit, ThermoFisher), washed twice in PBS and fixed in 1.25% formaldehyde. The change in emission fluorescence of CCF2 after cleavage by BlaM-Vpr was monitored by flow cytometry on an LSR-I Fortessa.
Glucose and glutamine uptake assays.
Cells (1 × 10⁶) were starved by incubation at 37 °C in serum/glucose-free or glutamine-free RPMI for 30 min. Radiolabelled 2-deoxy-d-[1-3H]glucose or glutamine-l-[3,4-3H(N)] (PerkinElmer) was added to a final concentration of 0.1 mM (2 μCi ml−1). Cells were incubated for 10 min at room temperature, washed in cold serum/glucose/glutamine-free RPMI, and solubilized in 500 μl 0.1% SDS. Radioactivity was measured by liquid scintillation.
Liquid chromatography–MS (LC–MS) and NADH/NAD+ analyses.
For profiling of intracellular metabolites, cells (1 × 10⁶) were incubated in RPMI medium without glucose or glutamine and supplemented with uniformly labelled [U-13C6] glucose or [U-13C5-15N2]glutamine, respectively, for 24 h (ref.77). Cells were rapidly washed in ice-cold PBS and metabolites were extracted in a 50% methanol/30% acetonitrile/20% water solution. The volume of extraction solution was adjusted to 2 × 10⁶ cells ml–1 for all samples and was normalized to the number of cells obtained at the end of the 24-h incubation period. All cultures were performed in triplicate. Both cell extracts and media were centrifuged at 16,000g for 10 min at 4 °C and supernatants were analysed by high performance LC–MS. Samples were separated on a Thermo Scientific Accela liquid chromatography system coupled with a guard column (Hichrom) and a ZIC-pHILIC column (Merck). The separation was performed using a gradient elution in a solution of 20 mM ammonium carbonate, with 0.1% ammonium hydroxide and acetonitrile. Metabolites were detected using a Thermo Scientific Exactive Orbitrap mass spectrometer with electrospray ionization, operating in a polarity-switching mode. The raw data were analysed with Xcalibur v.2.2 and LCquan v.2.7 Thermo Scientific software. NADH/NAD+ ratios were monitored as a function of the peak areas obtained for the light isotopologues (M+0) in the MS analyses, as well as by the Glo Assay kit from Promega, as per the manufacturer’s instructions.
Flux analyses.
OCR and ECAR were measured using the XFe96 Extracellular Flux Analyzer (Seahorse Biosciences, Agilent). Cells (2 × 10⁵) were resuspended in XF media (non-buffered DMEM) in the presence or absence of glucose (10 mM) and l-glutamine (2 mM), added to poly-d-lysine-coated wells (0.1 mg ml−1, Millipore) and monitored in basal conditions and in response to oligomycin (1 μM), carbonyl cyanide-p-trifluoromethoxyphenylhydrazone (FCCP) (1 μM), rotenone (100 nM) and antimycin A (1 μM; Sigma). Metabolites were added as indicated.
Statistical analyses.
Data were analysed using GraphPad software v.8 (GraphPad Prism) and P values were calculated using a one-way analysis of variance (ANOVA) (Tukey’s post hoc test) or paired Student’s t-tests as indicated. P values for comparisons of all conditions in the different figure panels are presented in Supplementary Table 3. Data reproducibility information is provided in the Reporting Summary.
Reporting Summary.
Further information on research design is available in the Nature Research Reporting Summary linked to this article.
Supplementary Material
Acknowledgements
We thank all members of our laboratories for discussions and scientific critique and are indebted to S. Kinet and V. Zimmermann for their continual support in this project. We are indebted to E. Gottlieb for his important input into metabolic experiments and to J. Mamede for his expertise and input into viral fusion assays. C. Goujon and C. June generously provided reagents, as indicated. We are grateful to M. Boyer and S. Gailhac of Montpellier Rio Imaging for support in cytometry experiments. I.C. and D.A.M. were supported by fellowships from Sidaction. Z.V. was supported by a fellowship from the Fondation de la Recherche Medicale (FRM). S.T. is supported by funding from Cancer Research UK (C596/A17196, Award 23982). L.O. was supported by a fellowship from the Ligue Contre le Cancer and the ARC Foundation. M.S. and N.T. are supported by Inserm and V.D. and C.M by the CNRS. This work was supported by generous funding from Sidaction, the ANRS, ARC, FRM, the French national (ANR) research grants (PolarATTACK and GlutStem) and the French laboratory consortiums (Labex) EpiGenMed and GR-EX.
Footnotes
Data availability
The data that support the findings of this study are available from the corresponding authors upon request.
Competing interests
M.S. and N.T. are inventors on patent WO2010079208. M.S., C.M. and N.T. are inventors on patent WO/2004/096841 and M.S. is an inventor on patent WO/2012/035369. All patents are owned by the CNRS and cover the use of RBD ligands for metabolite transporter detection. N.T. no longer owns any patent rights. M.S. is a co-founder of METAFORA Biosystems.
Supplementary information is available for this paper at https://doi.org/10.1038/s42255-019-0084-1.
Publisher’s note: Springer Nature remains neutral with regard to jurisdictional claims in published maps and institutional affiliations.
References
- 1.Zack JA, Kim SG & Vatakis DN HIV restriction in quiescent CD4+ T cells. Retrovirology 10, 37 (2013). [DOI] [PMC free article] [PubMed] [Google Scholar]
- 2.Rathmell JC, Elstrom RL, Cinalli RM & Thompson CB Activated Akt promotes increased resting T cell size, CD28-independent T cell growth, and development of autoimmunity and lymphoma. Eur. J. Immunol 33, 2223–2232 (2003). [DOI] [PubMed] [Google Scholar]
- 3.Frauwirth KA et al. The CD28 signaling pathway regulates glucose metabolism. Immunity 16, 769–777 (2002). [DOI] [PubMed] [Google Scholar]
- 4.Manel N et al. The HTLV receptor is an early T-cell activation marker whose expression requires de novo protein synthesis. Blood 101, 1913–1918 (2003). [DOI] [PubMed] [Google Scholar]
- 5.Curi R et al. Glutamine, gene expression, and cell function. Front. Biosci 12, 344–357 (2007). [DOI] [PubMed] [Google Scholar]
- 6.Fuchs BC, Finger RE, Onan MC & Bode BP ASCT2 silencing regulates mammalian target-of-rapamycin growth and survival signaling in human hepatoma cells. Am. J. Physiol. Cell Physiol 293, C55–C63 (2007). [DOI] [PubMed] [Google Scholar]
- 7.Sundrud MS et al. Halofuginone inhibits TH17 cell differentiation by activating the amino acid starvation response. Science 324, 1334–1338 (2009). [DOI] [PMC free article] [PubMed] [Google Scholar]
- 8.Nicklin P et al. Bidirectional transport of amino acids regulates mTOR and autophagy. Cell 136, 521–534 (2009). [DOI] [PMC free article] [PubMed] [Google Scholar]
- 9.Findlay JS & Ulaeto D Semliki Forest virus and Sindbis virus, but not vaccinia virus, require glycolysis for optimal replication. J. Gen. Virol 96, 2693–2696 (2015). [DOI] [PubMed] [Google Scholar]
- 10.Fontaine KA, Sanchez EL, Camarda R & Lagunoff M Dengue virus induces and requires glycolysis for optimal replication. J. Virol 89, 2358–2366 (2015). [DOI] [PMC free article] [PubMed] [Google Scholar]
- 11.Fontaine KA, Camarda R & Lagunoff M Vaccinia virus requires glutamine but not glucose for efficient replication. J. Virol 88, 4366–4374 (2014). [DOI] [PMC free article] [PubMed] [Google Scholar]
- 12.Li CY, Wang YJ, Huang SW, Cheng CS & Wang HC Replication of the shrimp virus wssv depends on glutamate-driven anaplerosis. PLoS ONE 11, e0146902 (2016). [DOI] [PMC free article] [PubMed] [Google Scholar]
- 13.Thai M et al. MYC-induced reprogramming of glutamine catabolism supports optimal virus replication. Nat. Commun 6, 8873 (2015). [DOI] [PMC free article] [PubMed] [Google Scholar]
- 14.Yu Y, Clippinger AJ & Alwine JC Viral effects on metabolism: changes in glucose and glutamine utilization during human cytomegalovirus infection. Trends Microbiol. 19, 360–367 (2011). [DOI] [PMC free article] [PubMed] [Google Scholar]
- 15.Chambers JW, Maguire TG & Alwine JC Glutamine metabolism is essential for human cytomegalovirus infection. J. Virol 84, 1867–1873 (2010). [DOI] [PMC free article] [PubMed] [Google Scholar]
- 16.Loisel-Meyer S et al. Glut1-mediated glucose transport regulates HIV infection. Proc. Natl Acad. Sci. USA 109, 2549–2554 (2012). [DOI] [PMC free article] [PubMed] [Google Scholar]
- 17.Palmer CS et al. Increased glucose metabolic activity is associated with CD4+ T-cell activation and depletion during chronic HIV infection. AIDS 28, 297–309 (2014). [DOI] [PMC free article] [PubMed] [Google Scholar]
- 18.Kavanagh Williamson M et al. Upregulation of glucose uptake and hexokinase activity of primary human CD4+ T cells in response to infection with HIV-1. Viruses 10, 114 (2018). [DOI] [PMC free article] [PubMed] [Google Scholar]
- 19.Hegedus A, Kavanagh Williamson M & Huthoff H HIV-1 pathogenicity and virion production are dependent on the metabolic phenotype of activated CD4+ T cells. Retrovirology 11, 98 (2014). [DOI] [PMC free article] [PubMed] [Google Scholar]
- 20.Palmer CS et al. Metabolically active CD4+ T cells expressing Glut1 and OX40 preferentially harbor HIV during in vitro infection. FEBS Lett. 591, 3319–3332 (2017). [DOI] [PMC free article] [PubMed] [Google Scholar]
- 21.Hegedus A et al. Evidence for altered glutamine metabolism in human immunodeficiency virus type 1 infected primary human CD4+ T cells. AIDS Res. Hum. Retroviruses 33, 1236–1247 (2017). [DOI] [PMC free article] [PubMed] [Google Scholar]
- 22.Macintyre AN et al. The glucose transporter Glut1 is selectively essential for CD4 T cell activation and effector function. Cell Metab. 20, 61–72 (2014). [DOI] [PMC free article] [PubMed] [Google Scholar]
- 23.Xiao Nakaya M et al. Inflammatory T cell responses rely on amino acid transporter ASCT2 facilitation of glutamine uptake and mTORC1 kinase activation. Immunity 40, 692–705 (2014). [DOI] [PMC free article] [PubMed] [Google Scholar]
- 24.Sinclair LV et al. Control of amino-acid transport by antigen receptors coordinates the metabolic reprogramming essential for T cell differentiation. Nat. Immunol 14, 500–508 (2013). [DOI] [PMC free article] [PubMed] [Google Scholar]
- 25.Hukelmann JL et al. The cytotoxic T cell proteome and its shaping by the kinase mTOR. Nat. Immunol 17, 104–112 (2016). [DOI] [PMC free article] [PubMed] [Google Scholar]
- 26.Cretenet G et al. Cell surface Glut1 levels distinguish human CD4 and CD8 T lymphocyte subsets with distinct effector functions. Sci. Rep 6, 24129 (2016). [DOI] [PMC free article] [PubMed] [Google Scholar]
- 27.Buck MD, Sowell RT, Kaech SM & Pearce EL Metabolic instruction of immunity. Cell 169, 570–586 (2017). [DOI] [PMC free article] [PubMed] [Google Scholar]
- 28.Loftus RM & Finlay DK Immunometabolism: cellular metabolism turns immune regulator. J. Biol. Chem 291, 1–10 (2016). [DOI] [PMC free article] [PubMed] [Google Scholar]
- 29.Chang CH et al. Posttranscriptional control of T cell effector function by aerobic glycolysis. Cell 153, 1239–1251 (2013). [DOI] [PMC free article] [PubMed] [Google Scholar]
- 30.Lane AN & Fan TW Regulation of mammalian nucleotide metabolism and biosynthesis. Nucleic Acids Res. 43, 2466–2485 (2015). [DOI] [PMC free article] [PubMed] [Google Scholar]
- 31.Korin YD & Zack JA Nonproductive human immunodeficiency virus type 1 infection in nucleoside-treated G0 lymphocytes. J. Virol 73, 6526–6532 (1999). [DOI] [PMC free article] [PubMed] [Google Scholar]
- 32.Baldauf HM et al. SAMHD1 restricts HIV-1 infection in resting CD4+ T cells. Nat. Med 18, 1682–1687 (2012). [DOI] [PMC free article] [PubMed] [Google Scholar]
- 33.Lahouassa H et al. SAMHD1 restricts the replication of human immunodeficiency virus type 1 by depleting the intracellular pool of deoxynucleoside triphosphates. Nat. Immunol 13, 223–228 (2012). [DOI] [PMC free article] [PubMed] [Google Scholar]
- 34.Craveiro M, Clerc I, Sitbon M & Taylor N Metabolic pathways as regulators of HIV infection. Curr. Opin. HIV AIDS 8, 182–189 (2013). [DOI] [PubMed] [Google Scholar]
- 35.Carr EL et al. Glutamine uptake and metabolism are coordinately regulated by ERK/MAPK during T lymphocyte activation. J. Immunol 185, 1037–1044 (2010). [DOI] [PMC free article] [PubMed] [Google Scholar]
- 36.Wang R et al. The transcription factor Myc controls metabolic reprogramming upon T lymphocyte activation. Immunity 35, 871–882 (2011). [DOI] [PMC free article] [PubMed] [Google Scholar]
- 37.Klysz D et al. Glutamine-dependent alpha-ketoglutarate production regulates the balance between T helper 1 cell and regulatory T cell generation. Sci. Signal 8, ra97 (2015). [DOI] [PubMed] [Google Scholar]
- 38.Laplante M & Sabatini DM An emerging role of mTOR in lipid biosynthesis. Curr. Biol 19, R1046–R1052 (2009). [DOI] [PMC free article] [PubMed] [Google Scholar]
- 39.Laplante M & Sabatini DM mTOR signaling at a glance. J. Cell. Sci 122, 3589–3594 (2009). [DOI] [PMC free article] [PubMed] [Google Scholar]
- 40.Sengupta S, Peterson TR & Sabatini DM Regulation of the mTOR complex 1 pathway by nutrients, growth factors, and stress. Mol. Cell 40, 310–322 (2010). [DOI] [PMC free article] [PubMed] [Google Scholar]
- 41.Nakaya M et al. Inflammatory T cell responses rely on amino acid transporter ASCT2 facilitation of glutamine uptake and mTORC1 kinase activation. Immunity 40, 692–705 (2014). [DOI] [PMC free article] [PubMed] [Google Scholar]
- 42.Billiard J et al. Quinoline 3-sulfonamides inhibit lactate dehydrogenase A and reverse aerobic glycolysis in cancer cells. Cancer Metab. 1, 19 (2013). [DOI] [PMC free article] [PubMed] [Google Scholar]
- 43.Duran RV et al. Glutaminolysis activates Rag-mTORC1 signaling. Mol. Cell 47, 349–358 (2012). [DOI] [PubMed] [Google Scholar]
- 44.Cavrois M, De Noronha C & Greene WC A sensitive and specific enzyme-based assay detecting HIV-1 virion fusion in primary T lymphocytes. Nat. Biotechnol 20, 1151–1154 (2002). [DOI] [PubMed] [Google Scholar]
- 45.Mamede JI & Hope TJ Detection and tracking of dual-labeled HIV particles using wide-field live cell imaging to follow viral core integrity. Methods Mol. Biol 1354, 49–59 (2016). [DOI] [PMC free article] [PubMed] [Google Scholar]
- 46.Fendt SM et al. Reductive glutamine metabolism is a function of the alpha-ketoglutarate to citrate ratio in cells. Nat. Commun 4, 2236 (2013). [DOI] [PMC free article] [PubMed] [Google Scholar]
- 47.Mullen AR et al. Oxidation of alpha-ketoglutarate is required for reductive carboxylation in cancer cells with mitochondrial defects. Cell Rep. 7, 1679–1690 (2014). [DOI] [PMC free article] [PubMed] [Google Scholar]
- 48.Almeida L, Lochner M, Berod L & Sparwasser T Metabolic pathways in T cell activation and lineage differentiation. Semin. Immunol 28, 514–524 (2016). [DOI] [PubMed] [Google Scholar]
- 49.Yong CS et al. Metabolic orchestration of T lineage differentiation and function. FEBS Lett. 591, 3104–3118 (2017). [DOI] [PubMed] [Google Scholar]
- 50.Valle-Casuso JC et al. Cellular metabolism is a major determinant of HIV-1 reservoir seeding in CD4+ T cells and offers an opportunity to tackle infection. Cell Metab. 29, 611–626 e615 (2019). [DOI] [PubMed] [Google Scholar]
- 51.Devadas S, Zaritskaya L, Rhee SG, Oberley L & Williams MS Discrete generation of superoxide and hydrogen peroxide by T cell receptor stimulation: selective regulation of mitogen-activated protein kinase activation and fas ligand expression. J. Exp. Med 195, 59–70 (2002). [DOI] [PMC free article] [PubMed] [Google Scholar]
- 52.Kwon J et al. The nonphagocytic NADPH oxidase Duox1 mediates a positive feedback loop during T cell receptor signaling. Sci. Signal 3, ra59 (2010). [DOI] [PMC free article] [PubMed] [Google Scholar]
- 53.Ron-Harel N et al. Mitochondrial biogenesis and proteome remodeling promote one-carbon metabolism for T cell activation. Cell Metab. 24, 104–117 (2016). [DOI] [PMC free article] [PubMed] [Google Scholar]
- 54.Sena LA et al. Mitochondria are required for antigen-specific T cell activation through reactive oxygen species signaling. Immunity 38, 225–236 (2013). [DOI] [PMC free article] [PubMed] [Google Scholar]
- 55.van der Windt GJ et al. CD8 memory T cells have a bioenergetic advantage that underlies their rapid recall ability. Proc. Natl Acad. Sci. USA 110, 14336–14341 (2013). [DOI] [PMC free article] [PubMed] [Google Scholar]
- 56.Karniely S et al. Human cytomegalovirus infection upregulates the mitochondrial transcription and translation machineries. MBio 7, e00029 (2016). [DOI] [PMC free article] [PubMed] [Google Scholar]
- 57.Bukrinskaya A, Brichacek B, Mann A & Stevenson M Establishment of a functional human immunodeficiency virus type 1 (HIV-1) reverse transcription complex involves the cytoskeleton. J. Exp. Med 188, 2113–2125 (1998). [DOI] [PMC free article] [PubMed] [Google Scholar]
- 58.Mandal D & Prasad VR Analysis of 2-LTR circle junctions of viral DNA in infected cells. Methods Mol. Biol 485, 73–85 (2009). [DOI] [PMC free article] [PubMed] [Google Scholar]
- 59.Laguette N et al. SAMHD1 is the dendritic- and myeloid-cell-specific HIV-1 restriction factor counteracted by Vpx. Nature 474, 654–657 (2011). [DOI] [PMC free article] [PubMed] [Google Scholar]
- 60.Hrecka K et al. Vpx relieves inhibition of HIV-1 infection of macrophages mediated by the SAMHD1 protein. Nature 474, 658–661 (2011). [DOI] [PMC free article] [PubMed] [Google Scholar]
- 61.Descours B et al. SAMHD1 restricts HIV-1 reverse transcription in quiescent CD4+ T-cells. Retrovirology 9, 87 (2012). [DOI] [PMC free article] [PubMed] [Google Scholar]
- 62.Matheson NJ et al. Cell surface proteomic map of HIV infection reveals antagonism of amino acid metabolism by Vpu and Nef. Cell Host Microbe 18, 409–423 (2015). [DOI] [PMC free article] [PubMed] [Google Scholar]
- 63.Matheson N et al. Antagonism of aminoacid transport in primary CD4 T cells by HIV-1 Vpu. Lancet 385, S66 (2015). [DOI] [PubMed] [Google Scholar]
- 64.Michalek RD et al. Cutting edge: distinct glycolytic and lipid oxidative metabolic programs are essential for effector and regulatory CD4+ T cell subsets. J. Immunol 186, 3299–3303 (2011). [DOI] [PMC free article] [PubMed] [Google Scholar]
- 65.Shi LZ et al. HIF1α-dependent glycolytic pathway orchestrates a metabolic checkpoint for the differentiation of TH17 and Treg cells. J. Exp. Med 208, 1367–1376 (2011). [DOI] [PMC free article] [PubMed] [Google Scholar]
- 66.Berod L et al. De novo fatty acid synthesis controls the fate between regulatory T and T helper 17 cells. Nat. Med 20, 1327–1333 (2014). [DOI] [PubMed] [Google Scholar]
- 67.Gerriets VA et al. Metabolic programming and PDHK1 control CD4+ T cell subsets and inflammation. J. Clin. Invest 125, 194–207 (2015). [DOI] [PMC free article] [PubMed] [Google Scholar]
- 68.Franchi L et al. Inhibiting oxidative phosphorylation in vivo restrains Th17 effector responses and ameliorates murine colitis. J. Immunol 198, 2735–2746 (2017). [DOI] [PMC free article] [PubMed] [Google Scholar]
- 69.Downs-Canner S et al. Suppressive IL-17A+Foxp3+ and ex-Th17 IL-17AnegFoxp3+ Treg cells are a source of tumour-associated Treg cells. Nat. Commun 8, 14649 (2017). [DOI] [PMC free article] [PubMed] [Google Scholar]
- 70.Monteiro P et al. Memory CCR6+CD4+ T cells are preferential targets for productive HIV type 1 infection regardless of their expression of integrin β7. J. Immunol 186, 4618–4630 (2011). [DOI] [PubMed] [Google Scholar]
- 71.Gosselin A et al. Peripheral blood CCR4+CCR6+ and CXCR3+CCR6+CD4+ T cells are highly permissive to HIV-1 infection. J. Immunol 184, 1604–1616 (2010). [DOI] [PMC free article] [PubMed] [Google Scholar]
- 72.Manel N et al. The ubiquitous glucose transporter GLUT-1 Is a receptor for HTLV. Cell 115, 449–459 (2003). [DOI] [PubMed] [Google Scholar]
- 73.Kim FJ et al. HTLV-1 and −2 envelope SU subdomains and critical determinants in receptor binding. Retrovirology 1, 41 (2004). [DOI] [PMC free article] [PubMed] [Google Scholar]
- 74.Swainson L et al. Glucose transporter 1 expression identifies a population of cycling CD4+ CD8+ human thymocytes with high CXCR4-induced chemotaxis. Proc. Natl Acad. Sci. USA 102, 12867–12872 (2005). [DOI] [PMC free article] [PubMed] [Google Scholar]
- 75.Kinet S et al. Isolated receptor binding domains of HTLV-1 and HTLV-2 envelopes bind Glut-1 on activated CD4+ and CD8+ T cells. Retrovirology 4, 31 (2007). [DOI] [PMC free article] [PubMed] [Google Scholar]
- 76.Verhoeyen E et al. IL-7 surface-engineered lentiviral vectors promote survival and efficient gene transfer in resting primary T lymphocytes. Blood 101, 2167–2174 (2003). [DOI] [PubMed] [Google Scholar]
- 77.Oburoglu L et al. Glucose and glutamine metabolism regulate human hematopoietic stem cell lineage specification. Cell Stem Cell 15, 169–184 (2014). [DOI] [PubMed] [Google Scholar]
Associated Data
This section collects any data citations, data availability statements, or supplementary materials included in this article.