

Abstract
BACKGROUND/OBJECTIVES:
Recent advances have extended anthropometry beyond flexible tape measurements to automated three-dimensional optical devices that rapidly acquire hundreds of body surface dimensions. Three new devices were recently introduced that share in common inexpensive optical cameras. The design, and thus potential clinical applicability, of these systems differ substantially leading us to critically evaluate their accuracy and precision.
SUBJECTS/METHODS:
113 adult subjects completed evaluations by the three optical devices (KX-16 (16 stationary cameras), Proscanner (1 vertically oscillating camera), and Styku scanner (1 stationary camera)), air displacement plethysmography (ADP), dual-energy X-ray absorptiometry (DXA) and a flexible tape measure. Optical measurements were compared to reference method estimates that included results acquired by flexible tape, DXA and ADP.
RESULTS:
Optical devices provided respective circumference and regional volume estimates that overall were well-correlated with those obtained from flexible tape measurements (for example, hip circumference: R2, 0.91, 0.90, 0.96 for the KX-16, Proscanner, and Styku scanner, respectively) and DXA (for example, trunk volume: R2, 0.97, 0.97, and 0.98). Total body volumes measured by the optical devices were highly correlated with those from the ADP system (all R2s, 0.99). Coefficient of variations obtained from duplicate measurements (n, 55) were larger in optical than in reference measurements and significant (P<0.05) bias was present for some optical measurements relative to reference method estimates.
CONCLUSIONS:
Overall, the evaluated optical imaging systems differing in design provided body surface measurements that compared favorably with corresponding reference methods. However, our evaluations uncovered system measurement limitations, such as discrepancies in landmarking, that with correction have the potential to improve future developed devices.
INTRODUCTION
Anthropometry is an ancient method of quantifying human body size and shape.1–3 Simple tools such as measuring rods and flexible calibrated tapes, calipers, and weight scales are the traditional approaches whereby linear, circumferential and mass estimates can be acquired as part of nutritional assessment protocols.4–6 A relatively small number of somatic measurements are now usually made by observers who ideally are well-trained and who are periodically checked in quality control programs.7,8 Anthropometric methods, by not requiring ionizing radiation for subject evaluation, are among the safest nutritional assessment approaches and are widely used in pediatric9,10 and pregnancy11,12 evaluations.
Rapid technological developments over the past decade are now revolutionizing anthropometric approaches for assessing nutritional status. Imaging devices, ranging from two-dimensional cellular telephone applications13,14 to three-dimensional (3D) whole-body laser scanning systems15–17 can now quickly capture hundreds of body dimensions and with appropriate software can provide numerous estimates of body size, shape and composition. While early systems, particularly those designed around laser technology,16 were costly and primarily suitable for use in research settings, a new wave of relatively low-cost approaches is appearing that have potential as clinical tools. One group of these new methods is based largely on inexpensive optical depth cameras that were first introduced as components of gaming systems.13,16–18
These newer imaging approaches range in design from a potentially portable single stationary camera coupled to a 360° rotating subject platform to a fixed array of 16 cameras that surround the subject. With the emergence of several imaging methods, an important question arises: do these differing approaches provide accurate and precise anthropometric measurements comparable to those obtained by conventional laboratory-based reference methods? This is a relevant question when applying these newer anthropometric devices to evaluate patients in the clinical setting or subjects in research studies.
The aim of the current study was to critically evaluate three of these newer optical devices differing in image acquisition and data processing technology by comparing body size and shape results to those obtained by reference methods. Specifically, we compared device-acquired circumferential and regional/whole-body volume estimates to corresponding respective estimates acquired with a flexible tape measure, dual-energy X-ray absorptiometry (DXA) and air displacement plethysmography (ADP).
MATERIALS AND METHODS
Experimental design
This was a cross-sectional study of an adult convenience sample. The study was approved by the Pennington Biomedical Research Center Institutional Review Board and all subjects signed an informed consent prior to participation.
Following screening and upon enrollment, each subject completed a baseline questionnaire, including demographic information. They were then weighed and had their height measured while clothed in a hospital gown. Anthropometric evaluations were then completed, followed by DXA, ADP and 3D imaging.
The collected data were used to compare 3D imaging system circumference, regional body volume, and total body volume results between imaging devices and against reference methods. Specifically, body circumferential estimates were obtained from 3D imaging and conventional flexible tape measure anthropometry; regional body volumes were obtained from the 3D imaging devices and DXA; and total body volume estimates were made by the 3D devices and ADP. The reference estimates for circumferences, regional volumes, and total volumes were thus conventional flexible tape measure anthropometry, DXA and ADP, respectively. Corresponding measurements from the imaging devices were compared to those obtained by the reference methods.
Participants
Subjects were adult men and women volunteers at or over the age of 18 years. A pre-evaluation screening questionnaire was used to ensure subjects were in good health and free of chronic diseases. Subjects were recruited through advertisements on the center website. Once enrolled, subjects were asked to arrive at the laboratory wearing or to change into form-fitting clothing that included Spandex shorts and, for women, a Spandex top for all 3D scans and anthropometric measurements. The same attire applied for ADP with the addition of a Lyrica cap to cover loose hair. The DXA scan attire included only undergarments and an examination gown.
Measurements
Height was measured to the nearest 0.1 cm on each subject using a wall-mounted stadiometer (Seca 222, Seca GmbH & Co. KG, Hamburg, Germany) and screening weight was measured using a digital scale (MC-970; Tanita, Tokyo, Japan) to the nearest 0.1 kg. Each measurement was evaluated twice with a third reading obtained if the first two respective readings were 40.5 cm or 40.5 kg apart; results were averaged. Anthropometric circumference measurements were taken by a trained staff member at the anatomic locations used in the US National Health and Nutrition Examination Survey.19 Circumferences of the waist, hip, upper arms and thighs were measured with a flexible tape and recorded to the nearest 0.1 cm. Each measurement was taken three times and averaged. The specific methods used in measuring these circumferences are presented in Supplementary Material. Though flexible tape is considered the ‘reference method’ for body circumferences, these measurements are subject to between-user error. We addressed this by having the same staff member perform all circumference measurement.
3D optical scans
Image acquisition.
Three imaging systems were used to obtain circumferences, regional volumes, and total body volume. All three systems share in common the use of inexpensive, consumer-grade optical depth cameras. With this feature in common, each device uses unique mechanisms for capturing, assembling and measuring the 3D subject images (Figure 1; Supplementary Table 1).
Figure 1.

Configurations of the three optical imaging devices: KX-16 (left), Proscanner (center), Styku S100 scanner (right). The Proscanner and KX-16 project patterns of infrared light on the subject and use light deformations to determine depth. The Styku scanner uses phase shifts in reflected waves to determine depth. The Styku S100 scanner’s camera’s field of view is larger than that of the Proscanner and KX-16 (70.6 × 60 as opposed to 58.5 × 46.6).
The KX-16 system (TC2 Labs, Apex, NC, USA) has four columns, each of which has four evenly spaced Microsoft Kinect V1 cameras. The Kinect V1 sensor uses PrimeSense (Apple, Inc., Cupertino, CA, USA) technology. The columns are positioned in a rectangle and the subject stands with their hands held in a downward V-shaped position, or ‘A-pose’, centered between the columns during the 7-s scan. Each camera includes an infrared emitter that projects a known pattern of points onto the scene. The infrared pattern is distorted by the subject and imaged using an infrared sensor. The deformation of points is used to calculate depth.
The Proscanner (Fit3D, Redwood City, CA, USA) uses a PrimeSense Carmine 1.08 depth sensor that operates in the same way as the KX-16’s Kinect V1 sensors, although the configuration of the system is different. The Proscanner uses one camera that oscillates vertically on a tower while the subject rotates counterclockwise on a platform for about 40 s. A maximum weight of 500 pounds can be supported by the platform. The subject tightly grips handlebars during the scan while their arms are held firmly in the A-pose.
The Styku S100 scanner (Styku, Los Angeles, CA, USA) also uses a single camera built into a tower and a rotating platform to capture body image data. However, the Styku scanner uses a stationary depth camera at a fixed height. The scanner’s platform can support up to 550 pounds. The subject stands on the platform with their arms positioned in the A-pose. The subject is then rotated clockwise for about 30 s. The Styku S100 scanner uses a Microsoft Kinect V2 camera that employs ‘time-of-flight’ technology that is different from the other systems. Infrared light is projected and reflected back to the sensor. The phase shifts in the returning light waves are used to measure roundtrip light travel time that allows for a direct calculation of depth.
The three scanners examined in the current study do not require cost for maintenance but an optional service contract is useful if technical concerns arise. The KX-16 scanner is the only of the three that has a protocol for calibration; however, there are no specific instructions on the frequency of calibrations. The price for the scanners varies depending on desired options and range from $8000 to $20 000 USD for fully equipped devices. The cost includes the hardware and the computer with their proprietary software for image processing.
Image processing.
The three systems use various iterative closest point20 reconstruction algorithms to create a 3D image. Over 250 measurement estimates of lengths, circumferences and volumes are calculated from the scan. Each system uses its own proprietary software for landmark detection and measurement.
The Styku scanner displays a real-time depth video stream from the Kinect V2 sensor on a computer screen while the subject rotates on the platform. As the subject rotates, the camera captures new body views and uses Kinect Fusion software (Microsoft, Redmond, WA, USA) to fuse the depth data into a combined surface in real-time21 to produce a triangle mesh image. The system then uses Poisson surface reconstruction methods to smooth and fill any surface holes.22 Once the scan is complete, the Styku scanner’s software is designed to recognize features found on the mesh that are easily recognized body landmarks. From these features, a custom script defines how the landmarks are used to calculate and visualize various body measurements. The Styku scanner employs Graham’s convex-hull algorithm23 for refining circumference measurements.
The TC2 KX-16 and Fit3D Proscanner systems use image construction and measurement techniques similar to those used by the Styku scanner. However, the Proscanner system software does not fill in holes in the 3D mesh image while the KX-16 system fills in gaps at a few specific regions such as under the arm. Neither scanner uses the surface smoothing algorithms implemented by the Styku scanner.
Dual-energy X-Ray absorptiometry
Whole-body DXA scans were conducted using a Hologic Discovery A system with Hologic Apex software version 40.2 (Hologic, Inc., Marlborough, MA, USA). The completed scans were evaluated for total body mass, regional mass (head, trunk, arms and legs), and body composition (total and regional body fat, fat-free mass, lean soft tissue mass and bone mineral content). The regional mass cut-points were described earlier by Schuna et al.24 Regional volumes were estimated from their corresponding body composition estimates (0.9007, 2.982 and 1.0051 g/cc for fat mass, bone mineral content, and lean soft tissue respectively).25
Air displacement plethysmography
Total body volume was measured with the Bod Pod ADP system (Cosmed USA, Concord, CA, USA). This system uses changes in pressure to calculate volume through Poisson’s Law that assumes adiabatic conditions. The volume of thoracic gas as quantified by the ADP system was not subtracted from ADP total body volume estimates so as to be comparable to total volumes measured by the three imaging systems.
An estimate of total body volume was available from DXA in addition to the reference ADP method. DXA total body volume estimates were highly correlated with (Supplementary Figure 1; R2 = 0.99, P<0.0001) ADP estimates and there was no significant between-method bias.
Statistical methods
Four circumference measurements, five regional volumes, and total body volume estimates from the 3D devices were compared to the corresponding reference method measurements. At the outset we recognized that in some cases 3D system circumference and regional volume measurements may not exactly match the anatomic sites as defined by the reference methods. However, we did not know in advance to what extent these kinds of differences might be present and their magnitudes. To explore the level of agreement between 3D optical and reference method measurements we examined if between-method group mean differences were present, the magnitude of associations between the methods, and if between-method bias was present. Our sample size for these exploratory studies (⩾100) was based on two related earlier studies by our group.16,18
Specifically, the absolute circumference and volume estimates from the 3D optical devices were compared to their reference method counterparts using paired, two-sided t-tests with a difference of P<0.05 considered statistically significant. Measurements were assumed to be normally distributed. Associations between 3D optical and reference method measurements were examined using linear regression analysis with statistical significance set at P<0.05. Bland–Altman plots were used to determine if significant 3D optical measurement biases were present relative to the reference methods.
A subgroup of participants completed duplicate flexible tape, DXA and 3D scans and the respective coefficient of variations (CVs) expressed in % are presented in the results section. The ADP CV for total body volume estimation is 0.1%.26
Descriptive subject characteristics are presented as the mean ±s.d. Statistical analyses were conducted using Microsoft Excel 2010 (Microsoft Corp., Redmond, WA, USA) and GraphPad Prism 7 (GraphPad Software Inc., La Jolla, CA, USA).
RESULTS
Subjects
Subject characteristics are presented in Table 1. There were a total of 113 subjects (40 men, 73 women) ranging in age from 18 to 77 years and in BMI from 17.9 to 51.8 kg/m2.
Table 1.
Subject Characteristics
| Men | Women | |
|---|---|---|
| Number (White/Black/Asian) | 40 (30/7/3) | 73 (42/28/3) |
| Age (yrs) | 41 ± 17 | 47 ± 17 |
| Height (cm) | 177.7 ± 6.4 | 163.0 ± 6.7 |
| Weight (kg) | 84.8 ± 17.0 | 73.4 ± 17.0 |
| BMI (kg/cm2) | 26.7 ± 4.3 | 27.8 ± 7.0 |
| % Body fata | 22.3 ± 6.8 | 37.4 ± 7.8 |
Abreviation: BMI, body mass index.
Acquired by DXA. Results are X ± s.d.
Coefficient of variations
Fifty-five of the subjects completed duplicate flexible tape, DXA and 3D optical scans and the respective CVs are presented in Table 2. The flexible tape and DXA circumference and volume CVs ranged from <1 to 1.5%. On average the 3D optical system CVs were larger, in particular for the arm volume measurements (5.7, 3.9, 2.0 and 1.5% for KX-16, Proscanner, Styku scanner and DXA left arm, respectively).
Table 2.
Results of circumference, volume and coefficient of variation evaluations
| Measurement | Mean | Mean Δ | CV (%) | R2 | RMSE | Bland-Altman analysis | |
|---|---|---|---|---|---|---|---|
| R2 | Slope | ||||||
| Waist (cm) | |||||||
| Tape measure | 89.6 ± 14.2 | 0.2 ± 0.1 | |||||
| KX-16 | 90.2 ± 13.2 | 0.64 | 0.8 ± 0.8 | 0.86* | 5.3 | 0.04‡ | −0.08 |
| Proscanner | 93.8 ± 14.1 | 4.21* | 0.8 ± 1.2 | 0.92* | 5.8 | 0.0005 | −0.01 |
| Styku scanner | 84.5 ± 12.9 | −5.08* | 0.3 ± 0.4 | 0.94* | 6.3 | 0.12† | −0.10 |
| Hip (cm) | |||||||
| Tape measure | 105.0 ± 12.0 | 0.2 ± 0.3 | |||||
| KX-16 | 109.8 ± 12.1 | 4.8* | 0.4 ± 0.4 | 0.91* | 6.0 | 0.0006 | 0.01 |
| Proscanner | 106.3 ± 13.3 | 1.2† | 0.4 ± 1.2 | 0.90* | 4.6 | 0.11† | 0.12 |
| Styku scanner | 104.9 ± 12.1 | −0.02 | 0.1 ± 0.2 | 0.96* | 2.6 | 0.001 | 0.01 |
| Right arm (cm) | |||||||
| Tape measure | 33.2 ± 5.4 | 0.4 ± 0.2 | |||||
| KX-16 | 35.9 ± 4.9 | 2.8* | 2.6 ± 2.2 | 0.75* | 3.9 | 0.05‡ | −0.12 |
| Proscanner | 33.2 ± 5.1 | 0.04 | 1.2 ± 1.0 | 0.87* | 1.9 | 0.03 | −0.07 |
| Styku scanner | 29.1 ±4.3 | −4.1* | 0.8 ± 1.3 | 0.73* | 5.0 | 0.17* | −0.25 |
| Right thigh (cm) | |||||||
| Tape measure | 56.8±6.2 | 0.2 ± 0.1 | |||||
| KX-16 | 63.0 ± 8.5 | 6.2* | 0.9 ± 0.9 | 0.71* | 7.7 | 0.27* | 0.34 |
| Proscanner | 51.1 ± 5.5 | −5.7* | 0.7 ± 0.9 | 0.79* | 6.4 | 0.06‡ | −0.12 |
| Styku scanner | 57.3 ± 7.7 | −0.2 | 0.3 ± 0.5 | 0.83* | 3.3 | 0.24* | 0.23 |
| Body volume (l) | |||||||
| ADP | 76.4 ± 18.3 | ||||||
| DXA | 75.6 ± 18.1 | 0.2 ± 0.1 | |||||
| KX-16 | 73.0 ± 16.9 | −3.4* | 0.8 ± 0.6 | 0.99* | 4.2 | 0.31* | −0.08 |
| Proscanner | 74.0 ± 17.6 | −2.4* | 0.7 ± 0.6 | 0.99* | 2.9 | 0.18* | −0.04 |
| Styku scanner | 67.4 ± 15.6 | −9.1* | 0.4 ± 0.4 | 0.99* | 9.7 | 0.69* | −0.16 |
| Trunk (l) | |||||||
| DXA | 36.4 ± 9.9 | 0.6 ± 0.5 | |||||
| KX-16 | 46.8 ± 11.1 | 10.4* | 1.0 ± 0.8 | 0.97* | 10.7 | 0.31* | 0.12 |
| Proscanner | 49.7 ± 13.5 | 13.3* | 0.6 ± 0.9 | 0.97* | 14.0 | 0.78* | 0.31 |
| Styku scanner | 42.4 ± 11.0 | 6.0* | 0.3 ± 0.3 | 0.98* | 6.4 | 0.32* | 0.11 |
| Left arm (l) | |||||||
| DXA | 4.3 ± 1.3 | 1.5 ± 1.2 | |||||
| KX-16 | 3.6 ± 1.1 | −0.7* | 5.7 ± 4.4 | 0.82* | 0.9 | 0.25* | −0.25 |
| Proscanner | 3.7 ± 1.1 | −0.6* | 3.9 ± 7.0 | 0.83* | 0.8 | 0.23* | −0.23 |
| Styku scanner | 2.0 ± 0.6 | −2.2* | 2.0 ± 1.6 | 0.69* | 2.4 | 0.73* | −0.83 |
| Right arm (l) | |||||||
| DXA | 4.5 ± 1.3 | 1.2 ± 1.2 | |||||
| KX-16 | 3.7 ± 1.1 | −0.7* | 4.1 ± 3.0 | 0.87* | 0.9 | 0.17* | −0.17 |
| Proscanner | 3.4 ± 1.1 | −1.0* | 2.1 ± 4.8 | 0.89* | 1.1 | 0.21* | −0.17 |
| Styku scanner | 2.1 ± 0.6 | −2.3* | 2.4 ± 2.9 | 0.80* | 2.5 | 0.79* | −0.76 |
| Left leg (l) | |||||||
| DXA | 13.0 ± 3.1 | 1.0 ± 0.8 | |||||
| KX-16 | 9.3 ± 2.2 | −3.69* | 1.6 ± 1.7 | 0.90* | 3.9 | 0.54* | −0.34 |
| Proscanner | 8.7 ± 1.7 | −4.34* | 2.4 ± 3.1 | 0.70* | 4.8 | 0.61* | −0.64 |
| Styku scanner | 6.3 ± 1.6 | −6.73* | 0.8 ± 0.9 | 0.91* | 7.0 | 0.85* | −0.65 |
| Right leg (l) | |||||||
| DXA | 13.1 ± 3.0 | 1.1 ± 0.7 | |||||
| KX-16 | 9.6 ± 2.3 | −3.55* | 1.6 ± 1.8 | 0.90* | 3.7 | 0.46* | −0.29 |
| Proscanner | 8.5 ± 1.6 | −4.62* | 1.5 ± 3.3 | 0.74* | 5.0 | 0.62* | −0.65 |
| Styku scanner | 6.2 ± 1.6 | −6.89* | 1.4 ± 1.2 | 0.91* | 7.1 | 0.84* | −0.62 |
Abbreviations: CV, coefficient of variation; RMSE, root means squared error.
P < 0.0001;
P < 0.01;
P < 0.05. Results are X ± s.d. 113 total subject evaluations for circumferences and volumes, 55 for coefficient of variations.
Circumferences
Group averages for the circumferences are summarized in Table 2. The mean group difference between the Styku scanner and flexible tape estimates for the representative hip circumference (−0.02 cm) was not significant; significant mean hip circumference differences were, however, present for the KX-16 (4.8 cm, P<0.0001) and Proscanner (1.2 cm, P<0.01). Root mean square errors for the systems ranged from 2.6 for Styku scanner to 6.0 for the KX-16.
Circumference measurements by the 3D optical devices were all significantly correlated with flexible tape measurements (R2s, 0.71–0.96, all P<0.0001) (Table 2). The representative hip circumference measured by each system plotted against flexible tape measurements is shown in Figure 2 along with Bland–Altman plots. 3D and tape measurements were highly correlated (R2s, 0.90–0.96, all P<0.001). Significant hip circumference bias relative to the reference flexible tape measurements was present for the Proscanner 3D system (P<0.01).
Figure 2.
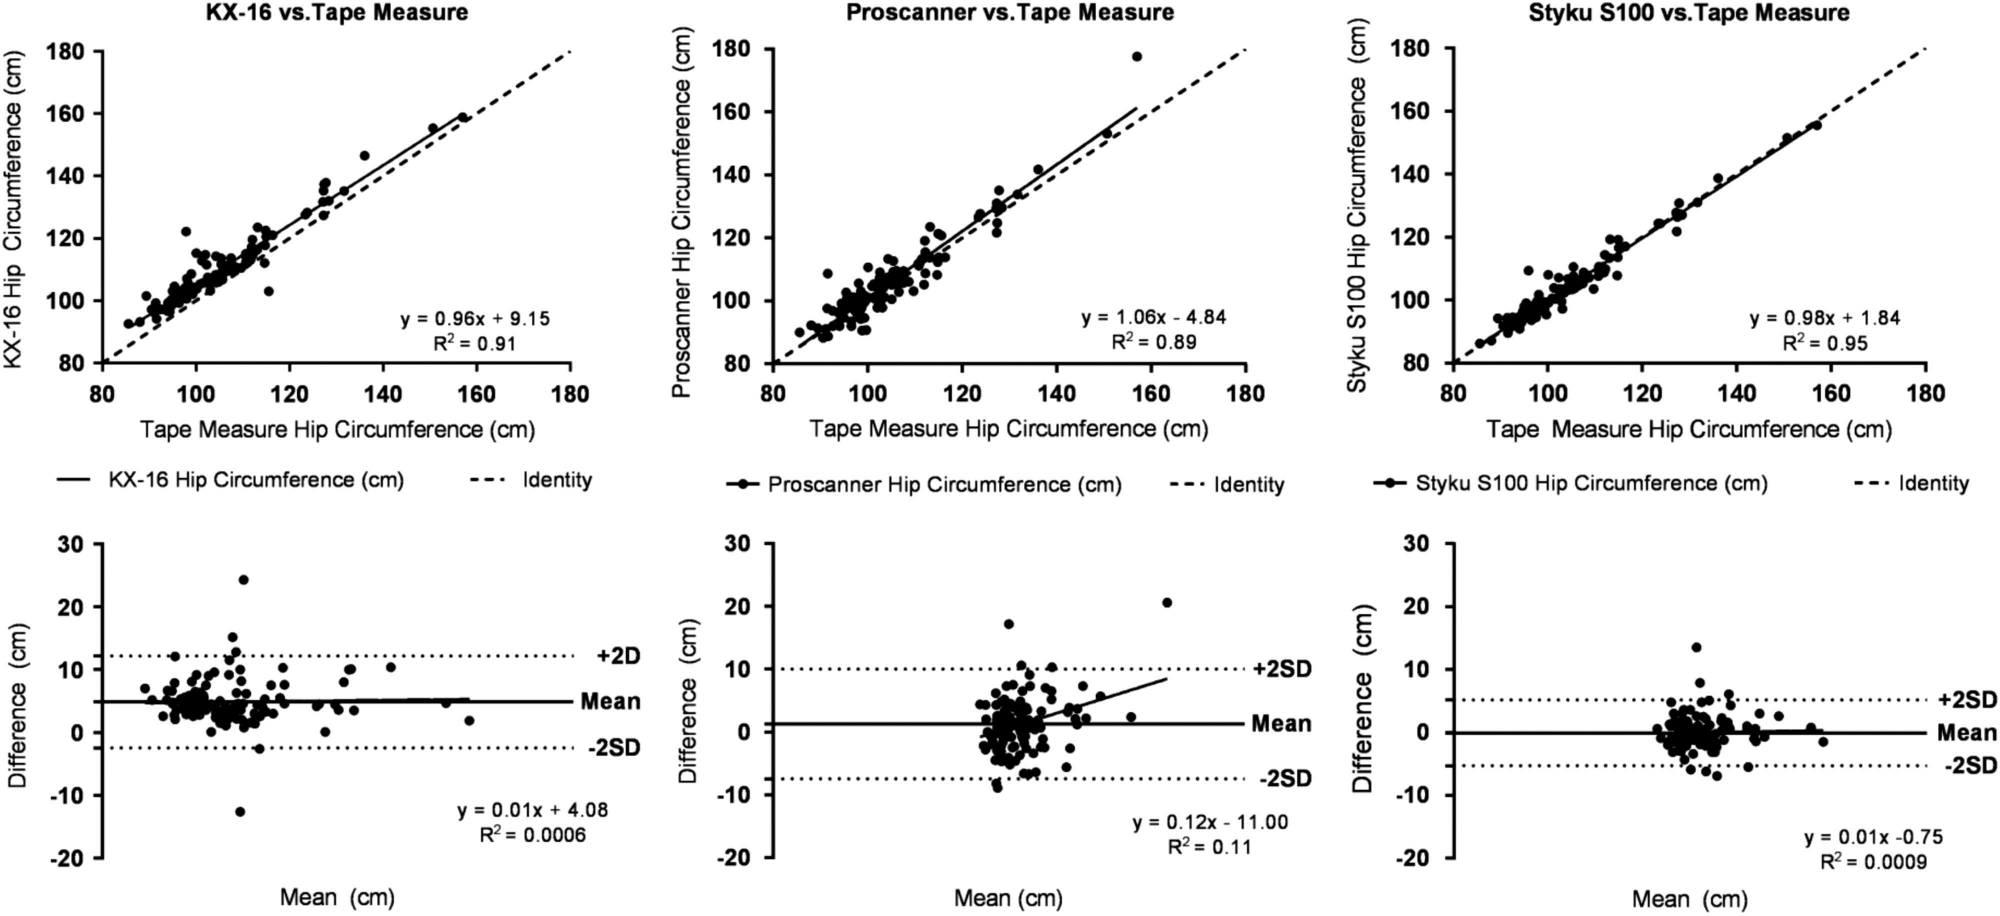
Hip circumference measured by the 3D optical devices versus hip circumference estimates by a flexible tape measure and associated Bland–Altman plots (Difference = (3D System Value) − (Flexible Tape Value)). The solid line in each upper panel is the regression line and the dashed line is the line of identity.
Regional body volumes
Regional body volume results are summarized in Table 2. Representative trunk volumes measured by the 3D systems were larger than DXA trunk volumes with mean differences of 10.4L, 13.3L and 6.0L for KX-16, Proscanner, and Styku scanner, respectively (all P<0.0001). Of these, the Styku scanner trunk volume estimates were the lowest of the three systems as they were for all of the regional volume measurements. Root mean square errors for the systems ranged from 6.4 for the Styku scanner to 14.0 for the Proscanner.
Regional volume measurements by the 3D optical devices were all significantly correlated with DXA regional volume measurements (R2s, 0.69–0.98, all P<0.0001; Table 2). Representative trunk volume estimates for the 3D systems are plotted against the DXA trunk volume estimates in Supplementary Figure 2. All of the 3D optical system estimates for trunk volume were highly correlated with DXA trunk volume estimates (R2s ⩾ 0.97, P<0.0001). Significant trunk volume bias relative to the reference DXA measurements was present for all three optical systems (P<0.0001).
Following discussions with the investigators, the Fit3D Proscanner was updated by the manufacturer to provide more significant figures for volume measurements after 80 subjects had completed the study. The results display all 113 subjects for all measurements; however, correlations for small regional volumes improved after the system update. Right arm volume for the Proscanner vs DXA is plotted from before the update and after the update in Supplementary Figure 3.
Total body volume
The mean total body volume estimates were significantly different from those by ADP for all three 3D optical systems (P<0.0001) (Table 2). Root mean square errors for the systems ranged from 2.9 for the Proscanner to 9.7 for the Styku scanner.
The results of linear regression and Bland–Altman analyses are displayed in Table 2 and Supplementary Figure 4 for each 3D optical system with ADP total volume as the reference. Total body volumes determined by KX-16, Proscanner, and Styku scanners were highly correlated with ADP volumes (R2s all 0.99). Bland–Altman plots all showed significant (P<0.05) bias with regression line slopes of − 3.4L, − 2.4L and − 9.1L for the KX-16, Proscanner, and Styku scanner, respectively. All of these slopes are negative indicating that that the 3D systems underestimated body volume for larger subjects. As for regional volumes, the Styku system had the lowest total body volume estimates for the three systems.
DISCUSSION
Three-dimensional optical imaging devices can provide hundreds of body surface measurements in less than one minute. The full clinical potential of these many somatic surface measurements has yet to be established. An initial step, the one taken in the current study, is to determine the accuracy and precision of these optical devices relative to their reference method counterparts. The aim of the current study was to evaluate three of these devices that share in common inexpensive optical depth cameras but that differed in how these cameras are configured and in data processing techniques.
Our findings overall indicate that all three of the evaluated systems provide reproducible circumference, regional volume and total body volume measurements that are well-correlated with the reference methods. Thus, even though the surface data acquisition hardware employed by the systems differed, strong associations were observed between the optical device measurements and those acquired with the reference methods. Critically evaluating what technical concerns we did observe is illuminating with respect to these newly introduced technologies.
Measurement discrepancies
The first concern relates to absolute differences observed between 3D optical and reference method landmarking. We were aware at the outset that optical-device measured anatomic sites might not perfectly match those acquired by the reference methods, although the magnitude of these discrepancies if present was unclear. At the current time there is no standardization guideline adhered to by device manufacturers that states strict landmark definitions. A main concern arising from this measurement inconsistency is that a subject’s results cannot be readily compared across systems or to standardized reference values. An important consideration is that conventional anthropometric methods often rely on palpation of boney landmarks for identifying measurement sites. By contrast, automated optical imaging techniques discover measurement sites through identification of surface landmarks. The possibility exists in future comparative studies to closer align measurement sites between systems by application of surface markers prior to optical data acquisition. A similar approach can be used to align 3D optical and DXA regional measurements.
Another source of absolute measurement differences is variation in the body regions included in whole-body volume estimates. We learned following completion of our analyses that the KX-16 and Proscanner total body volume estimates do not include head, hands, or feet volumes. By contrast, the Styku S100 scanner includes these body parts in the total body volume measurement. The CVs for 3D total body volume estimates were two or more times those by ADP and DXA (Table 2) and when considered in light of the absolute measurement concerns it is unlikely that optical devices at present can be used to accurately quantify body density and thus body fat using the two compartment molecular level body composition model.27
An absolute 3D-reference method difference may also have been caused by Styku S100 system’s ToF technology that assumes light reflected from each pixel takes one path. In reality, the geometry of the room or reflective surfaces in the room may cause light to take multiple paths that are unpredictable and can alter the depth measurements.28 The Styku scanner in our study underestimated the distance between the platform and the sensor causing the measurements to be systematically less than the reference values. While the recommended distance between the platform and sensor still produced favorable correlations with reference methods, adjustments could be made by changing the separation between the camera and platform and comparing values to standard methods to determine optimal distance in a specific space. The system’s ability to track changes would not be affected if the system remains in the same position, but could be if the system is moved.
Another source of measurement error may have resulted from subject characteristics. For example, subjects who have a high BMI, are very tall, or who have poor balance may be challenging to image. Thighs touching, as shown in the avatars created by the devices (Figure 3), may lead to errors when system landmarking software attempts to distinguish right from left legs and legs from trunk. For subjects with a large amount of adipose tissue in the arms and trunk, the upper extremities are difficult to distinguish from the trunk with the A-pose implemented by all three systems and an arm may get cut off on KX-16 system avatars (Figure 3). These effects may partially explain why subjects who had a BMI within the normal range had optical measurements closer to the reference method than those who were overweight or obese. Additionally, some subjects were too tall for the Styku scanner and KX-16 cameras to capture their full image. By contrast, the Proscanner’s tower with mounted moving camera allowed for greater total body imaging of tall subjects. Excluding a tall subject’s head from the analysis can lead to measurement bias as the head is a smaller proportion of body volume in people who tall compared with those who are short.24 The Styku scanner also requires subjects to stand still while rotating with no arm support. Movement during the scan can cause malformed avatars (Figure 3) that could affect measurement dimensions and CVs Our recommendation is to do a quality control check on all acquired 3D images before concluding the subject’s evaluation.
Figure 3.
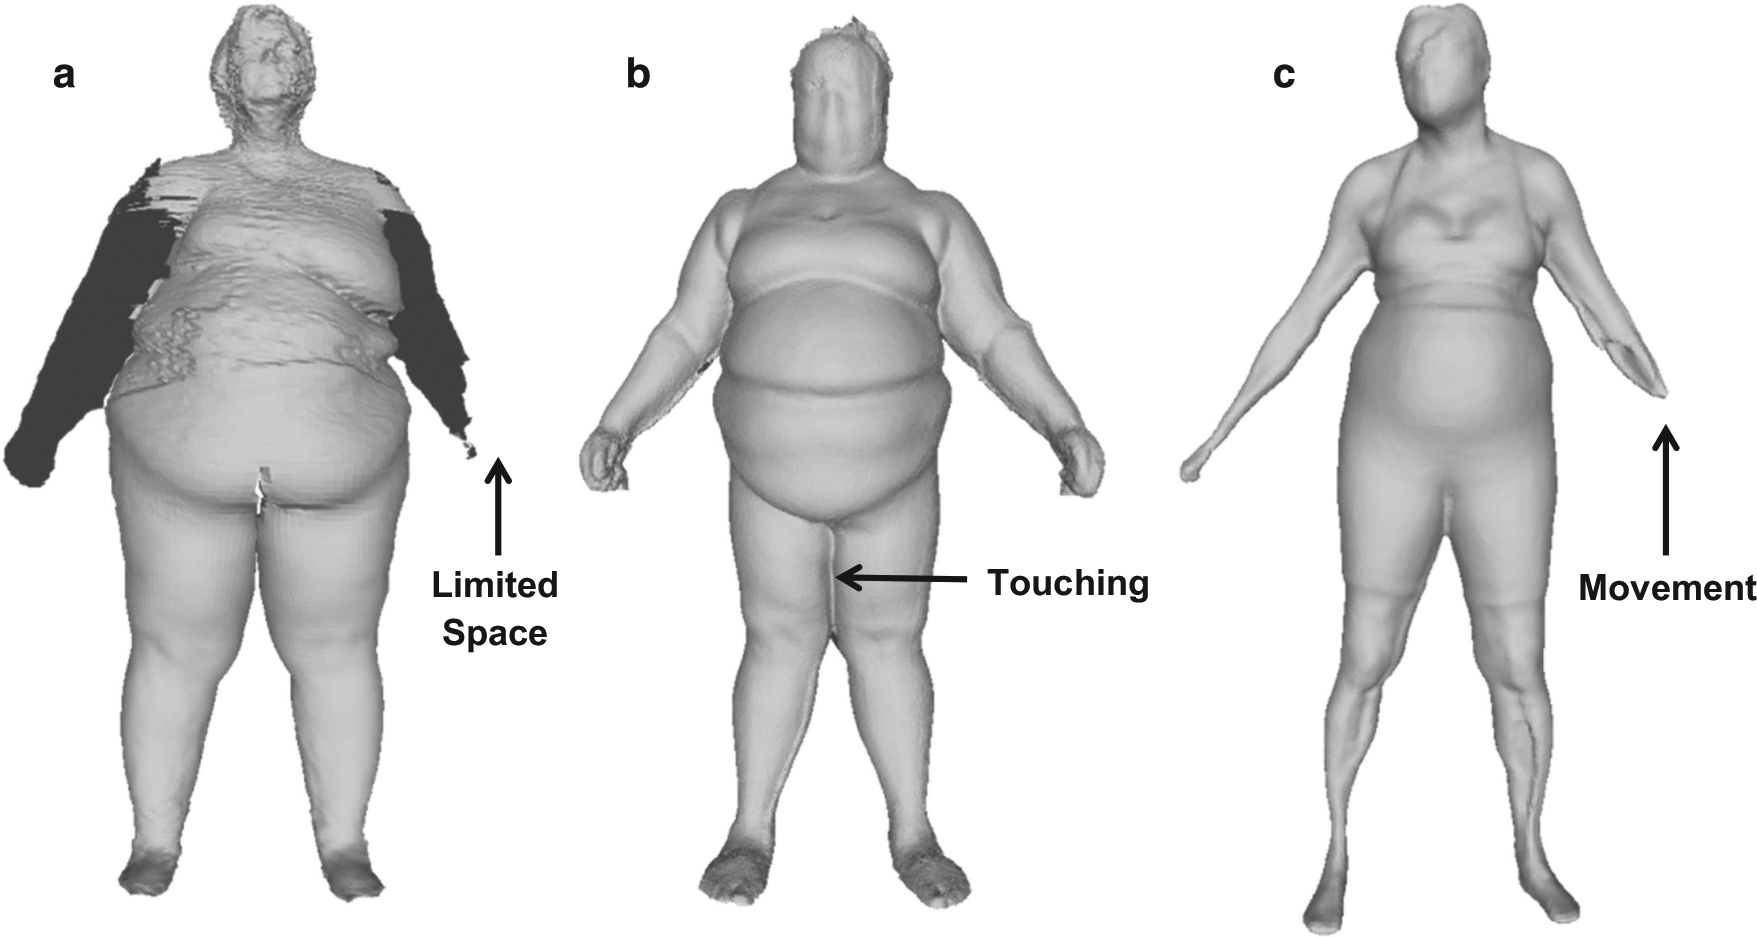
Avatars from the KX-16 (a), Proscanner (b) and the Styku S100 scanner (c). Images show system limitations such as arm cut off on the KX-16 (a), thighs touching on the Proscanner (b), and movement on the Styku S100 scanner (c). The resolution is 320 × 240, 640 × 480 and 512 × 424 for the KX-16, Proscanner and Styku scanner, respectively.
System data processing differences
While our focus was mainly on the automatically derived circumference and volume measurements from each system, it should be noted that the 3D mesh processing and image presentation varies between the systems. Reconstructed avatars display differences in resolution, filling and smoothing as shown in Figure 3. The Proscanner and KX-16 show minimal filling of missing data and smoothing whereas the Styku scanner’s image appears smooth with no gaps. These differences do not appear to give any clear advantage in measurement quality since the correlations and CVs were similar across the three systems.
A related data processing observation is that the Proscanner leg and arm volume estimates were not well-correlated with the DXA reference measurements at the start of the study. In reviewing these observations we learned that the Proscanner did not provide an adequate number of significant digits to allow for accurate measurement of small body segments. We informed the manufacturer of this limitation and Fit3D developers subsequently added digits to the results. Both the CVs and regional volume estimates improved accordingly (Supplementary Figure 3).
System attributes
Each system has distinct attributes such as cost, scan speed and hardware design, but the overall measurements compare similarly to reference methods. The Styku scanner’s simple design with a single fixed camera and modular design makes it easy to transport. The system also displays results immediately and allows the user to interactively measure circumferences at any point on the avatar. The Proscanner’s moving camera allows capture of a tall subject’s head dimensions while the other systems do not include head measurements in tall subjects. The KX-16 has the quickest scan time (7 s), although this device is large and with 16 cameras is not mobile and the system cost is higher than the other two devices.
CONCLUSIONS
The 3D optical systems evaluated in the current study that share in common inexpensive image acquisition cameras provide reproducible circumference and volume measurements that correlate well with reference methods that are often unavailable or too costly to apply in the clinical setting. Our findings exposed important differences and limitations of these systems that are largely correctible when building next generation devices. Future studies are needed to establish the utility of these emerging optical devices in clinical and research settings.
Supplementary Material
ACKNOWLEDGEMENTS
The authors acknowledge the input provided by optical device manufacturers on the operational details of their respective systems. This work was partially supported by two National Institutes of Health NORC Center Grants P30DK072476, Pennington/Louisiana; and P30DK040561, Harvard; and R01DK109008, Shape UP! Adults. X Li is partly supported by NSF IIS-1320959.
Footnotes
CONFLICT OF INTEREST
The authors declare no conflict of interest.
Supplementary Information accompanies this paper on European Journal of Clinical Nutrition website (http://www.nature.com/ejcn)
REFERENCES
- 1.FerroLuzzi A, Garza C, Haas J, Habicht DP, Himes J, Pradilla A et al. Physical status: the use and interpretation of anthropometry - Introduction. Who Tech Rep Ser 1995; 854: 1–3. [PubMed] [Google Scholar]
- 2.Heymsfield SB, Stevens J. Anthropometry: continued refinements and new developments of an ancient method. Am J Clin Nutr 2017; 105: 1–2. [DOI] [PubMed] [Google Scholar]
- 3.Himes JH. Anthropometric Assessment of Nutritional Status. Wiley-Liss: New York, 1991. [Google Scholar]
- 4.Cameron N The Measurement of Human Growth. Croom Helm: London, 1984. [Google Scholar]
- 5.Madden AM, Smith S. Body composition and morphological assessment of nutritional status in adults: a review of anthropometric variables. J Hum Nutr Diet 2016; 29: 7–25. [DOI] [PubMed] [Google Scholar]
- 6.Ulijaszek SJ, Mascie-Taylor CGN. Anthropometry: The Individual and the Population First ednvol. 14, Cambridge University Press: Cambridge, 1994. [Google Scholar]
- 7.de Groot LC, Sette S, Zajkas G, Carbajal A, Amorim JA. Nutritional status: anthropometry. Euronut SENECA investigators. Eur J Clin Nutr 1991; 45: 31–42. [PubMed] [Google Scholar]
- 8.Lohman TG, Roche AF, Martorell R. Anthropometric Standardization Reference Manual. Human Kinetics Books: Champaign, IL, 1988. [Google Scholar]
- 9.Frisancho AR. Anthropometric Standards for the Assessment of Growth and Nutritional Status. University of Michigan Press: Ann Arbor, 1990. [Google Scholar]
- 10.Roche AF, Mukherjee D, Guo SM, Moore WM. Head circumference reference data: birth to 18 years. Pediatrics 1987; 79: 706–712. [PubMed] [Google Scholar]
- 11.Paxton A, Lederman SA, Heymsfield SB, Wang J, Thornton JC, Pierson RN Jr. Anthropometric equations for studying body fat in pregnant women. Am J Clin Nutr 1998; 67: 104–110. [DOI] [PubMed] [Google Scholar]
- 12.Piers LS, Diggavi SN, Thangam S, van Raaij JM, Shetty PS, Hautvast JG. Changes in energy expenditure, anthropometry, and energy intake during the course of pregnancy and lactation in well-nourished Indian women. Am J Clin Nutr 1995; 61: 501–513. [DOI] [PubMed] [Google Scholar]
- 13.Braganca S, Arezes PM, Carvalho M. An overview of the current three-dimensional body scanners for anthropometric data collection In: Arezes PM, Baptista JS, Barroso MP, Carneiro P, Cordeiro P, Costa N et al. (eds) Occupational Safety and Hygiene III. CRC Press: Taylor & Francis Group: London, 2015; pp 149–154. [Google Scholar]
- 14.Capers PL, Kinsey AW, Miskell EL, Affuso O. Visual representation of body shape in African-American and European American women: clinical considerations. Clin Med Insights Womens Health 2016; 9: 63–70. [DOI] [PMC free article] [PubMed] [Google Scholar]
- 15.Brooke-Wavell K, Jones PR, West GM. Reliability and repeatability of 3-D body scanner (LASS) measurements compared to anthropometry. Ann Hum Biol 1994; 21: 571–577. [DOI] [PubMed] [Google Scholar]
- 16.Soileau L, Bautista D, Johnson C, Gao C, Zhang K, Li X et al. Automated anthropometric phenotyping with novel Kinect-based three-dimensional imaging method: comparison with a reference laser imaging system. Eur J Clin Nutr 2016; 70: 475–481. [DOI] [PubMed] [Google Scholar]
- 17.Xie B, Avila JI, Ng BK, Fan B, Loo V, Gilsanz V et al. Accurate body composition measures from whole-body silhouettes. Med Phys 2015; 42: 4668–4677. [DOI] [PMC free article] [PubMed] [Google Scholar]
- 18.Ng BK, Hinton BJ, Fan B, Kanaya AM, Shepherd JA. Clinical anthropometrics and body composition from 3D whole-body surface scans. Eur J Clin Nutr 2016; 70: 1265–1270. [DOI] [PMC free article] [PubMed] [Google Scholar]
- 19.Centers for Disease Control and Prevention (CDC), National Center for Health Statistics (NCHS)National Health and Nutrition Examination Survey (NHANES): Anthropometry Procedures Manual In: US Department of Health and Human Services, Centers for Disease Control and Prevention. (eds) Hyattsville MD: ) (Centers for Disease Control and Prevention, 2007. [Google Scholar]
- 20.Method for registration of 3-D shapes Proc. SPIE 1611, Sensor Fusion IV: Control Paradigms and Data Structures; April 30, 1992; Boston, MA, USA: 1992. [Google Scholar]
- 21.KinectFusion: real-time 3D reconstruction and interaction using a moving depth camera. 24th annual ACM symposium on User interface software and technology; Oct. 16, 2011 ACM, 2011. [Google Scholar]
- 22.Kazhdan M, Bolitho M, Hoppe H. Poisson surface reconstruction In: Polthier K, Sheffer A (eds). Eurographics Symposium on Geometry Processing. The Eurographics Association: Cagliari, Sardinia, 2006, pp 61–70. [Google Scholar]
- 23.Graham RL. An efficient algorithm for determining the convex hull of a finite planar set. Inf Process Lett 1972; 1: 132–133. [Google Scholar]
- 24.Schuna JM Jr, Peterson CM, Thomas DM, Heo M, Hong S, Choi W et al. Scaling of adult regional body mass and body composition as a whole to height: relevance to body shape and body mass index. Am J Hum Biol 2015; 27: 372–379. [DOI] [PMC free article] [PubMed] [Google Scholar]
- 25.Wilson JP, Mulligan K, Fan B, Sherman JL, Murphy EJ, Tai VW et al. Dual-energy X-ray absorptiometry-based body volume measurement for 4-compartment body composition. Am J Clin Nutr 2012; 95: 25–31. [DOI] [PMC free article] [PubMed] [Google Scholar]
- 26.Collins AL, McCarthy HD. Evaluation of factors determining the precision of body composition measurements by air displacement plethysmography. Eur J Clin Nutr 2003; 57: 770–776. [DOI] [PubMed] [Google Scholar]
- 27.Withers RT, Laforgia J, Heymsfield SB. Critical appraisal of the estimation of body composition via two-, three-, and four-compartment models. Am J Hum Biol 1999; 11: 175–185. [DOI] [PubMed] [Google Scholar]
- 28.Resolving multipath interference in kinect: An inverse problem approach. IEEE Sensors 2014. IEEE, 2014. [Google Scholar]
Associated Data
This section collects any data citations, data availability statements, or supplementary materials included in this article.