

Abstract
The CRISPR-Cas9 system is a powerful tool for genome editing, which allows the precise modification of specific DNA sequences. Many efforts are underway to use the CRISPR-Cas9 system to therapeutically correct human genetic diseases1–6. The most widely used orthologs of Cas9 are derived from Staphylococcus aureus and Streptococcus pyogenes5,7. Given that these two bacterial species infect the human population at high frequencies8,9, we hypothesized that humans may harbor preexisting adaptive immune responses to the Cas9 orthologs derived from these bacterial species, SaCas9 (S. aureus) and SpCas9 (S. pyogenes). By probing human serum for the presence of anti-Cas9 antibodies using an enzyme-linked immunosorbent assay, we detected antibodies against both SaCas9 and SpCas9 in 78% and 58% of donors, respectively. We also found anti-SaCas9 T cells in 78% and anti-SpCas9 T cells in 67% of donors, which demonstrates a high prevalence of antigen-specific T cells against both orthologs. We confirmed that these T cells were Cas9-specific by demonstrating a Cas9-specific cytokine response following isolation, expansion, and antigen restimulation. Together, these data demonstrate that there are preexisting humoral and cell-mediated adaptive immune responses to Cas9 in humans, a finding that should be taken into account as the CRISPR-Cas9 system moves toward clinical trials.
Genome editing, a method used to precisely alter the DNA sequence of a cell, is broadly used as a research tool and is being developed to create gene therapies to treat human diseases. The CRISPR-Cas9 system has proven to be a powerful tool for genome editing because it is relatively simple to use, demonstrates site-specific activity, and has limited off-target effects10,11. The CRISPR-Cas9 system consists of the Cas9 nuclease that, when complexed with a short guide RNA, can be directed to create a double-stranded break in a wide variety of DNA sequences in both eukaryotic and prokaryotic genomes7,10. Therefore, this technology can be adapted to serve clinical applications through the knockout of target genes by non-homologous end joining or the incorporation of new DNA sequences into the genome using homologous recombination. These techniques are being applied to create new cell therapies, either through ex vivo editing of cells followed by transplantation of engineered cells into a patient1–3 or through in vivo editing of a patient’s cells by delivering the CRISPR-Cas9 system using viral vectors (primarily recombinant adeno-associated virus (AAV) vectors) or nanoparticles4–6. For example, substantial progress has been made in using the system to edit hematopoietic stem cells ex vivo to treat sickle cell disease1,3 as well as in vivo to treat conditions such as muscular dystrophy and retinitis pigmentosa12–15.
Although a variety of Cas9 orthologs have been characterized, the most commonly used ones are derived from S. aureus and S. pyogenes. Because of its smaller size, which allows it to be more easily packaged into AAV vectors5, the S. aureus Cas9 ortholog (SaCas9) has been primarily used for in vivo editing applications. On the other hand, the S. pyogenes Cas9 ortholog (SpCas9) has been shown to have great therapeutic potential in the preclinical editing of cells ex vivo as well as in in vivo editing1–3,5,6,16.
S. aureus and S. pyogenes are common human commensals that can also be pathogenic. Approximately 40% of the human population is colonized with S. aureus8 and 20% of school-aged children are colonized with S. pyogenes9, with antibodies and T cells against both bacteria ocurring in high percentages in adults17–20. The abundance of S. aureus and S. pyogenes within the human population, as well as widespread adaptive humoral and cell-mediated immune responses to both species, raises the possibility that humans may also have preexisting adaptive immunity to the Cas9 orthologs derived from these bacteria. Prior work, where recombinant S. aureus Cas9 was expressed in mice, found a clear adaptive immune response to Cas9, indicating that some Cas9 variants can serve as antigens in mammals21.
The presence of preexisting adaptive immune responses in humans may hinder the safe and efficacious use of CRISPR-Cas9 or cause significant toxicity when treating patients with the CRISPR-Cas9 system. In prior gene therapy trials involving patients who had preexisting adaptive immune responses to the viral vector used, no therapeutic benefit was derived from the therapy because of either neutralization of the vector by antibodies22,23 or clearance of transduced cells by cytotoxic T lymphocytes (CTLs)24 or from the expansion of transgene-specific T cells25. Gene therapy suffered a significant setback when a patient died from a systemic inflammatory response to a gene therapy vector26. Thus, the human adaptive immune response can be an important barrier to the safety and efficacy of gene therapy and cannot be reliably evaluated using nonhuman systems27. If humans have a preexisting adaptive immune response to Cas9, then Cas9-based therapies could suffer similar problems. For example, a CTL response against Cas9 would result in the destruction of cells presenting Cas9 peptides on their major histocompatibility complex (MHC) cell surface proteins, potentially eliminating the edited cells and rendering the therapy ineffective28.
In this study, we investigated whether humans possess adaptive immunity toward the two most commonly used Cas9 orthologs. We demonstrated that we can clearly detect preexisting humoral and cellular immunity to both Cas9 orthologs at high frequencies in humans, which raises a potential barrier to the safe and efficacious use of Cas9 to treat disease.
To determine whether the human immune system responded to Cas9 as an antigen, we investigated if we could detect humoral responses against Cas9. To search for preexisting immunoglobulin G (IgG) antibodies against SaCas9 and SpCas9, we used serum from human cord blood (the IgG in cord blood reflects the seroprevalence of an IgG antibody in the mother) to probe for Cas9 using immunoblot (Fig. 1a). This assay revealed that IgG antibodies to both SaCas9 and SpCas9 could be detected in human serum. Using immunoblot to detect seroreactivity against purified Cas9 in 22 cord blood donors, we found that 86% of donors stained positively for SaCas9 and 73% for SpCas9 (1:10 serum dilution), with some donors testing positive for one ortholog of Cas9 but not the other. We then assayed Cas9 antibodies using serum from peripheral blood drawn from 12 healthy non-pregnant adults. We found anti-SaCas9 antibodies in 67% of donors and anti-SpCas9 antibodies in 42% of donors (1:10 serum dilution) (Fig. 1b, Table 1, and Extended Data Fig. 1).
Fig. 1 |. Identification of preexisting humoral immunity to Cas9.
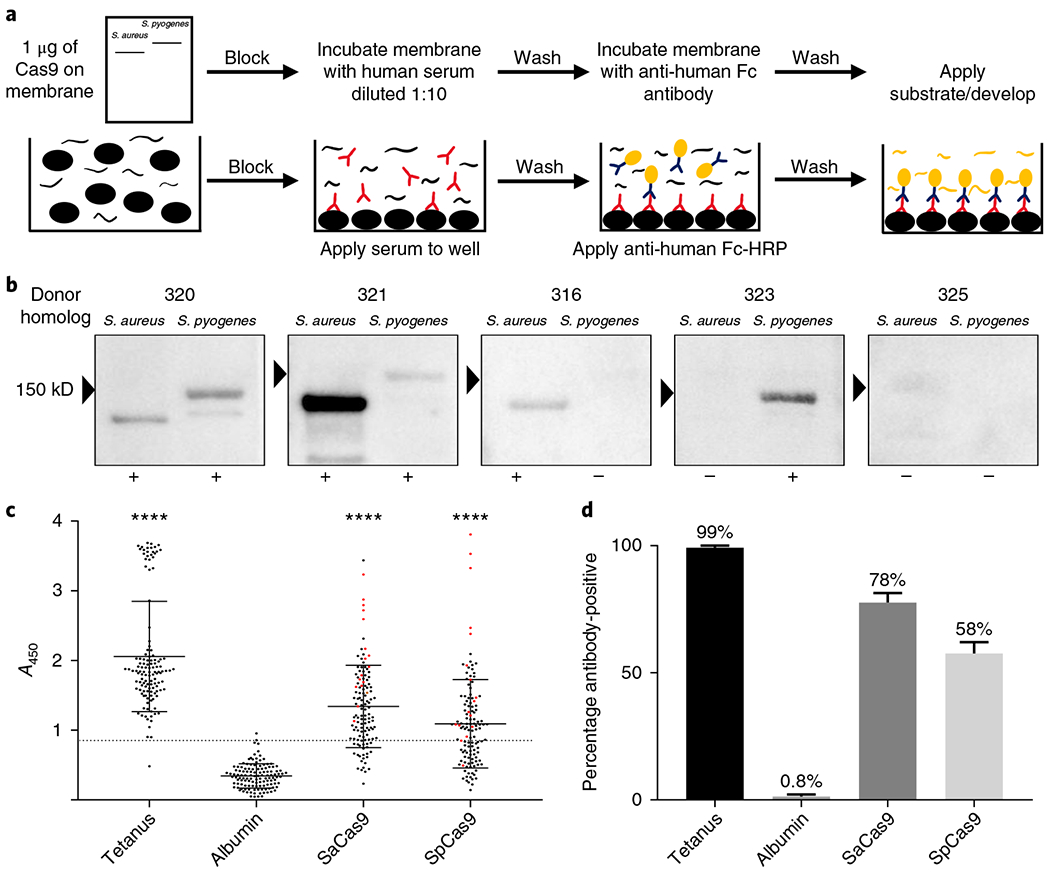
a, Top, schematic representation of the workflow used to perform an immunoblot to detect antibodies against Cas9. Bottom, schematic representation of the workflow used to perform an ELISA to detect antibodies against different antigens. b, Representative images from the immunoblots performed to detect antibodies against Cas9, which demonstrate a range of responses in different donors. The ‘+’ symbols indicate that a donor was considered positive for antibodies against Cas9; the ‘−’ symbols indicate that a donor was considered negative for antibodies against Cas9. c, Results from the ELISA screen performed at a serum dilution of 1:50 to detect antibodies against Cas9 (n = 125). All donors above the dotted line were considered antibody-positive; the line represents the mean absorbance of the negative control, human albumin, plus three s.d. from the mean. The red dots indicate donors tested for a T cell response to Cas9 and the black bars indicate the mean and s.d. of each dataset. ****P<0.0001 as determined by an unpaired Student’s t-test. Each antigen was tested for significance against the negative control, human albumin. d, Bar graph indicating the frequency at which different donors were positive for a humoral response against each antigen, as determined by ELISA.
Table 1 |.
Frequency of antigen-reactive responses detected for each assay
| Assay | Immunoblot | ELISA | ELISpot | ICS | CD137 | CD154 | T cell positive | T cell intermediate | T cell negative |
|---|---|---|---|---|---|---|---|---|---|
| SaCas9+ | 68% | 78% | 55% | 66% | 88% | 94% | 78% | 17% | 6% |
| SpCas9+ | 56% | 58% | 33% | 44% | 100% | 94% | 67% | 22% | 6% |
| Tetanus toxoid+ | N/A | 99% | 78% | 50% | 100% | 94% | 100% | 0% | 0% |
| Total donors | 34 | 125 | 18 | 18 | 18 | 18 | 18 | 18 | 18 |
We developed an enzyme-linked immunosorbent assay (ELISA) as a higher throughput quantitative method to detect the presence of antibodies against Cas9 (Fig. 1a). Using human albumin as the negative control and tetanus toxoid as the positive control, we tested a range of dilutions of human serum that best allowed the detection of antibodies against antigenic proteins. At each dilution tested (1:10, 1:50, 1:100, 1:1,000), we found a significant difference between the two Cas9 orthologs compared to our negative control (Extended Data Fig. 2; P < 0.001, n = 17). We proceeded with a 1:50 dilution in our subsequent ELISA assays because it gave the best dynamic range and to be consistent with other studies21,29,30. We detected antibodies against both Cas9 orthologs in 125 adult blood donors. We observed a significant difference between the mean absorbance obtained when probing against each antigenic protein—SaCas9 (1.34), SpCas9 (1.092), and tetanus toxoid (2.057)—compared with the negative control, human albumin (0.34) (P < 0.0001, n = 125) (Fig. 1c,d and Table 1). The cutoff for determining whether a donor was considered positive or negative for the presence of antibodies against an antigenic protein was conservatively set at the mean absorbance of human albumin plus three s.d. from the mean31. Human albumin was found to be normally distributed by an Anderson-Darling test (P = 1). At this cutoff point, we could detect antibodies against SaCas9 in 78% of donors, SpCas9 in 58% of donors, and tetanus toxoid in 99% of donors with a single false positive. No correlation could be made between the ELISA results and age, ethnicity, or sex (Supplementary Tables 1 and 2).
To test whether a preexisting immune response to Cas9 also existed, we used three different highly sensitive methods to detect antigen-reactive T cells: interferon-γ (IFN-γ) enzyme-linked immunospot (ELISpot); intracellular cytokine staining (ICS); and detection of activated T cells by the expression of CD137 or CD154 on the cell surface32–35.
In each assay, an antigen was added to a mixture of peripheral blood mononuclear cells (PBMCs) and spontaneously taken up by antigen-presenting cells (APCs). The antigen was then processed and expressed as an MHC-peptide complex on the APC surface. If antigen-reactive T cells are present and recognize the epitopes being presented, they become activated. This activation can be detected by the production of cytokines such as IFN-γ, tumor necrosis factor-α (TNF-α), and interleukin-2 (IL-2), as well as markers of T cell activation such as CD137 or CD154.
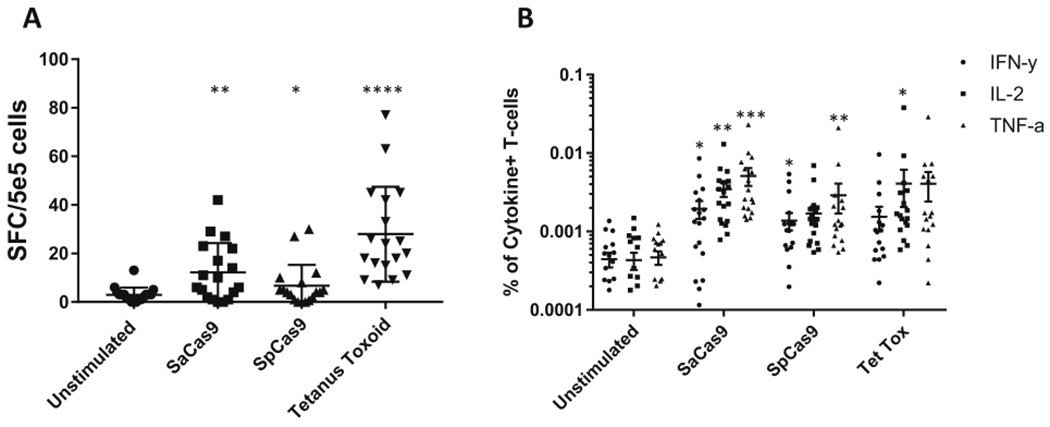
Detecting the release of IFN-γ from antigen-reactive T cells by ELISpot, we found a statistically significant increase in the frequency of cells releasing IFN-γ when PBMCs were stimulated with tetanus toxoid (27.94), SaCas9 (22.25), or SpCas9 (8.25) compared with an unstimulated control (2.9) (P< 0.0001, P = 0.002, P = 0.02, n = 18; Fig. 2a–c, Table 1, and Extended Data Fig. 4a). We scored 78%, 55%, and 33% of donors positive for T cell reactivity to tetanus toxoid, SaCas9, and SpCas9, respectively using the ELISpot assay.
Fig. 2 |. Identification of Cas9-specific T cell responses in humans.
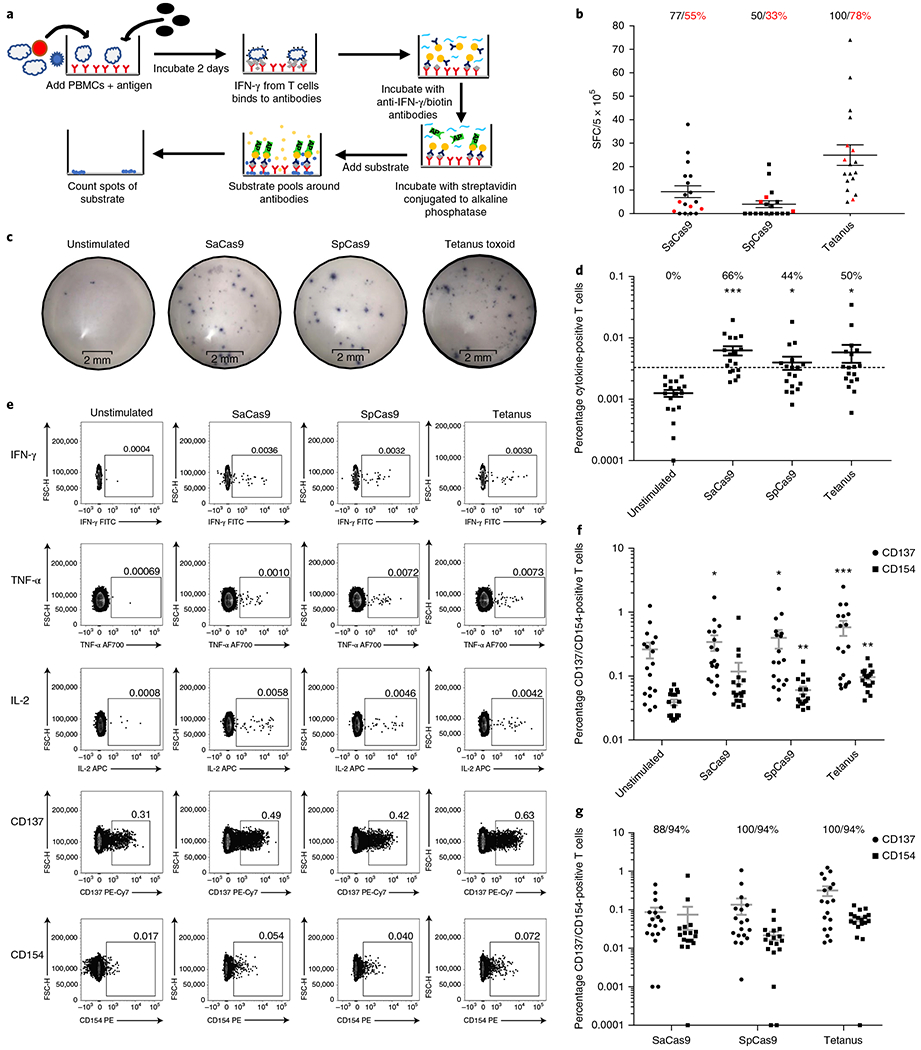
a, Schematic outlining the workflow for detecting antigen-reactive T cells by ELISpot. b, Results from the ELISpot assay. Each donor was tested in replicates of three. The average number of spots from the unstimulated sample was subtracted from samples that received each different antigen; negative values were set to zero. The red dots indicate donors who did not have a statistically significant difference in the frequency of spots compared to the unstimulated sample (unpaired Student’s t-test, P < 0.05). The black text indicates the percentage of donors with an increase in spots over the unstimulated sample and the red text indicates the percentage of donors with a statistically significant increase in spots compared with the unstimulated sample. The black bars indicate the mean and 95% confidence interval (CI) (n= 18). SFC, spot-forming cells. c, Representative images from the ELISpot assay from a single donor who was positive for an antigen-reactive T cell response to both Cas9 orthologs and to tetanus toxoid. d, Frequency of T cells that were positive for a cytokine response when each different antigen was added to the culture. Donors above the dotted line were considered positive for a cytokine response to each antigen. The cutoff was determined by taking the mean frequency of cytokine-positive T cells in the unstimulated sample and adding three times the s.d. of the mean. The text indicates the percentage of donors that were positive for a cytokine response to each different antigen. The black bars indicate the mean and 95% CI. Samples that had no cytokine-positive cells were set to 0.0001. *P < 0.05, ***P < 0.001, paired t-test; each dataset was tested against the unstimulated control for significance (n= 18). e, Representative fluorescence-activated cell sorting (FACS) plots from the same donor as in c, who was positive for both cytokine and activation marker responses to both Cas9 orthologs and to the positive control, tetanus toxoid. FITC, fluorescein isothiocyanate; FSC-H, forward scatter height; AF700, Alexa Fluor 700; PE-Cy7, streptavidin. f, Frequency of CD137-negative and CD154-positive T cells when each different antigen was added to the culture; the gray bars represent the mean and 95% CI. *P <0.05, **P < 0.01, and ***P < 0.001 as determined by a paired t-test. Each dataset was tested for significance against the unstimulated control (n= 18). g, Percentage of T cells that were positive for CD137 or CD154 over the unstimulated control. The graph conveys the frequency of CD137/CD154 T cells after the background (the unstimulated control) was subtracted (n= 18). The text indicates the percentage of donors who had an increase in each activation marker compared to the unstimulated control; the gray bars indicate the median and 95% CI. Negative values were set to 0.0001.
We also detected a significant increase in the mean frequency of antigen-reactive T cells compared with the unstimulated control using ICS (Fig. 2d,e and Extended Data Figs. 3, 5, 6, and 7). We found a mean frequency of 1.25 × 10⁻³ cytokine-positive cells in the unstimulated control compared to 6.2 × 10⁻³ when SaCas9 was introduced, 4 X 10⁻³ when SpCas9 was introduced, and 5.8 X 10⁻³ when tetanus toxoid was introduced. We called a donor positive if the mean percentage of cytokine-positive T cells was three s.d. from the mean in the unstimulated negative control31. The distribution of the unstimulated control was found to be normal using an Anderson-Darling test (P=0.85). Using these criteria, we found that 50%, 66%, and 44% of donors were positive for a cytokine response to tetanus toxoid, SaCas9, and SpCas9, respectively (P=0.03, P=0.0003, P=0.02, respectively, n= 18; Fig. 2f, Table 1, and Extended Data Fig. 4).
Finally, using the CD137 and CD154 activation markers, we again found that each antigen elicited a statistically significant increase in the frequency of activation marker-positive T cells compared with the unstimulated control (Fig. 2e–g and Extended Data Figs. 3, 5, 6, and 7). Subtracting the background from each stimulated sample, we found that all donors displayed an increase in the frequency of T cells that were positive over the baseline for either CD137 or CD154. We found an average frequency of 0.32% T cells positive for CD137 and 0.06% for CD154 when stimulated with tetanus toxoid (P = 0.002, P< 0.0001, respectively, n= 18), and an average of 0.08% positive for CD137 and 0.04% for CD154 when stimulated with SaCas9 (P = 0.01, NS, respectively, n= 18), as well as an average of 0.14% positive for CD137 and 0.02% when stimulated with SpCas9 (P = 0.04, P = 0.001, respectively, n = 18) (Fig. 2f,g and Table 1).
To demonstrate antigen specificity to Cas9, we sorted and expanded activated T cells that had been stimulated with either SaCas9 or SpCas9 using flow cytometry and then rechallenged them with their respective Cas9 ortholog or with tetanus toxoid. We found that expanded T cells had a clear antigen-specific intracellular cytokine response when rechallenged with the appropriate Cas9 ortholog but not tetanus toxoid (Fig. 3 and Extended Data Fig. 8). This antigen-specific cytokine response was demonstrated between donors (n = 3) and between technical replicates of donor 213 (n = 2). We found that all donors positive for cellular activity against Cas9 were also positive for antibody activity, except for two donors (Fig. 1c), demonstrating high concordance between cellular and humoral immunoreactivity.
Fig. 3 |. Isolation and restimulation of Cas9-specific T cells.
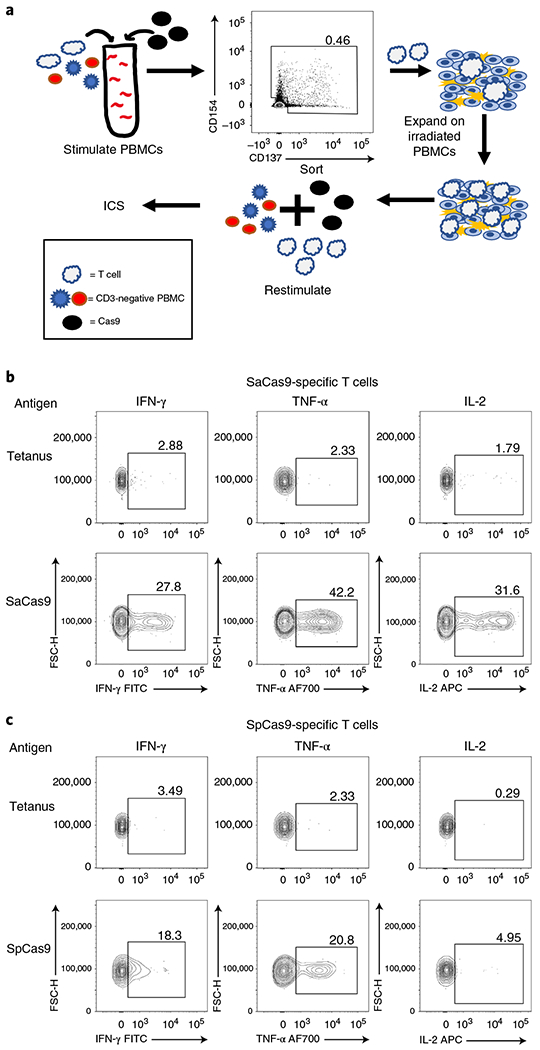
a, Schematic outlining the process for isolating antigen-reactive T cells, expanding isolated T cells, and restimulating expanded T cells with CD3-depleted PBMCs from the same donor with antigen. b, FACS plots demonstrating that expanded SaCas9-specific T cells from donor 213 have an antigen-reactive cytokine response when rechallenged with SaCas9, but not to tetanus toxoid. c, FACS plots demonstrating that expanded SpCas9-specific T cells from donor 213 have an antigen-specific cytokine response to SpCas9 but not to tetanus toxoid when re-stimulated. FITC, fluorescein isothiocyanate; FSC-H, forward scatter height; AF700, Alexa Fluor 700.
We also found that there was consistent activity across the four different assays used (ELIspot, ICS, CD137+ and CD154+) across different donors. To be conservative in our analysis, we only considered donors to be positive for the presence of antigen-reactive T cells against an antigen if they showed up positive across three out of four assays, negative if they showed up as negative across three out of four of assays, and indeterminate if the results between the assays were mixed. Using this threshold, we found that 100% of donors were positive for the presence of antigen-reactive T cells against tetanus toxoid, 78% were positive for antigen-reactive T cells against SaCas9, and 67% were positive for the presence of antigen-reactive T cells against SpCas9 (Table 1).
In this study, we provide evidence of preexisting adaptive immune responses to Cas9 in humans. We detected IgG antibodies against both SaCas9 and SpCas9 in the study population, and could also detect antigen-reactive T cells directed against both Cas9 orthologs. These data need to be taken into consideration when moving forward with any clinical trial involving the use of the CRISPR-Cas9 system to treat disease.
Since the release of our preliminary work, two other groups have also reported on preexisting adaptive immune responses to Cas9 in humans36. Simhadri et al.29 detected antibodies against Cas9 by ELISA in a pool of 200 donors, although they determined that anti-SaCas9 antibodies were present in only 10% of the population and anti-SpCas9 antibodies were present in only 2.5% of the population, after mathematical adjustment. In contrast, Wagner et al.37 detected a universal antigen-reactive T cell response to SpCas9, as measured by an increase in the frequency of CD137+ T cells compared to an unstimulated control in a pool of 48 donors. In this study, using ELISA we detected antibodies against SaCas9 and SpCas9 in the study population at frequencies of 78% and 58%, respectively. Similarly, screening a group of 18 donors for antigen-reactive T cells against Cas9 using four different assays and conservative cutoffs for a sample to be considered positive, we found antigen-reactive T cells against both SaCas9 and SpCas9 in 78% and 68% of donors, respectively. In our analysis, we applied conservative cutoffs, using three s.d. from the mean as a cutoff, instead of two s.d., for example. We also used frozen PBMCs, which are known to have lower levels of activation and result in a higher frequency of false negatives compared to the freshly collected PBMCs used by Wagner et al.37, which may explain why we did not achieve near-universal positivity as they did38. While there are differences between all three studies that will be better understood by future research, all three studies support the need, particularly for the in vivo use of Cas9-based therapies, to screen each patient for the presence or absence of humoral and cellular immunity to the Cas9 version being used.
Preexisting adaptive immune responses to Cas9 may not prove to be a major barrier to the implementation of ex vivo therapies, which involve the use of Cas9 to edit cells outside of direct contact with the human immune system. Peptide fragments of any protein delivered into cells ex vivo are typically only expressed transiently on MHC class I molecules; as such, Cas9 peptides may no longer be present on the cell’s surface at the time of transplantation, particularly if Cas9 is delivered as a short-lived ribonucleoprotein complex.
The presence of antigen-reactive T cells against Cas9 may prove to be most problematic for therapies that involve in vivo delivery of Cas9. Much of the effort to treat disease in vivo has used Cas9 delivery systems that express the Cas9 protein for prolonged periods of time, such as through a non-integrating AAV vector or through nanoparticle delivery of messenger RNA to non-dividing hepatocytes5,12–14. Use of these viral vectors has been shown to lead to sustained expression of Cas9. However, when a patient has preexisting antigen-reactive T cells against Cas9, memory T cells might rapidly expand in response to Cas9 being presented by MHC class I molecules on the cell surface, and cytotoxic T cells could target and clear cells presenting Cas9 on surface28. Furthermore, it is possible that constitutive expression of Cas9 in a large proportion of cells of an organ could elicit a cytotoxic T cell response against Cas9-expressing cells that could result in significant organ toxicity39.
While we have detected antigen-specific T cells against both common orthologs of Cas9, further work is required to determine the impact that these findings will have on clinical genome editing. Future work will focus on determining what the killing capacity of these preexisting antigen-specific T cells is and how they respond to cells presenting Cas9, in both in vitro and in vivo settings. Potential solutions to preexisting adaptive immunity to Cas9 may include the use of immune suppression or depletion to prevent severe cell-mediated responses to Cas9, using Cas9 orthologs from other bacterial species that do not infect or reside in humans, or using Cas9-based therapies in people before they develop an adaptive immune response to Cas9.
In conclusion, our findings raise important new considerations for the therapeutic applications of the CRISPR-Cas9 system. We believe our findings will stimulate crucial discussions in the genome editing community regarding safety and efficacy as this technology is translated to humans.
Methods
Cas9 purification.
For the immunoblot assay, Cas9 was produced as follows: recombinant histidine-tagged SpCas9 protein was expressed from pET-28b-Cas9-His in Rosetta 2 cells (EMD Millipore); recombinant SaCas9 was cloned from BPK2139 into a pET-28b-His backbone and was expressed in Rosetta 2 cells. Bacteria were grown in ZYP-5052 media (VWR) at 37 °C for 12 h, followed by 24 h at 18 °C. The bacterial pellet was centrifuged at 6000g· for 15 min at 4 °C. The pellet was resuspended in lysis buffer (50 mM NaH2PO4, 300 mM NaCl, 10 mM imidazole, 4 mM dithiothreitol (DTT), 5 mM benzamidine, 100 mM phenylmethylsulfonyl fluoride, pH8) and lysozyme was added at 1 mg ml−1. After incubation at 4 °C for 30 min, the lysate was sonicated for 6 10-s bursts at 200 W, with 10-s intervals. Lysate was spun at 16,200g for 1 h at 4 °C and the supernatant was bound to Ni-NTA agarose (QIAGEN) at 200 r.p.m. at 4 °C for 1 h. The slurry was loaded onto a column; then, 50 column volumes of wash buffer with 0.1% Triton X-114 was run over it to remove endotoxin, as described previously40 (50 mM NaH2PO4, 300 mM NaCl, 20 mM imidazole, 0.1% Triton X-114, pH8). The sample was then washed with 20 column volumes of wash buffer (50 mM NaH2PO4, 300 mM NaCl, 20 mM imidazole, pH8) and eluted with elution buffer (50 mM NaH2PO4, 300 mM NaCl, 250 mM imidazole, pH8). The eluted SpCas9 and SaCas9 were concentrated using a 100 kDa Amicon Ultra Centrifugal Filter (EMD Millipore) and stored in a solution of 10 mM Tris-HCl, 150 mM NaCl, and 50% glycerol.
For the ELISA, ELISpot, and ICS assays, and the detection of CD137/CD154 activated T cells, nuclear localization signal-free SaCas9 and SpCas9 were provided by Integrated DNA Technologies (IDT). IDT-produced Cas9 was tested for >95% purity by SDS-polyacrylamide gel electrophoresis, had <10 EU ml−1 of endotoxin, and was absent from contaminating DNA and RNA as determined by the RNaseAlert and DNaseAlert kits (IDT).
Immunoblot
Aliquots of 1 μg SpCas9 (either histidine-tag-purified or Alt-R SpCas9 (IDT)) and 1 μg SaCas9 protein were resolved in Laemli sample buffer applied to a 5–15% polyacrylamide gel. Samples were transferred to a polyvinylidene fluoride membrane and blocked with 5% non-fat milk in trisbuffered saline and Tween 20 (TBST, 50 mM Tris-HCl, 150 mM NaCl, 0.05% Tween 20, pH7.6) for 1 h at 4 °C. Immunoblots were then incubated overnight in TBST with 0.05% non-fat milk with a 1:10 dilution of serum. Immunoblots were washed five times for 5 min in TBST on a shaker and then incubated with horseradish peroxidase-conjugated goat anti-human IgG Fc secondary antibody (Novus) at a dilution of 1:5,000 for 1 h at room temperature. Samples were then washed five times for 5 min in TBST and developed using a Clarity Western ECL Blotting Substrate (Bio-Rad Laboratories) and imaged. Immunoblots were analyzed with Image Lab (version 6.0.1, Bio-Rad); the volume of bands was compared to the background using the volume analysis tool on each lane. Cord blood serum was provided by the Binns Family Program for Cord Blood Research and the adult serum was provided by the Stanford Blood Center.
Donors for the ELISA assay were selected at random and consisted predominantly of white and Asian donors, reflecting the donor pool for the blood center. The median age of the donors tested was 43; 65% of donors were male.
ELISA.
An ELISA protocol was adapted from Chew et al.21 and Wang et al.30. Each antigen—Cas9 (IDT), tetanus toxoid (Astarte Biologics), or human albumin (Sigma-Aldrich)—was coated onto a 96-well Maxisorp plate (Thermo Fisher Scientific) overnight at 4 °C in 1x bicarbonate buffer (Sigma-Aldrich). Plates were then washed three times for 5 min on a shaker at a rotation of 200 r.p.m. with 1x wash buffer (TBST, pH8.0; Sigma-Aldrich). Plates were then blocked with 1% bovine serum albumin (BSA) blocking solution (Thermo Fisher Scientific) for 2 h at room temperature. Serum samples obtained from the Stanford Blood Center were applied diluted in 1% BSA blocking solution at varying concentrations as described for each experiment; plates were incubated for 5 h at 4 °C with shaking at 200 r.p.m. Plates were then washed as described previously; HRP-conjugated goat anti-human Fc antibody (Novus) was then applied at a dilution of 1:100,000 in 1% BSA blocking solution and incubated for 1 h at room temperature. 3,3’,5,5’-Tetramethylbenzidine substrate solution (Thermo Fisher Scientific) was then added and allowed to develop for 15 min before 1 N sulfuric acid (Thermo Fisher Scientific) was added to stop the reaction. The absorbance at 450 nm was then analyzed using a SpectraMax M3 microplate reader (Molecular Devices).
Collection, storage, and thawing of PBMCs
PBMCs were isolated from apheresis products from healthy donors obtained from the Stanford Blood Center using Ficoll-Paque density-gradient centrifugation (density: 1.077 g ml−1; GE Healthcare Life Sciences), according to the manufacturer’s instructions. Cells were cryopreserved using a rate-controlled container. Cells were thawed as described elsewhere with minor modifications41. Briefly, cells were thawed under a running tap and then diluted 1:10 in medium (Roswell Park Memorial Institute (RPMI) 1640 medium, 5% human AB serum, 1,000 U ml−1 penicillin, 1,000 μgml−1 streptomycin) with 25 U ml−1 of benzonase nuclease (Santa Cruz Biotechnology). Cells were spun at 400g for 10 min, the medium was aspirated, and cells were then resuspended in 1 ml of medium with 25 U ml−1 benzonase and passed through a 70 μm filter; 9 ml of the medium with 25 U ml−1 of benzonase was then added to cells and they were spun again at 400g for 10 min. The medium was aspirated and cells were resuspended in benzonase-free medium; 1×10⁷ PBMCs were plated at a concentration of 5 × 10⁶ cells ml−1 in Falcon 15 ml tubes (Corning).
Donors for the T cell assays were randomly selected by the Stanford Blood Center and predominantly consisted of white males (see Supplementary Tables 3 and 4). The median age of the donors tested was 33. No clear correlations between age, ethnicity, or sex and T cell responses were found.
ELISpot.
A human IFN-γ ELISPOT kit (R&D Systems) was used to detect antigen-reactive T cells; 5 × 10⁵ cells were plated per well in medium (RPMI 1640, 5% human AB serum, 1,000 U ml−1 penicillin, 1,000 ug ml−1streptomycin) for 2 days with antigen at a concentration of 10 ug ml−1. Plates were then developed after 2 days, according to the manufacturer’s instructions.
ICS
Cells were thawed and plated as described earlier, then rested overnight. Each antigen was then added to cells at a concentration of 10 ug ml−1. After 2 h of incubation with antigen, brefeldin A (Abcam) was added at a concentration of 10 ug ml−1 and cells were incubated for another 4 h. Cells were washed two times in staining buffer (1% human AB serum and 0.02% sodium azide in PBS, pH7) and surface-stained for CD3 (PerCP/Cy5.5 anti-human CD3 Antibody, clone HIT3a; BioLegend), CD4 (Brilliant Violet 605 anti-human CD4 antibody, clone OKT4; BioLegend), and CD8a (Brilliant Violet 421 anti-human CD8a Antibody, clone RPA-T8; BioLegend). Cells were subsequently fixed/permeabilized with a Cytofix/Cytoperm kit (BD Biosciences) and stained for intracellular cytokines as follows: IFN-γ (FITC Mouse Anti-Human IFN-γ, clone 25723.11; BD Biosciences); TNF-α (Alexa Fluor 700 anti-human TNF-α Antibody, clone MAb11; BioLegend); and IL-2 (APC anti-human IL-2 Antibody, clone MQ1-17H12; BioLegend). Cells were then washed two times in permeabilization buffer (BD Biosciences), resuspended in staining buffer, and analyzed with a FACSAria II flow cytometer (BD Biosciences)
CD137/CD154 analysis
Cells were thawed and plated as described earlier and then rested overnight. After an overnight rest, cells were incubated with each antigen at a concentration of 10 ug ml−1 for 16 h. Cells were then washed two times in staining buffer and stained with CD3 (PerCP/Cy5.5, clone HIT3a), CD4 (Brilliant Violet 605, clone OKT4), CD8a (Brilliant Violet 421, clone RPA-T8), CD137 (PE/Cy7 anti-human CD137 (4-1BB) Antibody, clone 4B4-1; BioLegend), and CD154 (PE anti-human CD154 Antibody, clone 24-31; BioLegend). Cells were then washed two times in staining buffer, resuspended in staining buffer, and analyzed with a FACSAria II flow cytometer.
Isolation, expansion, and restimulation of antigen-reactive T cells
Cells were thawed, incubated with antigen, and then stained for CD137/CD154 as described earlier. CD4/CD8 T cells that were positive for CD137/CD154 were then sorted with a FACSAria II flow cytometer and plated on irradiated PBMCs (60 Gy) from the same donor whose cells had been incubated with the same antigen, at a ratio of 1:50 in 96-well round bottom plates (Corning). Cells were then expanded for 10 days in medium (RPMI 1640, 1,000 U ml−1 penicillin, 1,000 ug ml−1streptomycin) supplemented with 50 U ml−1 IL-2. The medium was changed once every 2 days, and cells were split as needed.
After expansion, cells were counted and put into culture with the PBMCs from the same donor who had been CD3-depleted, according to the manufacturer’s instructions (Miltenyi Biotec) at a ratio of 1:10, along with 1 ug ml−1 CD28 antibody (Miltenyi Biotec). Antigen was added at 10 ug ml−1 and cells were stained for intracellular cytokines, as described earlier.
Reporting Summary
Further information on research design is available in the Nature Research Reporting Summary linked to this article.
Data availability
The data supporting the findings of this study are available within the paper. Any additional data and materials that can be shared will be released via a Material Transfer Agreement.
Extended Data
Extended Data Fig. 1 |. Initial screen for anti-Cas9 donors by immunoblot.
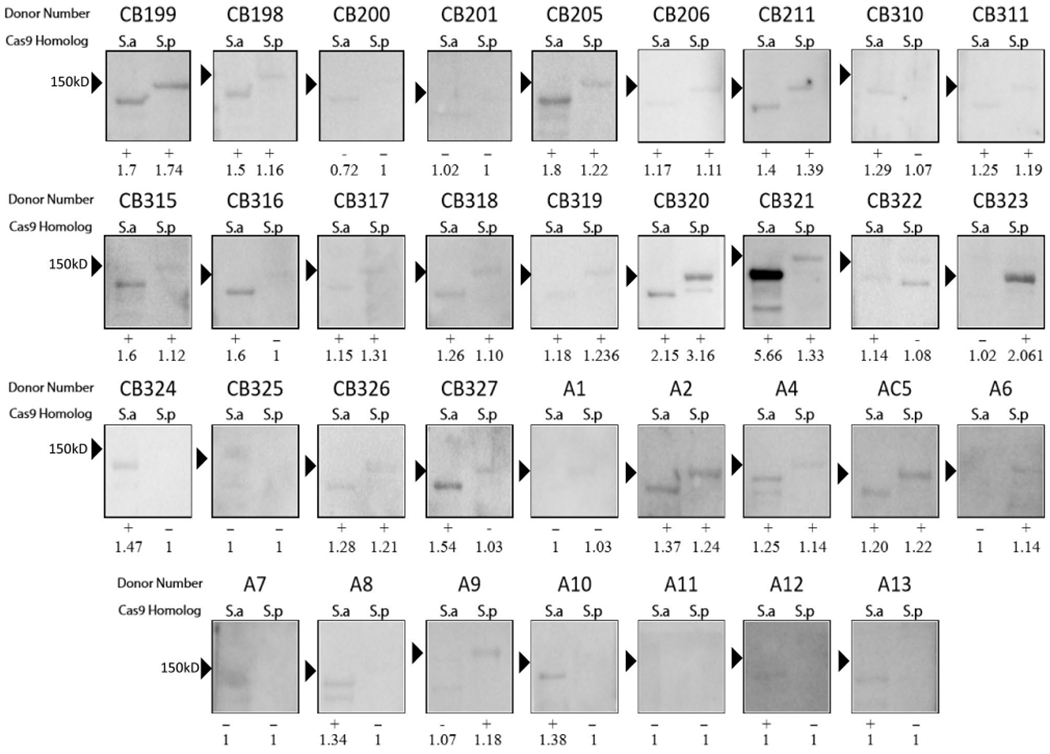
Immunoblot analysis using healthy donor serum to determine if humans have IgG antibodies to Cas9 proteins. Serum derived from cord blood (labeled ‘CB’) or adults (labeled ‘A’) and immunoreactivity against purified Cas9 proteins are shown. S.a, S. aureus Cas9 ortholog; S.p, S. pyogenes Cas9 ortholog. Each lane with a detectable band was analyzed for volume and the score of Cas9 to the background was measured by dividing the volume of the Cas9 band by the volume of the background. Each immunoblot was scored as either positive (+) or negative (−) for immunoreactivity. To be considered serum-positive for antibodies against either Cas9 ortholog, a band must have been present at the correct size on the immunoblot and have had a ratio of 1.10 over the background. A ratio of 1 indicates that no band could be detected at the correct molecular weight.
Extended Data Fig. 2 |. Titers of human serum concentrations used to detect anti-Cas9 antibodies with ELISA.
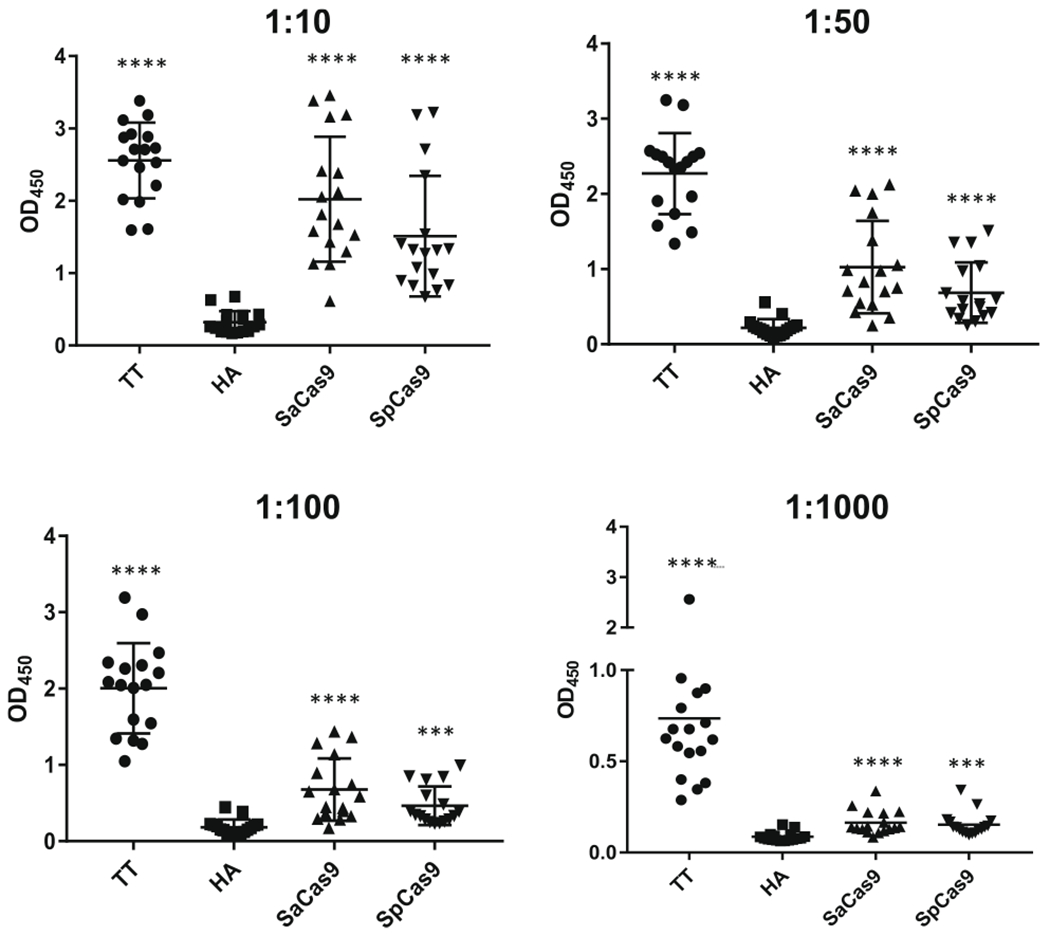
The same donor’s serum was applied at different concentrations by ELISA to detect antibodies against each antigen. The dilution of serum used to detect antibodies against each antigen is denoted above each graph.
Extended Data Fig. 3 |. Representative gating strategy to detect antigen-reactive T cells.
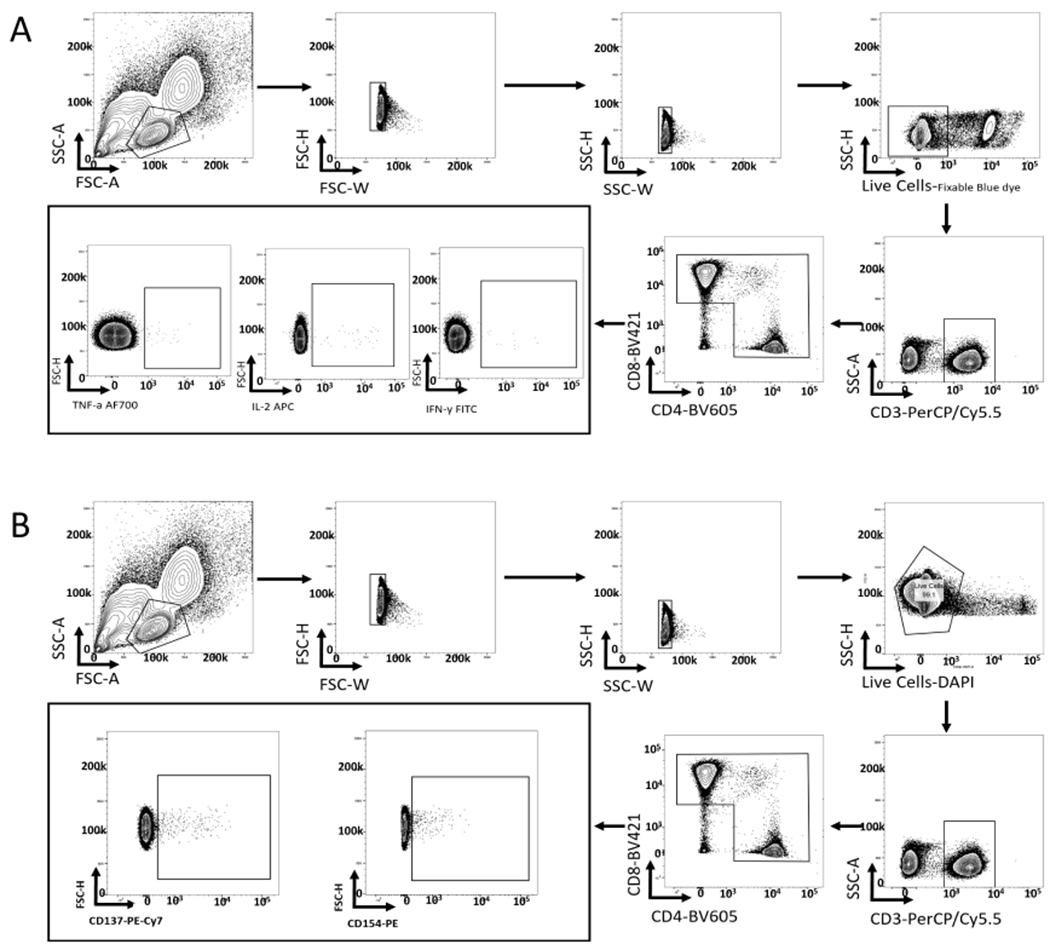
a, Representative gating strategy to detect antigen-reactive T cells by ICS. b, Representative gating strategy for detecting CD137 and CD154-positive T cells.
Extended Data Fig. 4 |. Cytokine responses to antigen stimulation of PBMCs.
a, Frequency of spots detected when 5×10⁵ PBMCs were applied to wells of an ELISpot plate and challenged with each different antigen; the error bars represent the s.d. (n = 18). Significance was measured using a paired Student’s t-test. b, Frequency of T cells that were positive for different cytokines on antigen stimulation, as detected by ICS (n = 18). The black bars indicate the mean percentage of T cells positive for each cytokine (n = 18). *P<0.05, **P< 0.01, ***P< 0.001, paired Student’s t-test. Each dataset was tested for significance against the unstimulated control.
Extended Data Fig. 5 |. FACS data from ICS and activation marker staining for donors 209 and 211-215.
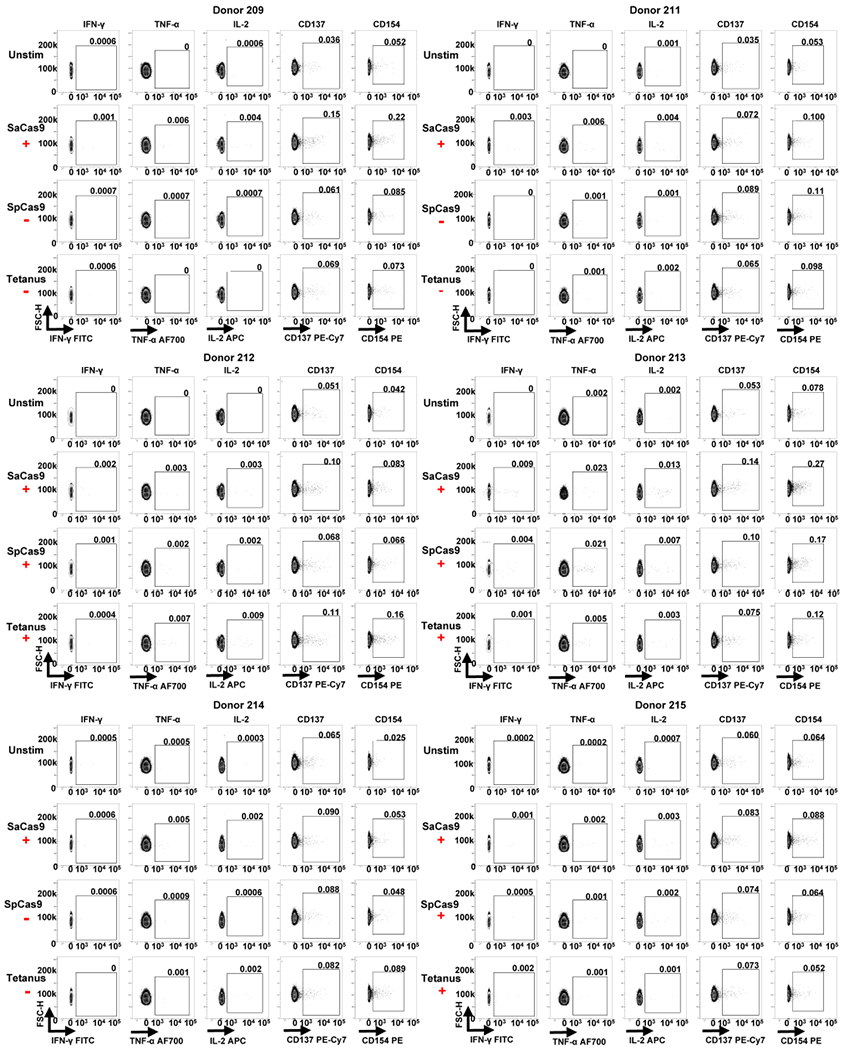
Each individual donor number is shown at the top of each group of FACS plots. The red ‘+’ symbol below an antigen name indicates that a donor was considered positive for a cytokine response against that antigen by ICS. The red ‘−’ symbol below an antigen name indicates a donor was considered negative for a cytokine response to that antigen by ICS.
Extended Data Fig. 6 |. FACS data from ICS and activation marker staining for donors 16-221.
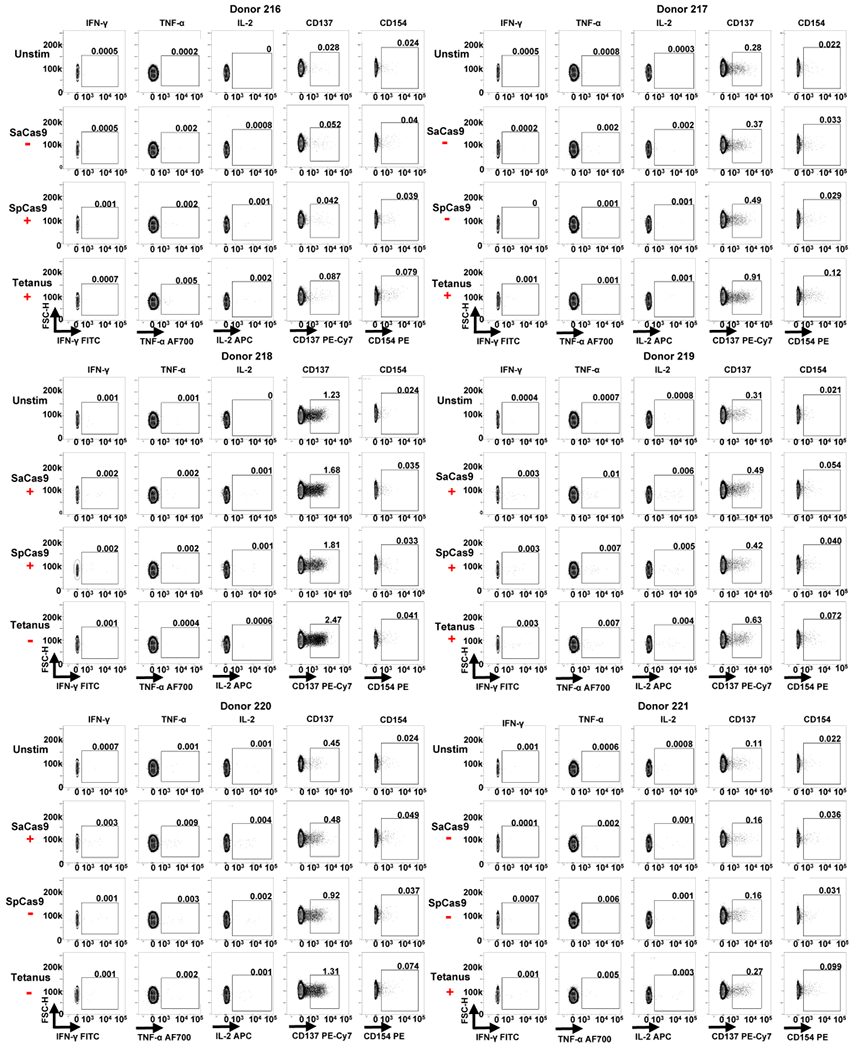
Each individual donor number is shown at the top of each group of FACS plots. The red ‘+’ symbol below an antigen name indicates that a donor was considered positive for a cytokine response against that antigen by ICS. The red ‘−’ symbol below an antigen name indicates that a donor was considered negative for a cytokine response to that antigen by ICS.
Extended Data Fig. 7 |. FACS data from ICS and activation markers staining for donors 223-228.
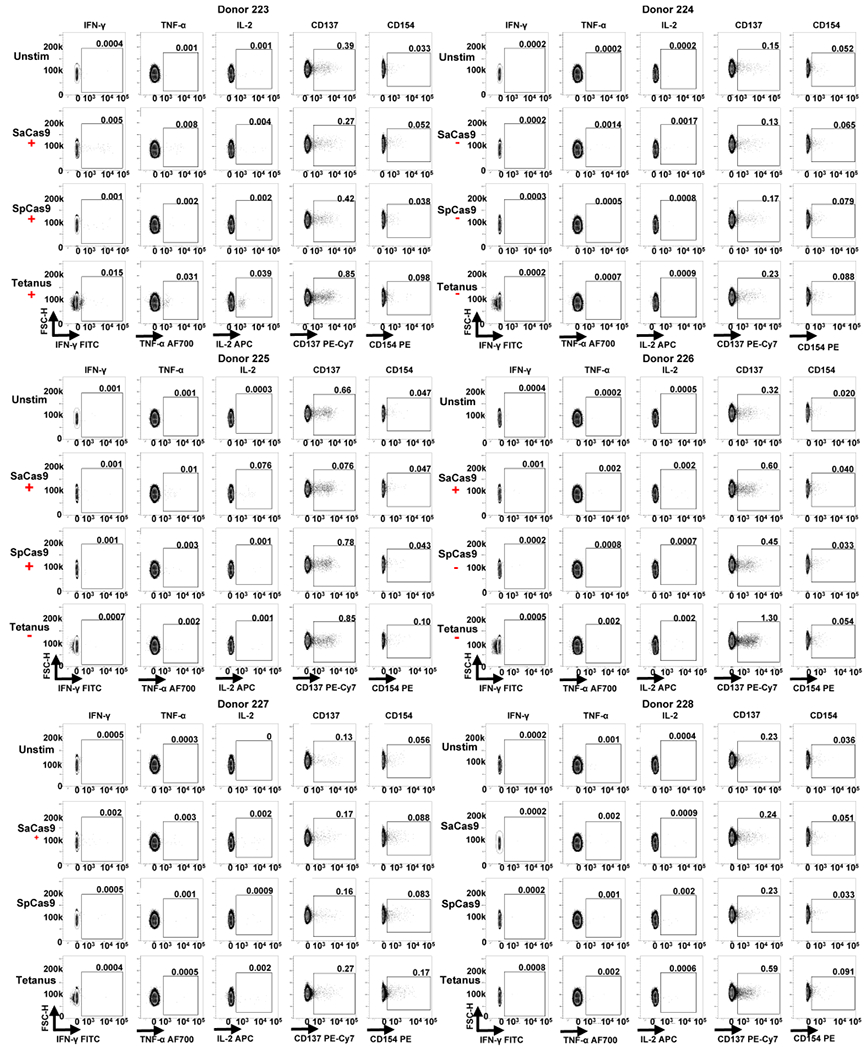
Each individual donor number is shown at the top of each group of FACS plots. The red ‘+’ symbol below an antigen name indicates that a donor was considered positive for a cytokine response against that antigen by ICS. The red ‘−’ symbol below an antigen name indicates that a donor was considered negative for a cytokine response to that antigen by ICS.
Extended Data Fig. 8 |. Results from expansion and restimulation of antigen-specific T cells against Cas9.
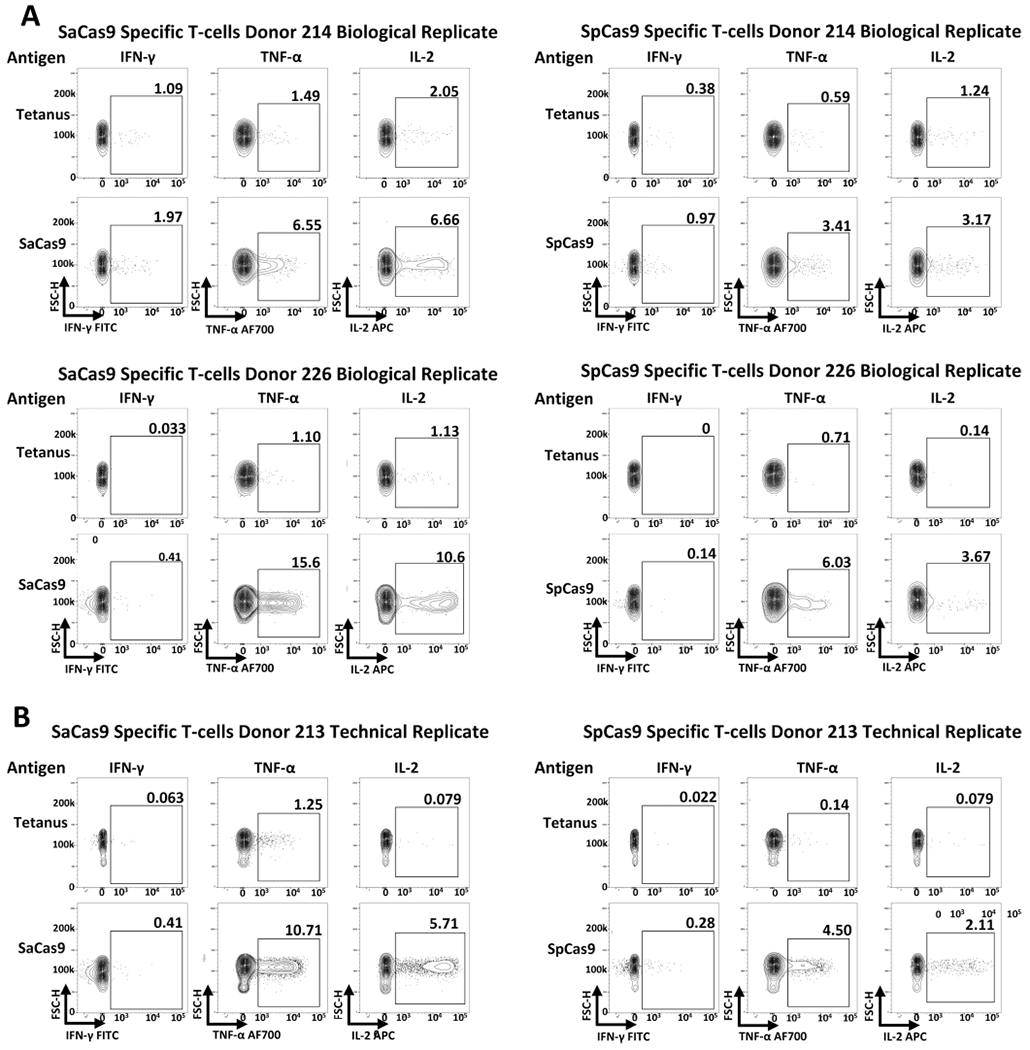
a, Results from the isolation, expansion, and restimulation of antigen-specific T cells against Cas9 from two additional PBMC donors to the donor presented in Fig. 3. b, Results from a technical replicate of expansion/restimulation of antigen-specific T cells against Cas9 from donor 213; the other replicate was presented in Fig. 3b.
Supplementary Material
Acknowledgements
M.H.P. gratefully thanks the support of the Amon Carter Foundation and the Laurie Kraus Lacob Faculty Scholar Award in Pediatric Translational Research for this work. D.P.D. thanks the Stanford Child Health Research Institute Grant and Postdoctoral Award for supporting his work. C.T.C. was supported by the CIRM Bridges to Stem Cell Research Program (CIRM TB1-01190). We thank the Binns Family Program for Cord Blood Research (Stanford University) for providing the cord blood sera used in this work. We thank the other members of the Porteus laboratory for their helpful comments and suggestions.
Footnotes
Online content
Any methods, additional references, Nature Research reporting summaries, source data, statements of data availability and associated accession codes are available at https://doi.org/10.1038/s41591-018-0326-x.
Competing interests
M.H.P. serves on the Scientific Advisory Board and holds equity in CRISPR Therapeutics, but the company had no input into this work. C.A.V., M.A.C., L.Z., N.M.B., and M.A.B. are employees of Integrated DNA Technologies.
Extended data is available for this paper at https://doi.org/10.1038/s41591-018-0326-x.
Supplementary information is available for this paper at https://doi.org/10.1038/s41591-018-0326-x .
Publisher’s note: Springer Nature remains neutral with regard to jurisdictional claims in published maps and institutional affiliations.
References
- 1.Dever DP et al. CRISPR/Cas9 β-globin gene targeting in human haematopoietic stem cells. Nature 539, 384–389 (2016). [DOI] [PMC free article] [PubMed] [Google Scholar]
- 2.Eyquem J et al. Targeting a CAR to the TRAC locus with CRISPR/Cas9 enhances tumour rejection. Nature 543, 113–117 (2017). [DOI] [PMC free article] [PubMed] [Google Scholar]
- 3.DeWitt MA et al. Selection-free genome editing of the sickle mutation in human adult hematopoietic stem/progenitor cells. Sci. Transl. Med 8, 360ra134 (2016). [DOI] [PMC free article] [PubMed] [Google Scholar]
- 4.Zuris JA et al. Cationic lipid-mediated delivery of proteins enables efficient protein-based genome editing in vitro and in vivo. Nat. Biotechnol 33, 73–80 (2015). [DOI] [PMC free article] [PubMed] [Google Scholar]
- 5.Ran FA et al. In vivo genome editing using Staphylococcus aureus Cas9. Nature 520, 186–191 (2015). [DOI] [PMC free article] [PubMed] [Google Scholar]
- 6.Yin H et al. Therapeutic genome editing by combined viral and non-viral delivery of CRISPR system components in vivo. Nat. Biotechnol 34, 328–333 (2016). [DOI] [PMC free article] [PubMed] [Google Scholar]
- 7.Jinek M et al. A programmable dual-RNA-guided DNA endonuclease in adaptive bacterial immunity. Science 337, 816–821 (2012). [DOI] [PMC free article] [PubMed] [Google Scholar]
- 8.Lowy FD Staphylococcus aureus infections. N. Engl. J. Med 339, 520–532 (1998). [DOI] [PubMed] [Google Scholar]
- 9.Roberts AL et al. Detection of group A Streptococcus in tonsils from pediatric patients reveals high rate of asymptomatic streptococcal carriage. BMC Pediatr 12, 3 (2012). [DOI] [PMC free article] [PubMed] [Google Scholar]
- 10.Cong L et al. Multiplex genome engineering using CRISPR/Cas systems. Science 339, 819–823 (2013). [DOI] [PMC free article] [PubMed] [Google Scholar]
- 11.Wang G et al. Modeling the mitochondrial cardiomyopathy of Barth syndrome with induced pluripotent stem cell and heart-on-chip technologies. Nat. Med 20, 616–623 (2014). [DOI] [PMC free article] [PubMed] [Google Scholar]
- 12.Nelson CE et al. In vivo genome editing improves muscle function in a mouse model of Duchenne muscular dystrophy. Science 351, 403–407 (2016). [DOI] [PMC free article] [PubMed] [Google Scholar]
- 13.Tabebordbar M et al. In vivo gene editing in dystrophic mouse muscle and muscle stem cells. Science 351, 407–411 (2016). [DOI] [PMC free article] [PubMed] [Google Scholar]
- 14.Suzuki K et al. In vivo genome editing via CRISPR/Cas9 mediated homology-independent targeted integration. Nature 540, 144–149 (2016). [DOI] [PMC free article] [PubMed] [Google Scholar]
- 15.Long C et al. Prevention of muscular dystrophy in mice by CRISPR/ Cas9-mediated editing of germline DNA. Science 345, 1184–1188 (2014). [DOI] [PMC free article] [PubMed] [Google Scholar]
- 16.Finn JD et al. A single administration of CRISPR/Cas9 lipid nanoparticles achieves robust and persistent in vivo genome editing. Cell Rep 22, 2227–2235 (2018). [DOI] [PubMed] [Google Scholar]
- 17.Colque-Navarro P, Jacobsson G, Andersson R, Flock J-I & Mollby R Levels of antibody against 11 Staphylococcus aureus antigens in a healthy population. Clin. Vaccine Immunol 17, 1117–1123 (2010). [DOI] [PMC free article] [PubMed] [Google Scholar]
- 18.Dryla A et al. Comparison of antibody repertoires against Staphylococcus aureus in healthy individuals and in acutely infected patients. Clin. Diagn. Lab. Immunol 12, 387–398 (2005). [DOI] [PMC free article] [PubMed] [Google Scholar]
- 19.Mortensen R et al. Adaptive immunity against Streptococcus pyogenes in adults involves increased IFN-γ and IgG3 responses compared with children. J. Immunol 195, 1657–1664 (2015). [DOI] [PubMed] [Google Scholar]
- 20.Kolata JB et al. The fall of a dogma? Unexpected high T-cell memory response to Staphylococcus aureus in humans. J. Infect. Dis 212, 830–838 (2015). [DOI] [PubMed] [Google Scholar]
- 21.Chew WL et al. A multifunctional AAV-CRISPR-Cas9 and its host response. Nat. Methods 13, 868–874 (2016). [DOI] [PMC free article] [PubMed] [Google Scholar]
- 22.Manno CS et al. Successful transduction of liver in hemophilia by AAV-Factor IX and limitations imposed by the host immune response. Nat. Med 12, 342–347 (2006). [DOI] [PubMed] [Google Scholar]
- 23.DePolo NJ et al. VSV-G pseudotyped lentiviral vector particles produced in human cells are inactivated by human serum. Mol. Ther 2, 218–222 (2000). [DOI] [PubMed] [Google Scholar]
- 24.Mingozzi F et al. CD8+ T-cell responses to adeno-associated virus capsid in humans. Nat. Med 13, 419–422 (2007). [DOI] [PubMed] [Google Scholar]
- 25.Mendell JR et al. Dystrophin immunity in Duchenne’s muscular dystrophy. N. Engl. J. Med 363, 1429–1437 (2010). [DOI] [PMC free article] [PubMed] [Google Scholar]
- 26.Wilson JM Lessons learned from the gene therapy trial for ornithine transcarbamylase deficiency. Mol. Genet. Metab 96, 151–157 (2009). [DOI] [PubMed] [Google Scholar]
- 27.Mingozzi F & High KA Immune responses to AAV vectors: overcoming barriers to successful gene therapy. Blood 122, 23–36 (2013). [DOI] [PMC free article] [PubMed] [Google Scholar]
- 28.Hewitt EW The MHC class I antigen presentation pathway: strategies for viral immune evasion. Immunology 110, 163–169 (2003). [DOI] [PMC free article] [PubMed] [Google Scholar]
- 29.Simhadri VL et al. Prevalence of pre-existing antibodies to CRISPR-associated nuclease Cas9 in the USA population. Mol. Ther. Methods Clin. Dev 10, 105–112 (2018). [DOI] [PMC free article] [PubMed] [Google Scholar]
- 30.Wang D et al. Adenovirus-mediated somatic genome editing of Pten by CRISPR/Cas9 in mouse liver in spite of Cas9-specific immune responses. Hum. Gene Ther 26, 432–442 (2015). [DOI] [PMC free article] [PubMed] [Google Scholar]
- 31.Pukelsheim F The three sigma rule. Am. Stat 48, 88–91 (1994). [Google Scholar]
- 32.Czerkinsky CC, Nilsson LA, Nygren H, Ouchterlony O & Tarkowski A A solid-phase enzyme-linked immunospot (ELISPOT) assay for enumeration of specific antibody-secreting cells. J. Immunol. Methods 65, 109–121 (1983). [DOI] [PubMed] [Google Scholar]
- 33.Lovelace P & Maecker HT Multiparameter intracellular cytokine staining. Methods Mol. Biol 699, 165–178 (2011). [DOI] [PMC free article] [PubMed] [Google Scholar]
- 34.Frentsch M et al. Direct access to CD4+ T cells specific for defined antigens according to CD154 expression. Nat. Med 11, 1118–1124 (2005). [DOI] [PubMed] [Google Scholar]
- 35.Bacher P et al. Antigen-reactive T cell enrichment for direct, high-resolution analysis of the human naive and memory Th cell repertoire. J. Immunol 190, 3967–3976 (2013). [DOI] [PubMed] [Google Scholar]
- 36.Charlesworth CT et al. Identification of pre-existing adaptive immunity to Cas9 proteins in humans. Preprint at https://www.biorxiv.org/content/early/2018/01/05/243345 (2018). [DOI] [PMC free article] [PubMed] [Google Scholar]
- 37.Wagner DL et al. High prevalence of Streptococcus pyogenes Cas9-reactive T cells within the adult human population. Nat. Med 10.1038/s41591-018-0204-6 (2018). [DOI] [PubMed] [Google Scholar]
- 38.Ford T et al. Cryopreservation-related loss of antigen-specific IFNγ producing CD4+T-cells can skew immunogenicity data in vaccine trials: lessons from a malaria vaccine trial substudy. Vaccine 35, 1898–1906 (2017). [DOI] [PMC free article] [PubMed] [Google Scholar]
- 39.Yang Y & Wilson JM Clearance of adenovirus-infected hepatocytes by MHC class I-restricted CD4+CTLs in vivo. J. Immunol 155, 2564–2570 (1995). [PubMed] [Google Scholar]
- 40.Reichelt P, Schwarz C & Donzeau M Single step protocol to purify recombinant proteins with low endotoxin contents. Protein Expr. Purif 46, 483–488 (2006). [DOI] [PubMed] [Google Scholar]
- 41.Gupta S & Maecker H Intracellular cytokine staining (ICS) on human lymphocytes or peripheral blood mononuclear cells (PBMCs). Bio-protocol 5, e1442 (2015). [DOI] [PMC free article] [PubMed] [Google Scholar]
Associated Data
This section collects any data citations, data availability statements, or supplementary materials included in this article.
Supplementary Materials
Data Availability Statement
The data supporting the findings of this study are available within the paper. Any additional data and materials that can be shared will be released via a Material Transfer Agreement.