

Abstract
Objective:
Poor sleep may increase obesity and type 2 diabetes (T2D) risk in youth. We explored whether subjective sleep duration, sleep quality, or risk for obstructive sleep apnea (OSA) are associated with glycemia, body mass index (BMI), or blood pressure (BP) in overweight/obese youth.
Methods:
Two-hundred and fourteen overweight/obese youth of 10 to 19 years of age at risk for or recently diagnosed with T2D who were screened for the Restoring Insulin Secretion (RISE) Study had a 2-hour oral glucose tolerance test (OGTT) and completed a Cleveland Adolescent Sleepiness questionnaire and a Sleep Disturbances Scale questionnaire. Independent associations between sleep variables and measures of glycemia, BMI, and BP were evaluated with regression models.
Results:
The multiethnic cohort was 67% female, 14.1 ± 2.1 years, and BMI 35.9 ± 6.5 kg/m2. Habitual sleep duration <8 hours was reported in 74%. Daytime sleepiness was reported in 51%, poor sleep quality in 26%, and 30% had high obstructive sleep apnea (OSA) risk. Daytime sleepiness was associated with higher HbA1c (0.2%, P = .02) and 2-hour glucose (13.6 mg/dL, P < .05). Sleep duration, sleep quality, and OSA risk were not associated with the evaluated outcomes. Poor sleep quality and OSA risk were associated with higher BMI (2.9 kg/m2, P = .004 and 2.83 kg/m2, P < .003, respectively).
Conclusions:
In overweight/obese youth with or at risk for T2D, daytime sleepiness was associated with higher HbA1c. In addition, poor sleep quality and OSA risk were associated with higher BMI. These findings support intervention studies aimed at improving sleep quality in obese youth.
Keywords: adolescents, children, glucose, glycemia, hemoglobin A1c, hypersomnolence, hypertension, obesity, sleep apnea, sleep duration, sleep quality, sleepiness
Over the last few decades, childhood obesity has become a major public health problem worldwide.1,2 The increase in childhood obesity is an important contributor to the increase in the prevalence of prediabetes and type 2 diabetes (T2D) in youth.3 In parallel with the obesity epidemic, there has been a significant decline in sleep duration in children and adolescents.4 Short sleep duration and poor sleep quality (eg, fragmented sleep, nonrestorative sleep, sleep-disordered breathing) have emerged as potentially modifiable lifestyle risk factors that may contribute to obesity and glucose dysregulation, thereby increasing risk for development of T2D and associated complications. Current guidelines recommend 9 to 12 hours of sleep per day in children of 6 to 12 years of age and 8 to 10 hours of sleep per day in adolescents in order to promote optimal health.5 In the 2006 Sleep in America Poll, 45% of adolescents reported habitually sleeping less than 8 hours per night.6 Several population-based studies have found a relationship between self-reported short sleep duration (<7 hours per night) and incident obesity in adolescents.7–9
Although the causal links between sleep disturbances, obesity and glucose dysregulation are not fully understood, experimental studies have improved our understanding of pathophysiologic and mechanistic pathways that underpin this association.10–12 Short-term laboratory-based experiments in young healthy adults have provided convincing evidence that sleep restriction and sleep fragmentation lead to an increase in sympathetic nervous system activity, glucose dysregulation, insulin resistance, alterations in orexigenic and anorexigenic hormones, and excess food intake, ultimately increasing the risk of obesity.12–15 Population-based longitudinal studies have also revealed a significant association between sleep duration and obesity in youth.16 However, studies examining associations of inadequate sleep with dysglycemia in youth have had mixed results.17 Moreover, associations between sleep duration or sleep quality and glycemic control in youth with prediabetes and T2D have not been established.
Another prevalent sleep disorder is obstructive sleep apnea (OSA), a treatable chronic sleep disorder characterized by recurrent episodes of complete (apnea) or partial (hypopnea) obstruction of the upper airway causing intermittent hypoxemia and hypercapnia, cortical microarousals, increased oxidative stress, inflammation, and sleep fragmentation. In obese community-dwelling children, the prevalence of clinically significant OSA, defined by an apnea-hypopnea index of ≥5 events per hour of sleep, has been estimated at 13.4%.18 Multiple studies in adults have reported a significant independent association between OSA and incident type 2 diabetes.11 However, the association between OSA and metabolic dysfunction has been less consistent in youth, with a recent study suggesting that the association is predominantly determined by adiposity rather than OSA.19
Given the important relationships between sleep and metabolic health, we explored whether self-reported sleep duration, sleep quality, or risk factors for OSA were associated with measures of dysglycemia, body mass index (BMI), or blood pressure (BP) in overweight/obese youth at risk for or with recently diagnosed T2D. We hypothesized that: (a) sleep disturbances (ie, short sleep duration, poor sleep quality, daytime sleepiness, and high risk of OSA) are more prevalent in overweight/obese youth who have T2D compared to those with normoglycemia; and (b) self-reported short sleep duration (<7 h/night), poor sleep quality, and risk for OSA are associated with dysglycemia, higher BMI, and higher BP.
1 |. RESEARCH DESIGN AND METHODS
1.1 |. Participants
This cross-sectional secondary analysis is part of the Restoring Insulin Secretion (RISE) randomized controlled trial, and includes information obtained during screening. The primary purpose of the RISE Pediatric Medication Study was to compare two pharmacological approaches in preserving or improving β-cell function in youth with impaired glucose IGT or recently diagnosed type 2 diabetes during and after therapy withdrawal. Between 2013 and 2016, we screened 236 overweight and obese youth at risk for or with recently diagnosed T2D. Inclusion criteria for performance of a 2-hour OGTT during screening were the age of 10 to 19 years, BMI ≥ 85th percentile for age and sex but <50 kg/m2, breast development ≥ Tanner stage 2 in females and testicular volume > 3 mL in boys, T2D duration < 6 months, and if on treatment with metformin for T2D, treatment duration < 6 months prior to screening. Exclusion criteria were treatment with insulin for >2 weeks at any time prior to screening, use of medications that influence insulin sensitivity except metformin in those with T2D, and uncontrolled hypertension, defined as average systolic or diastolic blood pressure > 99th percentile for age or >135/90 mmHg despite adequately prescribed antihypertensive therapy. Additional details on participant recruitment and eligibility criteria have been described,20 and information is available at the RISE website (https://rise.bsc.gwu.edu/web/rise/collaborators). Participants were recruited from the active patient populations and communities at four RISE pediatric centers: University of Colorado, Indiana University, Yale University and University of Pittsburgh. Recruitment techniques included paper and electronic advertisements, referral from colleagues, and screening from the investigators’ clinics. Prescreening of electronic and clinical medical records was used when possible. Preliminary prescreening was performed to identify youth at high risk for the development of or recently diagnosed with T2D. High risk was defined as: (a) impaired fasting glucose or impaired glucose tolerance, (b) overweight or obesity (BMI ≥ 85th percentile), (c) first-degree relative with T2D, (d) sedentary lifestyle, (e) presence of the components of the metabolic syndrome (low HDL cholesterol, high triglycerides, hypertension), (f) member of a high-risk racial and/or ethnic group, (g) teenage women with a history of gestational diabetes or who had a baby weighing ≥9 pounds at birth, (h) offspring of mothers who had any form of diabetes while pregnant, (i) adolescent girls with polycystic ovary syndrome (PCOS), and/or (j) a recent diagnosis of T2D. If youth met one or more of these criteria, they were asked to participate in the screening visit and then assessed for inclusion in the study.
The study was approved by the Institutional Review Boards of all participating centers, and written informed consent/assent was obtained prior to initiation of any study-related activities (ClinicalTrials.gov Identifier: NCT01779375).
1.2 |. Data collection
Individuals who met the initial study inclusion/exclusion criteria were screened with a 75-g oral glucose tolerance test (OGTT) and HbA1c (n = 236). All participants completed validated sleep questionnaires, described in detail below. Complete data for HbA1c, fasting and OGTT 2-hour plasma glucose concentrations and sleep questionnaires were available for 214 youth. Sex and race/ethnicity were self-reported. Anthropometric measurements were performed on the day of screening with participants wearing light clothing, and without shoes. Height was measured in a fully vertical position with heels together using a calibrated stadiometer. Weight was measured using a calibrated electronic scale, zeroed before each measurement. Percentile distributions of BMI were derived from US representative populations.21 Pubertal assessment was performed using Tanner staging by a pediatric endocrinology practitioner.
Blood pressure was measured twice with an automated blood pressure machine with appropriately sized arm cuffs; readings were obtained with the subject in a seated position with feet touching the floor or otherwise supported after at least 5 minutes rest in a quiet room, with outer clothing removed and sleeves rolled to the shoulder. The cuff was placed at heart level, and two measurements were taken 5 minutes apart. Only the second measurement was taken as the reported value. Hypertension was defined as SBP or DBP ≥95th percentile for height, age, and sex22 and used to describe the study population.
1.3 |. Glucose measures
A standardized OGTT was performed, delivering 1.75 g glucose/kg body weight (maximum 75 g) with the glucose consumed within 5 minutes, as previously described.20 For the purposes of the current analyses, glycemia was categorized based on the American Diabetes Association criteria.23 Normal glucose tolerance was defined as fasting plasma glucose <100 mg/dL, 2-hour plasma glucose <140 mg/dL, and HbA1c <5.7%; prediabetes as fasting plasma glucose 100–125 mg/dL or 2-hour plasma glucose between 140–199 mg/dL, or HbA1c between 5.7–6.4%; T2D as fasting plasma glucose ≥126 mg/dL or 2-hour plasma glucose ≥200 mg/dL, or HbA1c >6.5%. Additionally, participants taking metformin at the time of the screening visit for a prior diagnosis of T2D were classified as having T2D. At screening, all blood samples were immediately placed on ice, separated by centrifugation, and frozen at −80°C prior to shipment to the central biochemistry laboratory at University of Washington (Northwest Lipid Metabolism and Diabetes Research Laboratories, University of Washington, Seattle, Washington). Glucose was measured by the glucose hexokinase method using Roche reagent on a Roche c501 autoanalyzer. The method inter-assay coefficient of variations on quality control samples with low, medium, and high glucose were 2.0%, 1.7%, and 1.3%, respectively. HbA1c was measured by ion-exchange high performance chromatography on a TOSOH G8 analyzer (TOSOH Biosciences, Inc., South San Francisco, California). The inter-assay coefficient of variations on low and high quality control samples were 1.9% and 1.0%, respectively.
1.4 |. Sleep questionnaires
Subjective sleep duration and quality were assessed using the validated 26-item Sleep Disturbances Scale questionnaire (minimum score 26, maximum score 130), self-administered by the parents of pediatric participants with assistance from the child as needed, using age-appropriate discretion.24 Poor sleep quality was defined as a score of ≥52.24 Sleep duration was assessed using the following question from this questionnaire: “In the past 6 months, how many hours of sleep does your child get on most nights?” The possible responses to this question were <5, 5–7, 7–8, 8–9, and 9–11 hours of sleep. Risk of sleep apnea was assessed based on three questions from the Sleep Disturbances Questionnaire (question 13: “I have difficulty in breathing during the night”; question 14: “I gasp for breath or am unable to breathe during sleep”; question 15: “I snore”). These questions can be rated on a scale of 1 (never) to 5 (daily). The minimum score from these three questions is 3 (responses of “never” to all three questions) and the maximum score is 15 (responses of “daily” to all three questions); a score ≥ 7 was considered high risk of sleep apnea.24 Daytime sleepiness was assessed using the validated 16-item Cleveland Adolescent Sleepiness questionnaire (minimum score 16, maximum score 80) self-administered by the pediatric participant; a score of ≥33 was considered daytime sleepiness.25
1.5 |. Statistical analysis
Data were stored and managed centrally, and analyses were performed according to a prespecified analytic plan. The outcomes of interest were glucose measures (HbA1c, fasting and 2-hour OGTT plasma glucose), BMI, and BP (SBP and DBP). All outcomes were analyzed as continuous variables. Continuous variables were expressed as mean ± SD for normally distributed data; categorical variables were summarized as percentages (%). Unadjusted group comparisons were performed using ANOVA for normally distributed continuous variables and Pearson χ2 test was used to compare categorical variables. Associations between sleep variables and glucose measures and BP were examined with multiple linear regression models. Analyses were adjusted for age, sex, race/ethnicity (as a categorical variable including White, Black, Hispanic [any race], Asian, or Mixed/other), Tanner stage, BMI, and metformin use as a categorical (ever/current vs never) variable. Analysis of covariance (ANCOVA) models in which the outcome of interest was BMI were adjusted for age, sex, race/ethnicity, Tanner stage, and metformin use.
Missing data was low with all participants included having values available for the glucose measures, BMI and BP. The Sleep Disturbances Scale (duration n = 7; quality n = 7; apnea risk n = 2) was incomplete for seven participants and the Cleveland Adolescent Sleepiness Questionnaire was missing for two participants (daytime sleepiness). These missing data were assumed to be missing at random. All statistical calculations were performed without correction for multiple testing due to the exploratory nature of the analyses. Analyses were performed using SAS 9.4 (SAS institute, Cary, North Carolina).
2 |. RESULTS
Of the 236 overweight/obese youth screened for the RISE study, 214 had complete HbA1c, fasting and OGTT 2-hour plasma glucose concentrations, and validated sleep questionnaire data. The 22 participants without complete data available were either identified as being not eligible during the screening visit and did not continue with the OGTT or opted out of completing the sleep questionnaires. Table 1 summarizes the participant characteristics. Percentages of participants in the three glycemic categories were: 17.8% (n = 38) with normal glucose tolerance, 54.7% (n = 117) with prediabetes, and 27.6% (n = 59) with T2D. The cohort’s age was 14.1 ± 2.1 years (mean ± SD), BMI was 35.9 ± 6.5 kg/m2, 66.8% were female, and 62.6% were Tanner stage V. There were no significant differences in sex, race, BMI, or Tanner stage between the three glycemic category groups; however, those in the “prediabetes” category were slightly younger than those with normoglycemia or T2D (P = .037). The group with T2D had higher systolic and diastolic BP (P = .017 and P = .012, respectively). As expected, youth with prediabetes and recently diagnosed T2D had worse glycemia based on the three laboratory measures, despite the fact that 45.8% of those with T2D were being treated with metformin at the time of evaluation.
TABLE 1.
Participant characteristics based on glycemic categories
| All N = 214 | Normal N = 38 (17.8%) | Prediabetes N = 117 (54.7%) | Diabetes N = 59 (27.6%) | P valuea | |
|---|---|---|---|---|---|
| Age (years) | 14.1 ± 2.1 | 14.3 ± 2.2 | 13.8 ± 2.1 | 14.7 ± 2.0 | .037 |
| Female, | 143 (66.8%) | 24 (63.2%) | 75 (64.1%) | 44 (74.6%) | .329 |
| Tanner stage V | 134 (62.6%) | 26 (68.4%) | 66 (56.4%) | 42 (71.2%) | .115 |
| Race/ethnicity | .281 | ||||
| White | 56 (26.2%) | 11 (28.9%) | 27 (23.1%) | 18 (30.5%) | |
| Black | 55 (25.7%) | 10 (26.3%) | 31 (26.5%) | 14 (23.7%) | |
| Hispanic | 71 (33.2%) | 8 (21.1%) | 44 (37.6%) | 19 (32.2%) | |
| Asian | 3 (1.4%) | 0 (0.0%) | 3 (2.6%) | 0 (0.0%) | |
| Mixed/other | 29 (13.6%) | 9 (23.7%) | 12 (10.3%) | 8 (13.6%) | |
| Weight (kg) | 97.7 ± 24.5 | 94.4 ± 20.4 | 96.8 ± 23.4 | 101.6 ± 28.5 | .313 |
| BMI (kg/m2) | 35.9 ± 6.5 | 34.4 ± 5.5 | 35.9 ± 6.6 | 36.6 ± 6.8 | .269 |
| BMI percentile | 98.5 ± 1.8 | 98.2 ± 1.9 | 98.6 ± 1.9 | 98.4 ± 1.7 | .602 |
| BMI z score | 2.3 ± 0.4 | 2.3 ± 0.4 | 2.4 ± 0.4 | 2.3 ± 0.4 | .353 |
| Systolic BP (mmHg) | 118.2 ± 9.2 | 117.7 ± 8.6 | 116.9 ± 9.2 | 121.1 ± 9.2 | .017 |
| Diastolic BP (mmHg) | 68.7 ± 7.7 | 68.5 ± 6.3 | 67.5 ± 7.9 | 71.2 ± 7.9 | .012 |
| Hypertensionb | 49 (22.9%) | 5 (13.2%) | 22 (18.8%) | 22 (37.3%) | .006 |
| HbA1c (%) | 5.7 ± 0.6 | 5.2 ± 0.4 | 5.5 ± 0.4 | 6.2 ± 0.7 | <.001 |
| Fasting glucose (mg/dL) | 103.3 ± 15.8 | 91.7 ± 4.7 | 100.8 ± 8.1 | 115.5 ± 22.7 | <.001 |
| 2-hour glucose (mg/dL) | 158.6 ± 50.4 | 112.9 ± 14.3 | 146.4 ± 25.2 | 212.2 ± 57.7 | <.001 |
| Metformin use at screening | 27 (12.7%) | n/a | n/a | 27 (45.8%) | n/a |
Data are mean ± SD or n (%).
Unadjusted three group comparisons (normal, prediabetes, and diabetes) using ANOVA for continuous variables and Pearson χ2 for categorical variables.
Hypertension was defined as SBP or DBP ≥ 95th percentile for height, age, and sex.
Table 2 summarizes subjective measures of sleep duration, sleep quality, and daytime sleepiness, along with the calculated score indicating risk of OSA. There were no significant differences in sleep characteristics between the three glycemic categories. Habitual sleep duration of 8 or less hours was reported by 57.5% of the cohort, with one-fourth (25.6%) reporting sleeping less than 7 hours per night. One-half of the cohort had excessive daytime sleepiness and 26.1% reported poor sleep quality. High risk for OSA was reported in 29.7% of the youth.
TABLE 2.
Subjective sleep habits and estimated sleep apnea risk based on glycemic categories
| All | Normal | Prediabetes | Diabetes | P valuea | |
|---|---|---|---|---|---|
| Sleep duration | .295 | ||||
| <5 hr | 6 (2.9%) | 0 (0.0%) | 4 (3.5%) | 2 (3.6%) | |
| 5–7 hr | 47 (22.7%) | 9 (24.3%) | 21 (18.4%) | 17 (30.4%) | |
| 7–8 hr | 66 (31.9%) | 12 (32.4%) | 42 (36.8%) | 12 (21.4%) | |
| 8–9 hr | 59 (28.5%) | 13 (35.1%) | 32 (28.1%) | 14 (25.0%) | |
| 9–11 hr | 29 (14.0%) | 3 (8.1%) | 15 (13.2%) | 11 (19.6%) | |
| Poor sleep quality | 54 (26.1%) | 8 (21.6%) | 29 (25.4%) | 17 (30.4%) | .626 |
| Daytime sleepiness | 107 (50.5%) | 18 (47.4%) | 57 (48.7%) | 32 (56.1%) | .600 |
| High obstructive sleep apnea risk | 63 (29.7%) | 9 (24.3%) | 40 (34.2%) | 14 (24.1%) | .287 |
Data are n (%).
Unadjusted three group comparisons (normal, prediabetes, and diabetes) using Pearson χ2.
2.1 |. Association between sleep measures and outcomes
Multiple linear regression models were used to explore associations of reported sleep duration, sleep quality, daytime sleepiness, and OSA risk with the outcomes of interest: HbA1c, fasting plasma glucose, OGTT 2-hoursour plasma glucose, SBP, DBP, and BMI (Figure 1). In a fully adjusted model, sleep duration (either as a continuous variable or as categories of <7, 7–8, 8–9, and 9–11 hours) was not associated with any of the outcomes. After full adjustment for covariates, poor sleep quality was associated with a 2.90 kg/m2 higher BMI (95% CI [0.96, 4.85]; P = .003). High OSA risk was also associated with a 2.83 kg/m2 higher BMI (95% CI [0.99, 4.67]; P = .0026). Presence of daytime sleepiness was associated with higher OGTT 2-hour plasma glucose (13.6 mg/dL; 95% CI [0.11, 27.15]; P = .049) and with higher HbA1c (0.2%; 95% CI [0.031, 0.35]; P = .020).
FIGURE 1.
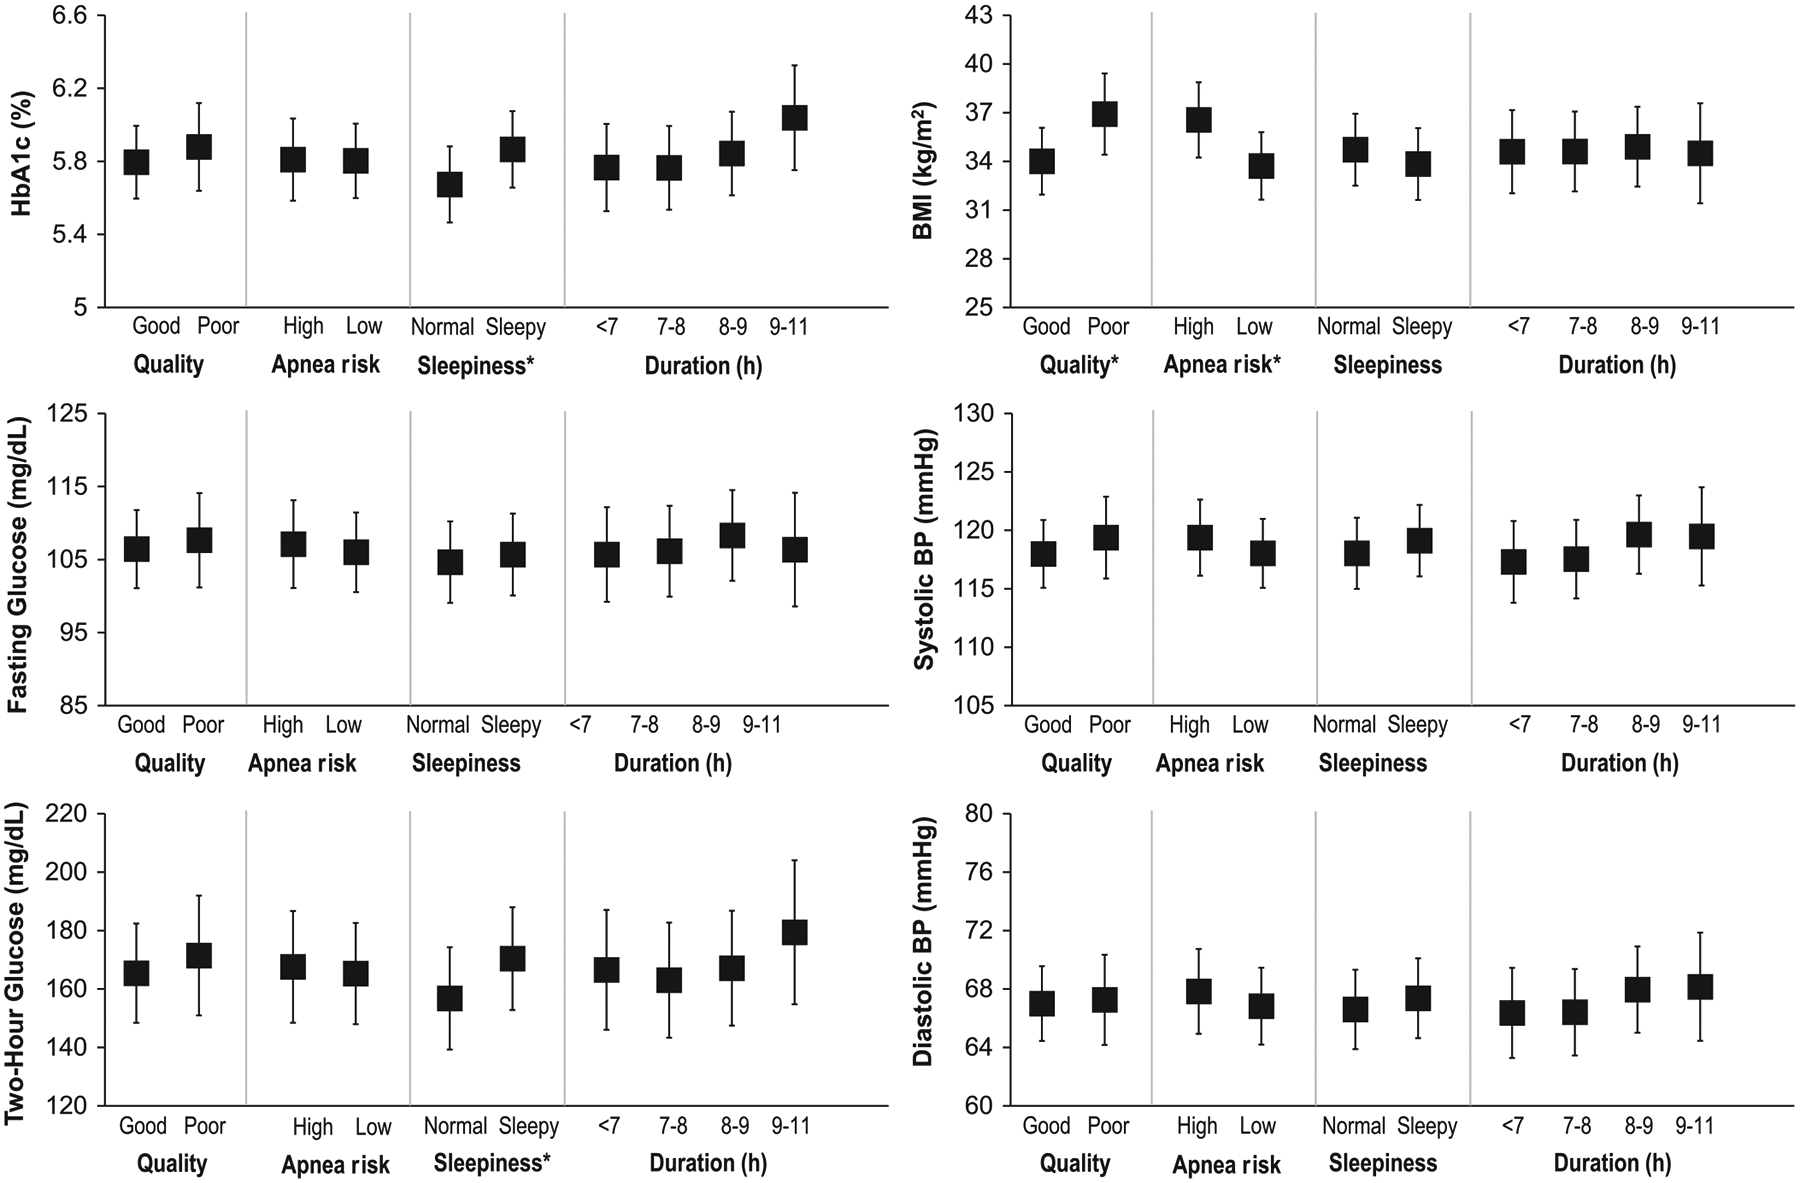
Association between self-reported sleep measures and outcomes. Adjusted means from analysis of covariance (ANCOVA) models. Data shown are adjusted means and 95% confidence intervals. Quality is sleep quality, sleepiness is daytime sleepiness, and duration is sleep duration. Models adjusted for age, sex, race/ethnicity, metformin use, and Tanner stage. HbA1c, fasting glucose, 2-hour glucose, and blood pressure models were also adjusted for BMI. *ANCOVA P < .05
3 |. DISCUSSION
In this cross-sectional analysis of a large, ethnically diverse cohort of overweight and obese youth at risk for T2D or recently diagnosed with T2D, we found a high prevalence of sleep disturbances. Poor sleep quality and symptoms of OSA were each associated with higher BMI. Although sleep duration was not associated with glycemia, the presence of daytime sleepiness was associated with higher OGTT 2-hour plasma glucose and with higher HbA1c. Our analysis raises the possibility that sleep quality and daytime sleepiness, rather than sleep duration per se, are more relevant to greater weight and dysglycemia in youth.
Despite the current recommendation of 8 to 10 hours of sleep per night in adolescents,5,26 habitual sleep duration <8 hours and < 7 hours per night was reported in 58% and 26% of this cohort, respectively. This is consistent with the high prevalence of reported sleep deprivation in adolescents living in developed countries.6,27 Short-term laboratory-based experiments in young healthy adults have provided convincing evidence that sleep restriction and sleep fragmentation leads to glucose dysregulation, alterations in orexigenic and anorexigenic hormones, and excess food intake, ultimately increasing the risk of obesity.12–15 In one study of healthy adolescents, one night of sleep fragmentation, using acoustic stimuli to suppress slow wave sleep, did not lead to a significant alteration in insulin sensitivity.28 However, one night of abnormal sleep may not be sufficient to induce significant alterations in insulin sensitivity or glucose measures in healthy adolescents. In another study of healthy normal-weight adolescent boys, three consecutive nights of sleep restriction (4 hours per night) was associated with a significant decrease in insulin sensitivity, as measured by the homeostatic model of insulin resistance, but not with a positive energy balance.29,30 In contrast, in another study of healthy adolescents, experimental sleep restriction, (6.5 hours in bed Monday-Friday) vs healthy sleep duration (10 hours in bed) resulted in higher glycemic index, glycemic load, intake of desserts and sweets, and a trend toward ingestion of more calories and carbohydrates.31 The changes in insulin sensitivity in adolescents may also be more subtle than in adults. Indeed, in a study that employed a more robust assessment of insulin sensitivity by using a hyperglycemic clamp, habitual self-reported short sleep duration of less than 8 hours in adolescents was associated with decreased insulin sensitivity.32 More studies are needed to assess whether overweight and obese youth react differently to sleep restriction or fragmentation than healthy youth.
From a pathophysiologic standpoint, sleep restriction and fragmentation can increase sympathetic nervous system activity, leading to a decrease in insulin sensitivity.10 Activation of the hypothalamic-pituitary-adrenal axis with resulting elevation of evening cortisol can also decrease insulin sensitivity.11,12 However, it is important to note that studies of sleep manipulation have been short in duration and performed predominantly in healthy young adults. The long-term impact of sleep manipulation on glycemic measures in overweight and obese youth remains unknown.
At a population level, a mounting body of observational evidence has revealed a significant association between sleep duration and obesity in youth. Three longitudinal, population-based cohorts of adolescents have examined the relationship between self-reported short sleep duration (< 6 or 7 hours per night) and incident obesity in adolescents.7–9 A meta-analysis of these studies suggested that chronic short sleep duration is independently associated with incident overweight and obesity (RR 1.30; 95% CI 1.11 to 1.53; P < .002).16 On the other hand, studies examining the role of inadequate sleep on glucose homeostasis in children have led to mixed results. Out of 21 studies, 15 reported no association between sleep duration and various measures of glucose homeostasis after adjusting for adiposity.17 Unfortunately, most of these studies did not have an objective measure of sleep duration or quality. In contrast, the few studies that reported a positive association between sleep duration and hyperglycemia used objective measures of sleep duration (ie, wrist actigraphy monitoring or polysomnography).
Our study has noteworthy strengths. We enrolled an ethnically diverse cohort of overweight and obese youth at risk for T2D or with recently diagnosed T2D, representing the full spectrum of glucose tolerance (normal, prediabetes, and T2D), thereby increasing the generalizability of our findings. All participants underwent a standardized 2-hour OGTT as well as HbA1c measurements on the same day the sleep questionnaires were completed. Plasma glucose concentrations and HbA1c values were determined uniformly in a centralized laboratory, and we used validated sleep questionnaires across all centers. Our study also has several important limitations. Due to its cross-sectional design, the direction of causality cannot be ascertained. For example, obesity may induce poor sleep quality either independently or by increasing the risk of OSA; conversely, OSA may induce or aggravate behaviors or metabolic dysfunction that predispose to obesity. It is therefore difficult to ascertain whether obesity was the cause of poor sleep quality or poor sleep quality led to obesity. Additionally, the results presented are exploratory secondary analyses and therefore should be taken with caution setting up the context for future research. Another important weakness is the lack of objective measures of sleep (duration, latency and OSA) and not ascertaining differences in sleep duration on week days and weekends nor usual bed time. This is relevant since an inconsistent sleep schedule has been described as a risk factor for obesity and metabolic dysregulation in children.33 Children also experience dramatic changes in both sleep duration and pattern as they go through adolescence, and the timing of these changes may vary significantly between boys and girls. As such, adjusting for age, sex, and Tanner stage may be insufficient to fully account for the confounding effects of these covariates on sleep and metabolism. Lastly, as a secondary analyses to a study of youth at risk for or with T2D, the study sample largely includes youth with obesity (BMI > 30 or BMI percentile ≥95th percentile) and thus we have not captured the full spectrum of BMI.
In summary, sleep disturbances, such as short sleep duration, poor sleep quality, daytime sleepiness, and increased risk for OSA, are highly prevalent in overweight and obese youth. Poor sleep quality and risk for OSA are associated with higher BMI, and daytime sleepiness is associated with poorer glycemia. Further research assessing whether interventions designed to improve sleep duration and sleep quality can improve metabolic health in overweight and obese youth is required.
Supplementary Material
ACKNOWLEDGEMENTS
The RISE Consortium thanks the RISE Data and Safety Monitoring Board and Barbara Linder, the National Institute of Diabetes and Digestive and Kidney Diseases Program Official for RISE (Rockville, Maryland), for support and guidance. The Consortium also thanks the participants who, by volunteering, are furthering the ability to reduce the burden of diabetes.
RISE is supported by grants from the National Institutes of Health (U01-DK-094406, U01-DK-094430, U01-DK-094431, U01-DK-094438, U01-DK-094467, P30-DK-017047, P30-DK-020595, P30-DK-045735, P30-DK-097512, UL1-TR-000430, UL1-TR-001082, UL1-TR-001108, UL1-TR-001855, UL1-TR-001857, UL1-TR-001858, UL1-TR-001863), the Department of Veterans Affairs, and Kaiser Permanente Southern California. In addition, the National Heart Lung Blood Institute provided support for the RISE Sleep Ancillary study to B.M. (R01HL119161). Additional financial and material support from the American Diabetes Association, Allergan, Apollo Endosurgery, Abbott Laboratories, and Novo Nordisk was received. S.A.A. and S.E.K. serve as paid consultants on advisory boards for Novo Nordisk. S.A.A. is a participant in a Novo Nordisk-sponsored clinical trial. T.A.B. has received research support from Allergan and Apollo Endosurgery. K.J.M. holds an investigator-initiated research grant from Novo Nordisk. No other potential conflicts of interest relevant to this article were reported.
Abbreviations:
- BMI
body mass index
- BP
blood pressure
- OGTT
oral glucose tolerance test
- OSA
obstructive sleep apnea
- RISE
Resorting Insulin Secretion Study
- T2D
type 2 diabetes
Footnotes
CONFLICTS OF INTEREST
The authors declare no potential conflict of interest.
SUPPORTING INFORMATION
Additional supporting information may be found online in the Supporting Information section at the end of this article.
REFERENCES
- 1.Risk Factor Collaboration NCD. Worldwide trends in body-mass index, underweight, overweight, and obesity from 1975 to 2016: a pooled analysis of 2416 population-based measurement studies in 128.9 million children, adolescents, and adults. Lancet. 2017;390: 2627–2642. [DOI] [PMC free article] [PubMed] [Google Scholar]
- 2.Ogden CL, Carroll MD, Lawman HG, et al. Trends in obesity prevalence among children and adolescents in the United States, 1988–1994 through 2013–2014. JAMA. 2016;315:2292–2299. [DOI] [PMC free article] [PubMed] [Google Scholar]
- 3.Mayer-Davis EJ, Lawrence JM, Dabelea D, et al. SEARCH for diabetes in youth study. Incidence trends of type 1 and type 2 diabetes among youths, 2002–2012. N Engl J Med. 2017;376:1419–1429. [DOI] [PMC free article] [PubMed] [Google Scholar]
- 4.Matricciani L, Olds T, Petkov J. In search of lost sleep: secular trends in the sleep time of school-aged children and adolescents. Sleep Med Rev. 2012;16:203–211. [DOI] [PubMed] [Google Scholar]
- 5.Paruthi S, Brooks LJ, D’Ambrosio C, et al. Recommended amount of sleep for pediatric populations: a consensus statement of the American Academy of sleep medicine. J Clin Sleep Med. 2016;12:785–786. [DOI] [PMC free article] [PubMed] [Google Scholar]
- 6.National Sleep Foundation 2006. Sleep in America poll: teens and sleep. http://sleepfoundation.org/sites/default/files/2006_summary_of_findings.pdf. Accessed May 22, 2019.
- 7.Suglia SF, Kara S, Robinson WR. Sleep duration and obesity among adolescents transitioning to adulthood: do results differ by sex? J Pediatr. 2014;165:750–754. [DOI] [PMC free article] [PubMed] [Google Scholar]
- 8.Roberts RE, Duong HT. Is there an association between adolescent sleep restriction and obesity. J Psychosom Res. 2015;79:651–656. [DOI] [PMC free article] [PubMed] [Google Scholar]
- 9.Krueger PM, Reither EN, Peppard PE, Burger AE, Hale L. Cumulative exposure to short sleep and body mass outcomes: a prospective study. J Sleep Res. 2015;24:629–638. [DOI] [PMC free article] [PubMed] [Google Scholar]
- 10.Broussard JL, Ehrmann DA, Van Cauter E, Tasali E, Brady MJ. Impaired insulin signaling in human adipocytes after experimental sleep restriction: a randomized, crossover study. Ann Intern Med. 2012;157:549–557. [DOI] [PMC free article] [PubMed] [Google Scholar]
- 11.Reutrakul S, Mokhlesi B. Obstructive sleep apnea and diabetes: a state of the art review. Chest. 2017;152:1070–1086. [DOI] [PMC free article] [PubMed] [Google Scholar]
- 12.Reutrakul S, Van Cauter E. Sleep influences on obesity, insulin resistance, and risk of type 2 diabetes. Metabolism. 2018;84:56–66. [DOI] [PubMed] [Google Scholar]
- 13.Herzog N, Jauch-Chara K, Hyzy F, et al. Selective slow wave sleep but not rapid eye movement sleep suppression impairs morning glucose tolerance in healthy men. Psychoneuroendocrinology. 2013;38: 2075–2082. [DOI] [PubMed] [Google Scholar]
- 14.Tasali E, Leproult R, Ehrmann DA, Van Cauter E. Slow-wave sleep and the risk of type 2 diabetes in humans. Proc Natl Acad Sci USA. 2008; 105:1044–1049. [DOI] [PMC free article] [PubMed] [Google Scholar]
- 15.Stamatakis KA, Punjabi NM. Effects of sleep fragmentation on glucose metabolism in normal subjects. Chest. 2010;137:95–101. [DOI] [PMC free article] [PubMed] [Google Scholar]
- 16.Miller MA, Kruisbrink M, Wallace J, Ji C, Cappuccio FP. Sleep duration and incidence of obesity in infants, children, and adolescents: a systematic review and meta-analysis of prospective studies. Sleep. 2018; 41:1–19. [DOI] [PubMed] [Google Scholar]
- 17.Dutil C, Chaput JP. Inadequate sleep as a contributor to type 2 diabetes in children and adolescents. Nutr Diabetes. 2017;7:e266. [DOI] [PMC free article] [PubMed] [Google Scholar]
- 18.Alonso-Alvarez ML, Cordero-Guevara JA, Teran-Santos J, et al. Obstructive sleep apnea in obese community-dwelling children: the NANOS study. Sleep. 2014;37:943–949. [DOI] [PMC free article] [PubMed] [Google Scholar]
- 19.Koren D, Gozal D, Philby MF, Bhattacharjee R, Kheirandish-Gozal L. Impact of obstructive sleep apnoea on insulin resistance in nonobese and obese children. Eur Respir J. 2016;47:1152–1161. [DOI] [PubMed] [Google Scholar]
- 20.RISE Consortium. Restoring insulin secretion (RISE): design of studies of beta-cell preservation in prediabetes and early type 2 diabetes across the life span. Diabetes Care. 2014;37:780–788. [DOI] [PMC free article] [PubMed] [Google Scholar]
- 21.Cole TJ, Bellizzi MC, Flegal KM, Dietz WH. Establishing a standard definition for child overweight and obesity worldwide: international survey. BMJ. 2000;320:1240–1243. [DOI] [PMC free article] [PubMed] [Google Scholar]
- 22.National High Blood Pressure Education Program Working Group on High Blood Pressure in C, Adolescents. The fourth report on the diagnosis, evaluation, and treatment of high blood pressure in children and adolescents. Pediatrics. 2004;114:555–576. [PubMed] [Google Scholar]
- 23.American Diabetes Association. Standards of medical care in diabetes--2014. Diabetes Care. 2014;37(Suppl 1):S14–S80. [DOI] [PubMed] [Google Scholar]
- 24.Bruni O, Ottaviano S, Guidetti V, et al. The sleep disturbance scale for children (SDSC). Construction and validation of an instrument to evaluate sleep disturbances in childhood and adolescence. J Sleep Res. 1996;5:251–261. [DOI] [PubMed] [Google Scholar]
- 25.Spilsbury JC, Drotar D, Rosen CL, Redline S. The Cleveland adolescent sleepiness questionnaire: a new measure to assess excessive daytime sleepiness in adolescents. J Clin Sleep Med. 2007;3:603–612. [PMC free article] [PubMed] [Google Scholar]
- 26.Paruthi S, Brooks LJ, D’Ambrosio C, et al. Consensus statement of the American Academy of sleep medicine on the recommended amount of sleep for healthy children: methodology and discussion. J Clin Sleep Med. 2016;12:1549–1561. [DOI] [PMC free article] [PubMed] [Google Scholar]
- 27.Buxton OM, Chang AM, Spilsbury JC, Bos T, Emsellem H, Knutson KL. Sleep in the modern family: protective family routines for child and adolescent sleep. Sleep Health. 2015;1:15–27. [DOI] [PMC free article] [PubMed] [Google Scholar]
- 28.Shaw ND, McHill AW, Schiavon M, et al. Effect of slow wave sleep disruption on metabolic parameters in adolescents. Sleep. 2016;39: 1591–1599. [DOI] [PMC free article] [PubMed] [Google Scholar]
- 29.Klingenberg L, Chaput JP, Holmback U, et al. Acute sleep restriction reduces insulin sensitivity in adolescent boys. Sleep. 2013;36:1085–1090. [DOI] [PMC free article] [PubMed] [Google Scholar]
- 30.Klingenberg L, Chaput JP, Holmback U, Jennum P, Astrup A, Sjodin A. Sleep restriction is not associated with a positive energy balance in adolescent boys. Am J Clin Nutr. 2012;96:240–248. [DOI] [PubMed] [Google Scholar]
- 31.Beebe DW, Simon S, Summer S, Hemmer S, Strotman D, Dolan LM. Dietary intake following experimentally restricted sleep in adolescents. Sleep. 2013;36:827–834. [DOI] [PMC free article] [PubMed] [Google Scholar]
- 32.De Bernardi Rodrigues AM, da Silva Cde C, Vasques AC, et al. Brazilian metabolic syndrome study I. Association of sleep deprivation with reduction in insulin sensitivity as assessed by the hyperglycemic clamp technique in adolescents. JAMA Pediatr. 2016;170:487–494. [DOI] [PubMed] [Google Scholar]
- 33.Spruyt K, Molfese DL, Gozal D. Sleep duration, sleep regularity, body weight, and metabolic homeostasis in school-aged children. Pediatrics. 2011;127:e345–e352. [DOI] [PMC free article] [PubMed] [Google Scholar]
Associated Data
This section collects any data citations, data availability statements, or supplementary materials included in this article.