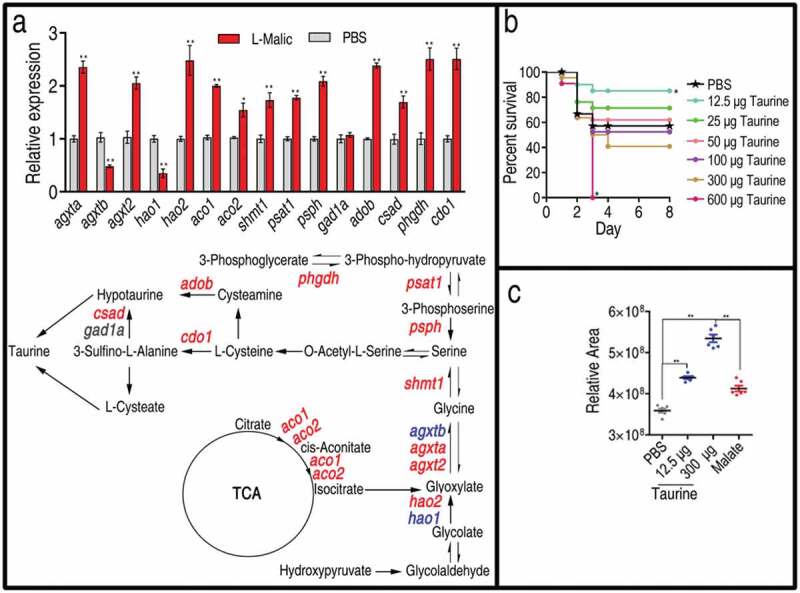
Figure 5.

Taurine biosynthesis pathway and ability against bacterial infection. (a) qRT-PCR for expression of taurine biosynthesis pathway genes. Upper, relative gene expression; Lower, shown in the metabolic pathway. Twenty-five zebrafish spleens were collected in each group. Five were pooled as a sample, yielding five biological repeats for analysis of gene expression. Samples were collected in 24 h after the injection of malate for 3 days. qRT-PCR was based on the key genes of taurine biosynthesis pathways in D. rerio. Red represents increase, blue represents decrease, and black represents unchanged in the malate-reprogramming group. (b) Percent survival of zebrafish in the presence of the indicated doses of taurine, 21 zebrafish each group. (c) Relative concentrations of taurine in the presence of PBS, 12.5 μg of taurine, 300 μg of taurine, and 70 μg of malate, five zebrafish each group. Taurine is measured by GC-MS analysis. Results are displayed as mean ± SEM, and significant differences are identified (*p < 0.05, **p < 0.01) as determined by two-tailed Student’s t-test (a and c) and Log-rank (Mantel-Cox) test, Gehan-Breslow-Wilcoxon test, and Tarone-Ware test (b).
