

Abstract
The CXCR4/CXCL12 axis plays an important role in cell locomotion and metastasis in many cancers. In this study, we hypothesized that the CXCR4/CXCL12 axis promotes migration and invasion of canine hemangiosarcoma (HSA) cells. Transcriptomic analysis across 12 HSA cell lines and 58 HSA whole tumour tissues identified heterogeneous expression of CXCR4 and CXCL12, which was associated with cell movement. In vitro, CXCL12 promoted calcium mobilization, cell migration, and invasion that were directly proportional to surface expression of CXCR4; furthermore, these responses proved sensitive to the CXCR4 antagonist, AMD3100, in HSA cell lines. These results indicate that CXCL12 potentiates migration and invasion of canine HSA cells through CXCR4 signaling. The direct relationship between these responses in HSA cells suggests that the CXCR4/CXCL12 axis contributes to HSA progression.
Keywords: canine hemangiosarcoma, CXCR4, CXCL12, invasion, migration
Introduction
Communication between tumour cells and their microenvironment plays an important role in tumour progression.1 Complex networks of chemokines and chemokine receptors are constitutively expressed by tumour cells and their microenvironment,2,3 and interactions between these chemokines and their corresponding receptors regulate tumour growth, survival, invasion and metastasis; control angiogenesis; and protect against the host immune system, thus contributing to malignant tumour dissemination.2,4
CXCL12, also known as stromal cell-derived factor 1 (SDF-1), modulates proliferation, migration, and survival of hematopoietic stem/progenitor cells (HSPCs); it also plays a role in cell morphogenesis and development, and in tumour progression.5,6 CXCR4, the major receptor for CXCL12, is perhaps the most common chemokine receptor expressed on tumour cells.7 CXCL12 is expressed constitutively in lymph nodes, lung, liver, spleen, heart, and bone marrow, which are common sites of metastasis.8 CXCR4-expressing tumour cells home toward CXCL12-enriched niches, and CXCL12/CXCR4 signaling is regarded as a key regulator of migration and metastasis in breast, colon, and brain cancers.6,9,10
Despite extensive studies of CXCL12 and CXCR4 in human cancers, information about the potential role of these molecules in dog cancers is limited.11 In particular, the CXCR4/CXCL12 axis has never been examined in canine hemangiosarcoma (HSA). HSA is a common, highly invasive, metastatic, and lethal cancer.12–16 Accumulating evidence suggests that canine HSA, as well as human angiosarcoma, arise from hematopoietic progenitor cells (HPCs) that retain multipotency and can give rise to tumours with inflammatory, angiogenic, or adipogenic properties.17–20 The potential hematopoietic origin of this disease suggests that the CXCR4/CXCL12 axis could be a key regulator in promoting migration and invasion of canine HSA cells regionally and in metastasis to distant organs.
Here, we examined the role of CXCR4/CXCL12 in migration and invasion using canine whole tumour tissue samples and HSA cell lines. Our findings indicate that the binding of CXCL12 to CXCR4 potentiates migration and invasion of canine HSA cells.
Materials and Methods
Genome-wide gene expression profiling
Microarray data from 23 HSA tissue samples and 12 cell lines, as well as next generation RNA sequencing (RNA-seq) data from 47 tissue samples, were analyzed as described,19 and are accessible from the Gene Expression Omnibus (accession number, GSE53219). Microarray and RNA-seq data were stratified into quartiles according to CXCR4 and CXCL12 expression. Biological function and canonical pathways between groups were defined by Ingenuity Pathway Analysis (IPA) software v8.6 (Ingenuity Systems, Redwood City, CA, USA).
Cell culture
HSA cells were cultured as described.17,19,21 The four HSA cell lines used for this study included two derived from presumptive primary lesions in liver (SPAR) and spleen (DD1),22 and two derived from presumptive metastatic lesions in lung (JLU) 23 and brain (Emma).21 We selected these lines based on their properties for growth in culture, previous characterization, and representation of the spectrum of CXCR4 expression. Three cell lines (DD1, JLU, and Emma) were in culture for > 20 passages before use in this study; yet, their behaviour in culture is stable. SPAR cells were passaged between 7 and 20 times before use. Cells were maintained at 37 °C in a 5% CO2 incubator and medium was replaced every 2 to 3 days.
Steady-state gene expression
Analysis of steady state levels of gene expression was done using quantitative real time reverse transcriptase polymerase chain reaction (qRT-PCR). Briefly, RNA was isolated and purified from cells using RNeasy® Mini kit (Qiagen, Valencia, CA, USA), and concentrations were measured using a NanoDrop ND-1000 UV-vis spectrophotometer (NanoDrop Technologies, Wilmington, DE, USA). The QuantiTect® Reverse Transcription Kit (Qiagen) was used to eliminate genomic DNA and for the reverse transcription reactions according to the manufacturer’s instructions. qRT-PCR was done using a LightCycler® 96 (Roche Applied Science, Indianapolis, IN, USA) with FastStart SYBR Green Master Mix (Roche Applied Science). Samples where we omitted the template and where we added RNA that was not reverse transcribed were used as negative controls. Relative mRNA values were expressed as delta-Ct values normalized to GAPDH. Primer pairs used for these experiments were forward 5’-GAGCGGTTACCATGGAAGAG-3’ and reverse 5’ -CGGTTGAAGTGAGCATTTTCC-3’ for CXCR4; and forward 5’ -TCTTCGAGAGCCACATTGC-3’ and reverse 5’-TTCAGTCTTGCCACGATCTG-3’ for CXCL12. The forward 5’-GGAGTCCACTGGCGTCTTCAC-3’ and reverse 5’ -GAGGCATTGCTGATGATCTTGAGG-3’ primers for GAPDH have been described previously.23
Flow cytometry
Cells were harvested with 0.25% trypsin-EDTA and washed with staining buffer consisting of phosphate-buffered saline (PBS) and 2% fetal bovine serum (FBS). Fc receptors were blocked with normal mouse serum for 20 min on ice; then, cells were stained with 0.125 μg of anti-CXCR4-APC antibody (clone 12G5, eBioscience, San Diego, CA, USA) per 106 cells for 20 min on ice in the dark and then washed three times with staining buffer. Anti-mouse IgG2a, kappa-APC (clone eBM2a, eBioscience) was used as an isotype control. For each sample, we evaluated 50,000 live events using FACSCalibur (635 nm, 661/16), BD Accuri C6 (640 nm, 675/25) or LSRII H4710 (640 nm, 670/30) flow cytometers (BD Biosciences, San Jose, CA, USA). The instrumentation did not affect the distribution of the data. Flow cytometry data were analyzed using FlowJo v.10.0.7 (Tree Star Inc., Ashland, OR, USA). Each experiment was performed at least three times for each cell line.
Cytosolic free calcium mobilization
Calcium mobilization was examined using flow cytometry as described.23 Cells were stimulated with 200 ng/mL of recombinant human/rhesus macaque/feline CXCL12/SDF-1 alpha (R&D Systems, Minneapolis, MN, USA) in the presence or absence of CXCR4 blockade using 500 nM of CXCR4 antagonist AMD3100 (Sigma, Saint Louis, MO, USA) for 15 minutes on ice. Ionomycin was used as a positive control for calcium mobilization in each cell line.
Cell migration
Cell migration was measured using wound healing scratch assays in two formats. For one, we used commercial culture inserts (Ibidi, Martinsried, Germany); for the other, we created a scratch in HSA cell monolayers grown in conventional culture plates using 200-μL micropipette tips. For each experiment, cell migration was determined using duplicate tests, and every experiment was repeated three or more times. For the experiments using culture inserts (SPAR and Emma cells), 16,100 to 16,800 cells per well were used; for the experiments where scratch wounds were created with tips in 24-well plates (DD1 and JLU cells), 80,000 to 100,000 cells per well were used. Cell numbers and the format of the experiments were determined by extensive assay optimization, taking into consideration the speed at which the cells achieved confluence and their ability to remain attached to conventional tissue culture plates under conditions of low FBS (2.5%). After incubating the cells for 6 hr in HSA medium containing 2.5% FBS (“2.5% HSA medium”), we removed the culture inserts (SPAR and Emma cells), or made cross-shaped scratch wounds with tips in the center of the wells (DD1 and JLU cells). Cells were washed with PBS twice, and then incubated with or without the addition of CXCL12 (100 ng/mL) in 2.5% HSA medium for 24 hr. For inhibition of CXCR4, cells were pretreated with 200 nM of AMD3100. After 24 hr, we measured the percentage of the area filled with cells for experiments using inserts, and we measured the number of cells that had migrated to the center of the scratch wound area for the tip scratch experiments. Images were analyzed using Adobe Photoshop CS6 (Adobe Systems Inc., San Jose, CA, USA) and Image-pro plus (version 5.1; Media Cybernetics Inc., Rockville, MD, USA).
Cellular invasion
Cellular invasion was measured using modified Boyden chamber assays with Cultrex® 24-well basement membrane extract (BME) kits, according to the manufacturer’s instructions (Trevigen Inc., Gaithersburg, MD, USA). Cell numbers and the percent of BME used for each cell line in these assays also were determined by extensive assay optimization, taking under consideration the cells’ baseline capability to invade BME, as well as their doubling time to avoid overcrowding. Cells were incubated overnight in 2.5% HSA medium. Membranes (8-μm-pore) were coated with 0.5X BME (for SPAR cells) and 0.2X BME (for DD1, JLU and Emma cells). After harvesting with 0.25% trypsin-EDTA, cells were washed with PBS containing 5% bovine serum albumin and resuspended at a density of 106 cells/mL in 2.5% HSA medium. Top chambers of the plate were loaded with 50,000 to 80,000 cells in 100 μL of 2.5% HSA medium, and 500 μL of 2.5% HSA medium with or without CXCL12 (100 ng/mL) was added to the bottom chambers. For experiments testing inhibition, cells were treated with 100 nM of AMD3100 for 15 min and then loaded into the top chamber. After 24 hr, the top and bottom chambers were washed with wash buffer and incubated with Calcein-AM (0.83 μg) in dissociation buffer (500 μL) for 1 hr at 37 °C in a 5% CO2 incubator. Fluorescence emission was read at 485-nm excitation and at 535-nm emission using a Wallac 1420 Victor2 multilabel counter (PerkinElmer™, Waltham, MA, USA). For standard curves, serial dilutions from 0 to 40,000 cells were incubated with Calcein-AM (0.83 μg) in dissociation buffer (500 μL) for 1 hr at 37 °C in a 5% CO2 incubator and read at 485-nm excitation and at 535-nm emission. The number of invading cells for each experimental condition was calculated from the standard curve for the same experiment. Invasion assays were repeated at least three times in duplicate for each cell line.
Statistical analysis
BH multiple testing correction was used for the IPA analysis. Statistics were generated using Microsoft Excel (Microsoft Corporation, Redmond, WA, USA) and GraphPad Prism 6 (GraphPad Software Inc., San Diego, CA, USA). Pearson’s r2 value was used to determine the linear correlation between variables. To determine the appropriate statistical tests for migration and invasion, data were first tested for normality. The replicate samples for basal migration and invasion passed tests for normality, and were evaluated statistically using the Student’s t-test. Continuous variables were expressed as the mean ± standard error of the mean (SEM). P < 0.05 was used as the threshold for statistical significance.
Results
Gene sets associated with cellular movement and with inflammatory and hematological environments are enriched in HSAs with high expression of CXCR4 and CXCL12
We examined expression of CXCR4 and CXCL12 in HSA cell lines (n =12) and tissues (n = 23) using data from gene expression microarrays (Fig. 1A), and in 47 HSA tissue samples using data from next generation RNA-seq (Fig. 1B). There were 12 overlapping HSA tissue samples in the two platforms, showing almost perfect correlation (r2 = 0.97; Supplemental Fig. 1). The expression of both transcripts was higher in whole tissue samples than in isolated HSA cell lines (Fig. 1).
Figure 1.
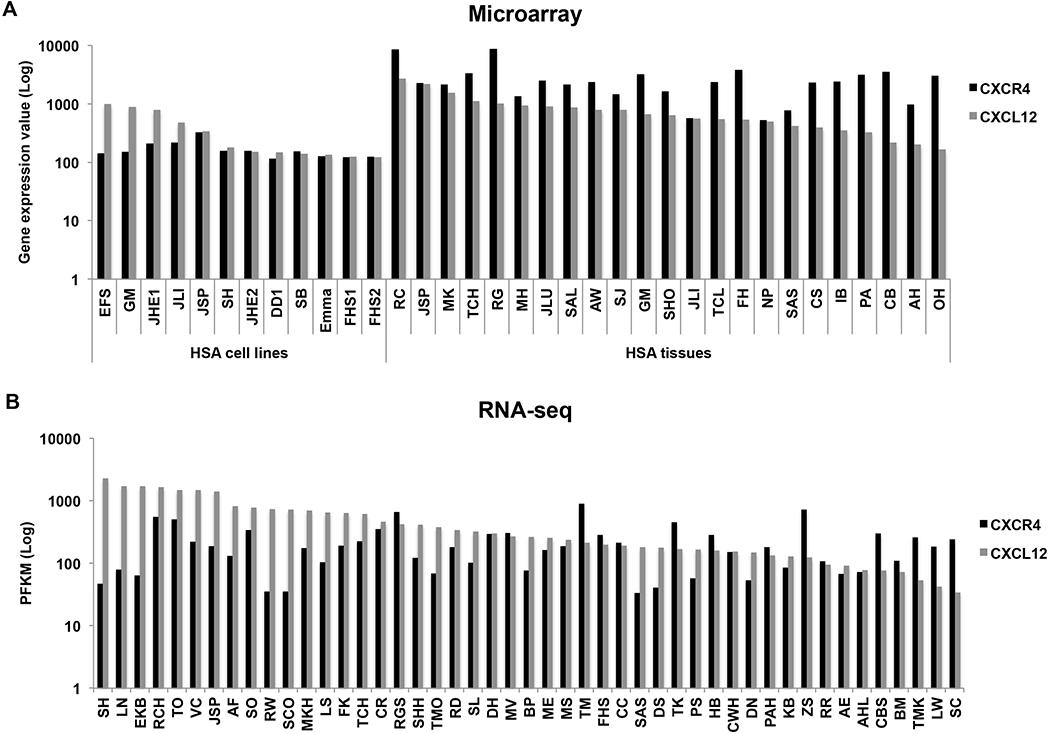
Gene expression of CXCR4 and its ligand, CXL12, is variable in canine HSA. (A) Bar graph shows relative levels of CXCR4 and CXCL12 expression in HSA cell lines (n = 12) and tumour tissues (n = 23) from microarray data (Agilent Platform). Values are derived from quantile-normalized data using GeneChip-Robust Multichip Averaging. (B) Bar graph shows PFKM values for CXCR4 and CXCL12 transcripts from RNA-seq data of HSA tissues (n = 47).
We used the IPA platform to determine the functional significance of elevated CXCR4 and CXCL12 expression. Samples were ranked based on expression of each gene to identify functions that were significantly associated with the upper and lower quartiles. Differentially expressed genes are listed in Supplemental Table 1. The data show that CXCR4 was consistently upregulated along with pro-inflammatory and pro-angiogenic genes, including IL8, PTSG2, PLAU, and PLAUR. Furthermore, CXCR4 expression was ~ 6-fold higher in inflammatory tumours and ~ 2-fold higher in angiogenic tumours than in adipogenic tumours.
Supplemental Fig. 2 and Supplemental Tables 2–7 show that genes associated with activation of hematological system development and function, cellular movement, and immune response were enriched in the samples with high CXCR4 and with high CXCL12 expression. These findings were consistent when we analyzed cell lines and tumour samples in either the microarray or RNA-seq platform.
Expression of surface CXCR4 in canine HSA cells is dynamic
We selected four canine HSA cell lines (SPAR, DD1, JLU, and Emma) to confirm and extend our genome-wide gene expression results and to assess their functional significance. CXCR4 mRNA was abundant in SPAR and DD1 cells, but it was expressed at very low levels in JLU and Emma cells (Fig. 2A). There was an inverse correlation between CXCR4 and CXCL12 gene expression in SPAR, DD1, and JLU (Fig. 2A). Most of the cells in the SPAR and DD1 cell lines showed detectable CXCR4 expression (Fig. 2B), but when we quantified only “CXCR4-bright” cells (i.e., those showing an increase of more than five times the threshold defined by the isotype controls and outlined by the boxed regions in Fig. 2B), it was apparent that there was significant variability in the expression of this antigen (Fig. 2C). This suggests that CXCR4 expression is subject to dynamic regulation under conventional conditions of cell culture. Nevertheless, there was a direct correlation in the rank order of CXCR4 gene and protein expression (Supplemental Fig. 3).
Figure 2.

CXCR4 expression is dynamic in HSA cell lines. (A) mRNA expression of CXCR4 and CXCL12 was confirmed in four HSA cell lines using qRT-PCR. Ct Values were normalized to GAPDH in each cell line. (B) Two-dimensional dot plots showing side scatter vs. isotype control (top) and side scatter vs. CXCR4 expression (bottom) for the experiments with the highest proportion of CXCR4-bright cells for each cell line. (C) Percent ± SEM of CXCR4-bright cells (as determined by flow cytometry) compared to isotype control from at least three independent experiments for each cell line. The range of CXCR4-bright cells for the cell lines was 4.18 - 78.42 % for SPAR; 0.27 - 8.83% for DD1; 0.1 - 0.41% for JLU; and 0 - 0.35% for Emma.
Calcium mobilization induced by CXCL12 in HSA cells is dependent on CXCR4 expression
The CXCR4/CXCL12 axis activates calcium-dependent signals in other cell systems.24 To determine the functional conservation of this pathway in canine HSA cells, we measured changes of intracellular calcium levels induced by CXCL12. Our results indicate that the calcium response of HSA cells to CXCL12 was directly proportional to CXCR4 expression. Specifically, SPAR cells showed robust and reproducible calcium mobilization in response to CXCL12 (Fig. 3A). DD1 cells also showed a reproducible response; the magnitude of the calcium transients measured in these cells was smaller, but their apparent duration was longer than that observed in SPAR cells (Fig. 3B). In contrast, calcium responses were virtually undetectable in JLU and Emma cells (Figs. 3C and 3D). We used AMD3100 (a CXCR4 antagonist) to assess the effect of CXCR4 blockade on calcium signaling. Fig. 4 shows that pre-treatment with AMD3100 inhibited CXCL12-mediated calcium mobilization in SPAR cells, supporting the interpretation that CXCL12 can initiate signal transduction in HSA cells through CXCR4.
Figure 3.

CXCL12 induces intracellular calcium (Ca2+) mobilization in HSA cell lines. Calcium mobilisation in Indo-1-labeled cells was measured in real time using flow cytometry. Panels represent calcium mobilization in response to CXCL12 and positive control, ionomycin (inset) in HSA cell lines (A) SPAR, (B) DD1, (C) JLU and (D) Emma. Arrows indicate time of CXCL12 addition.
Figure 4.

Intracellular calcium (Ca2+) mobilization induced by CXCL12 is inhibited by AMD3100. Calcium mobilization was measured in real time in SPAR cells as described in Figure 3A, with or without pre-incubation of cells with the CXCR4 inhibitor AMD3100. Arrow indicates time of CXCL12 addition.
CXCL12 stimulates HSA cell migration and invasion through CXCR4
The genome-wide data showed a consistent, significant, and independent association between CXCR4 and CXCL12 expression and cellular movement and trafficking (Supplemental Fig. 2). Thus, we examined this relationship in cultured HSA cells using two-dimensional migration (scratch wound healing) and three-dimensional invasion (Boyden chamber) assays. Predictably, all of the HSA cells showed the capacity to close scratch wounds and to invade into basement membranes under basal conditions (Figs. 5 and 6). The maximal response to CXCL12 observed among the four cell lines occurred in SPAR cells, which showed approximately 2-fold increases in two-dimensional migration and three-dimensional invasion. Both responses were inhibited by AMD3100. CXCL12-stimulated DD1 cells also showed a significant increase in migration (60% increase over basal conditions) and invasion (40% increase over basal conditions), which were completely reversed by AMD3100. Neither migration nor invasion was significantly increased in JLU cells in the presence of CXCL12, which is consistent with the absence of a calcium response in these cells. Intriguingly, Emma cells showed a small but significant increase in three-dimensional invasion in response to CXCL12, which was partially inhibited by AMD3100. Taken together, our data show that CXCL12 promotes HSA cell migration and invasion through CXCR4.
Figure 5.

CXCR4 increases 2-dimensional migration of SPAR HSA cells. Migration of SPAR cells was evaluated as described in Materials and Methods. Photomicrographs show representative examples of migration into the scratch wound by untreated SPAR cells, SPAR cells cultured with CXCL12, and SPAR cells cultured with CXCL12 in the presence of AMD3100. Left: scratch wounds at the beginning of the experiment (time = 0 hr). Right: scratch wounds at 24 hr. (Magnification, x40)
Figure 6.

CXCL12 induces migration and invasion of HSA cells. (A and B) Two-dimensional migration of HSA cells was measured using wound healing scratch assays and (C) invasion of HSA cells was measured using Boyden chamber assays. For migration, cells were pre-incubated with or without AMD3100 and then treated with CXCL12. Bar graphs indicate (A) the mean percent of scratch area filled by cells ± SEM or (B) the mean number of cells migrating into the scratch area ± SEM after 24 hours from at least three independent experiments for each cell line. (C) For invasion, cells were loaded in the upper chambers with or without AMD3100. CXCL12 was added to the lower wells as indicated. Bar graphs indicate the mean percent ± SEM of cells invading into the lower chamber after 24 hours from at least three independent experiments for each cell line. Statistically significant values are indicated by asterisks (* = P < 0.05; ** = P < 0.01).
Discussion
In this study, we investigated how signaling by CXCR4/CXCL12 could influence progression of canine HSA. Transcriptomic profiling and canonical pathway analyses revealed that cellular movement and inflammation were associated with higher levels of CXCR4 and CXCL12 expression in canine HSA cell lines and tumour samples. Stimulation of HSA cells with CXCL12 induced intracellular calcium mobilization, cell migration, and invasion. These responses were proportional to the expression of CXCR4 and were inhibited by the CXCR4 antagonist, AMD3100, indicating that differences in CXCR4 expression might contribute to the development of the tumour niche and to the diverse and unpredictable metastatic patterns of canine HSA.
Overall, our data support the prevailing notion that signaling through CXCR4/CXCL12 mediates tumour cell migration and invasion, potentially creating a favorable environment for metastasis.6–9 For HSA in particular, the mechanisms that mediate CXCL12/CXCR4-dependent migration and invasion can be inferred from a careful review of the literature.17–23,25–27 Specifically, canine HSAs can be classified according to their angiogenic, inflammatory, and adipogenic potential; these phenotypes, which may be peculiar to the HSA cell of origin appear to be conserved in humans.17,20 Inflammatory and angiogenic canine HSA tumours showed an upregulation of CXCR4 compared to adipogenic tumours, and consistent with this, HSA cell lines with higher levels of CXCR4 expression showed upregulation of genes encoding interleukin-8 (IL-8), cyclooxygenase-2, urokinase-like plasminogen activator, and the urokinase receptor (Supplemental Table 1). These inflammatory and angiogenic signatures represent unique characteristics that appear to influence HSA progenitor cell survival and biological behaviour.17,19,23,26 Considering the proposed bone marrow origin of HSA,18 it is possible that HSA cells displaying CXCR4 on their surface represent a progenitor cell population that is maintained by CXCL12-abundant reticular cells in this niche.27,28 The potential to identify a comparable population of drug-resistant HSA progenitor cells using surface CSF-1R as a marker was recently reported,25 suggesting that the inflammatory subtype might be the primordial stage of differentiation for these cells. This possibility also is consistent with the notion that inflammatory HSA progenitor cells might contribute to metastasis not only by migrating to CXCL12-rich microenvironments, but also by promoting immunoediting and angiogenesis.29,30
Nevertheless, recent studies indicate that some features of tumour heterogeneity cannot be attributed to differentiation and/or multipotency of the progenitor or cancer stem cell populations, and we believe this holds true for canine HSA.31,32 Thus, in addition to the cell intrinsic features mentioned above, our data suggest that the microenvironment contributes to CXCR4 expression in HSA. Specifically, the transcript levels for both CXCR4 and CXCL12 were higher in HSA tissues than in cultured HSA cell lines. We previously showed a similar relationship for PDFGRβ, which was attributable to expression of this protein by HSA cells as well as by cells in the microenvironment.19 Thus, it is possible that stromal and inflammatory cells in the microenvironment express CXCR4, although we cannot completely exclude the possibility that in the appropriate tissue context, HSA cells also upregulate expression of this chemokine receptor. A relationship between CXCR4 and IL-8 production and signaling has also been documented in pancreatic cancer and glioma, where CXCR4 signals upregulate IL-8 production, and both chemokines collaborate to promote cell migration, invasion, and angiogenesis. 33,34 We previously showed that IL-8 does not alter proliferation and survival of HSA cells in vitro, but IL-8 produced by the tumour cells is necessary to support tumour cell engraftment and survival in vivo.23 Thus, the positive correlation between CXCR4 and IL-8 suggests that CXCR4-expressing cells might be responsible for creation of the HSA tumour niche.
The capacity of tumour cells to migrate and invade is necessary to overcome anatomical tissue boundaries in the process of metastasis. Our data show that CXCL12 induces intracellular calcium mobilization, migration and invasion of HSA cells, and that these responses are mediated by CXCR4. Several mechanisms can link this calcium signaling to increased HSA cell migration and invasion. One is through the activation of calmodulin-dependent myosin light-chain kinase, with its consequent increase in cellular contractility,35 as well as activation of calpain and calcineurin, which lead to cleavage and activation of focal adhesion kinase (FAK), integrins and paxillin.36–38 These events cause disassembly of cellular adhesions with retraction at the rear of the cell, potentially increasing the cellular capacity for migration and invasion.39 Another possible mechanism is through the activation of small Rho GTPases. We found that high levels of CXCL12 expression in HSA tissue samples were positively associated with increased expression of the small Rho GTPase, Rac2. Previous work has documented crosstalk between canonical calcium-dependent signaling pathways and Rho GTPases that regulate cell polarization and actin polymerization.40–44 A third possible mechanism is by destabilization of PTEN. We showed previously that the C-terminal domain of PTEN is frequently mutated in canine HSA;45 thus, a pre-existing attenuation in the interactions between p27, which is a downstream effector of PTEN, and Rho GTPases could make HSA cells extremely responsive to signaling through CXCR4.46,47
For the most part, the observed responses to CXCL12 were proportional to CXCR4 expression and inhibited by AMD3100. However, at least one of the HSA cell lines (Emma) showed virtually no expression of CXCR4 protein, did not activate calcium signaling in response to CXCL12, but did show a significant, AMD3100-refractory increase in CXCL12-mediated invasion. This could be explained by relatively high expression of CXCR7 in Emma cells (KS Im et al, unpublished), which is an alternative receptor for CXCL12 that does not activate calcium signaling,48 but has been shown to promote migration and invasion of glioma and hepatocellular carcinoma cells.49,50 Yet, the function of CXCR7 remains incompletely understood and its potential role in cancer metastasis is controversial.51 Future work to characterize the function of CXCR7 in canine HSA cells will inform its potential role in cancer metastasis.
In summary, we have shown that CXCR4 signaling promotes migration and invasion of canine HSA cells. The expression of CXCR4 on HSA progenitors might allow these cells to migrate and invade into CXCL12-rich microenvironments, accelerating the metastatic process. Together these critical functions of CXCR4, along with the availability of AMD3100, which is a well tolerated, FDA-approved CXCR4 inhibitor, could make targeting of CXCR4 an attractive option for studying tumour progression and therapy in HSA.
Supplementary Material
Supplemental Table 3. Biological functions and diseases according to CXCR4 gene expression in canine hemangiosarcoma tissues (microarray).
Supplemental Table 2. Biological functions and diseases according to CXCR4 gene expression in canine hemangiosarcoma cell lines (microarray).
Supplemental Table 1. Differentially expressed genes between upper and lower quartiles of CXCR4 or CXCL12 expression.
Supplemental Table 6. Biological functions and diseases according to CXCL12 gene expression in canine hemangiosarcoma tissues (microarray).
Supplemental Table 5. Biological functions and diseases according to CXCL12 gene expression in canine hemangiosarcoma cell lines (microarray).
Supplemental Table 4. Biological functions and diseases according to CXCR4 gene expression in canine hemangiosarcoma tissues (RNA-seq).
Supplemental Table 7. Biological functions and diseases according to CXCL12 gene expression in canine hemangiosarcoma tissues (RNA-seq).
Supplemental Figure 1. Correlation between Agilent Microarray data (X-axis) and RNA-seq data (Y-axis) for (A) CXCR4 and (B) CXCL12 in twelve overlapping HSA tissue samples.
Supplemental Figure 2. IPA analysis for biological functions related to groups with high expression of (A) CXCR4 and (B) CXCL12. Horizontal bar graphs show canonical pathways that were significantly correlated with differential gene expression between high and low groups in HSA cells and tissues. Descending rank order from each panel was based on their respective BH-P value.
Supplemental Figure 3. Correlation between mRNA and surface protein expression of CXCR4 in four HSA cell lines. The value of surface protein expression is from the mean percent of CXCR4 bright cells from at least three experiments for each cell line.
Acknowledgments:
The authors thank Dr. Erin Dickerson for experimental advice and helpful discussions, Mitzi Lewellen for editorial assistance, Paul Champoux and Nisha Shah for technical assistance with flow cytometry experiments, Dr. Aaron Sarver for advice in handling and managing bioinformatic data, Dr. Douglas Thamm for review of the manuscript, the Minnesota Supercomputing Institute for computational resources, and the University of Minnesota Genomic Center for assistance with implementation of genome-wide technologies.
Source of Funding:
The authors disclose receipt of the following financial support for the research and/or authorship of this article: grant D13CA-400 from Morris Animal Foundation (JHK), grant 1759 from the AKC Canine Health Foundation (JFM), grant D10CA-501 from the Golden Retriever Foundation and Morris Animal Foundation (JFM, MB, and KLT), grant 1889G from the Golden Retriever Foundation and the AKC Canine Health Foundation (JFM, MB, and KLT), grant DM06CO-003 from the National Canine Cancer Foundation (JFM), and a Translational Sarcoma Research Award from the Masonic Cancer Center, University of Minnesota and the Children’s Cancer Research Fund (JFM). The NIH Comprehensive Cancer Center Support Grant to the Masonic Cancer Center (P30 CA077598) provided support for bioinformatics, genomics, and flow cytometry services. The authors also gratefully acknowledge support from donors to the Animal Cancer Care and Research Program of the University of Minnesota that helped support this project.
Footnotes
Conflict of Interest
The authors declare that they have no conflicts of interest with respect to their authorship or the publication of this article.
References
- 1.Hanahan D and Weinberg RA. The hallmarks of cancer. Cell. 2000; 100(1): 57–70. [DOI] [PubMed] [Google Scholar]
- 2.Balkwill F Chemokine biology in cancer. Semin Immunol. 2003; 15(1): 49–55. [DOI] [PubMed] [Google Scholar]
- 3.Sun X, Cheng G, Hao M, Zheng J, Zhou X, Zhang J,et al. . CXCL12 / CXCR4 / CXCR7 chemokine axis and cancer progression. Cancer Metastasis Rev. 2010; 29(4): 709–722. [DOI] [PMC free article] [PubMed] [Google Scholar]
- 4.Kruizinga RC, Bestebroer J, Berghuis P, de Haas CJ, Links TP, de Vries EG, et al. Role of chemokines and their receptors in cancer. Curr Pharm Des. 2009; 15(29): 3396–3416. [DOI] [PubMed] [Google Scholar]
- 5.Ratajczak MZ, Serwin K and Schneider G. Innate immunity derived factors as external modulators of the CXCL12-CXCR4 axis and their role in stem cell homing and mobilization. Theranostics. 2013; 3(1): 3–10. [DOI] [PMC free article] [PubMed] [Google Scholar]
- 6.Lee BC, Lee TH, Avraham S and Avraham HK. Involvement of the chemokine receptor CXCR4 and its ligand stromal cell-derived factor lalpha in breast cancer cell migration through human brain microvascular endothelial cells. Mol Cancer Res. 2004; 2(6): 327–338. [PubMed] [Google Scholar]
- 7.Cancer Balkwill F. and the chemokine network. Nat Rev Cancer. 2004; 4(7): 540–550. [DOI] [PubMed] [Google Scholar]
- 8.Burger JA and Kipps TJ. CXCR4: a key receptor in the crosstalk between tumor cells and their microenvironment. Blood. 2006; 107(5): 1761–1767. [DOI] [PubMed] [Google Scholar]
- 9.Brand S, Dambacher J, Beigel F, Olszak T, Diebold J, Otte JM, et al. CXCR4 and CXCL12 are inversely expressed in colorectal cancer cells and modulate cancer cell migration, invasion and MMP-9 activation. Exp Cell Res. 2005; 310(1): 117–130. [DOI] [PubMed] [Google Scholar]
- 10.Ehtesham M, Winston JA, Kabos P and Thompson RC. CXCR4 expression mediates glioma cell invasiveness. Oncogene. 2006; 25(19): 2801–2806. [DOI] [PubMed] [Google Scholar]
- 11.Fan TM, Barger AM, Fredrickson RL, Fitzsimmons D and Garrett LD. Investigating CXCR4 expression in canine appendicular osteosarcoma. J Vet Intern Med. 2008; 22(3): 602–608. [DOI] [PubMed] [Google Scholar]
- 12.Brown NO, Patnaik AK and MacEwen EG. Canine hemangiosarcoma: retrospective analysis of 104 cases. J Am Vet Med Assoc. 1985; 186(1): 56–8. [PubMed] [Google Scholar]
- 13.Clifford CA, Mackin AJ and Henry CJ. Treatment of canine hemangiosarcoma: 2000 and beyond. J Vet Intern Med. 2000; 14(5): 479–485. [DOI] [PubMed] [Google Scholar]
- 14.Helfand SC. Canine hemangiosarcoma: a tumor of contemporary interest. Cancer Ther. 2008; 6: 457–462. [Google Scholar]
- 15.Oksanen A Haemangiosarcoma in dogs. J Comp Pathol. 1978; 88(4): 585–595. [DOI] [PubMed] [Google Scholar]
- 16.Schultheiss PC. A retrospective study of visceral and nonvisceral hemangiosarcoma and hemangiomas in domestic animals. J Vet Diagn Invest. 2004; 16(6): 522–526. [DOI] [PubMed] [Google Scholar]
- 17.Gorden BH, Kim JH, Sarver AL, Frantz AM, Breen M, Lindblad-Toh K, et al. Identification of three molecular and functional subtypes in canine hemangiosarcoma through gene expression profiling and progenitor cell characterization. Am J Pathol. 2014; 184(4): 985–995. [DOI] [PMC free article] [PubMed] [Google Scholar]
- 18.Lamerato-Kozicki AR, Helm KM, Jubala CM, Cutter GC and Modiano JF. Canine hemangiosarcoma originates from hematopoietic precursors with potential for endothelial differentiation. Exp Hematol. 2006; 34(7): 870–878. [DOI] [PubMed] [Google Scholar]
- 19.Tamburini BA, Phang TL, Fosmire SP, Scott MC, Trapp SC, Duckett MM, et al. Gene expression profiling identifies inflammation and angiogenesis as distinguishing features of canine hemangiosarcoma. BMC Cancer. 2010; 10: 619–634. [DOI] [PMC free article] [PubMed] [Google Scholar]
- 20.Liu L, Kakiuchi-Kiyota S, Arnold LL, Johansson SL, Wert D and Cohen SM. Pathogenesis of hyman hemangiosarcomas and hemangiomas. Hum Pathol. 2013; 44: 2302–2311. [DOI] [PubMed] [Google Scholar]
- 21.Tamburini BA, Trapp S, Phang TL, Schappa JT, Hunter LE and Modiano JF. Gene expression profiles of sporadic canine hemangiosarcoma are uniquely associated with breed. PLoS One. 2009; 4(5): e5549. [DOI] [PMC free article] [PubMed] [Google Scholar]
- 22.Fosmire SP, Dickerson EB, Scott AM, Bianco SR, Pettengill MJ, Meylemans H, et al. Canine malignant hemangiosarcoma as a model of primitive angiogenic endothelium. Lab Invest. 2004; 84(5): 562–572. [DOI] [PubMed] [Google Scholar]
- 23.Kim JH, Frantz AM, Anderson KL, Graef AJ, Scott MC, Robinson S, et al. Interleukin-8 promotes canine hemangiosarcoma growth by regulating the tumor microenvironment. Exp Cell Res. 2014; 323(1): 155–164. [DOI] [PMC free article] [PubMed] [Google Scholar]
- 24.Zlotnik A New insights on the role of CXCR4 in cancer metastasis. J Pathol. 2008; 215(3): 211–213. [DOI] [PubMed] [Google Scholar]
- 25.Gorden BH, Saha J, Khammanivong A, Schwartz GK and Dickerson EB. Lysosomal drug sequestration as a mechanism of drug resistance in vascular sarcoma cells marked by high CSF-1R expression. Vasc Cell. 2014; 6: 20–33. [DOI] [PMC free article] [PubMed] [Google Scholar]
- 26.Schappa JT, Frantz AM, Gorden BH, Dickerson EB, Vallera DA and Modiano JF. Hemangiosarcoma and its cancer stem cell subpopulation are effectively killed by a toxin targeted through epidermal growth factor and urokinase receptors. Int J Cancer. 2013; 133(8): 1936–1944. [DOI] [PMC free article] [PubMed] [Google Scholar]
- 27.Greenbaum A, Hsu YM, Day RB, Schuettpelz LG, Christopher MJ, Borgerding JN, et al. CXCL12 in early mesenchymal progenitors is required for haematopoietic stem-cell maintenance. Nature. 2013; 495(7440): 227–230. [DOI] [PMC free article] [PubMed] [Google Scholar]
- 28.Sugiyama T, Kohara H, Noda M and Nagasawa T. Maintenance of the hematopoietic stem cell pool by CXCL12-CXCR4 chemokine signaling in bone marrow stromal cell niches. Immunity. 2006; 25(6): 977–988. [DOI] [PubMed] [Google Scholar]
- 29.Coussens LM and Werb Z. Inflammation and cancer. Nature. 2002; 420(6917): 860–867. [DOI] [PMC free article] [PubMed] [Google Scholar]
- 30.Schreiber RD, Old LJ and Smyth MJ. Cancer immunoediting: integrating immunity’s roles in cancer suppression and promotion. Science. 2011; 331(6024): 1565–1570. [DOI] [PubMed] [Google Scholar]
- 31.Meacham CE and Morrison SJ. Tumour heterogeneity and cancer cell plasticity. Nature. 2013; 501: 328–337. [DOI] [PMC free article] [PubMed] [Google Scholar]
- 32.Pang LY and Argyle DJ. The evolving cancer stem cell paradign: Implications in veterinary oncology. Vet J. 2014. December 31 [Epub ahead of print]. [DOI] [PubMed] [Google Scholar]
- 33.Matsuo Y, Ochi N, Sawai H, Yasuda A, Takahashi H, Funahashi H, et al. CXCL8/IL-8 and CXCL12/SDF-1alpha co-operatively promote invasiveness and angiogenesis in pancreatic cancer. Int J Cancer. 2009; 124(4): 853–861. [DOI] [PMC free article] [PubMed] [Google Scholar]
- 34.Ping YF, Yao XH, Chen JH, Liu H, Chen DL, Zhou XD, et al. The anti-cancer compound Nordy inhibits CXCR4-mediated production of IL-8 and VEGF by malignant human glioma cells. J Neurooncol. 2007; 84(1): 21–29. [DOI] [PubMed] [Google Scholar]
- 35.Friedl P and Wolf K. Tumour-cell invasion and migration: diversity and escape mechanisms. Nat Rev Cancer. 2003; 3(5): 362–374. [DOI] [PubMed] [Google Scholar]
- 36.Glading A, Lauffenburger DA and Wells A. Cutting to the chase: calpain proteases in cell motility. Trends Cell Biol. 2002; 12(1): 46–54. [DOI] [PubMed] [Google Scholar]
- 37.Webb DJ, Donais K, Whitmore LA, Thomas SM, Turner CE, Parsons JT, et al. FAK-Src signalling through paxillin, ERK and MLCK regulates adhesion disassembly. Nat Cell Biol. 2004; 6(2): 154–161. [DOI] [PubMed] [Google Scholar]
- 38.Huttenlocher A and Horwitz AR. Integrins in cell migration. Cold Spring Harb Perspect Biol. 2011; 3(9): a005074. [DOI] [PMC free article] [PubMed] [Google Scholar]
- 39.Ridley AJ, Schwartz MA, Burridge K, Firtel RA, Ginsberg MH, Borisy G, et al. Cell migration: integrating signals from front to back. Science. 2003; 302(5651): 1704–1709. [DOI] [PubMed] [Google Scholar]
- 40.Fuhler GM, Drayer AL, Olthof SG, Schuringa JJ, Coffer PJ and Vellenga E. Reduced activation of protein kinase B, Rac, and F-actin polymerization contributes to an impairment of stromal cell derived factor-1 induced migration of CD34+ cells from patients with myelodysplasia. Blood. 2008; 111(1): 359–368. [DOI] [PubMed] [Google Scholar]
- 41.Raftopoulou M and Hall A. Cell migration: Rho GTPases lead the way. Dev Biol. 2004; 265(1): 23–32. [DOI] [PubMed] [Google Scholar]
- 42.Henschler R, Piiper A, Bistrian R and Mobest D. SDF-1alpha-induced intracellular calcium transient involves Rho GTPase signalling and is required for migration of hematopoietic progenitor cells. Biochem Biophys Res Commun. 2003; 311(4): 1067–1071. [DOI] [PubMed] [Google Scholar]
- 43.Cancelas JA, Jansen M and Williams DA. The role of chemokine activation of Rac GTPases in hematopoietic stem cell marrow homing, retention, and peripheral mobilization. Exp Hematol. 2006; 34(8): 976–985. [DOI] [PubMed] [Google Scholar]
- 44.Price LS, Langeslag M, ten Klooster JP, Hordijk PL, Jalink K and Collard JG. Calcium signaling regulates translocation and activation of Rac. J Biol Chem. 2003; 278(41): 39413–39421. [DOI] [PubMed] [Google Scholar]
- 45.Dickerson EB, Thomas R, Fosmire SP, Lamerato-Kozicki AR, Bianco SR, Wojcieszyn JW, et al. Mutations of phosphatase and tensin homolog deleted from chromosome 10 in canine hemangiosarcoma. Vet Pathol. 2005; 42(5): 618–632. [DOI] [PubMed] [Google Scholar]
- 46.Li Z, Dong X, Wang Z, Liu W, Deng N, Ding Y, et al. Regulation of PTEN by Rho small GTPases. Nat Cell Biol. 2005; 7(4): 399–404. [DOI] [PubMed] [Google Scholar]
- 47.Besson A, Gurian-West M, Schmidt A, Hall A and Roberts JM. p27Kip1 modulates cell migration through the regulation of RhoA activation. Genes Dev. 2004; 18(8): 862–876. [DOI] [PMC free article] [PubMed] [Google Scholar]
- 48.Burns JM, Summers BC, Wang Y, Melikian A, Berahovich R, Miao Z, et al. A novel chemokine receptor for SDF-1 and I-TAC involved in cell survival, cell adhesion, and tumor development. J Exp Med. 2006; 203(9): 2201–2213. [DOI] [PMC free article] [PubMed] [Google Scholar]
- 49.Esencay M, Sarfraz Y and Zagzag D. CXCR7 is induced by hypoxia and mediates glioma cell migration towards SDF-1alpha. BMC Cancer. 2013; 13: 347–355. [DOI] [PMC free article] [PubMed] [Google Scholar]
- 50.Zheng K, Li HY, Su XL, Wang XY, Tian T, Li F, et al. Chemokine receptor CXCR7 regulates the invasion, angiogenesis and tumor growth of human hepatocellular carcinoma cells. J Exp Clin Cancer Res. 2010; 29: 31–44. [DOI] [PMC free article] [PubMed] [Google Scholar]
- 51.Choi YH, Burdick MD, Strieter BA, Mehrad B and Strieter RM. CXCR4, but not CXCR7, discriminates metastatic behavior in non-small cell lung cancer cells. Mol Cancer Res. 2014; 12(1): 38–47. [DOI] [PMC free article] [PubMed] [Google Scholar]
Associated Data
This section collects any data citations, data availability statements, or supplementary materials included in this article.
Supplementary Materials
Supplemental Table 3. Biological functions and diseases according to CXCR4 gene expression in canine hemangiosarcoma tissues (microarray).
Supplemental Table 2. Biological functions and diseases according to CXCR4 gene expression in canine hemangiosarcoma cell lines (microarray).
Supplemental Table 1. Differentially expressed genes between upper and lower quartiles of CXCR4 or CXCL12 expression.
Supplemental Table 6. Biological functions and diseases according to CXCL12 gene expression in canine hemangiosarcoma tissues (microarray).
Supplemental Table 5. Biological functions and diseases according to CXCL12 gene expression in canine hemangiosarcoma cell lines (microarray).
Supplemental Table 4. Biological functions and diseases according to CXCR4 gene expression in canine hemangiosarcoma tissues (RNA-seq).
Supplemental Table 7. Biological functions and diseases according to CXCL12 gene expression in canine hemangiosarcoma tissues (RNA-seq).
Supplemental Figure 1. Correlation between Agilent Microarray data (X-axis) and RNA-seq data (Y-axis) for (A) CXCR4 and (B) CXCL12 in twelve overlapping HSA tissue samples.
Supplemental Figure 2. IPA analysis for biological functions related to groups with high expression of (A) CXCR4 and (B) CXCL12. Horizontal bar graphs show canonical pathways that were significantly correlated with differential gene expression between high and low groups in HSA cells and tissues. Descending rank order from each panel was based on their respective BH-P value.
Supplemental Figure 3. Correlation between mRNA and surface protein expression of CXCR4 in four HSA cell lines. The value of surface protein expression is from the mean percent of CXCR4 bright cells from at least three experiments for each cell line.