Drosophila mushroom body γ-neurons offer an excellent model to study axonal growth. Yaniv et al. show that distinct actin elongation factors are employed in different developmental and cellular contexts, providing insights into the intrinsic growth capacity of neurons, a key determinant of regeneration following injury.
Abstract
Intrinsic neurite growth potential is a key determinant of neuronal regeneration efficiency following injury. The stereotypical remodeling of Drosophila γ-neurons includes developmental regrowth of pruned axons to form adult specific connections, thereby offering a unique system to uncover growth potential regulators. Motivated by the dynamic expression in remodeling γ-neurons, we focus here on the role of actin elongation factors as potential regulators of developmental axon regrowth. We found that regrowth in vivo requires the actin elongation factors Ena and profilin, but not the formins that are expressed in γ-neurons. In contrast, primary γ-neuron sprouting in vitro requires profilin and the formin DAAM, but not Ena. Furthermore, we demonstrate that DAAM can compensate for the loss of Ena in vivo. Similarly, DAAM mutants express invariably high levels of Ena in vitro. Thus, we show that different linear actin elongation factors function in distinct contexts even within the same cell type and that they can partially compensate for each other.
Introduction
The ability of neurons to regenerate following injury depends on both intrinsic (Mahar and Cavalli, 2018) and extrinsic factors (Tedeschi and Bradke, 2017). The intrinsic growth ability of central and peripheral neurons, and thus their regenerative capacity, decreases with age (Wang et al., 2007). Therefore, understanding what determines the intrinsic growth capacity in different developmental contexts should forward our understanding of what limits axon regeneration following injury, such as spinal cord injury.
Almost 100 yr ago, Ramon y Cajal (1928) described the retraction bulb, a swollen structure at the end of severed axons, as a sign of failed regeneration. This is in contrast to neurons extending a growing axon in which growth cones seem to play a key role during axon extension. Neurons that undergo extensive regeneration, e.g., peripheral nervous system neurons, are capable of forming a growth cone following injury, pinpointing this highly specialized structure as one key factor determining regeneration ability (Ertürk et al., 2007; Bradke et al., 2012). The growth cone is comprised of two major structures: finger-like projections termed filopodia, separated by sheets called lamellipodia. Filopodia contain a multitude of cross-linked linear actin, while lamellipodia are flat regions of dense branched actin meshwork. Actin dynamics within filopodia and lamellipodia involves a balance between nucleators, which catalyze de novo assembly of actin filaments, and elongation factors, which control the rate and extent of actin polymerization. There is a wide variety of nucleators and elongation factors, and some proteins, such as formins, can exhibit both functions (Prokop et al., 2013; Chesarone and Goode, 2009; Gomez and Letourneau, 2014; Rottner and Schaks, 2019).
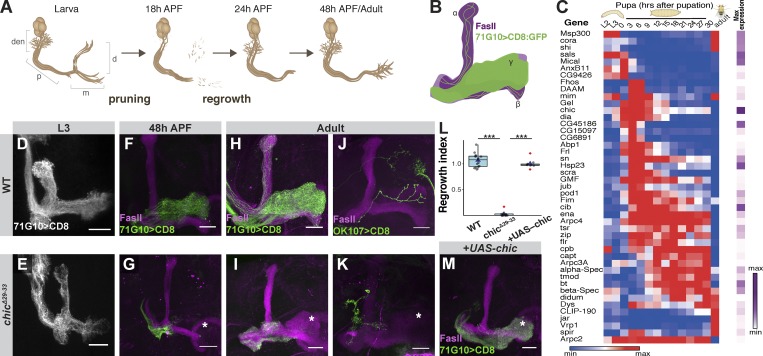
Neuronal remodeling is a conserved mechanism used to refine neuronal connections and involves both degenerative processes, such as axon and synapse pruning, and regenerative processes, including synapse stabilization and axon regrowth (Yaron and Schuldiner, 2016). Thus, neurons undergoing remodeling must switch between a degenerative and a regenerative growth potential. The stereotypical remodeling of the Drosophila mushroom body (MB) provides an excellent model to investigate the molecular mechanisms underlying intrinsic growth abilities. The MB is an olfactory learning center and is comprised of three types of sequentially born neurons, the γ, α’/β’, and α/β neurons, of which only the γ-neurons undergo developmental remodeling. Initially, γ-neurons extend bifurcated axons to form a medial and a dorsal lobe (Fig. 1 A). At the onset of metamorphosis, γ-neurons prune their axons up to a specific branch point, followed by regrowth to form an adult specific medial γ lobe (Lee et al., 1999). We have previously shown that developmental axon regrowth depends on the nuclear receptor transcription factors Unfulfilled (UNF, Nr2e3; Yaniv et al., 2012) and Ecdysone–induced protein 75B (E75, Nr1d1; Rabinovich et al., 2016), indicating that this process is governed by a transcriptional program. Importantly, we have demonstrated that developmental regrowth is not only distinct from initial axon outgrowth, but also shares molecular mechanisms with regeneration following injury (Yaniv et al., 2012).
Figure 1.
Chickadee is cell autonomously required for developmental regrowth of MB γ-neurons. (A) Schematic representation of MB remodeling. Den, dendrites; p, peduncle; d, dorsal lobe; m, medial lobe. (B) Scheme of MB demonstrating that 71G10-Gal4–driven GFP labels the γ-neurons and a subset of α/β neurons and that FasII antibody weakly labels the γ lobe and strongly labels the α/β lobes. (C) Heatmap depicting the relative RNA expression levels of genes relevant to actin dynamics throughout development from second instar larva (L2) to adult. The purple scale depicts the peak expression of each gene relative to others presented in the scheme. Genes are ordered based on their clustered expression. See Alyagor et al. (2018) for technical details. (D–K and M) Confocal z-projections of WT (D, F, H, and J) or chicΔ29-33 (E, G, I, and K) or chicΔ29-33 additionally expressing a UAS-chic transgene (M) MB γ-neuron neuroblast (D–I and M) or single cell (J and K) MARCM clones at L3 (D and E), 48 h APF (F and G), or adult (H–K and M). Asterisk marks distal tip of the adult γ lobe. While chicΔ29-33 γ-neurons initially extend axons normally (E), axons fail to regrow into the adult γ lobe following pruning (G, I, and K). Expressing UAS-chic within chicΔ29-33 clones rescues the regrowth defect (M). (L) Box plot quantification of MB γ axon regrowth, depicted as a regrowth index, of H (n = 15), I (n = 12), and M (n = 9). The quantification method is detailed in the Materials and methods section. ***, P = 2 × 10⁻¹⁶ (t test between the labeled groups). Boxes encompass the values in between the first and third quartiles; whiskers are ± 1.5 interquartile range (IQR); median (line), mean (blue triangle), and outliers (red diamond). Gray is R71G10-Gal4–driven mCD8::GFP. Green is the γ-specific driver R71G10-Gal4 (D–I and M) or the pan-MB driver OK107-Gal4 (J and K)–driven mCD8::GFP. Magenta represents FasII staining. Scale bars, 20 µm.
We have recently uncovered the detailed transcriptional landscape of developing MB γ-neurons undergoing remodeling (Alyagor et al., 2018). Interestingly, many proteins related to actin dynamics were expressed above threshold and exhibited significant developmental expression dynamics that positions them as relevant candidates for structural components of developmental axon regrowth. Here we investigate the role of various actin elongation factors during γ axon regrowth in vivo, and complement our findings with analyses in an in vitro primary neuron sprouting model.
Results and discussion
Chickadee is required for developmental regrowth of MB γ axons
In-depth analysis of our recently published developmental expression atlas of MB neurons (Alyagor et al., 2018) showed that out of 126 actin-related genes in Drosophila, 77 are expressed above threshold and 45 are dynamically expressed during MB γ-neuron development (Fig. 1 C). To identify genes that are related to developmental axon regrowth, we focused our attention on gene clusters whose expression is up-regulated just before regrowth. Out of the significantly and dynamically expressed actin-related genes, 21 are expressed in a pattern consistent with a role in axon regrowth.
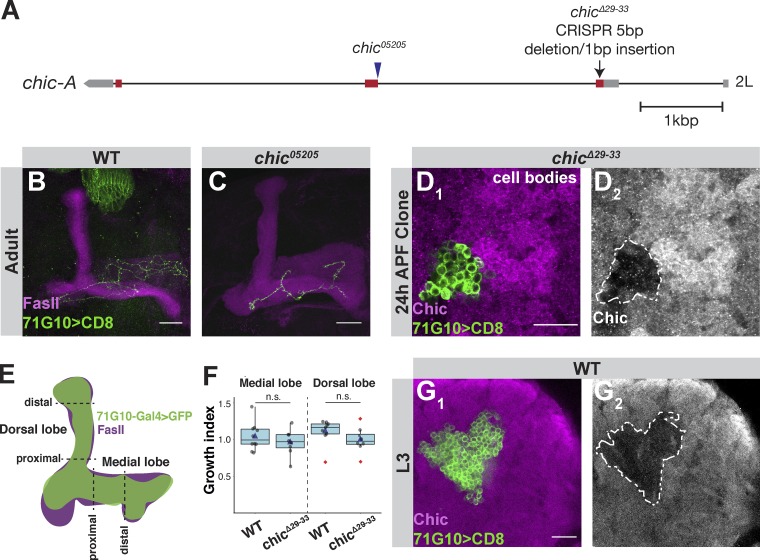
One of the highest expressed actin-related genes in MB γ-neurons is chickadee (chic), the Drosophila homologue of profilin (Cooley et al., 1992). While chic is expressed throughout development, its expression peaks during the first few hours of pupation, before regrowth occurs (Fig. 1 C). Profilin is a monomeric G-actin binding protein that enhances linear actin elongation by bringing G-actin to regulators of elongation such as Enabled (Ena)/Vasodilator-stimulated phosphoprotein (VASP) and the actin nucleators from the formin family (Reinhard et al., 1995; Bear and Gertler, 2009; Evangelista et al., 2003; Shekhar et al., 2016). Chic has already been shown to be required for the full extension of γ axons (Ng and Luo, 2004) and suggested, in single-cell clones, to be specifically required for regrowth (Medioni et al., 2014). Using the available chic mutant (chic05205) that includes an intronic P-element insertion (Fig. S1 A; Wills et al., 1999), we failed to produce any neuroblast clones, and the single-cell clone phenotype was variable and rather weak (Fig. S1, B and C). Therefore, we used CRISPR/Cas9 methodology to generate chicΔ29-33 in which a five-nucleotide deletion and one-nucleotide insertion is expected to cause a premature stop codon 15 amino acids downstream of the translation initiation site (Fig. S1 A). We generated Mosaic Analysis with a Repressible Cell Marker (MARCM; Lee and Luo, 1999) clones that are positively labeled and homozygous mutant for chicΔ29-33 in an otherwise heterozygous background, and confirmed by antibody staining that chicΔ29-33 is likely a protein null allele (Fig. S1 D). These chicΔ29-33 γ-neurons displayed a strong defect in adult neuroblast and single-cell clones, in which the axons fail to extend into the adult γ lobe (Fig. 1, H–L; see Fig. 1 B for a graphical schematic). In contrast, third instar larvae (L3) chicΔ29-33 MB γ-neurons appear normal (Fig. 1, D and E, quantified in Fig. S1, E and F), suggesting that Chic is not required for their initial axon outgrowth. Furthermore, antibody staining indicates that Chic is expressed in larval γ-neurons at lower levels compared to neighboring cells (Fig. S1 G). However, at 48 h after puparium formation (APF), a time point when WT axons have achieved their adult morphology (Fig. 1 F), chicΔ29-33 axons remain stalled near the axon branch point (Fig. 1 G). To confirm that the regrowth defect was due to the Chic loss of function, we performed a rescue experiment and found that Chic overexpression within mutant clones indeed rescued the regrowth defect (Fig. 1 M; quantified in Fig. 1 L).
Figure S1.
The chicΔ29-31 CRISPR/Cas9 mutant is null, demonstrating that chic is not required for initial larval γ growth. (A) Scheme depicting the genomic locus of chic. chic05205 is an intronic P{PZ} insertion located 3.2 kb downstream of the start of exon 1, and close to the second exon (Wills et al., 1999). chicΔ29-33 is a CRISPR/Cas9 mediated indel that resulted in a five-nucleotide deletion and one-nucleotide insertion starting 29 bases downstream of the start site, causing a frameshift after 9 amino acids. Red and gray bars depict coding and noncoding exons, respectively, while lines depict introns. (B and C) Confocal Z-projections of WT (B) or chic05205 (C) adult γ-neuron MARCM single-cell clones. (D) Confocal single slices of the MB cell body region depicting antibody staining of Chic in chicΔ29-33 γ-neuron MARCM neuroblast clone at 24 h APF. D1 shows colabeling of Chic (magenta) and GFP. D2 shows antibody staining with the mutant clone demarcated with a white dashed line. (E) Scheme explaining quantification of L3 phenotype. In each dorsal and medial lobe, two perpendicular slices were taken, one at the tip and one close to the branch point, where the ratio of the clone (green) to FasII (magenta) was calculated. Ratio is presented as a growth index. (F) Growth index of WT (n = 10 medial lobe; n = 9 dorsal lobe) and chicΔ29-33 (n = 8) larval γ-neuron MARCM clones of both medial and dorsal lobes. The two groups were compared using two-tailed Student’s t test. Boxes encompass the values in between the first and third quartiles; whiskers are ±1.5 IQR; median (line), mean (blue triangle), and outliers (red diamond). (G) Confocal single slices of the MB cell body region depicting antibody staining of Chic in WT γ-neuron MARCM neuroblast clone at L3. G1 shows colabeling of Chic (magenta) and GFP. G2 shows antibody staining with the mutant clone demarcated with a white dashed line. Green is 71G10-Gal4–driven mCD8::GFP. Magenta is FasII with the exception of D and G, where it is Chic antibody staining. Scale bar, 20 µm. n.s., not significant.
Ena is the main actin filament elongator required for developmental axon regrowth
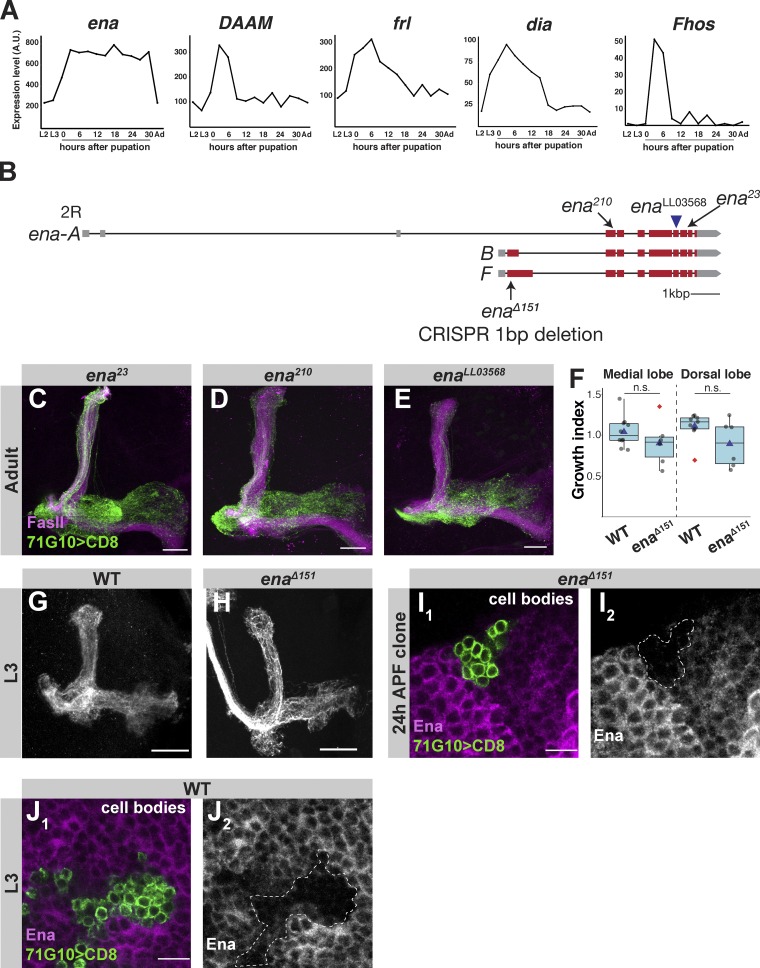
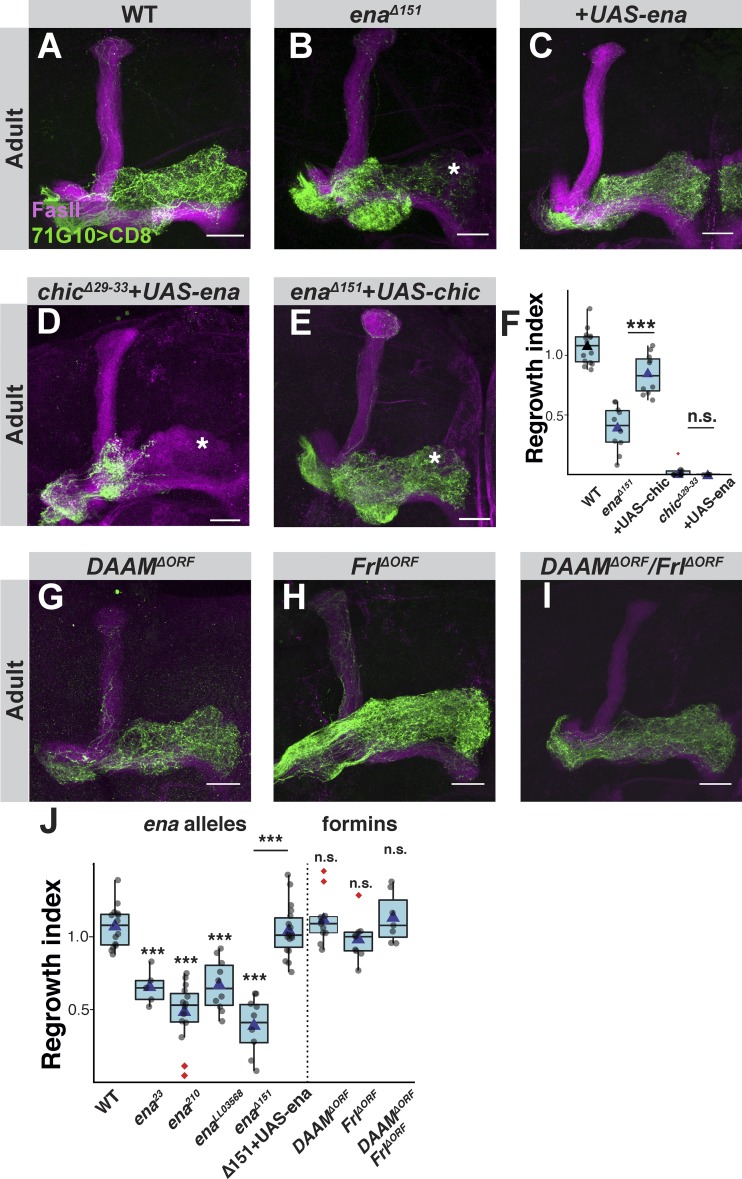
Profilin promotes actin polymerization by binding the actin elongation factors Ena/VASP (Pasic et al., 2008) and formins (Breitsprecher and Goode, 2013), and delivering them with G-actin monomers. Ena/VASP proteins are conserved regulators of actin dynamics during various physiological processes (Krause et al., 2003; Bear and Gertler, 2009). This family of proteins includes three members in vertebrates—Mena, VASP, and Ena/VASP-like (EVL)—but only a single orthologue in Drosophila, Ena. In addition to recruiting G-actin–bound profilin (Chesarone and Goode, 2009), Ena/VASP proteins likely contribute to actin elongation via an anti-capping activity (Bear et al., 2002). In fact, profilin has been shown to increase the anti-capping activity of VASP in vitro (Barzik et al., 2005). Interestingly, ena expression is up-regulated in MB γ-neurons before developmental axon regrowth and remains high until at least 30 h APF (Fig. S2 A). We found that MARCM clones homozygous mutant for the existing ena alleles ena210 (Gertler et al., 1990), ena23 (Ahern-Djamali et al., 1998), and enaLL03568 (Schuldiner et al., 2008), as well as for a new CRISPR-mediated allele that we generated, enaΔ151 (Fig. S2 B), all displayed defects in developmental axon regrowth (Fig. S2, C–E; Fig. 2, A and B; quantified in Fig. 2 J). Importantly, enaΔ151 was verified as a null mutation by antibody staining of a MARCM neuroblast clone (Fig. S2 I).
Figure S2.
Phenotypic analysis of additional Ena mutants. (A) Graphs showing the expression levels of indicated actin nucleators throughout development (x axis; Ad, Adult). Units on the y axis are arbitrary. See Alyagor et al. (2018) for technical details. (B) Scheme depicting the genomic locus of ena. enaΔ151 is a CRISPR/Cas9-mediated one-nucleotide deletion located 151 bases downstream of the start site of isoforms B and F, enaLL03568 is a piggybac insertion located in the sixth coding exon, ena23 is a point mutation in the second coding exon causing an amino acid change of N379F, and ena210 is a point mutation in the seventh coding exon causing an amino acid change of A97V. Red and gray bars depict coding and noncoding exons, respectively, while lines depict introns. (C–E) Confocal z-projections of ena23 (C), ena210 (D), and enaLL03568 (E) adult γ-neuron MARCM neuroblast clones. (F) Growth index of WT (n = 10 medial lobe, n = 9 medial lobe) and enaΔ151 (n = 7) larval γ-neuron MARCM clones of both medial and dorsal lobes. The two groups were compared using two-tailed Student’s t test. Boxes encompass the values in between the first and third quartiles; whiskers are ±1.5 IQR; median (line), mean (blue triangle), and outliers (red diamond). (G and H) Confocal z-projections of WT (G) or enaΔ151 (H) larval γ-neuron MARCM clones. (I) Confocal single slice of the MB cell body region of brains containing an enaΔ151 γ-neuron MARCM neuroblast clone at 24 h APF and stained against Ena. I1 shows colabeling of the mutant clone (green) and anti-Ena (magenta). I2 is anti-Ena with the mutant clone depicted as a dotted line. (J) Confocal single slices of the MB cell body region depicting antibody staining of Ena in WT γ-neuron MARCM neuroblast clone at L3. J1 shows colabeling of Ena (magenta) and GFP. J2 shows antibody staining with the mutant clone demarcated with a white dashed line. Green is 71G10-Gal4–driven mCD8::GFP. Magenta is FasII in all panels except for I and J, where it is anti-Ena staining. Gray is 71G10-Gal4–driven mCD8::GFP in G and H, and.anti-Ena staining in I and J. Scale bars, 20 µm in all panels except in I and J, where they are 10 µm. Fhos, Formin homology 2 domain containing. A.U., arbitrary units; n.s., not significant.
Figure 2.
The linear actin elongation factor Ena, but not the formins DAAM or Frl, is required for developmental axon regrowth. (A–C) Confocal z-projections of WT (A), enaΔ151 (B), or enaΔ151 additionally expressing UAS-Ena (C), γ-neuron adult neuroblast MARCM clones. (D and E) Confocal z-projections of adult MARCM neuroblast clones of enaΔ151 additionally expressing UAS-chic (E) or chicΔ29-33 neuroblast clones additionally expressing UAS-ena (D). (F) Box plot quantification of MB γ axon regrowth of A (n = 15), B (n = 10), D (n = 14), E (n = 11), and Fig. 1 I (n = 12). ANOVA analysis with Tukey's honestly significant difference (HSD) post hoc was performed. enaΔ151 with and without UAS-Chic, ***, P < 0.001; chicΔ29-33 with and without UAS-Ena, P = 0.99. (G–I) Confocal z-projections of DAAMΔORF (G), Frl ΔORF (H), or double mutants for DAAMΔORF and Frl ΔORF (I) γ-neuron adult neuroblast MARCM clones. (J) Box plot quantification of MB γ axon regrowth of A (n = 15), B (n = 10), C (n = 18), G (n = 11), H (n = 9), and I (n = 7); as well as Fig. S2 C (n = 5), Fig. S2 D (n = 15), and Fig. S2 E (n = 10). ANOVA analysis with Tukey's HSD post hoc was performed. Unless specifically marked otherwise, the significance level that is indicated above the box is in comparison to the WT. P values, compared with WT, are as follows: ena23, ***, P = 0.002; ena210, ***, P < 0.001; enaLL03568, ***, P < 0.001; enaΔ151, ***, P < 0.001; DAAMΔORF, P = 0.999; FrlΔORF, P = 0.947; double mutants for DAAMΔORF and FrlΔORF, P = 0.997. enaΔ151 with and without UAS-Ena, ***, P < 0.001. In all box plots, boxes encompass the values in between the first and third quartiles; whiskers are ± 1.5 IQR; median (line), mean (blue triangle), and outliers (red diamond). In all confocal images, asterisks mark the distal tip of the adult γ lobe. Green is R71G10-Gal4–driven mCD8::GFP. Magenta represents FasII staining. Scale bars, 20 µm. n.s., not significant.
The failure of enaΔ151 MARCM clones to fully innervate the adult γ lobe is likely due to a specific defect in developmental axon regrowth, since MB γ-neurons undergo normal initial axon outgrowth in the larva (Fig. S2, G and H; quantified in Fig. S2 F), and Ena is not highly expressed in the larval γ-neurons (Fig. S2, A and J). Finally, we generated an upstream-activation sequence (UAS)-ena transgene that fully rescued the regrowth phenotype of enaΔ151 mutant axons (Fig. 2 C; quantified in Fig. 2 J).
Ena and Chic function together to promote regrowth
Although Ena/VASP and profilin often function together to promote F-actin filament elongation, they have also been known to exert their effects independently. For example, profilin increases filament elongation induced by formins (Kovar et al., 2006), while Ena/VASP can promote actin polymerization even in the absence of profilin, albeit at a lower rate (Barzik et al., 2005). To better understand the functional interaction between Ena and Chic, we performed epistatic experiments. While overexpressing Ena within chicΔ29-33 mutant clones did not alleviate the regrowth defect (Fig. 2 D; quantified in Fig. 2 F), overexpressing Chic within enaΔ151 mutant clones significantly suppressed the regrowth defect (Fig. 2, E and F). These results suggest that while Ena requires Chic for its function in regrowth, Chic, at least when overexpressed, can promote regrowth in an Ena-independent manner. The most plausible alternate function for profilin is the promotion of actin elongation by facilitating the activity of a formin family member.
Major formins and Arp2/3 are not normally required for axon regrowth
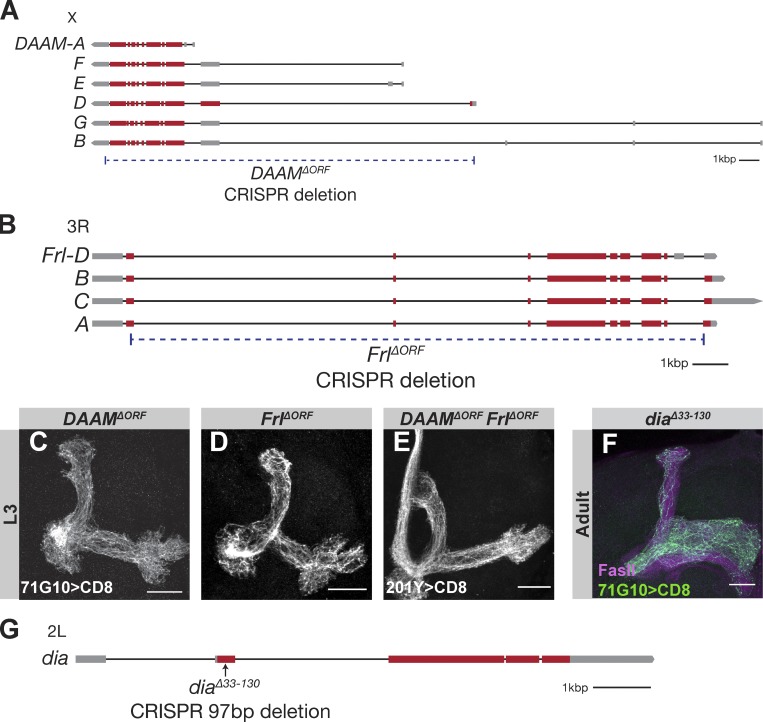
Proteins of the formin family play important roles in cytoskeletal dynamics in both vertebrates and invertebrates, mainly by contributing to linear actin nucleation and assembly (Evangelista et al., 2003). Analysis of our RNA-sequencing data showed that four out of the seven Drosophila formins are expressed above threshold in MB γ-neurons at some point during development (Fig. S2 A); Dishevelled associated activator of morphogenesis (DAAM) and Formin like (Frl) are expressed at the highest levels, while Diaphanous (Dia) and formin homology 2 domain containing (Fhos) are expressed at lower levels. Interestingly, DAAM was shown to be expressed in the forming MB lobes, and its perturbation altered MB morphology, although the γ lobe seemed unaffected (Gombos et al., 2015). To test potential involvement of formins in γ axon regrowth, we used CRISPR/Cas9 to generate full deletions of the entire DAAM and Frl coding sequences (Fig. S3, A and B), and an indel mutation of Dia (Fig. S3 G). MARCM γ neuroblast clones homozygous for DAAMΔORF or FrlΔORF displayed WT-like morphology at L3 (Fig. S3, C and D) and in adults (Fig. 2, G, H, and J), as did adult MARCM clones of DiaΔ33-130 (Fig. S3 F). Since formins can potentially compensate for each other, we also generated DAAMΔORF/FrlΔORF doubly mutant MARCM clones and found that while the adult γ axons appear slightly blebbed and perhaps even at early stages of degeneration, they fully innervate the adult γ lobe (Fig. 2, I and J) and also appear normal at L3 (Fig. S3 E). While we cannot rule out the option that other formins, such as Fhos and Dia, might compensate for the loss of both DAAM and Frl, our results suggest that formins do not normally play a role in developmental axon regrowth, but rather that Ena is the main linear actin elongation factor during regrowth.
Figure S3.
Description of formin CRISPR/Cas9 alleles and additional formin phenotypes. (A and B) Scheme depicting the genomic locus of DAAM (A) or Frl (B) with the CRISPR/Cas9 mediated deletions (ΔORF) annotated as dashed lines. Red and gray bars depict coding and noncoding exons, respectively, while lines depict introns. (C–E) Confocal z-projections of DAAMΔORF (C), Frl ΔORF (D), or DAAMΔORF/FrlΔORF (E) MB γ-neuron MARCM clones at third instar larva (L3). (F) Confocal z-projections of diaΔ33-130 adult γ-neuron MARCM neuroblast clone. (G) Scheme depicting the genomic locus of dia with the CRISPR/Cas9 mediated indel. Gray and green are 71G10-Gal4 (C, D, and G) or 201Y-Gal4 (E)–driven mCD8::GFP. Magenta is FasII staining. Scale bars, 20 µm.
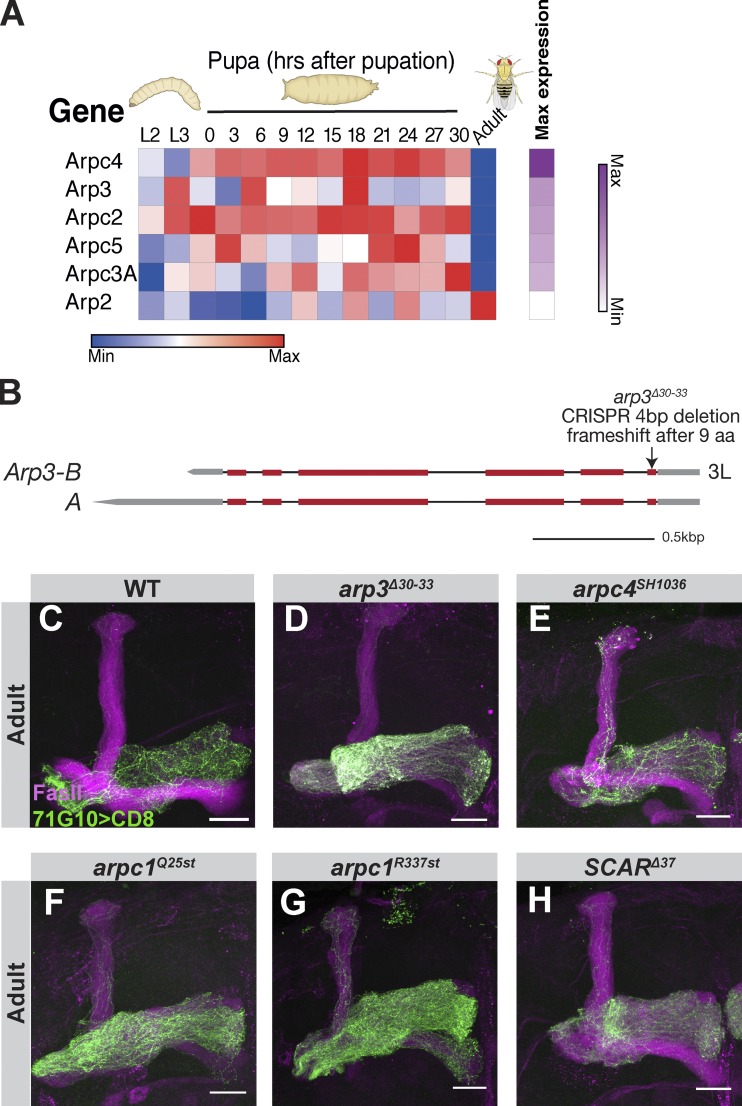
Interestingly, several members of the Arp2/3 protein complex, required for branched actin nucleation, are significantly expressed in MB γ-neurons during development (Fig. S4 A). MARCM clones homozygous for a new CRISPR/Cas9-mediated indel that we generated, arp3Δ30-33 (Fig. S4, B–D), a P-element inserted in Arpc4 (arpc4SH1036, Fig. S4 E), as well as two Arpc1 mutants predicted to result in truncated proteins (arpc1Q25st and arpc1R337st, Fig. S4, F and G), and the Arp2/3 activator, Suppressor of cyclic AMP receptor (SCARΔ37, Fig. S4 H), all exhibit WT morphology. These data suggest that branched actin, unlike linear actin, is not required for developmental regrowth.
Figure S4.
The Arp2/3 complex is not required for developmental axon regrowth of MB γ-neurons. (A) Heatmap depicting the relative RNA expression levels of the Arp2/3 complex members that are expressed above threshold throughout development from second instar larva (L2) to adult. Genes are ordered by their relative abundance during their peak expression as depicted by the purple heatmap on the right. See Alyagor et al. (2018) for technical details. (B) Scheme depicting the genomic locus of Arp3. arp3Δ30-33 is a four-nucleotide deletion starting 30 bp downstream of the start site causing a frameshift after nine amino acids. Red and gray bars depict coding and noncoding exons, respectively, while lines depict introns. (C–H) Confocal z-projections of WT (C), arp3Δ30-33 (D), arpC4SH1036 (E), arpc1Q25st (F), arpc1R337st (G), and SCARΔ37 (H) adult γ-neuron MARCM neuroblast clones. Green is R71G10-Gal4–driven mCD8::GFP. Magenta represents FasII staining. Scale bars, 20 µm.
Formins promote sprouting and growth of MB γ-neurons in vitro
To further understand the mechanisms involved in axon growth of MB γ-neurons and the roles of actin regulators during these processes, we turned to an in vitro system that enables the use of pharmacological inhibitors combined with genetic perturbations. We used the previously published neurite sprouting assay (Marmor-Kollet and Schuldiner, 2016), in which larval brains containing WT or mutant MB γ-neuron MARCM clones are dissected, dissociated, mixed with brains that do not contain clones, and cultured together. This technique therefore allows growth of dense cultures with sparse labeling of WT or mutant neurons. The sprouting ability of γ-neurons that were dissected from larval brains was assayed after 2 d in vitro (DIV).
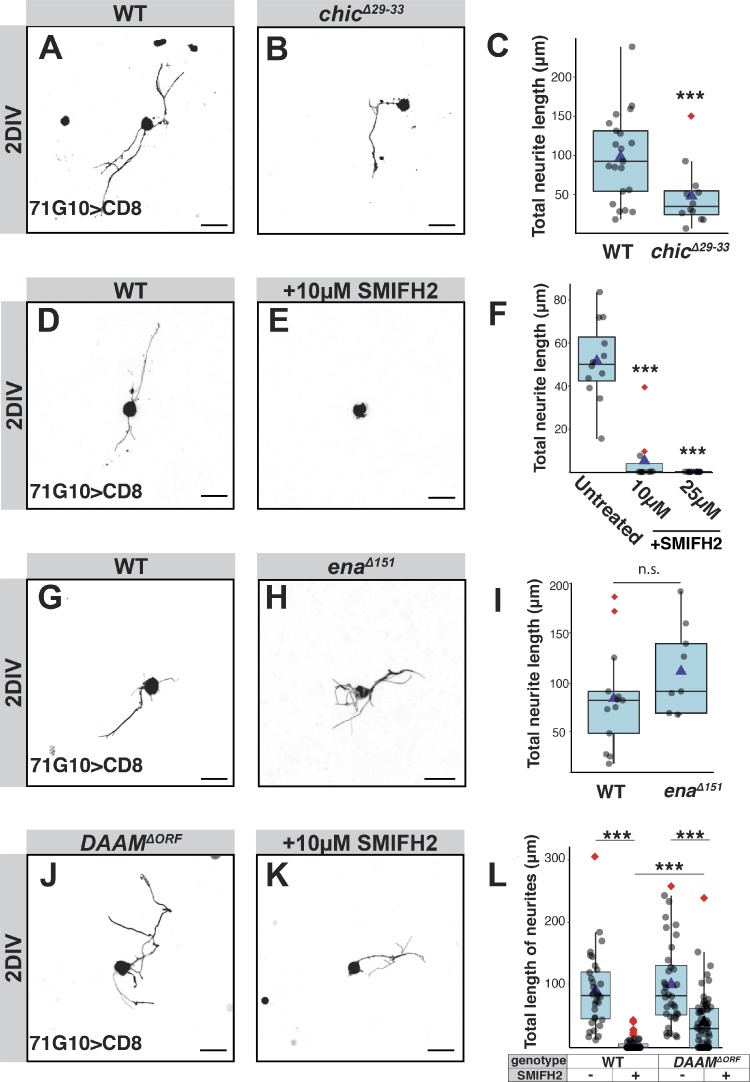
To determine whether profilin, which we have shown to be important for γ axon regrowth in vivo, is also required for γ neurite sprouting in vitro, we assayed the growth ability of chicΔ29-33 mutants. Indeed, chic mutant neurons underwent significantly reduced sprouting compared with WT neurons at 2 DIV (Fig. 3, A–C), confirming the requirement of linear actin in driving sprouting. Since profilin can collaborate with either Ena or formins, we next explored their involvement in γ neurite sprouting.
Figure 3.
Formins are required for axon sprouting, but deletion of DAAM initiates a formin-independent actin growth pathway. (A–L) The two left columns of panels in this figure depict confocal z-projections of single MB γ-neurons that were dissociated from third instar larval brains containing WT or mutant MARCM clones, as depicted, and grown for 2 DIV. Due to inherent variability in sprouting ability, controls were performed on the same day, in the same conditions as the experimental condition. Untreated WT neurons (A, n = 21; D, n = 15; G, n = 13), chicΔ29-33 (B, n = 12), WT neurons treated with 10 µM of the pan-formin inhibitor SMIFH2 (E, n = 11), enaΔ151 (H, n = 10), DAAMΔORF (J, n = 36), and DAAMΔORF treated with 10 µM SMIFH2 (K, n = 59). The right column of panels represents quantification of total neurite length of the MB γ-neurons shown in the left panels, except for F, which additionally also includes quantification of cells treated with 25 µM SMIFH2 (n = 13); ***, P = 0.006 (two-tailed t test; C); ***, P < 0.001 (Tukey's HSD; F); P = 0.2 (two-tailed t test; I); ***, P < 0.001 (two-tailed t test), also shows effect of SMIFH2 on each genotype (Cohen’s d test; L). In all box plots, boxes encompass the values in between the first and third quartiles; whiskers are ± 1.5 IQR; median (line), mean (blue triangle), and outliers (red diamond). Unless specifically marked otherwise, the significance level that is indicated above the box is in comparison to the WT. Gray is R71G10-Gal4–driven mCD8::GFP. Scale bars, 10 µm. n.s., not significant.
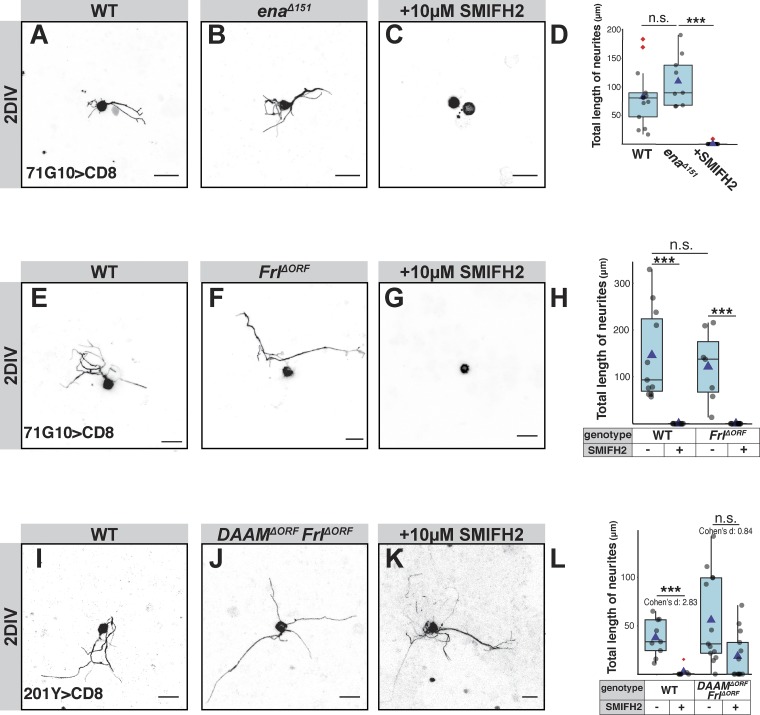
We added a pan-formin inhibitor (SMIFH2) to cells 1 h after plating, and found that SMIFH2 (using two different concentrations; 10 µM and 25 µM) ablated neurite growth at 2 DIV (Fig. 3, D–F), indicating that formin activity is required for sprouting. In contrast, enaΔ151 γ-neurons sprouted normally (Fig. 3, G–I), and were also sensitive to the application of SMIFH2 (Fig. S5, A–D), suggesting that formins, but not Ena, drive sprouting.
Figure S5.
Additional analyses of SMIFH2 sensitivity in sprouting assay. (A–L) The three left columns of panels in this figure depict confocal z-projections of single MB γ-neurons that were dissociated from third instar larval brains containing WT or mutant MARCM clones, as depicted, and grown for 2 DIV (see Materials and methods for more information). Due to inherent variability in sprouting ability, controls were performed on the same day, in the same conditions as the experimental condition (A, n = 13; E, n = 11; I, n = 9). Untreated WT neurons, (B) enaΔ151 (n = 10), (C) enaΔ151 treated with 10 µM of the pan-formin inhibitor SMIFH2 for their entire growth in vitro (n = 20), (F) FrlΔORF(n = 7), (G) FrlΔORF treated with 10 µM SMIFH2 (n = 11), (J) DAAMΔORF/FrlΔORF double mutant (n = 12), (K) DAAMΔORF/FrlΔORF double mutant treated with 10 µM SMIFH2 (n = 13). The right column of panels represents quantification of total neurite length of the MB γ-neurons shown in the left panels. (D, H, and L) ***, P < 0.001 (Tukey's HSD; D); ***, P < 0.001 (t test; H); ***, P < 0.001 (t test; L), also shows effect of SMIFH2 on each genotype (Cohen’s d test). Boxes encompass the values in between the first and third quartiles; whiskers are ±1.5 IQR; median is represented as a line, mean as blue triangle, outliers are blue circles. Gray is R71G10-Gal4 (A–G) or 201Y-Gal4 (I–K)–driven mCD8::GFP. Scale bars, 10 µm. n.s., not significant.
Since two of the seven formins are highly expressed in MB γ-neurons, we wanted to test which one is specifically required for sprouting. We assayed the sprouting ability of DAAMΔORF mutant γ-neurons and found that they sprout normally (Fig. 3, J and L). We therefore postulated that a different formin, for example, Frl, may be mediating actin assembly during neurite sprouting. However, FrlΔORF mutant neurons also sprout normally (Fig. S5, E, F, and H). To test whether other formins might be functioning during sprouting, we treated DAAMΔORF and FrlΔORF mutant neurons with the pan-formin inhibitor SMIFH2. Unexpectedly, adding SMIFH2 to DAAMΔORF mutant neurons resulted in a much milder growth defect than when added to WT brains (Fig. 3, K and L; Cohen’s d effect size in WT = 2.25, in DAAMΔORF mutants = 1.08). In contrast, adding SMIFH2 to FrlΔORF neurons resulted in a drastically reduced sprouting ability, an effect that was similar to the application of SMIFH2 on WT neurons (Fig. S5, G and H). Furthermore, also neurons that are DAAMΔORF/FrlΔORF doubly mutant sprout normally and are insensitive to SMIFH2 (Fig. S5, I–L; Cohen’s d effect size in WT = 2.83, in DAAMΔORF/FrlΔORF mutants = 0.84). These results suggest that the mutation in DAAM, but not in Frl, initiates a compensatory mechanism that is formin-independent and facilitates axon sprouting.
Ena and DAAM can partially compensate for the loss of the other
The partial resistance of the DAAM mutant to a pan-formin inhibitor in vitro raises the hypothesis that genetic ablation of DAAM triggers an alternate, formin-independent, F-actin elongation pathway, or alternatively via microtubule regulation. This is reminiscent of our earlier result in which overexpressing Chic suppressed the enaΔ151 regrowth defect, hinting of a compensatory, in this case non–Ena-related mechanism. Based on these observations, we postulated that when DAAM is mutated in vitro, Ena can compensate for its function and therefore promotes SMIFH2 resistant sprouting, and conversely when ena is mutated in vivo, DAAM can drive regrowth instead.
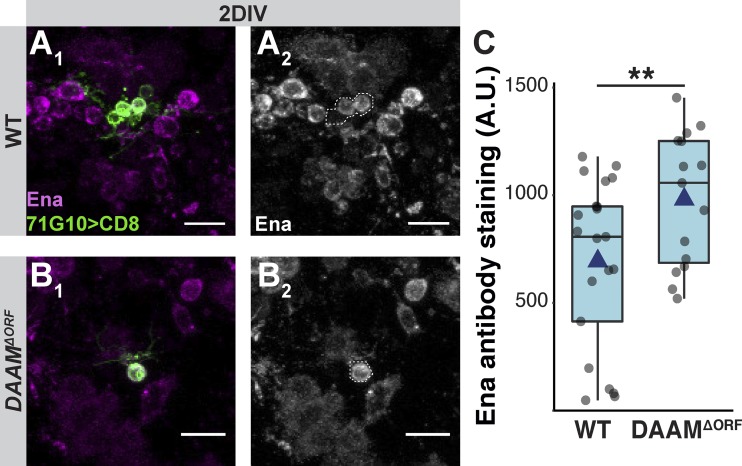
To examine our hypothesis regarding in vivo sprouting, we wished to test whether simultaneously mutating ena and DAAM would reverse the SMIFH2 resistance displayed by the DAAM mutant. Unfortunately, ena/DAAM doubly mutant MARCM clones are rare, at least in part due to the double recombination required for positive labeling, thereby precluding us from performing sprouting assays of these double mutants. Furthermore, we were unable to replace one of the mutants with an RNAi, since DAAM RNAi neurons are not resistant to SMIFH2 (thus no phenotype to reverse), and Ena RNAi seems to be ineffective in γ-neurons as it does not affect regrowth in vivo. Therefore, we decided to see if DAAM mutant neurons express higher levels of Ena. While WT neurons dissected from larval brains and grown 2 DIV express Ena at variable levels (Fig. S6, A and C), DAAMΔORF γ-neurons expressed Ena at an average of 30% more than WT cells (Fig. S6, B and C; P = 0.0097). The most plausible interpretation of this up-regulation of Ena upon loss of DAAM, combined with the SMIFH2 resistance, is that Ena compensates for DAAM loss. A formal proof, however, requires additional experiments that are currently impossible with existing tools.
Figure S6.
DAAM mutant neurons express higher levels of Ena in vitro. (A and B) Confocal z-projections of single MB γ-neurons dissociated from third instar larval brains containing WT (A) or DAAMΔORF (B) MARCM clones and grown for 2 DIV and stained for Ena. A1 and B1 show colocalization of GFP and anti-ena staining. A2 and B2 are only anti-Ena staining with the cell expressing GFP outlined. (C) Quantification of Ena antibody staining corrected for background staining. While WT neurons (n = 21) express highly variable levels of Ena, DAAMΔORF neurons (n = 15) express consistently higher levels of Ena. A.U., arbitrary units. **, P = 0.0097 (two-tailed t test). Boxes encompass the values in between the first and third quartiles; whiskers are ±1.5 IQR; median (line), mean (blue triangle), and outliers (red diamond). Green is R71G10-Gal4–driven mCD8::GFP, magenta is Ena staining. Scale bars, 10 µm.
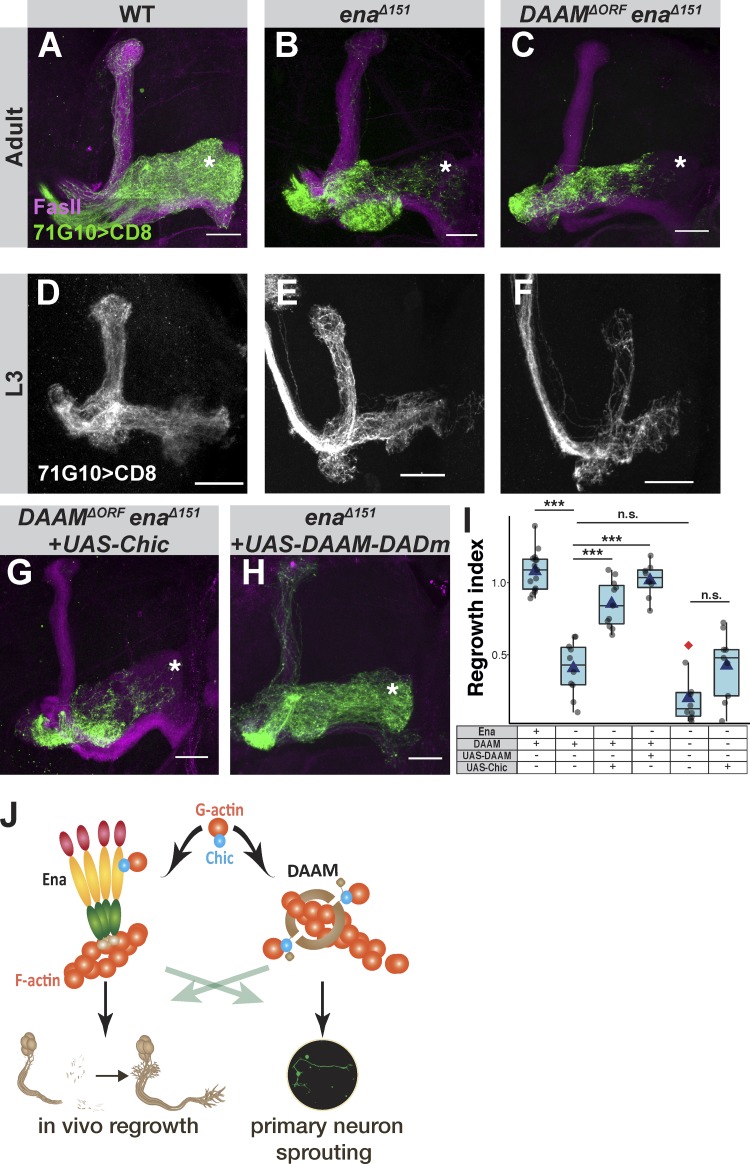
We next turned to in vivo regrowth, in which we speculate that DAAM might compensate, in some conditions, for the lack of Ena. enaΔ151/DAAMΔORF doubly mutant MARCM clones undergo normal initial axon growth at L3 (Fig. 4, D–F), while adult enaΔ151/DAAMΔORF MB clones exhibit a regrowth defect similar in severity to that of clones mutant only in enaΔ151 (Fig. 4, A–C; quantified in Fig. 4 I). The fact that this double mutant initially extends γ axons normally can be due to another formin being sufficient to drive growth; protein perdurance of Ena or DAAM; or the fact that linear actin might not required for initial axon growth, which to some extent is consistent with previous findings (see discussion below on growth cone extension). Our previous results suggest that overexpressing Chic can suppress the growth defect of ena mutants (Fig. 2, E and F) likely via a formin such as DAAM. Remarkably, overexpressing Chic could not significantly rescue the growth defect of enaΔ151/DAAMΔORF doubly mutant MARCM clones (Fig. 4 G; quantified in Fig. 4 I). Therefore, the growth-promoting effect of elevated Chic in ena mutants likely depends on DAAM. To explore this further, we overexpressed an active form of DAAM within ena mutant clones and found that it was sufficient to significantly suppress the regrowth defect, even without elevating Chic expression (Fig. 4 H; quantified in Fig. 4 I). Altogether, our findings suggest that under normal circumstances, Ena is the major actin elongation factor required for regrowth in vivo, while DAAM is not involved; however, when Ena is perturbed, overexpressing DAAM can compensate for its loss.
Figure 4.
Ena is the major actin elongation factor required for regrowth but DAAM can compensate for its loss. (A–F) Confocal Z-projections of adult (A–C) or L3 (D–F) of WT (A and D), enaΔ151 (B and E), or enaΔ151/DAAMΔORF (C and F) MARCM neuroblast clones. (G) Confocal z-projections of adult enaΔ151/DAAMΔORF MARCM neuroblast clones expressing UAS-Chic. (H) Confocal z-projections of adult enaΔ151 MARCM neuroblast clones expressing UAS-DAAM-DADm (an isoform lacking the diaphanous auto-regulatory domain, DAD, and expected to behave as an activated form). Asterisks mark distal tip of adult γ lobe. Gray and green are R71G10-Gal4–driven mCD8::GFP. Magenta represents FasII staining. Scale bars, 20 µm. (I) Quantification of regrowth index of the genotypes shown in A (n = 15), B (n = 10), C (n = 10), G (n = 9), and H (n = 8), and also Fig. 2 E (n = 11). ANOVA analysis with Tukey's HSD post hoc was performed. WT vs. enaΔ151, ***, P < 0.001; enaΔ151 with or without UAS-Chic, ***, P < 0.001; enaΔ151 with or without UAS-DAAM-DADm, ***, P < 0.001; enaΔ151 vs. enaΔ151/DAAMΔORF, P = 0.09; enaΔ151/DAAMΔORF with or without UAS-Chic, P = 0.063. Boxes encompass the values in between the first and third quartiles; whiskers are ±1.5 IQR; median (line), mean (blue triangle), and outliers (red diamond). n.s., not significant. (J) Suggested working model for the regulation of actin dynamics during developmental axon regrowth and during in vitro sprouting.
Here we found that both Ena and Chic are required for axon regrowth, but to our surprise not for initial axon outgrowth. Furthermore, none of the formins DAAM, Frl, and Dia, nor members of the branched nucleator complex Arp2/3, seem to be required for initial axon growth. This was either determined directly in the case of DAAM (Fig. S3 C), Frl (Fig. S3 D), and Arp3 (data not shown), or deduced from the normal adult axon morphology in the case of Dia (Fig. S3 F) and the remaining Arp2/3 members tested (Fig. S4, E–G). This result seems counterintuitive; how can a neuron extend normally without the actin dynamics that are thought to be required for a functional growth cone? There are several possible explanations for this finding: (1) it is possible that other members of the formin family that we did not check due to their low expression levels are sufficient to drive axon growth; (2) we cannot rule out the possibility of RNA or protein perdurance of Ena, DAAM, or Frl such that they are still active during initial axon growth. While in neuroblast clones the phenomenon of RNA/protein perdurance is normally not so common because cells undergo many rounds of division, if the RNA or protein are very stable, this is formally possible; (3) neurons may not require a growth cone during all forms of axon growth. Indeed, Sánchez-Soriano and Prokop (2005) have previously demonstrated that while pioneer axons exhibit an elaborate growth cone, follower axons exhibit a much reduced and structurally different growth cone. It is generally believed that pioneer neurons are required for the normal growth and pathfinding of follower axons (Lin et al., 1995; Sánchez-Soriano and Prokop, 2005). Because the generation of MARCM clones involves mitotic recombination, which we induced at 24 h after egg laying, it seems likely that pioneer neurons were born before clone generation. Therefore, it is possible that pioneer neurons are still heterozygous and thus grow normally, while the later-born neurons send their axons alongside the pioneer axon and therefore do not necessarily require a growth cone.
Another seemingly counterintuitive finding is that perturbing the well-established nucleators, Arp2/3 and formins, does not affect regrowth in vivo. Since actin elongation in the absence of nucleation is unlikely, we suggest three nonmutually exclusive explanations. First, Ena was shown to nucleate de novo actin filaments in vitro (reviewed in Bear and Gertler, 2009). While such a function was not established in vivo, it is possible that Ena acts as the main nucleator in γ-neurons. Second, another known nucleator is Spire (Chesarone and Goode, 2009). While RNAi for Spire did not show a regrowth defect (data not shown), the limited efficiency of RNAi in γ-neurons precludes us from conclusively ruling out its possible contribution. Finally, redundancy might exist between different nucleators. Further research is required in order to discriminate between the above possibilities.
Our results suggest that DAAM and Ena can compensate for the loss of the other (Fig. 4 J). This is especially interesting since they belong to different protein families and their functions therefore only partially overlap. While the actin elongation activity of both was shown to be accelerated by profilin (Chic), they do so using different mechanisms (Bear and Gertler, 2009; Chesarone and Goode, 2009; Shekhar et al., 2016). Since both Ena and formins bind F-actin barbed end, presumably at the same physical location, it stands to reason that they would not function together, but they have been shown to interact. For example, in Drosophila, the formin Dia and Ena can each influence the cellular localization of the other, and the ratio between them modulates the balance between filopodia and lamellipodia (Homem and Peifer, 2009). In cultured Drosophila embryonic neurons, DAAM and Ena colocalize to the neurite growing tip and ena loss of function can strongly suppress a DAAM gain of function phenotype (Matusek et al., 2008). Furthermore, Gonçalves-Pimentel et al. (2011) have shown genetic interaction between DAAM and Ena during filopodia formation in Drosophila. While heterozygotes for either ena or DAAM mutations showed normal filopodia numbers, double heterozygotes had significantly reduced fillopodia numbers, comparable with those displayed by ena or DAAM single homozygous mutants. Finally, Ena and formins were clearly shown to compensate for one another in mouse cortical neurons, where the loss of Ena/VASP leads to loss of filopodia and failure to grow neurites, which can be reversed by ectopic expression of the formin mDia2 (Dent et al., 2007). Further exploration is needed to determine whether, in γ-neurons, Ena and DAAM are functionally redundant or additionally have inherently different molecular/cellular functions.
The suggested bidirectional compensatory relationship opens up a new avenue in understanding the complex relationship between different actin regulators during different phases of neuronal growth in vivo. It also suggests that under normal conditions, different growth paradigms use distinct actin elongation factors, but that it may be possible to overcome growth inhibition and increase intrinsic growth ability of neurons by manipulating the balance of different actin assembly–related proteins.
Materials and methods
Generation of MARCM clones
Newly hatched larvae (24 h after egg laying) were heat-shocked for 1 h at 37°C (Lee and Luo, 1999) and dissected at the indicated developmental time points.
Immunostaining
For in vivo experiments, brains were dissected in ringer solution; fixed with 4% PFA at room temperature for 20 min; washed in phosphate buffer with 0.3% Triton X-100; blocked with inactivated goat serum in phosphate buffer with 0.3% Triton X-100 for 30 min; and then subjected to primary (4°C overnight) and secondary (2 h at room temperature) antibody staining. Brains were mounted on Slowfade (S-36936; Invitrogen), and imaged with Zeiss LSM 800 confocal microscope, 40× 1.3 NA oil immersion lens, at 23°C. Images were acquired using ZEN 2.3 and processed with ImageJ (National Institutes of Health).
For in vitro sprouting assay, cells were fixed with 4% PFA for 15 min, permeabilized with 0.1% Triton X-100 for 10 min, and blocked with 3% normal goat serum for 30 min, followed by incubation of primary antibody and secondary antibody for 1 h each.
Primary antibodies included chicken anti-GFP 1:500 (GFP-1020; AVES); mouse monoclonal anti-FasII 1:25 (1D4; Developmental Studies Hybridoma Bank, DSHB); mouse monoclonal anti-chic (chi 1J), 1:25 (DSHB); and mouse monoclonal anti-ena 1:100 (5G2; DSHB).
Secondary antibodies included FITC donkey anti-chicken 1:300 (703–095-155; Jackson Immunoresearch); and Alexa Fluor 647 goat anti-mouse (A-21236; Invitrogen).
Drosophila strains
ena23, ena210, arpc4SH1036, arpc1Q25st, arpc1R337st, SCARΔ37, and Spire RNAi (TRiP.JF03233) were all obtained from the Bloomington Drosophila stock center (Indiana University, Bloomington, IN). UAS-Chic was kindly provided by F. Besse (Institut de Biologie Valrose, Nice, France; Medioni et al., 2014). UAS-DAAM-DADm was kindly provided by J. Mihály (Hungarian Academy of Sciences, Budapest, Hungary). enaLL03568 was previously generated (Schuldiner et al., 2008).
Construction of CRISPR mutant flies
gRNAs were designed to induce large deletion of most of the coding sequence or an indel immediately downstream to the translation initiation site. The two gRNAs were cloned into the pCFD4 plasmid using Transfer-PCR (Port et al., 2014; Port and Bullock, 2016; Erijman et al., 2011; Unger et al., 2010). Primers were designed with pCFD4 overlapping sequences flanking the 20 nucleotide gRNA sequences (N20) as follows: F: 5′-TATATAGGAAAGATATCCGGGTGAACTTCGN20-GTTTAGAGCTAGAAATAGCAAG-3′; R: 5′-ATTTTAACTTGCTATTTCTAGCTCTAAAAC-N20-rev-comp-CGACGTTAAATTGAAAATAGGTC-3′.
Cloned plasmids were injected into attP86Fb landing sites using φC31 integration (BestGene). Injected flies were crossed with nanos-Cas9 flies (Bloomington stock no. 54591). After two generations, single flies were crossed with balancers and checked for deletion or indel using specific primers as listed below.
The following gRNA sequences were used (protospacer adjacent motif sequence is underlined): DAAM: 5′(−): CCTTGGCACTCACCGTGTTGATC; 3′(−): TGGAGGCTGCCGTGGCGGGGCGG; Frl: 5′(+): CCAGCAACCCATGCCCACCACAG; 3′(+): GAGCGAGCCGTACAGGCGGGCGG; Arp3: 5′(+): CCGGCATGCGTAATCGATGTGGG; 3′(−): CCATGACATAATTGATCCGATCC; Chic: 5′(+): TTATGTGGACAACCAACTCCTGG; 3′(−): AAGTTTCTCTACCACGGAAGCGG; Ena: 5′(+): GTGGTGGCACCTGGTCACTCCGG; 3′(−): TTGATAGCTGCAAGGATAGTTGG; Dia: 5′(+):GAGAAAACGAAATCCACGGGCGG; 3′(+): TCGCGGACGCGTGTCACCAACGG.
The following primers were used to sequence the indel/deletion alleles: DAAM: F: 5′-AATGAGCAGTGCGTGATGTG-3′; R: 5′-AAACATATACACCGGGGCCA-3′; Frl: F: 5′-CAGCATCCCCATTCGCATG-3′; R: 5′-TTCGATTCGTTGCCATTGCC-3′; Arp3: F: 5′-CCGGCATGCGTAATCGATGT-3′; R: 5′-GGATCGGATCAATTATGTCA-3′; Chic: F: 5′-GTTCATTTACGGTTCGCTCTT-3′; R: 5′-GGACCGCTGCGAAATGTAATA-3′; Ena: F: 5′-GTGTCTGTGACGCCTCTGCAAA-3′; R: 5′-CATCTGATCCTGCTGCTGCTG-3′; Dia: F: 5′-TCGCCTAGCTATCCAACGAA-3′; R: 5′-ACGCTTAGCTGCTGGATGTA-3′.
Construction of UAS-Ena flies
Isoform D of Ena was amplified from cDNA transcribed from RNA extracted from whole third instar larvae using the primers 5′: ATGACTGAGCAGAGTATTATCGGG and 3′: CGGAGTTTAATCGCAGATAG. cDNA was then cloned into pDONR201 (Invitrogen), inserted into pDEST-UAS-IVS-Syn21-p10aw (Rabinovich et al., 2016), and injected into the 86Fb landing site using φC31 integration (BestGene).
Sprouting assay
L3 brains were dissociated in 10 mg/ml collagenase (Sigma-Aldrich), washed three times with PBS, and resuspended in Schneider’s medium (Sigma-Aldrich) supplemented with 10% heat-inactivated fetal bovine serum and antibiotics (Marmor-Kollet and Schuldiner, 2016). Dissociated cells were plated in glass-bottom 96-well plates coated with poly-Lysine (MatTek) at ~10 brains/well in a volume of ~30 µl in culturing media. 1 h after plating, media (control or containing SMIFH2) were added to a total volume of 200 µl. Final concentration was 10 µM or 25 µM SMIFH2 (Merck). Fluorescent cells were imaged 2 d after plating (DIV), and neurite length was calculated using the Simple Neurite Tracer plugin in Fiji (Longair et al., 2011; Schindelin et al., 2012). For Ena antibody staining, the above protocol was followed with the exception of the plate being coated with 0.5 mg/ml concanavalin A (Sigma-Aldrich).
Statistical analysis
For the quantification of developmental regrowth in MARCM clones (Figs. 1, 2, and 4), we determined the γ lobe occupancy by comparing the clonal (GFP) vs. non clonal (FasII staining) in the z-plane cross-section. To calculate the regrowth index, we then divided the lobe occupancy of the clonal axons at a distal section by a proximal section (Yaniv et al., 2012). A similar approach was done to calculate the growth index of L3 γ lobe, with both the dorsal and medial lobes examined (Figs. S1 and S2). Statistical analysis was performed by a one-way ANOVA including all groups followed by a Dunnett’s (Fig. 1) or Tukey (Figs. 2 and 4) post hoc test. Two-tailed Student’s t test analysis was performed on L3 growth index in Figs. S1 and S2.
For sprouting analysis, statistical analysis was performed by a one-way ANOVA including all groups followed by a Tukey post hoc test (Fig. 3 F; and Fig. S5, D and H) or two-tailed Student’s t test (Fig. 3, C and I). For comparison of the effect of SMIFH2 significance on different genotypes (Fig. 3 L and Fig. S5 L), we performed the Cohen’s d effect size test between untreated and treated. Significance was calculated as P < 0.05. For antibody staining, in each image the intensity of Ena staining was normalized to the background (all images were taken under the same conditions), and comparison between groups was done using the two-tailed Student’s t test (Fig. S6). For all parametric tests, data distribution was assumed to be normal, but this was not formally tested.
Drosophila genotypes
hsFLP is y,w,hsFLP122; CD8 is UAS-mCD8::GFP; 19A, G13, 40A, and 2A are flippase recogniton targets on X, 2R, 2L, and 3L, respectively; Gal80 is TubP-Gal80. Males and females were used interchangeably, but only the female genotype is mentioned, except when 19A is used. Then only females were taken.
Fig. 1
(D, F, H) hsFlp, CD8/+; Gal80, 40A/40A; 71G10-Gal4/+. (E, G, I) hsFlp, CD8/+; Gal80, 40A/40A, chicΔ29-33; 71G10-Gal4/+. (J) hsFlp, CD8/+; Gal80, 40A/40A; OK107-Gal4/+. (K) hsFlp, CD8/+; Gal80, 40A/40A, chicΔ29-33; OK107-Gal4/+. (M) hsFlp, CD8/+; Gal80, 40A/40A, chicΔ29-33; 71G10-Gal4/UAS-Chic.
Fig. 2
(A) hsFlp, CD8/+; 71G10-Gal4, G13, Gal80/G13. (B) hsFlp, CD8/+; 71G10-Gal4, G13, Gal80/G13, enaΔ151. (C) hsFlp, CD8/+; 71G10-Gal4, G13, Gal80/G13, enaΔ151; UAS-Ena/+. (D) hsFlp, CD8/+; Gal80, 40A/40A, chicΔ29-33; 71G10-Gal4/UAS-Ena. (E) hsFlp, CD8/+; 71G10-Gal4, G13, Gal80/G13, enaΔ151; UAS-Chic/+. (G) hsFlp, Gal80, 19A/DAAMΔORF,19A;CD8, 71G10-Gal4/+. (H) hsFlp, CD8/+; 71G10-Gal4/+; Gal80, 2A/FrlΔORF, 2A. (I) hsFlp, Gal80, 19A/DAAMΔORF,19A;71G10-Gal4, CD8/+; Gal80, 2A/FrlΔORF, 2A.
Fig. 4
(A, D) hsFlp, CD8/+; 71G10-Gal4, G13, Gal80/G13. (B, E) hsFlp, CD8/+; 71G10-Gal4, G13, Gal80/G13, enaΔ151. (C, F) hsFlp, Gal80, 19A/DAAMΔORF,19A; G13, Gal80/G13, enaΔ151; 71G10-Gal4, CD8/+. (G) hsFlp, Gal80, 19A/DAAMΔORF,19A; 71G10, G13, Gal80/CD8, G13, enaΔ151; UAS-Chic/+. (H) hsflp, CD8/+; 71G10-Gal4, G13, Gal80/G13, enaΔ151, UAS-DAAM-DADm.
Fig. S1
(B) hsFlp, CD8/+; Gal80, 40A/40A; 71G10-Gal4/+. (C) hsFlp, CD8/+; Gal80, 40A/40A, chic05205; 71G10-Gal4/+. (D) hsFlp, CD8/+; Gal80, 40A/40A, chicΔ29-33; 71G10-Gal4/+. (G) hsFlp, CD8/+; Gal80, 40A/40A; 71G10-Gal4/+.
Fig. S2
(C) hsFlp, CD8/+; 71G10-Gal4, G13, Gal80/G13, ena23. (D) hsFlp, CD8/+; 71G10-Gal4, G13, Gal80/G13, ena210. (E) hsFlp, CD8/+; 71G10-Gal4, G13, Gal80/G13, enaLL03568. (G, J) hsFlp, CD8/+; 71G10-Gal4, G13, Gal80/G13. (H, I) hsFlp, CD8/+; 71G10-Gal4, G13, Gal80/G13, enaΔ151.
Fig. S3
(C) hsFlp, Gal80, 19A/DAAMΔORF,19A;CD8, 71G10-Gal4/+. (D) hsFlp, CD8/+; 71G10-Gal4/+; Gal80, 2A/FrlΔORF, 2A. (E) hsFlp, Gal80, 19A/DAAMΔORF,19A;201Y-Gal4, CD8/+; Gal80, 2A/FrlΔORF, 2A. (F) hsFlp, CD8/+; Gal80, 40A/diaΔ33-126, 40A; 71G10-Gal4/+.
Fig. S4
(C) hsFlp, CD8/+; 71G10-Gal4/+; Gal80, 2A/2A. (D) hsFlp, CD8/+; 71G10-Gal4/+; Gal80, 2A/arp3Δ30-33, 2A. (E) hsFlp, CD8/+; Gal80, 40A/arpc4SH1036, 40A; 71G10-Gal4/+. (F) hsFlp, CD8/+; Gal80, 40A/arpc1Q25st, 40A; 71G10-Gal4/+. (G) hsFlp, CD8/+; Gal80, 40A/arpc1R337st, 40A; 71G10-Gal4/+. (H) hsFlp, CD8/+; Gal80, 40A/SCARΔ37, 40A; 71G10-Gal4/+.
Online supplemental material
Fig. S1 shows the design of the chicΔ29-31 CRISPR/Cas9 mutant allele, that it is null, and that chic is not required for initial larval γ growth. Fig. S2 shows expression of actin elongators during γ-neuron remodeling, and phenotypic analyses of additional Ena mutants. Fig. S3 depicts schematic descriptions of formin CRISPR/Cas9 alleles and additional formin phenotypes. Fig. S4 shows that the Arp2/3 complex is not required for developmental axon regrowth of MB γ-neurons. Fig. S5 shows supporting analyses of SMIFH2 sensitivity in sprouting assays. Fig. S6 shows that DAAM mutant neurons express higher levels of Ena in vitro.
Acknowledgments
We thank R. Rotkopf for advice on statistics, and F. Besse, J. Mihály, and the Bloomington Stock Center for reagents. Monoclonal antibodies were obtained from the Developmental Studies Hybridoma Bank developed under the auspices of the Eunice Kennedy Shriver National Institute of Child Health and Human Development and maintained by the University of Iowa.
This work was supported by the European Research Council, consolidator grant #615906 “AxonGrowth.” O. Schuldiner is the Incumbent of the Professor Erwin Netter Professorial Chair of Cell Biology.
The authors declare no competing financial interests.
Author contributions:S.P. Yaniv conceptualized, designed, performed, and analyzed the experiments and wrote the manuscript; H. Meltzer conceptualized, designed, and performed experiments and wrote the revised manuscript; I. Alyagor provided the RNA-sequencing data and helped with its analysis; O. Schuldiner led the project, conceptualized and designed the experiments, interpreted the results, and wrote the manuscript.
References
- Ahern-Djamali S.M., Comer A.R., Bachmann C., Kastenmeier A.S., Reddy S.K., Beckerle M.C., Walter U., and Hoffmann F.M.. 1998. Mutations in Drosophila enabled and rescue by human vasodilator-stimulated phosphoprotein (VASP) indicate important functional roles for Ena/VASP homology domain 1 (EVH1) and EVH2 domains. Mol. Biol. Cell. 9:2157–2171. 10.1091/mbc.9.8.2157 [DOI] [PMC free article] [PubMed] [Google Scholar]
- Alyagor I., Berkun V., Keren-Shaul H., Marmor-Kollet N., David E., Mayseless O., Issman-Zecharya N., Amit I., and Schuldiner O.. 2018. Combining Developmental and Perturbation-Seq Uncovers Transcriptional Modules Orchestrating Neuronal Remodeling. Dev. Cell. 47:38–52.e6. 10.1016/j.devcel.2018.09.013 [DOI] [PMC free article] [PubMed] [Google Scholar]
- Barzik M., Kotova T.I., Higgs H.N., Hazelwood L., Hanein D., Gertler F.B., and Schafer D.A.. 2005. Ena/VASP proteins enhance actin polymerization in the presence of barbed end capping proteins. J. Biol. Chem. 280:28653–28662. 10.1074/jbc.M503957200 [DOI] [PMC free article] [PubMed] [Google Scholar]
- Bear J.E., and Gertler F.B.. 2009. Ena/VASP: towards resolving a pointed controversy at the barbed end. J. Cell Sci. 122:1947–1953. 10.1242/jcs.038125 [DOI] [PMC free article] [PubMed] [Google Scholar]
- Bear J.E., Svitkina T.M., Krause M., Schafer D.A., Loureiro J.J., Strasser G.A., Maly I.V., Chaga O.Y., Cooper J.A., Borisy G.G., and Gertler F.B.. 2002. Antagonism between Ena/VASP proteins and actin filament capping regulates fibroblast motility. Cell. 109:509–521. 10.1016/S0092-8674(02)00731-6 [DOI] [PubMed] [Google Scholar]
- Bradke F., Fawcett J.W., and Spira M.E.. 2012. Assembly of a new growth cone after axotomy: the precursor to axon regeneration. Nat. Rev. Neurosci. 13:183–193. 10.1038/nrn3176 [DOI] [PubMed] [Google Scholar]
- Breitsprecher D., and Goode B.L.. 2013. Formins at a glance. J. Cell Sci. 126:1–7. 10.1242/jcs.107250 [DOI] [PMC free article] [PubMed] [Google Scholar]
- Chesarone M.A., and Goode B.L.. 2009. Actin nucleation and elongation factors: mechanisms and interplay. Curr. Opin. Cell Biol. 21:28–37. 10.1016/j.ceb.2008.12.001 [DOI] [PMC free article] [PubMed] [Google Scholar]
- Cooley L., Verheyen E., and Ayers K.. 1992. chickadee encodes a profilin required for intercellular cytoplasm transport during Drosophila oogenesis. Cell. 69:173–184. 10.1016/0092-8674(92)90128-Y [DOI] [PubMed] [Google Scholar]
- Dent E.W., Kwiatkowski A.V., Mebane L.M., Philippar U., Barzik M., Rubinson D.A., Gupton S., Van Veen J.E., Furman C., Zhang J., et al. 2007. Filopodia are required for cortical neurite initiation. Nat. Cell Biol. 9:1347–1359. 10.1038/ncb1654 [DOI] [PubMed] [Google Scholar]
- Erijman A., Dantes A., Bernheim R., Shifman J.M., and Peleg Y.. 2011. Transfer-PCR (TPCR): a highway for DNA cloning and protein engineering. J. Struct. Biol. 175:171–177. 10.1016/j.jsb.2011.04.005 [DOI] [PubMed] [Google Scholar]
- Ertürk A., Hellal F., Enes J., and Bradke F.. 2007. Disorganized microtubules underlie the formation of retraction bulbs and the failure of axonal regeneration. J. Neurosci. 27:9169–9180. 10.1523/JNEUROSCI.0612-07.2007 [DOI] [PMC free article] [PubMed] [Google Scholar]
- Evangelista M., Zigmond S., and Boone C.. 2003. Formins: signaling effectors for assembly and polarization of actin filaments. J. Cell Sci. 116:2603–2611. 10.1242/jcs.00611 [DOI] [PubMed] [Google Scholar]
- Gertler F.B., Doctor J.S., and Hoffmann F.M.. 1990. Genetic suppression of mutations in the Drosophila abl proto-oncogene homolog. Science. 248:857–860. 10.1126/science.2188361 [DOI] [PubMed] [Google Scholar]
- Gombos R., Migh E., Antal O., Mukherjee A., Jenny A., and Mihály J.. 2015. The Formin DAAM Functions as Molecular Effector of the Planar Cell Polarity Pathway during Axonal Development in Drosophila. J. Neurosci. 35:10154–10167. 10.1523/JNEUROSCI.3708-14.2015 [DOI] [PMC free article] [PubMed] [Google Scholar]
- Gomez T.M., and Letourneau P.C.. 2014. Actin dynamics in growth cone motility and navigation. J. Neurochem. 129:221–234. 10.1111/jnc.12506 [DOI] [PMC free article] [PubMed] [Google Scholar]
- Gonçalves-Pimentel C., Gombos R., Mihály J., Sánchez-Soriano N., and Prokop A.. 2011. Dissecting regulatory networks of filopodia formation in a Drosophila growth cone model. PLoS One. 6:e18340 10.1371/journal.pone.0018340 [DOI] [PMC free article] [PubMed] [Google Scholar]
- Homem C.C.F., and Peifer M.. 2009. Exploring the roles of diaphanous and enabled activity in shaping the balance between filopodia and lamellipodia. Mol. Biol. Cell. 20:5138–5155. 10.1091/mbc.e09-02-0144 [DOI] [PMC free article] [PubMed] [Google Scholar]
- Kovar D.R., Harris E.S., Mahaffy R., Higgs H.N., and Pollard T.D.. 2006. Control of the assembly of ATP- and ADP-actin by formins and profilin. Cell. 124:423–435. 10.1016/j.cell.2005.11.038 [DOI] [PubMed] [Google Scholar]
- Krause M., Dent E.W., Bear J.E., Loureiro J.J., and Gertler F.B.. 2003. Ena/VASP proteins: regulators of the actin cytoskeleton and cell migration. Annu. Rev. Cell Dev. Biol. 19:541–564. 10.1146/annurev.cellbio.19.050103.103356 [DOI] [PubMed] [Google Scholar]
- Lee T., and Luo L.. 1999. Mosaic analysis with a repressible cell marker for studies of gene function in neuronal morphogenesis. Neuron. 22:451–461. 10.1016/S0896-6273(00)80701-1 [DOI] [PubMed] [Google Scholar]
- Lee T., Lee A., and Luo L.. 1999. Development of the Drosophila mushroom bodies: sequential generation of three distinct types of neurons from a neuroblast. Development. 126:4065–4076. [DOI] [PubMed] [Google Scholar]
- Lin D.M., Auld V.J., and Goodman C.S.. 1995. Targeted neuronal cell ablation in the Drosophila embryo: pathfinding by follower growth cones in the absence of pioneers. Neuron. 14:707–715. 10.1016/0896-6273(95)90215-5 [DOI] [PubMed] [Google Scholar]
- Longair M.H., Baker D.A., and Armstrong J.D.. 2011. Simple Neurite Tracer: open source software for reconstruction, visualization and analysis of neuronal processes. Bioinformatics. 27:2453–2454. 10.1093/bioinformatics/btr390 [DOI] [PubMed] [Google Scholar]
- Mahar M., and Cavalli V.. 2018. Intrinsic mechanisms of neuronal axon regeneration. Nat. Rev. Neurosci. 19:323–337. 10.1038/s41583-018-0001-8 [DOI] [PMC free article] [PubMed] [Google Scholar]
- Marmor-Kollet N., and Schuldiner O.. 2016. Contrasting developmental axon regrowth and neurite sprouting of Drosophila mushroom body neurons reveals shared and unique molecular mechanisms. Dev. Neurobiol. 76:262–276. 10.1002/dneu.22312 [DOI] [PMC free article] [PubMed] [Google Scholar]
- Matusek T., Gombos R., Szécsényi A., Sánchez-Soriano N., Czibula A., Pataki C., Gedai A., Prokop A., Raskó I., and Mihály J.. 2008. Formin proteins of the DAAM subfamily play a role during axon growth. J. Neurosci. 28:13310–13319. 10.1523/JNEUROSCI.2727-08.2008 [DOI] [PMC free article] [PubMed] [Google Scholar]
- Medioni C., Ramialison M., Ephrussi A., and Besse F.. 2014. Imp promotes axonal remodeling by regulating profilin mRNA during brain development. Curr. Biol. 24:793–800. 10.1016/j.cub.2014.02.038 [DOI] [PubMed] [Google Scholar]
- Ng J., and Luo L.. 2004. Rho GTPases regulate axon growth through convergent and divergent signaling pathways. Neuron. 44:779–793. 10.1016/j.neuron.2004.11.014 [DOI] [PubMed] [Google Scholar]
- Pasic L., Kotova T., and Schafer D.A.. 2008. Ena/VASP proteins capture actin filament barbed ends. J. Biol. Chem. 283:9814–9819. 10.1074/jbc.M710475200 [DOI] [PMC free article] [PubMed] [Google Scholar]
- Port F., and Bullock S.L.. 2016. Expansion of the CRISPR toolbox in an animal with tRNA-flanked Cas9 and Cpf1 gRNAs. bioRxiv. 046417 10.1101/046417 [DOI] [Google Scholar]
- Port F., Chen H.M., Lee T., and Bullock S.L.. 2014. Optimized CRISPR/Cas tools for efficient germline and somatic genome engineering in Drosophila. Proc. Natl. Acad. Sci. USA. 111:E2967–E2976. 10.1073/pnas.1405500111 [DOI] [PMC free article] [PubMed] [Google Scholar]
- Prokop A., Beaven R., Qu Y., and Sánchez-Soriano N.. 2013. Using fly genetics to dissect the cytoskeletal machinery of neurons during axonal growth and maintenance. J. Cell Sci. 126:2331–2341. 10.1242/jcs.126912 [DOI] [PubMed] [Google Scholar]
- Rabinovich D., Yaniv S.P., Alyagor I., and Schuldiner O.. 2016. Nitric Oxide as a Switching Mechanism between Axon Degeneration and Regrowth during Developmental Remodeling. Cell. 164:170–182. 10.1016/j.cell.2015.11.047 [DOI] [PMC free article] [PubMed] [Google Scholar]
- Ramon y Cajal S. 1928. Degeneration and regeneration of the nervous system.
- Reinhard M., Giehl K., Abel K., Haffner C., Jarchau T., Hoppe V., Jockusch B.M., and Walter U.. 1995. The proline-rich focal adhesion and microfilament protein VASP is a ligand for profilins. EMBO J. 14:1583–1589. 10.1002/j.1460-2075.1995.tb07146.x [DOI] [PMC free article] [PubMed] [Google Scholar]
- Rottner K., and Schaks M.. 2019. Assembling actin filaments for protrusion. Curr. Opin. Cell Biol. 56:53–63. 10.1016/j.ceb.2018.09.004 [DOI] [PubMed] [Google Scholar]
- Sánchez-Soriano N., and Prokop A.. 2005. The influence of pioneer neurons on a growing motor nerve in Drosophila requires the neural cell adhesion molecule homolog FasciclinII. J. Neurosci. 25:78–87. 10.1523/JNEUROSCI.2377-04.2005 [DOI] [PMC free article] [PubMed] [Google Scholar]
- Schindelin J., Arganda-Carreras I., Frise E., Kaynig V., Longair M., Pietzsch T., Preibisch S., Rueden C., Saalfeld S., Schmid B., et al. 2012. Fiji: an open-source platform for biological-image analysis. Nat. Methods. 9:676–682. 10.1038/nmeth.2019 [DOI] [PMC free article] [PubMed] [Google Scholar]
- Schuldiner O., Berdnik D., Levy J.M., Wu J.S., Luginbuhl D., Gontang A.C., and Luo L.. 2008. piggyBac-based mosaic screen identifies a postmitotic function for cohesin in regulating developmental axon pruning. Dev. Cell. 14:227–238. 10.1016/j.devcel.2007.11.001 [DOI] [PMC free article] [PubMed] [Google Scholar]
- Shekhar S., Pernier J., and Carlier M.-F.. 2016. Regulators of actin filament barbed ends at a glance. J. Cell Sci. 129:1085–1091. 10.1242/jcs.179994 [DOI] [PubMed] [Google Scholar]
- Tedeschi A., and Bradke F.. 2017. Spatial and temporal arrangement of neuronal intrinsic and extrinsic mechanisms controlling axon regeneration. Curr. Opin. Neurobiol. 42:118–127. 10.1016/j.conb.2016.12.005 [DOI] [PubMed] [Google Scholar]
- Unger T., Jacobovitch Y., Dantes A., Bernheim R., and Peleg Y.. 2010. Applications of the Restriction Free (RF) cloning procedure for molecular manipulations and protein expression. J. Struct. Biol. 172:34–44. 10.1016/j.jsb.2010.06.016 [DOI] [PubMed] [Google Scholar]
- Wang A.L., Yuan M., and Neufeld A.H.. 2007. Age-related changes in neuronal susceptibility to damage: comparison of the retinal ganglion cells of young and old mice before and after optic nerve crush. Ann. N. Y. Acad. Sci. 1097:64–66. 10.1196/annals.1379.027 [DOI] [PubMed] [Google Scholar]
- Wills Z., Marr L., Zinn K., Goodman C.S., and Van Vactor D.. 1999. Profilin and the Abl tyrosine kinase are required for motor axon outgrowth in the Drosophila embryo. Neuron. 22:291–299. 10.1016/S0896-6273(00)81090-9 [DOI] [PubMed] [Google Scholar]
- Yaniv S.P., Issman-Zecharya N., Oren-Suissa M., Podbilewicz B., and Schuldiner O.. 2012. Axon regrowth during development and regeneration following injury share molecular mechanisms. Curr. Biol. 22:1774–1782. 10.1016/j.cub.2012.07.044 [DOI] [PubMed] [Google Scholar]
- Yaron A., and Schuldiner O.. 2016. Common and Divergent Mechanisms in Developmental Neuronal Remodeling and Dying Back Neurodegeneration. Curr. Biol. 26:R628–R639. 10.1016/j.cub.2016.05.025 [DOI] [PMC free article] [PubMed] [Google Scholar]


