

Abstract
Infiltration of acute lymphoblastic leukemia (ALL) blasts into the CNS remains as a major clinical problem, with high risk for chemotherapy-resistant relapse and treatment-related morbidity. Despite the common inclusion of CNS prophylaxis treatments in therapy regimens, there are significant gaps in understanding the mechanisms that mediate leukemia cell entry into the CNS as well as roles for resident cells in the brain. In this study, we employ a xenograft model of human B cell precursor (BCP)-ALL in immunocompromised mice. This model system recapitulates key pathological characteristics of leptomeningeal involvement seen in patients and provides insights into rare cases that involve parenchymal invasion. We examine the infiltration of engrafted leukemia blasts into brains of recipient mice and provide evidence that the interaction between blasts and brain resident cells causes aberrant activation of host cells in the brain microenvironment. BCP-ALL blasts also release multiple cytokines and exosomes containing IL-15 that bind and are internalized by astrocytes and brain vessel endothelial cells. Leukemic invasion is linked to production of VEGF-AA by astrocytes and disruption of the blood-brain-barrier (BBB) integrity. Knockdown of either IL-15 or IL-15Rα in the NALM6 cell line decreases CNS infiltration in engrafted mice. These results provide important insights into the multiple mechanisms by which lymphoblasts modulate the brain microenvironment to breach the BBB for metastatic invasion.
Keywords: acute lymphoblastic leukemia, astrocyte, blood-brain barrier, brain parenchyma, CNS metastasis, microglia
1. INTRODUCTION
As the most common childhood malignancy, precursor B acute lymphoblastic leukemia (BCP-ALL) is treated with intensified therapies that may lead to long-term survival rates in more than 90% of patients.1 However, disease relapse is a common problem and may occur in sanctuary sites such as the CNS. Although CNS-directed therapy is routine in BCP-ALL treatment, the CNS risk classification determines the intensity of CNS-directed therapy. Detection of blasts in CSF at diagnosis is associated with greater risk for relapse,2 which is characterized by >5 blasts/high-power field in the CSF, ocular or cranial nerve involvement, or evidence for hypothalamic syndrome.3,4 Treatment options may include cranial irradiation, additional doses of intrathecal chemotherapy, pegaspargase, utilization of dexamethasone during induction, high-dose methotrexate during interim maintenance, or other modifications of systemic chemotherapy.5–7 Higher intensity CNS-directed therapy is associated with long-term neurological consequences that include cognitive decline, leukoencephalopathy, and secondary malignancies.8,9 Additionally, the majority of CNS relapses occur in patients who were CNS-negative at initial diagnosis.10,11 Therefore, it is important to determine a more precise CNS risk assessment algorithm for CNS therapy to avoid over-or under treatment of patients with BCP-ALL. Although transcriptional profile and aberrant pathways have been identified in CNS leukemia,12–15 information about molecular mechanisms for leukemia entry into the CNS and the links between blasts and the brain microenvironment remains limited.16
A distinguishing feature of the brain vasculature is the blood-brain barrier (BBB), which limits the access of large molecules and activated immune cells to preserve brain function. Anatomically, the BBB is comprised of brain microvascular endothelial cells, pericytes, and astrocyte endfeet.17,18 Cytokine and chemokine-mediated signaling play critical roles in the multistep processes by which immune cells can access to CNS under inflammatory conditions. There is intriguing evidence for the interplay between infiltrating immune cells that produce IL-1β, TNF, or IL-1519–21 and other soluble factors, and the production of permeability factors (thymidine phosphorylase; TYMP, vascular endothelial growth factor-A; VEGF-A) by astrocytes and other resident brain cells.22–24 Also, the CXCR4 and CCR7 signaling pathways have been implicated in acute leukemia cell targeting to skull bone marrow and meningeal spaces.25–27 Emerging evidence also suggests that membrane-bound carriers (extracellular vesicles, exosomes) released by cancer cells can mediate cell-cell communication via the delivery of their contents, proteins, mRNAs, and microRNAs28–30 and potentially alter the microenvironment at extramedullary sites.31
In this study, we address mechanisms for BCP-ALL invasion into the CNS by using a human leukemia xenograft model in NSG mice. We found that meningeal spaces harbored BCP-ALL blasts after a week of engraftment. Massive infiltration and colonization at brain parenchyma was not observed until late stages of engraftment approaching end-stage disease, consistent with the relative rarity of intracerebral metastases reported in human patients.32–38 These events were associated with reduced integrity of the BBB and activation of endothelial cells and astrocytes in the brain. We report that brain endothelial cells and astrocytes can be modulated by exosomes released from leukemia blasts and upregulate VEGF-A for sequential BBB disruption with leukemia CNS invasion.
2. MATERIALS AND METHODS
2.1. Cell culture and reagents
BCP-ALL cell lines (NALM6 and NALM6-GFP) were grown in RPMI 1640 medium (11875; Gibco, Thermo Fisher, Waltham, MA, USA) containing 10% heat-inactivated FBS (Gemini Bioproducts, West Sacramento, CA, USA), 50 U/mL penicillin-streptomycin, 2 mM L-glutamine, and 50 mM β-mercaptoethanol (Invitrogen, Carlsbad, CA, USA). Mouse brain endothelial cells (bEnd.3) were obtained from ATCC (Manassas, VA, USA) and grown in Dulbecco’s Modified Eagle’s Medium (30–2002; ATCC) with 10% FBS. Mouse astrocytes (ScienCell, Carlsbad, CA, USA) were cultured in Astrocyte Medium (#1831; ScienCell) with Astrocyte Growth Supplement-animal (#1882; ScienCell). Recombinant human IL-15 and mouse TNF-α (STEMCELL, Vancouver, Canada), ODN2395 (tlrl-2395) were obtained from InvivoGen (San Diego, CA, USA).
2.2. Leukemia xenograft mouse model
NOD.Cg-Prkdcscid scid Il2rgtm1Wjl/SzJ (NSG) female mice (8–10 weeks old; The Jackson Laboratory, Bar Harbor, ME, USA) were engrafted by tail-vein injection (1 × 10⁶ cells). Mice were monitored daily for symptoms of morbidity. In experiments to quantitate tissue-infiltrating leukemia burden, mice were anesthetized with sodium pentobarbital (i.p. 40 mg/kg) and intravenously perfused with ice-cold PBS for 10 min to clear leukemia cells circulating in blood prior to euthanization and organ harvest. All animal procedures and studies were approved by the UNM Animal Care and Use Committee.
2.3. Flow cytometry analysis
Single-cell suspensions were prepared from harvested mouse livers and brains after dicing into small pieces, incubation in 0.5 mg/mL of collagenase D (11088866001; Roche, Basel, Switzerland), and 0.01 mg/mL of DNase I (10104159001; Roche) at 37°C for 30 min, and filtration through 70-μm cell strainers. After Percoll (017-0891-01; GE Healthcare, Little Chalfont, UK) gradient centrifugation, cells at the interphase were collected, washed, and resuspended in FACS buffer (PBS with 1% FBS). Contaminating red blood cells were lysed in ammonium-chloride-potassium (ACK) buffer for 5 min. Single-cell suspensions (0.5–1 × 10⁶) were stained with anti-hCD10 (HI10a), antimCD45 (30-F11), or anti-hCD19 (HIB19) from BioLegend (San Diego, CA, USA) at 1:1000 dilution in FACS buffer for 30 min on ice and washed 2× with FACS buffer. Cells were resuspended in FACS buffer containing 300 μM of DAPI (D1306; Invitrogen, Carlsbad, CA, USA) and analyzed on an LSRFortessa cell analyzer (BD Biosciences, San Jose, CA, USA). Data were analyzed on FlowJo v9.7.6 (Tree Star, Ashland, OR, USA). For intracellular staining, cells were fixed with Fixation/Permeabilization solutions (554714; BD Biosciences) for 20 min on ice, washed twice and stained with anti-hIL-15 (ab55276; Abcam, Cambridge, United Kingdom) or anti-hIL-15Rα (JM7A4; BioLegend) at 1:1000 in Perm/Wash Buffer (554714; BD Biosciences) for 30 min on ice. Cells were washed and stained with anti-mouse IgG-Alexa Fluor 647 antibody at 1:5000 in for 300020030min on ice. After 2 washes, cells were analyzed on an LSRFortessa (BD Biosciences).
2.4. Exosome preparation
NALM6 cells (10 × 106) were plated into T25 flasks with 10 mL of 0% FBS/RPMI. After 24 h, the culture medium was collected and centrifuged at 2000 rpm for 10 min at 4°C to remove cell debris. The supernatants were filtered through 0.22-μm filter to remove cellular debris and large vesicles, then centrifuged at 100,000 rpm (TLA100 tabletop ultracentrifuge, Beckman, Brea, CA, USA) for 1.5 h at 4°C. Resuspended exosome pellets were used for experiments. To obtain labeled exosomes, NALM6 cells were incubated for 15 min with 5 μM Vybrant DiO membrane dye (V22886; Molecular Probes, Eugene, OR, USA) and cultured in FBS-free medium for 24 h prior to exosome isolation.
2.5. Electron microscopy
Exosomes were fixed with 2% paraformaldehyde (P6148; Sigma Aldrich, St. Louis, MO, USA) and adsorbed to formvar-carbon-coated nickel grids. Samples were washed with PBS and 50 mM glycine and then blocked with 0.1% bovine serum albumin (BSA) in PBS for 10 min. For CD81 labeling, the samples were immunostained with mouse anti-human CD81 antibody (sc-7637; Santa Cruz Biotechnology, Dallas, TX, USA) followed by washes with 0.1% BSA and secondary labeling with 6-nm colloidal gold Affinipure goat anti-mouse IgG (H+L) (115-195-146; Jackson ImmunoResearch, Cambridgeshire, UK). The samples were post-fixed with 1% glutaraldehyde (G5882; Sigma-Aldrich) and washed with PBS. For contrast, samples were stained with uranyl oxalate and then embedded with methyl cellulose-uranyl acetate for 10 min on ice. Images were acquired on a Hitachi 7700 transmission electron microscope (Hitachi, Chiyoda, Tokyo, Japan).
2.6. Western blotting
Exosome pellets were lysed in lysis buffer (0.5% Triton X-100, 150 mM NaCl, 100 mM Tris-HCL pH7.4) containing protease inhibitors (78440; Thermo Fisher) and Pierce LDS nonreducing sample buffer (84788; Thermo Fisher). Samples were loaded onto a 4–20% Mini-PROTEAN gel (456–8093; Bio-Rad, Hercules, CA, USA) for SDS-PAGE, then transferred to nitrocellulose. Membranes were blocked with 5% nonfat dry milk in TBS for 2 h at RT and incubated overnight at 4°C with anti-hCD81 antibody (10630D; Thermo Fisher) at 1:250 dilution in 0.1% TBST buffer. Membranes were washed with TBST buffer 3 times, then incubated with HRP-conjugated secondary antibodies for 1 h at RT. After 3 washes, membranes were incubated with Pierce ECL Western Blotting Substrate (32106; Thermo Fisher) for 5 min and imaged in a ChemiDoc XRS system (Bio-Rad).
2.7. In vitro uptake of exosomes by brain endothelial cells and astrocytes
Mouse brain endothelial cells (bEnd.3 cell line) and astrocytes (MA cell line) were plated into 8-well glass chambers (155411; Lab-Tek, Thermo Fisher). The following day, isolated EVs from DiO-labeled NALM6 cells were added to the cells. After 16-h incubation, samples were fixed in 2% paraformaldehyde for 15 min, and endothelial cells were incubated with anti-mouse CD31-APC antibody (102409, 390: BioLegend) at 1:1000 in 1% BSA/PBS for 30 min. Washed coverslips were mounted with Prolong™ Gold Antifade Mountant with DAPI (P36931, Molecular Probes, Thermo Fisher) and imaged with a confocal microscope.
2.8. Transendothelial migration assay
bEnd.3 cells were plated into 8-well glass chambers to achieve confluent density as a monolayer. After 16 h incubation with NALM6-derived exosomes or mTNF-α (10 ng/mL), the cell layer was stained with antimCD31-APC antibody (102409, 390: BioLegend) for 15 min and gently washed 2× with warmed medium. Then, NALM6-GFP cells were overlaid onto the endothelial layer. After additional 2-h incubation, each well was fixed with 2% PFA, and a Z series of confocal images was acquired from top to bottom of the bEnd.3 cell layer. The number of GFP+ cells above and below the endothelial layer was enumerated and expressed as a percentage of total.
2.9. BBB permeability assays
To measure Evans Blue diffusion in brain, sterile solutions of dye (0.5%, 200 μL; E2129, Sigma-Aldrich) were injected retro-orbitally into anesthetized mice. After 30 min, mice were euthanized by cervical dislocation, and brains were collected into 1.5 mL tubes. After brain weight, 500 μL of formamide (F9037; Sigma-Aldrich) was added to each tube and samples were incubated at 55°C for 24 h. Samples were centrifuged to sediment tissue fragments prior to measuring Evans Blue released into the supernatant based upon absorbance at 610 nm and normalized for original tissue weight (in mg). For detection of dye leakage, engrafted mice were intravenously injected 100 μL of 0.2 mg/mL Alexa Fluor 633 Hydrazide (A30634; Molecular probes) dye. Mice were euthanized 30 min later, and brains were harvested for imaging.
2.10. Immunohistochemistry
To collect the brain samples, engrafted mice were euthanized on the indicated analysis date. Tissue was fixed in 4% PFA for 1 day and then held in 30% sucrose for 2 days at 4°C. Thick sections (150 μm) were prepared by a Vibratome (VT1200; Leica, Wetzlar, Germany) and then incubated in blocking solution (15% normal goat serum/PBS) for 1 h at RT. Sections were incubated in anti-mCD31 (3528: Cell Signaling Technology, Danvers, MA, USA) or anti-mGFAP (ab4674; Abcam) and anti-hVEGF-AA (sc-152; Santa Cruz Biotechnology, Dallas, TX, USA) or anti-hIL-15 (ab55276; Abcam) in blocking solution overnight at 4°C, washed 3× in PBS, and incubated in anti-mouse IgG-AF647 (A21237; Thermo Fisher), anti-rabbit-IgG-AF555 (A32732; Thermo Fisher) or anti-chicken IgG-Rhodamine (703-295-155; Jackson ImmunoResearch) at 1:2000 in blocking solution for 1 h at RT. After 3 washes, sections were mounted with Prolong Gold Antifade Mountant with DAPI (P36935; Thermo Fisher) for imaging by a confocal microscope. For IHC of formalin-fixed paraffin-embedded brain, 5-μm slices were mounted on charged slides, deparaffinized, and stained on the Ventana Discovery Platform (Roche) with anti-hCD10 antibody (ab82073; Abcam) and anti-rabbit HQ (760–4815; Roche).
2.11. Two-photon microscope imaging
Engrafted mice were anesthetized by intraperitoneal injection of ketamine (87.5 mg/kg) and xylazin (12.5 mg/kg), then i.v. injected with 100 μL of 0.2 mg/mL Alexa Fluor 633 Hydrazide (A30634; Molecular Probes, Thermo Fisher) dye or 110,000 MW dextran-Cascade Blue (D1976; Molecular Probes) at 12 mg/mL prior to collecting tissues. Freshly harvested brains were settled in an imaging chamber filled with prewarmed and oxygenated RPMI medium with 10% FCS. Z-stack images were acquired by an Axiovert 200 M inverted micro scope (Zeiss, Oberkochen, Germany) with Chameleon Ultra II laser (Coherent, Santa Clara, CA) and a 25× LWD-IR objective.
2.12. CRISPR-Cas9 system
Guide RNAs for human IL-15 and IL-15Rα were designed by using CHOPCHOP (http://chopchop.cbu.uib.no/) with the scores according to GC contents, efficiency, and off-target effect. A synthetic single guide RNA (sgRNA) kit was obtained from Synthego (Redwood City, CA, USA) (IL-15 sgRNA1: GAAGUAAACACAAGUAGCAC, IL-15 sgRNA2: CUUUCAGCUGUUUCAGUGCA, and IL-15Ra: UGCUAAC-CUGGCGGCUGGU). The assembly of sgRNA and Cas9 nuclease was prepared by following the manufacturer’s protocol. In brief, each synthesized sgRNA was dissolved in Tris-EDTA (pH8.0) buffer at 20 pmol and mix with 20 pmol Cas9 nuclease at 1:1 ratio and incubated at RT for 10 min. The RNP complex was add to 1 × 10⁶ of NALM6 blasts suspended in 88 μL of Amaxa Cell Line Nucleofector solution R (VCA-1001; Lonza, Basel, Switzerland) and 2 μg of CMV-RFP expression plasmid, followed by electroporation in a Nucleofector™ 2b Device (Lonza). Transduced cells were cultured and flow sorted to dispense single RFP-positive cells into individual wells of 96-well plates. Expanded clones were evaluated for IL-15 knockdown by intra cellular flow cytometry analysis, and selected clones were expanded for engraftment into mice.
2.13. Quantification and statistical analysis
Quantification of immunostaining was performed on images captured from 3 to 4 sections per animal of each experimental group using Zeiss ZEN software. Multichannel, confocal 3D stack images were thresh-olded for each single channel to integrate GFAP, Iba-1, or VEGF-AA staining intensity in the square area (500 × 500 μm). The average intensities were calculated from the values of the multiple areas. One-way ANOVA tests with Tukey post hoc comparison were used when comparing several groups (Prism GraphPad Software, La Jolla, CA, USA). Student unpaired t tests were used when comparing only 2 groups. P values less than 0.05 were deemed statistically significant. Results were considered significant when P < 0.05.
3. RESULTS
3.1. Infiltration of the CNS with BCP-ALL is delayed compared with other extramedullary sites
As a model system for studying dissemination of leukemia blasts into the CNS, we utilized a well-characterized leukemia xenograft model in NSG mice that is established by tail-vein injection of cultured human BCP-ALL cell lines as well as patient-derived cells.39–43 We evaluated the timing for blast cell metastasis into the brain by harvesting the organs from engrafted mice 7, 15, or 22 days after injection of NALM6 cells. We compared the leukemia burden in the brain with bone marrow and 2 other important extramedullary sites (liver and spleen) at each time points. To evaluate only tissue-infiltrating blasts separately from intravascular, mice were anesthetized and perfused with saline for 10 min prior to sacrifice and organ collection. Brain was carefully separated from meninges. In flow cytometry analysis, human NALM6 blasts were identified by staining with human cluster of differentiation (CD) 10 antibodies (hCD10+) and lack of staining with antibodies directed at mouse CD45 (mCD45−). Results in Fig. 1A show that, although there was significant leukemia burden in bone marrow, spleen, and liver within 7 days of engraftment, the overall burden in the brain was very low. Because extraction of brain tissue involved separation from the skull and nearby meninges that are the most common sites of leukemia infiltration in patients, next, we prepared slices of whole brain for immunohistochemistry (IHC) and fluorescent dye labeling to examine meningeal infiltration. Results are presented in Fig. 1B, where anti-hCD10 staining (red arrow) clearly demonstrates leptomeningeal leukemia infiltrates as early as day 7 after engraftment. These results were also confirmed by confocal imaging, where GFP positive NALM6 cells were detected in the meningeal spaces (Fig. 1C, white arrow).
FIGURE 1. CNS invasion occurs at late stages during BCP-ALL progression in a xenograft model.
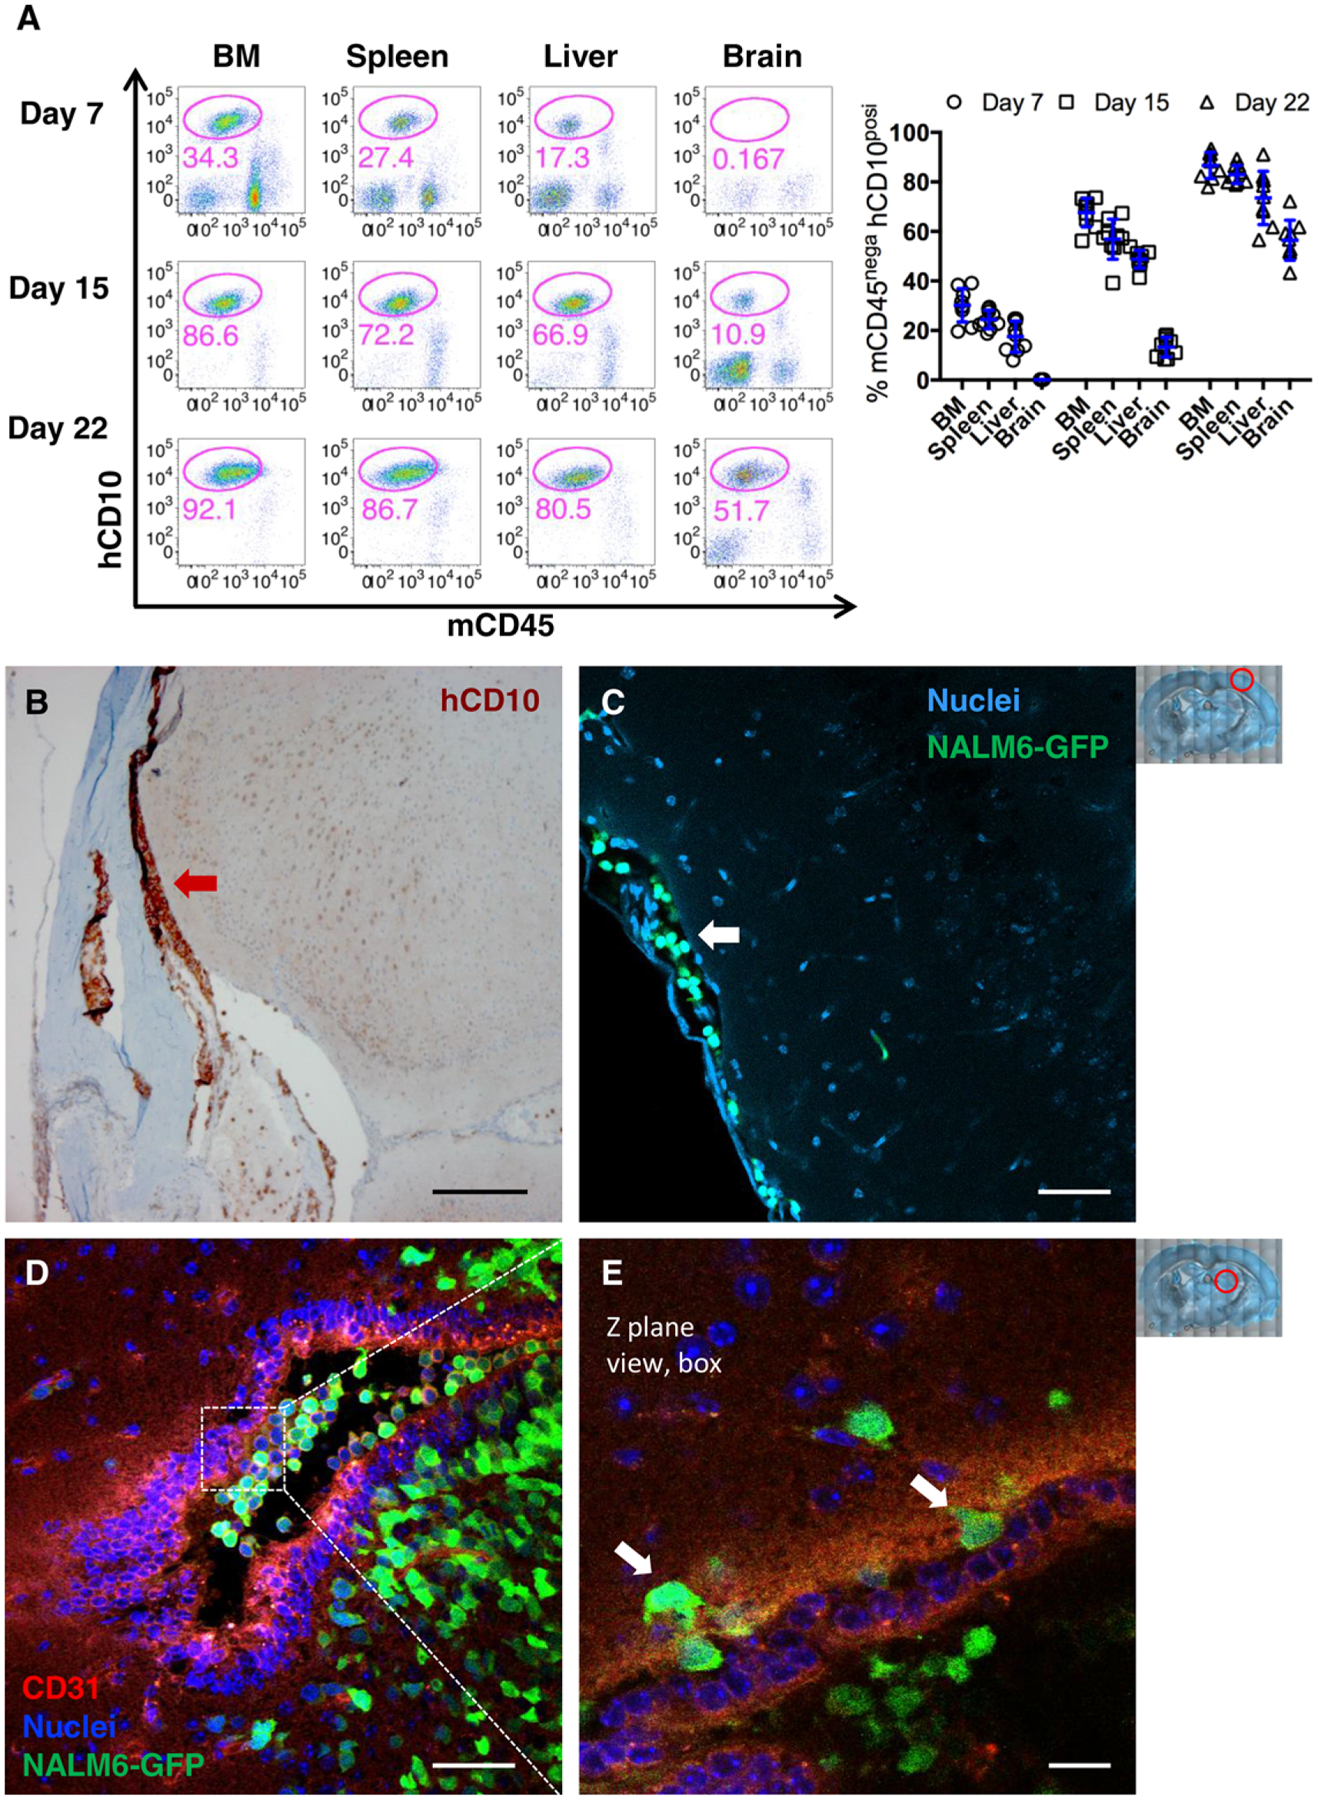
NSG mice were intravenously (i.v.) injected 1 × 10⁶ NALM6-GFP blasts and analyzed for leukemia burden in organs. (A) Representative FACS plots of the blast population (mCD45− hCD10+) in organs harvested after cardiac perfusion on day 7, 15, or 22 engraftment. Data points represent individual mice; n = 8 from 3 independent experiments. (B–C) Representative images of IHC staining of day 7 leukemia engrafted mouse brain sections with anti-hCD10 antibodies (B). IF image of NALM6-GFP cell invasion into meningeal space (white arrow). NALM6-GFP blasts (green) versus nuclei (blue) of all cells in the brain section (C). (D) Maximum intensity projection image of brain sections on day 24. Endothelial cells (anti-mCD31/PECAM; red), NALM6-GFP blasts (green) and nuclei (blue). (E) High magnification image of a single Z-plane from boxed region in 1D. White arrows mark blasts in the process of transendothelial migration. Scale bars = 250 μm (B), 50 μm (C, D), 20 μm (E). Red circles in low power images at right illustrate areas of the brain imaged in the figure
Leptomeningeal invasion was also evident by day 7 in mice engrafted with 2 additional BCP-ALL cell lines (REH-RFP, 697-GFP), as well as blasts derived from a high-risk pro-B leukemia patient (Pt 238- GFP41) (Supporting Information Fig. 1, left columns). Cytogenetics of leukemia Pt 238 has been previously reported.41
To determine how leukemia infiltration changes according to the disease progress, next, we examine day 15 and 22 after engraftment of mice. The flow cytometry results in Fig. 1A show that the burden of leukemia in whole brain is increasingly elevated. By day 22, when NALM6-engrafted mice are typically nearing the terminal end point based upon signs of morbidity, hCD10+ leukemia cells represented large populations in brain tissue (ranging from 40 to 70%, plotted in Fig. 1A). In the mouse model, this expansion of leukemia cells was accompanied by invasion into brain parenchyma. As shown in the image in Fig. 1D, GFP+NALM6 cells were frequently found inside large vessels labeled with anti-mCD31 antibodies that recognize mouse endothelial cells, as well as in large colonies of leukemia cells in the nearby brain parenchyma. Leukemia blasts resident in the parenchyma acquired irregular shapes, compared with the round circulating blasts inside vessels, and were often surrounded by microcap-illaries (<7 μm). High-power microscopic views of an individual z-plane section of the same large vessel (box in Fig. 1D; see arrows in Fig. 1E) provide direct evidence that transendothelial migration underlies the invasion of GFP+NALM6 leukemia cells into mouse brain parenchyma in this model system.
By fluorescent imaging of brain slices, we found leukemia blasts plunged in the microvessels running at the parenchyma in the late disease-stage mice brain (Supporting Information Fig. 1, right columns). Additionally, we observed occasional islands of parenchymal infiltrates adjacent to blood vessels in mice engrafted with NALM6-GFP, 697-GFP cells, and Pt 238-GFP blasts (Supporting Information Fig. 2A, C–E). Such parenchymal involvement was rare and found at the late leukemia disease stages with associate of meningeal infiltration.
3.2. Leukemia blasts induce the BBB breach and change of brain microenvironment
Because we observed that leukemia parenchymal involvement occurs only at later stages of disease progression in conjunction with meningeal infiltration, we hypothesized that leukemia blasts may need to undergo phenotypic changes or modify the microenvironment to survive and invade in nonmedullary brain tissue. We tested the hypothesis that NALM6 leukemia engraftment leads to changes in BBB integrity by intravenous injection of Evans Blue dye into either untreated mice or mice engrafted for 7 and 18 days. As shown in Fig. 2A, brains of NALM6-engrafted mice showed markedly more incorporation of Evans Blue dye compared with controls. To evaluate whether the breaches in BBB permeability were focal or broadly distributed, we injected mice with Alexa Fluor 633 Hydrazide dye followed by harvesting of brain tissues within 30 min. This dye selectively binds elastin44 on the arterial wall, providing a tool to visualize cloud-like accumulations of dye consistent with focal breaches of the BBB in engrafted mice (Fig. 2B). No dye accumulation was observed in leukemia-free control or early disease-stage mice (days 1–15 post engraftment).
FIGURE 2. Engraftment of BCP-ALL blasts induces leakiness in the blood-brain barrier.
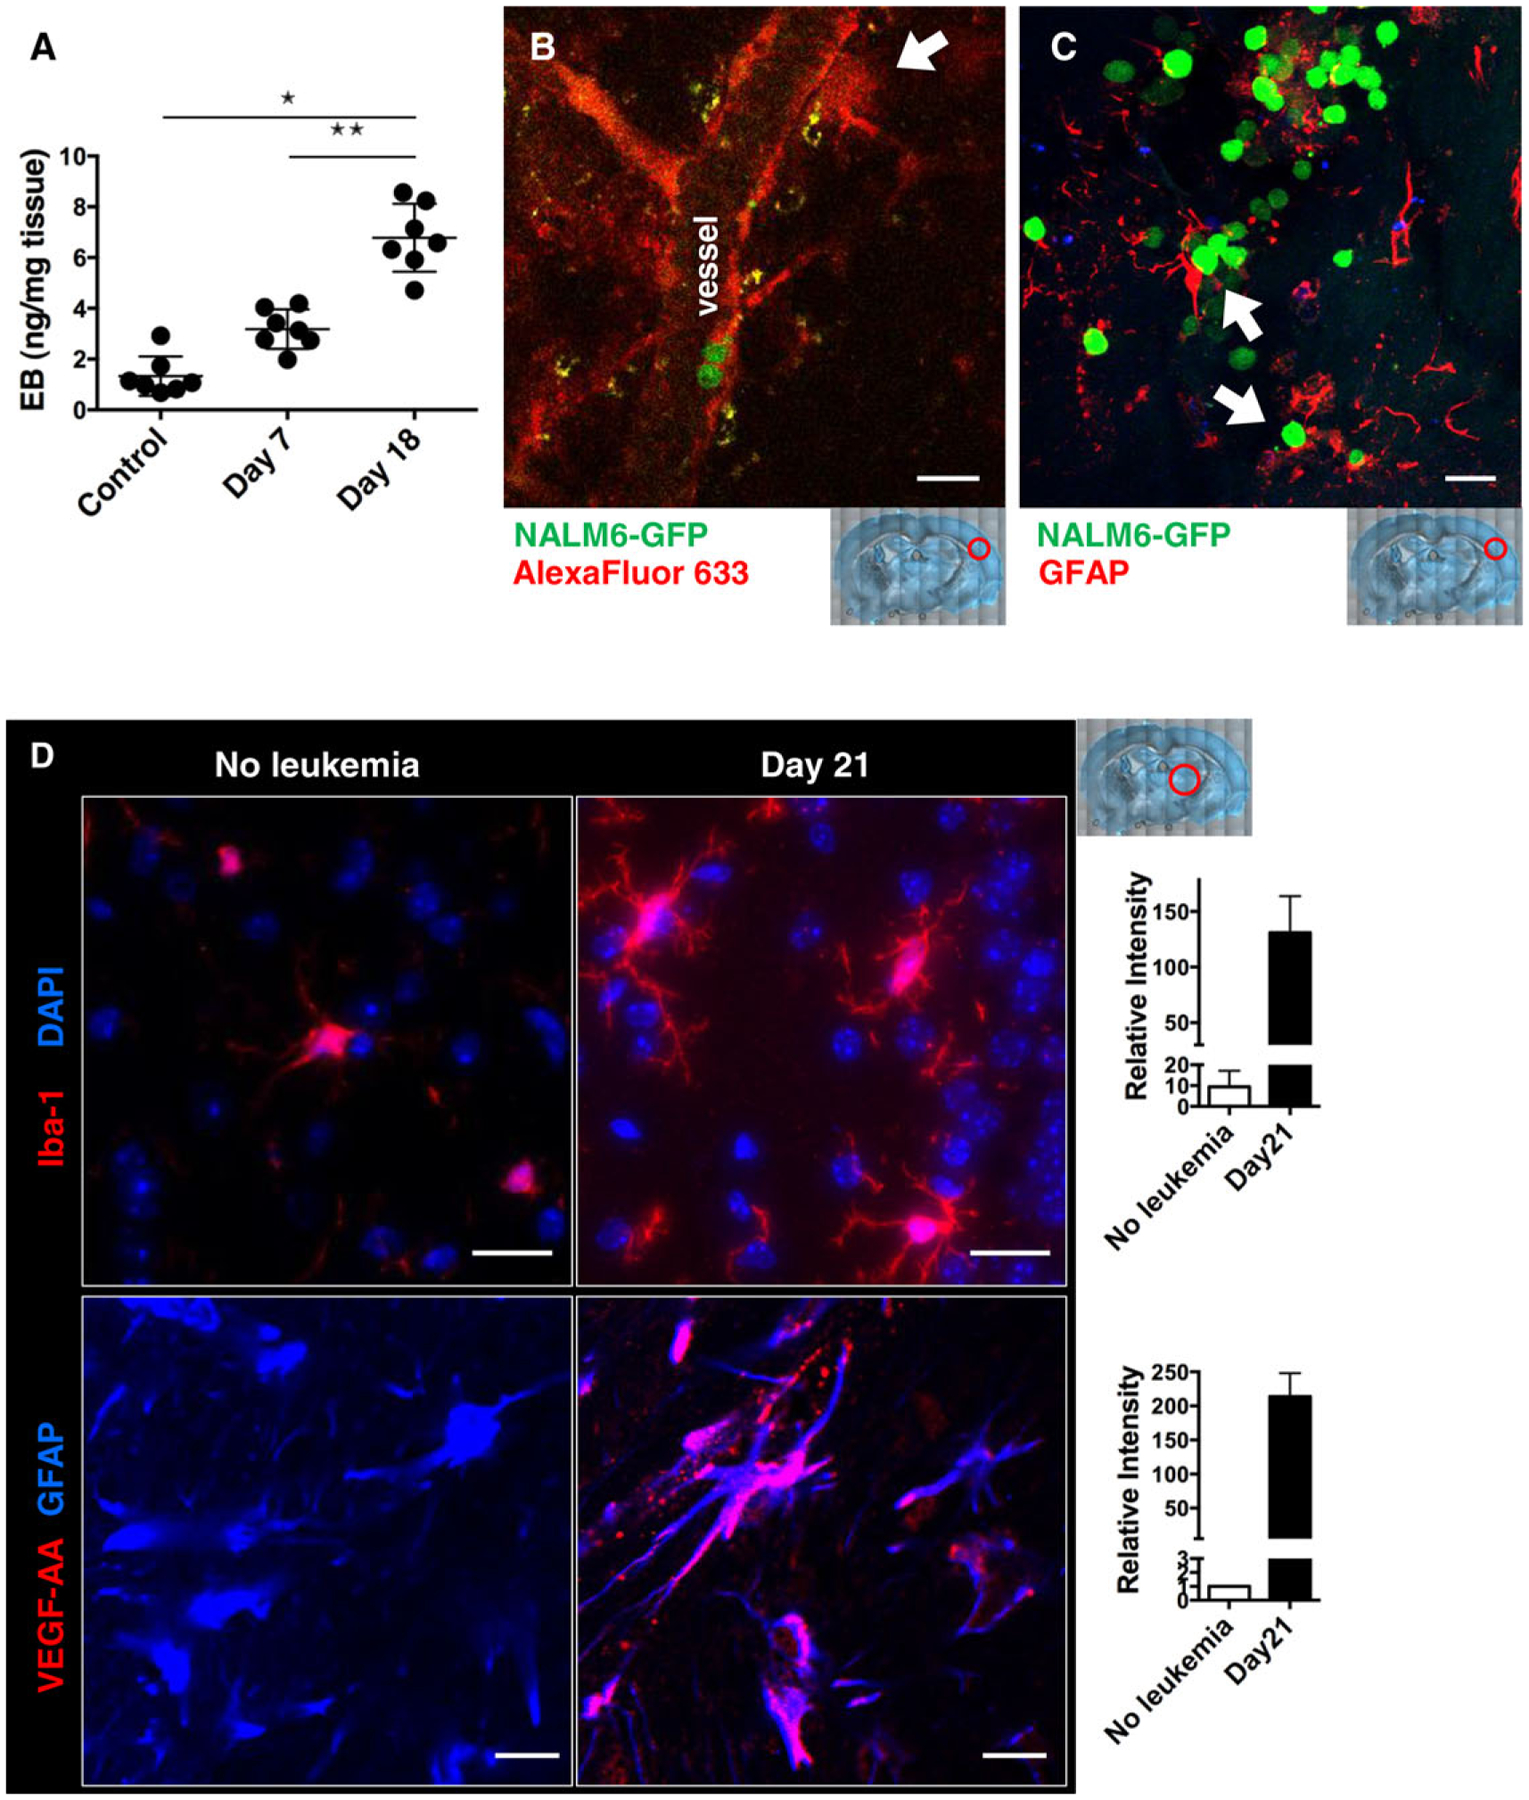
NSG mice were i.v. injected with 1 × 10⁶ NALM6-GFP blasts and analyzed for dye leakage in the brain on the indicated day. (A) Evans Blue dye was intravenously injected to control and day 7 or 18 engrafted mice. After 30 min, brains were harvested to image and quantify Evans Blue. *P < 0.001; n = 4–7, 2 independent experiments. (B) On day 20 of engraftment, mice were i.v. injected with 20 μg of Alexa Fluor 633 Hydrazide and brains were harvested 30 min later for two-photon imaging. White arrow indicates local dye leakage. (C) Representative immunofluorescence image of glial fibrillary acidic protein (GFAP; red) and NALM6- GFP (green) in brain sections from day 21 engrafted mice. White arrows mark interactions between blasts and astrocytes. (D) Immunofluorescence images of brain slices from control and day 21 engrafted mice, with quantification of intensity plotted at right. Top: slices were labeled with antibodies to Iba-1 (ionized calcium-binding adaptor molecule-1; red) and DAPI (nuclei; blue), showing microglia activation. Bottom: slices were labeled with antibodies to mouse VEGF-AA (red) and GFAP (blue), showing VEGF-AA upregulation in astrocytes. Scale bars = 30 μm (B, C) and 50 μm (D). Red circles in low power images illustrate the areas of the brain represented in each image
We next evaluated the possibility that the increased vascular permeability in engrafted mice was associated with activation of microglia and astrocytes resident in the brain. Results in Fig. 2C show that the close physical association of GFP-expressing leukemia cells with microglia identified with anti-glial fibrillary acidic protein (GFAP) antibodies. As shown in Fig. 2D (top panels), leukemia dissemination into the brain is accompanied by increased numbers of Iba-1-positive microglia, consistent with the well-established observation that activation of microglial cells is a typical response to neural stress or injury.45 We also observed that astrocytes in brains of 21 day engrafted mice exhibited an activated morphology, with numerous processes.46 More-over, only astrocytes from engrafted mice were strongly positive for VEGF-A production (Fig. 2D, bottom panel). Taken together, these data suggest that the leukemia dissemination alters the activation state of resident cells in the brain and is coincident with a profound disruption of BBB integrity.
3.3. Elevated serum cytokine levels in BCP-ALL-engrafted mice
To examine the possibility that leukemia cells and their products initiate a feed-forward loop by which brain resident cells are stimulated to release permeability-promoting factors, we profiled changes in circulating human and mouse cytokines of control or engrafted mice. Human cytokines in mouse serum were evaluated using a 42-plex human-specific cytokine array. As shown in Fig. 3A, high levels of human PDGF-AA (1000–3000 pg/mL) were detected in mice after 5, 15, or 21 days engraftment with NALM6 cells. We also observed significant amounts of circulating human FGF-2, Flt-3, TNF-α, and VEGF-A in mice after 15 days (Fig. 3A). Within 21 days, the host response led to elevated levels of at least 4 different mouse cytokines evaluated on a 31-plex array: G-CSF, IL-1α, IL-6, and IL-9 (Fig. 3B). These data suggest that leukemia blasts stimulate host cells to induce cytokine production.
FIGURE 3. Production of host- and leukemia-derived cytokines.
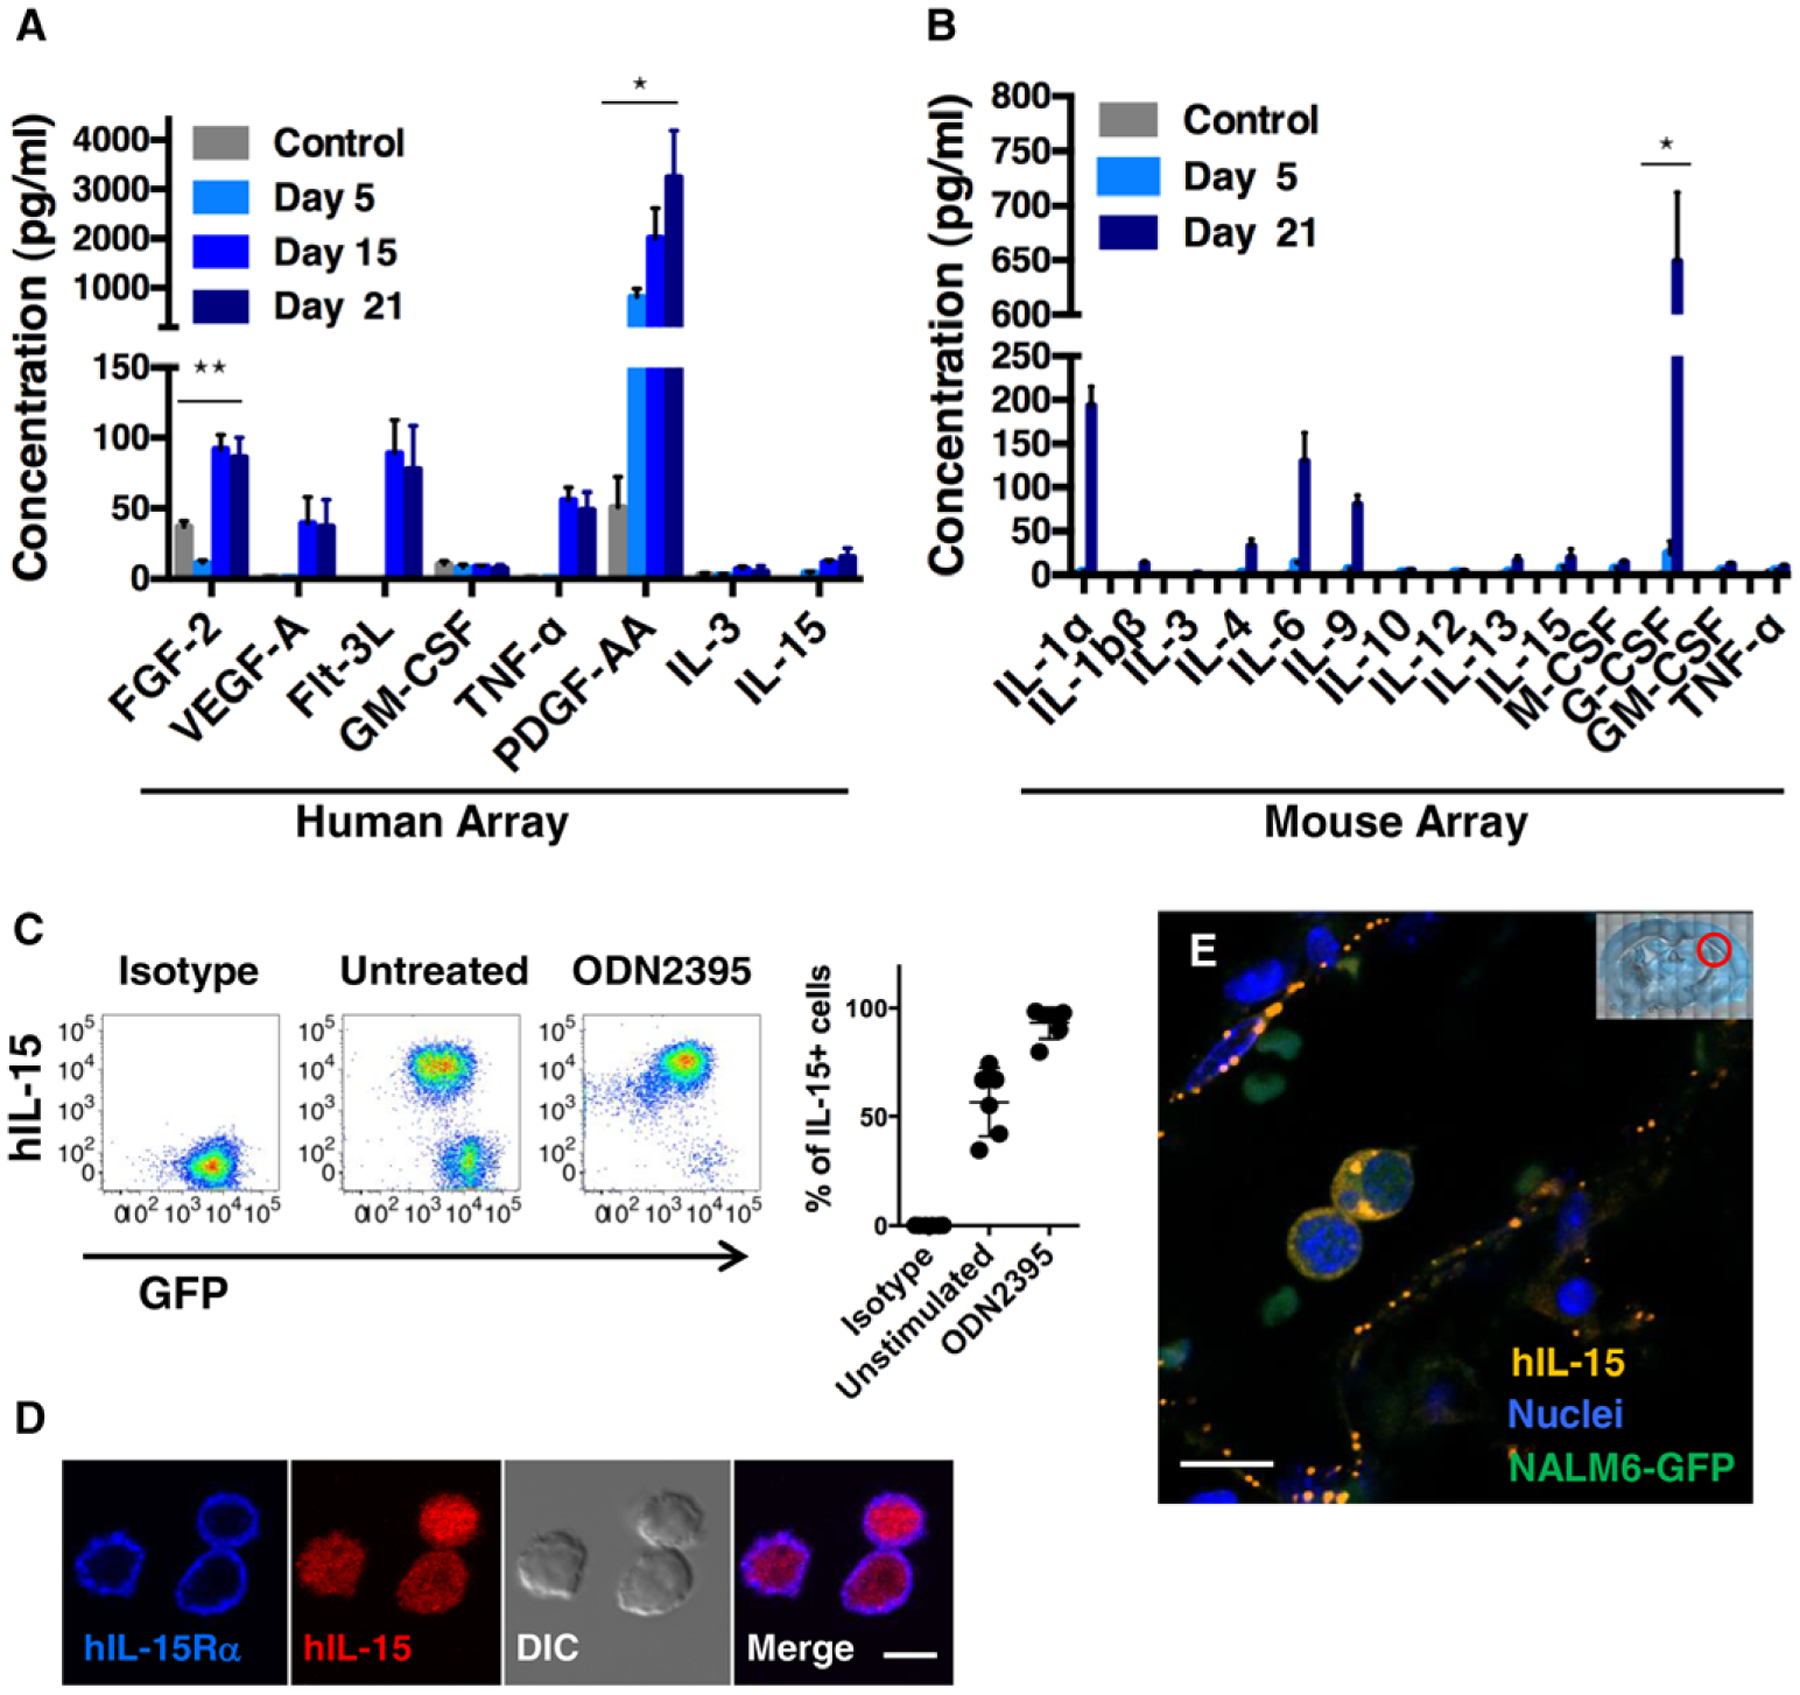
(A, B) NSG mice were i.v. injected with 1 × 10⁶ NALM6-GFP blasts and blood collected on days 5, 15, and 21 after engraftment. Serum samples were analyzed on human (A) or mouse cytokine arrays (B). *P < 0.001, **P < 0.05; n = 5, 2 independent experiments. (C) Representative FACS plots of intracellular hIL-15 expression in cultured NALM6-GFP cells, with or without 48 h stimulation with 5 μM ODN 2395. (D) Representative images of cultured NALM6 cells stained with hIL-15Rα (blue) and anti-hIL15 (red) antibodies. (E) Fluorescent images of brain sections from day 24 engrafted mice stained with anti-hIL-15 antibodies (orange) and DAPI (blue) to label nuclei. Blasts are identified based upon GFP-expression (green). Red circle in low power image illustrates the area of the brain imaged. Scale bars = 5 μm (D) and 10 μm (E)
Given prior observations that high IL-15 expression is linked to CNS leukemia,13 the low levels of circulating human IL15 in engrafted mice were an unexpected finding. To address this, we next explored the possibility that IL-15 synthesized by leukemia cells might be largely retained in intracellular pools. Results in Fig. 3C show that a majority of cultured NALM6-GFP cells were strongly positive for hIL-15 in flow cytometry analysis. Notably, treatment of NALM6 cells with ODN2395, a ligand for Toll-like receptor 9 and induces B cell activation,47,48 results in upregulation of hIL-15 synthesis and conversion of essentially most of NALM6 to an IL-15-positive status. Because IL-15 is a potential autocrine factor for leukemia blasts, we also evaluated if BCP-ALL cells also express the IL-15 receptor (IL-15Rα). We labeled NALM6-GFP cells with fluorescently conjugated antibodies to IL-15Rα for confocal microscopy. Images in Fig. 3D show that NALM6 cells were strongly positive for IL15Rα, in a pattern consistent with plasma membrane and adjacent endocytic/recycling membranes, while labeling for hIL-15 cytokine was present primarily in intracellular puncta.
Finally, we evaluated the distribution of hIL-15 production in the brains of mice after 24 days of leukemia engraftment by immunofluorescence labeling of mouse brain slices (Fig. 3E). The image in Fig. 3E demonstrates that IL-15 protein was detected within bright puncta representing vesicles in the cytoplasm of leukemia blasts circulating within brain vessels. Isolated IL-15+ puncta were also detected in association with nearby large vessels of the brain. Because these data suggested that brain endothelial cells may take up IL-15+ microvesicles (hereafter referred to as “exosomes”) released by leukemia cells, we incubated cultured bEnd.3 cells with purified exosomes. Results of these experiments are reported in Supporting Information Fig. 3A, demonstrating that endothelial cells can bind and engulf exosomes in an in vitro setting, followed by endothelial activation with CD31 upregulation.
3.4. BCP-ALL blasts release exosomes to blood
Together, these data suggest that BCP-ALL cells release a group of soluble cytokines, as well as IL-15 encapsulated within exosomes. We next characterized the constitutive release of exosomes from NALM6 cells maintained in serum-free medium for 24 h. The collected culture supernatant was centrifuged at 1000 × g to remove cell debris, followed by ultraspeed centrifugation (100,000 × g) to isolate exosomes.49 Transmission electron micrographs in Fig. 4A show that the exosomes released by NALM6 cells are typically 50–100 nm in diameter and stain positively with immunogold reagents against CD81, a commonly used exosome marker.50 Western blotting was also used to confirm that the exosomes produced by NALM6 cells contain CD81 protein (Fig. 4B). We did not detect other exosome markers (CD63, CD9) in NALM6-derived exosomes, similar to results previously reported for primary B cells.51 Finally, immunofluorescence studies of cells stained for both CD81 and IL-15 show colocalization within cytoplasmic puncta (bright purple dots in the merged image; Fig. 4C).
FIGURE 4. BCP-ALL blasts release exosomes.
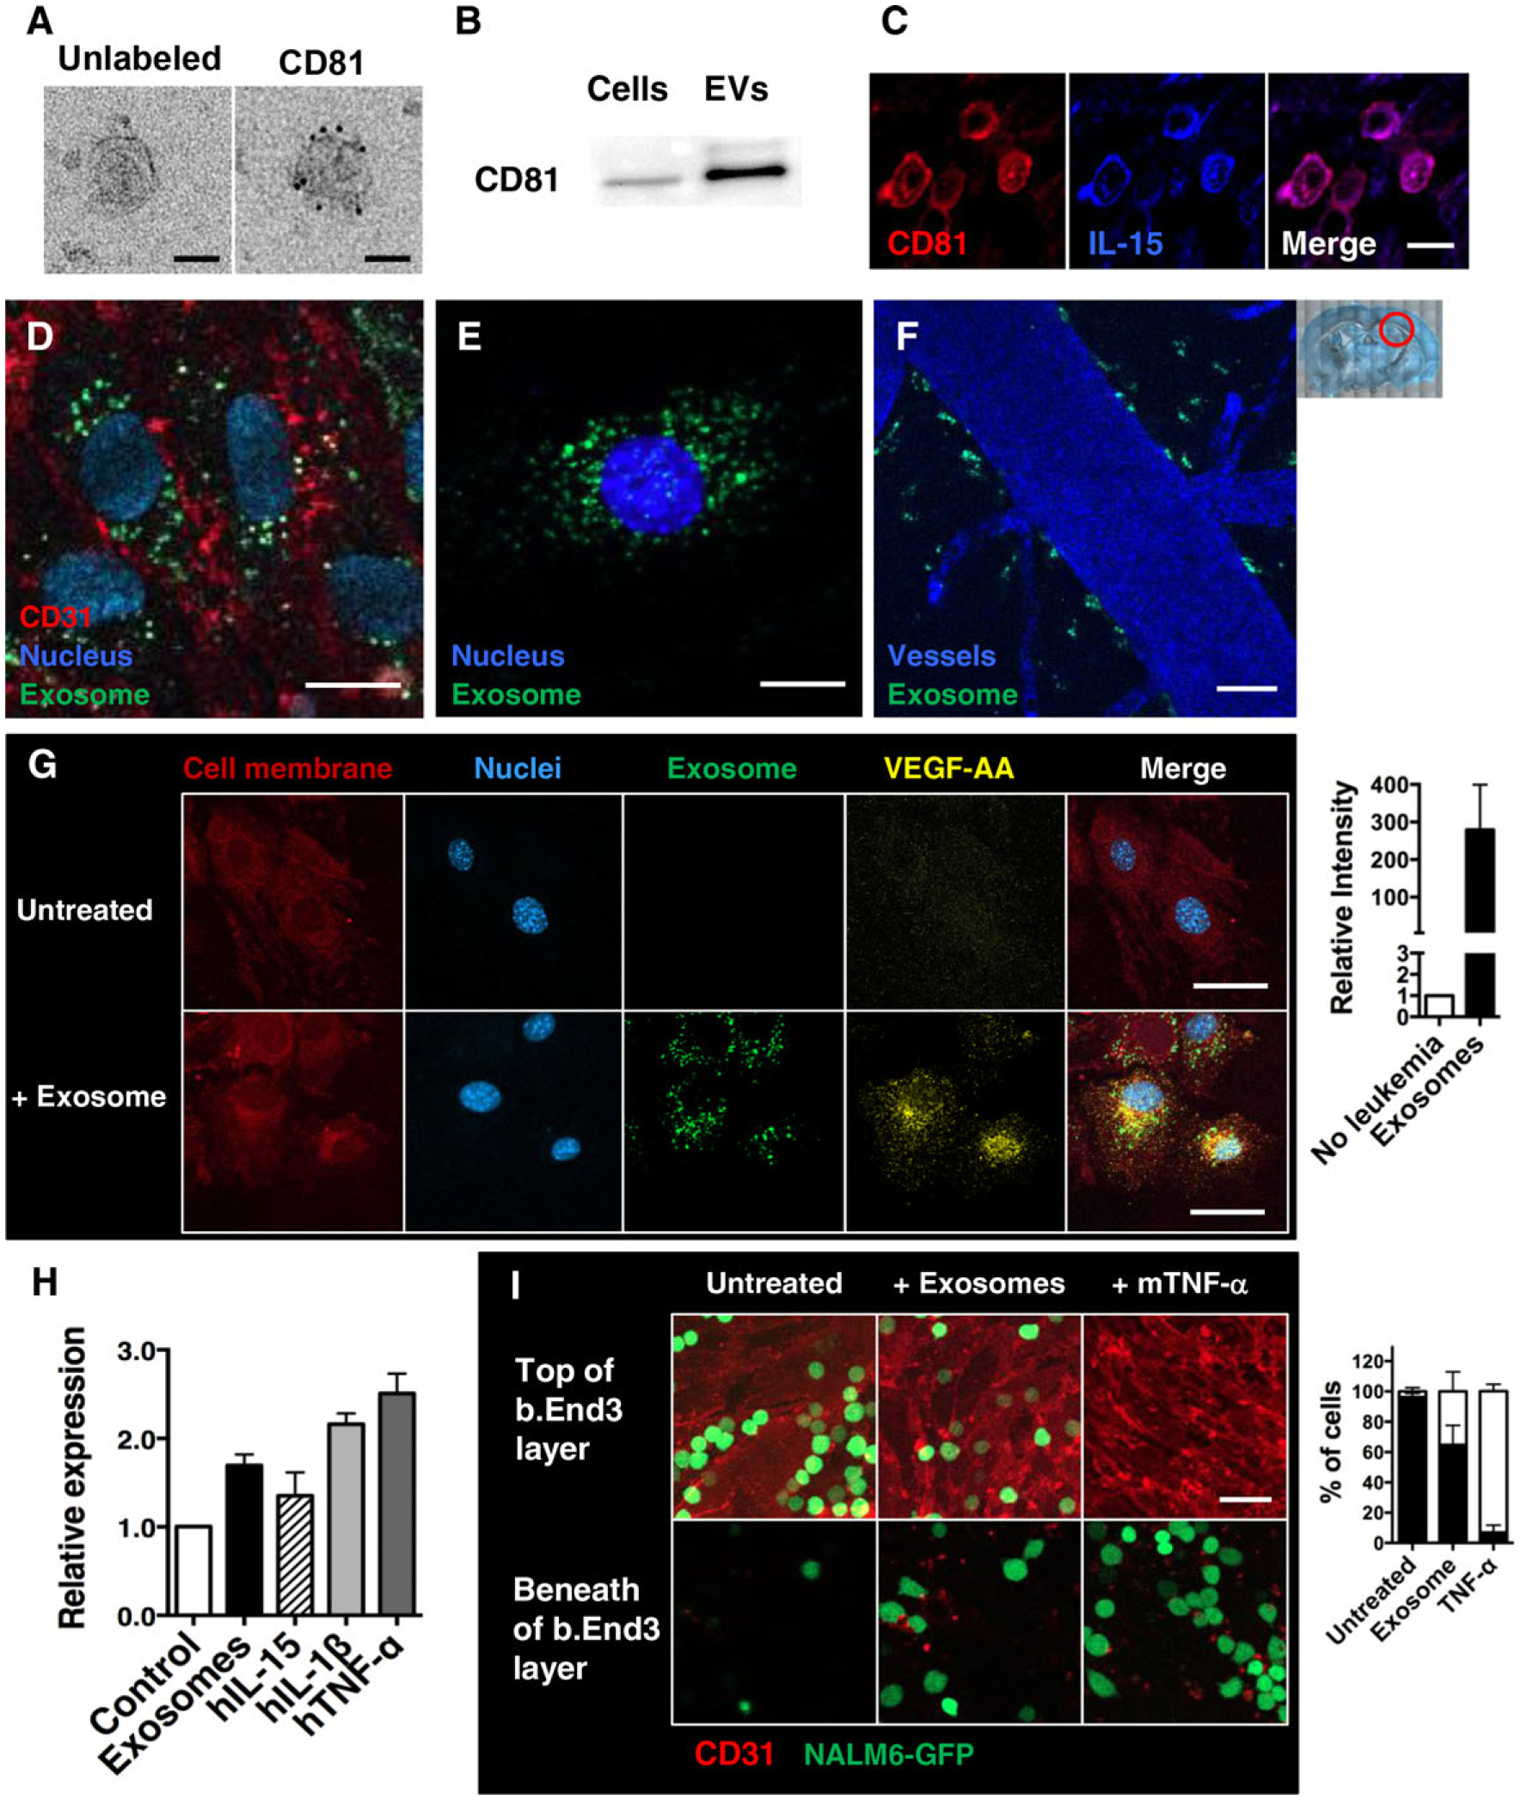
(A) TEM images of exosomes collected from culture supernatants of NALM6 cells. Purified exosome pellets were stained with anti-hCD81 antibody and secondary labeled with colloidal gold anti-mouse IgG and imaged. Scale bars = 50 nm. (B) Immunoblotting detection of CD81 exosome markers in exosome pellets (5 μg/well) prepared from cultured NALM6 cells, as well as whole-cell lysates. (C) Representative images of brain slices from day 23 engrafted mice. Sections are stained with anti-hCD81 (red) and anti-hIL15 (blue) antibodies. (D) Representative images of the mouse brain endothelial cells (b.End3) after 16 h incubation with NALM6-derived exosomes (labeled with DiO; green). Samples were washed, fixed, and labeled with anti-mCD31 antibodies (red) and DAPI (nuclei; blue). (E) Representative images of cultured mouse astrocytes (MA cells) after 16 h incubation with NALM6-derived exosomes (labeled with DiO; green); cells were washed, fixed, and labeled with DAPI (nuclei; blue). (F) Representative image of the mouse brain vessels 24 h after i.v. injection of DiO-labeled exosomes prepared from cultured NALM6 cells. Cascade blue dye was i.v. injected 10 min prior to harvest for two-photon imaging. (G) Representative images of MA cells after 16 h incubation with NALM6-derived exosomes (labeled with DiO; green). Samples were washed, fixed, and labeled with anti m VEGF-AA antibodies (yellow), DiI lipid dye to label membranes (red) and DAPI (nuclei; blue). (H) qPCR analysis for VEGF-A mRNA expression in MA cells after 48 h culture with NALM6-derived exosomes or the indicated recombinant cytokines. Data are expressed as means ± SD. *P < 0.005, **P < 0.05; n = 6, 3 independent experiments. (I) Representative z-plane images of b.End3 cells plated on glass bottom dishes. After 16 h incubation with NALM6-derived exosomes or mTNF-α (10 ng/mL), NALM6-GFP blasts were gently overlaid onto the endothelial cell layer. After additional 2 h coincubation, cells were fixed and labeled with anti-mCD31 antibodies (red). Levels of leukemia transmigration across the endothelial layer were scored by confocal imaging. Scale bars = 10 μm (C, D, E) and 30 μm (F, G, I). Plots at right of G and I enumerate results. Red circle in low power image illustrates the area of the brain imaged
To examine whether exosomes released by BCP-ALL leukemia blasts are targeted directly to cell types resident in the brain, we labeled NALM6 cells with DiO membrane dye and then cultured the cells in serum-free medium followed by exosome purification. The DiO-positive vesicles were added to culture dishes plated with either b.End3 cells, which are derived from mouse brain endothelial cells, or mouse astrocytes. After 16 h incubation, the adherent cells were washed twice, fixed with paraformaldehyde, and stained with fluorescent-conjugated anti-CD31 antibodies to label endothelial cell membrane. Results show that DiO-labeled exosomes were readily taken up into the cytoplasm of mouse brain endothelial cells (Fig. 4D), as well as astrocytes (Fig. 4E). When introduced directly into mice by intravenous injection, NALM6-derived exosomes were found concentrated along the blood vessel wall in the mouse brain (Fig. 4F).
Given the evidence above that blast-derived exosomes can be taken up by brain resident cells, we next evaluated whether binding of these vesicles could directly induce activation of astrocytes. After incubation with exosomes, in vitro culturing astrocytes markedly elevated levels of VEGF-AA protein (immunofluorescence assay, Fig. 4G) and mRNA (qPCR assay, Fig. 4H). To examine if exosome treatment increases transmigration potential of BCP-ALL cells, we prepared fully confluent endothelial cell monolayers. The cultured monolayers were treated with either NALM6-derived exosomes or recombinant mouse TNF-α for 16 h. After gentle washes, NALM6-GFP cells were overlaid. After 2 h incubation, the samples were fixed, stained with anti-CD31 antibody to mark endothelial cell membranes, and analyzed on a confocal microscope. Images were collected every 1 μm in the z-direction to evaluate the penetration of GFP+NALM6 cells through the endothelial cell layer. Results in Fig. 4I show that the monolayers of untreated endothelial cells rarely allowed to penetrate. In contrast, NALM6-GFP cells readily migrated across TNF-α-pretreated endothelial cells layers as previously known. Interestingly, exosome-pretreated endothelial cells also allowed NALM6-GFP blast transmigration some degree, indicating blast-derived exosomes stimulate endothelial cells.
3.5. IL-15 plays a role for leukemia metastasis into the brain
We next sought insight into the potential influence of IL-15-mediated signaling on leukemia brain metastasis. We utilized CRISPR-Cas9 gene engineering techniques52,53 to create NALM6 cells with reduced expression of either IL-15 or its receptor, IL-15Rα. Clonal populations of cells with ~50% reduction in protein levels were selected for further study (Fig. 5A); these results are consistent with knockout of 1 allele of each respective gene. The reciprocal loss of expression when either of these genes was knocked down may indicate that a positive feedback loop may exist between the expression and/or stability of the 2 genes and their products (Fig. 5A). We note that there was no significant difference on growth or apoptosis rates when IL-15KD or IL-15RαKD cells were maintained in cell culture (Supporting Information Fig. 4A and B).
FIGURE 5. IL-15 signaling in BCP-ALL blasts is necessary for CNS invasion.
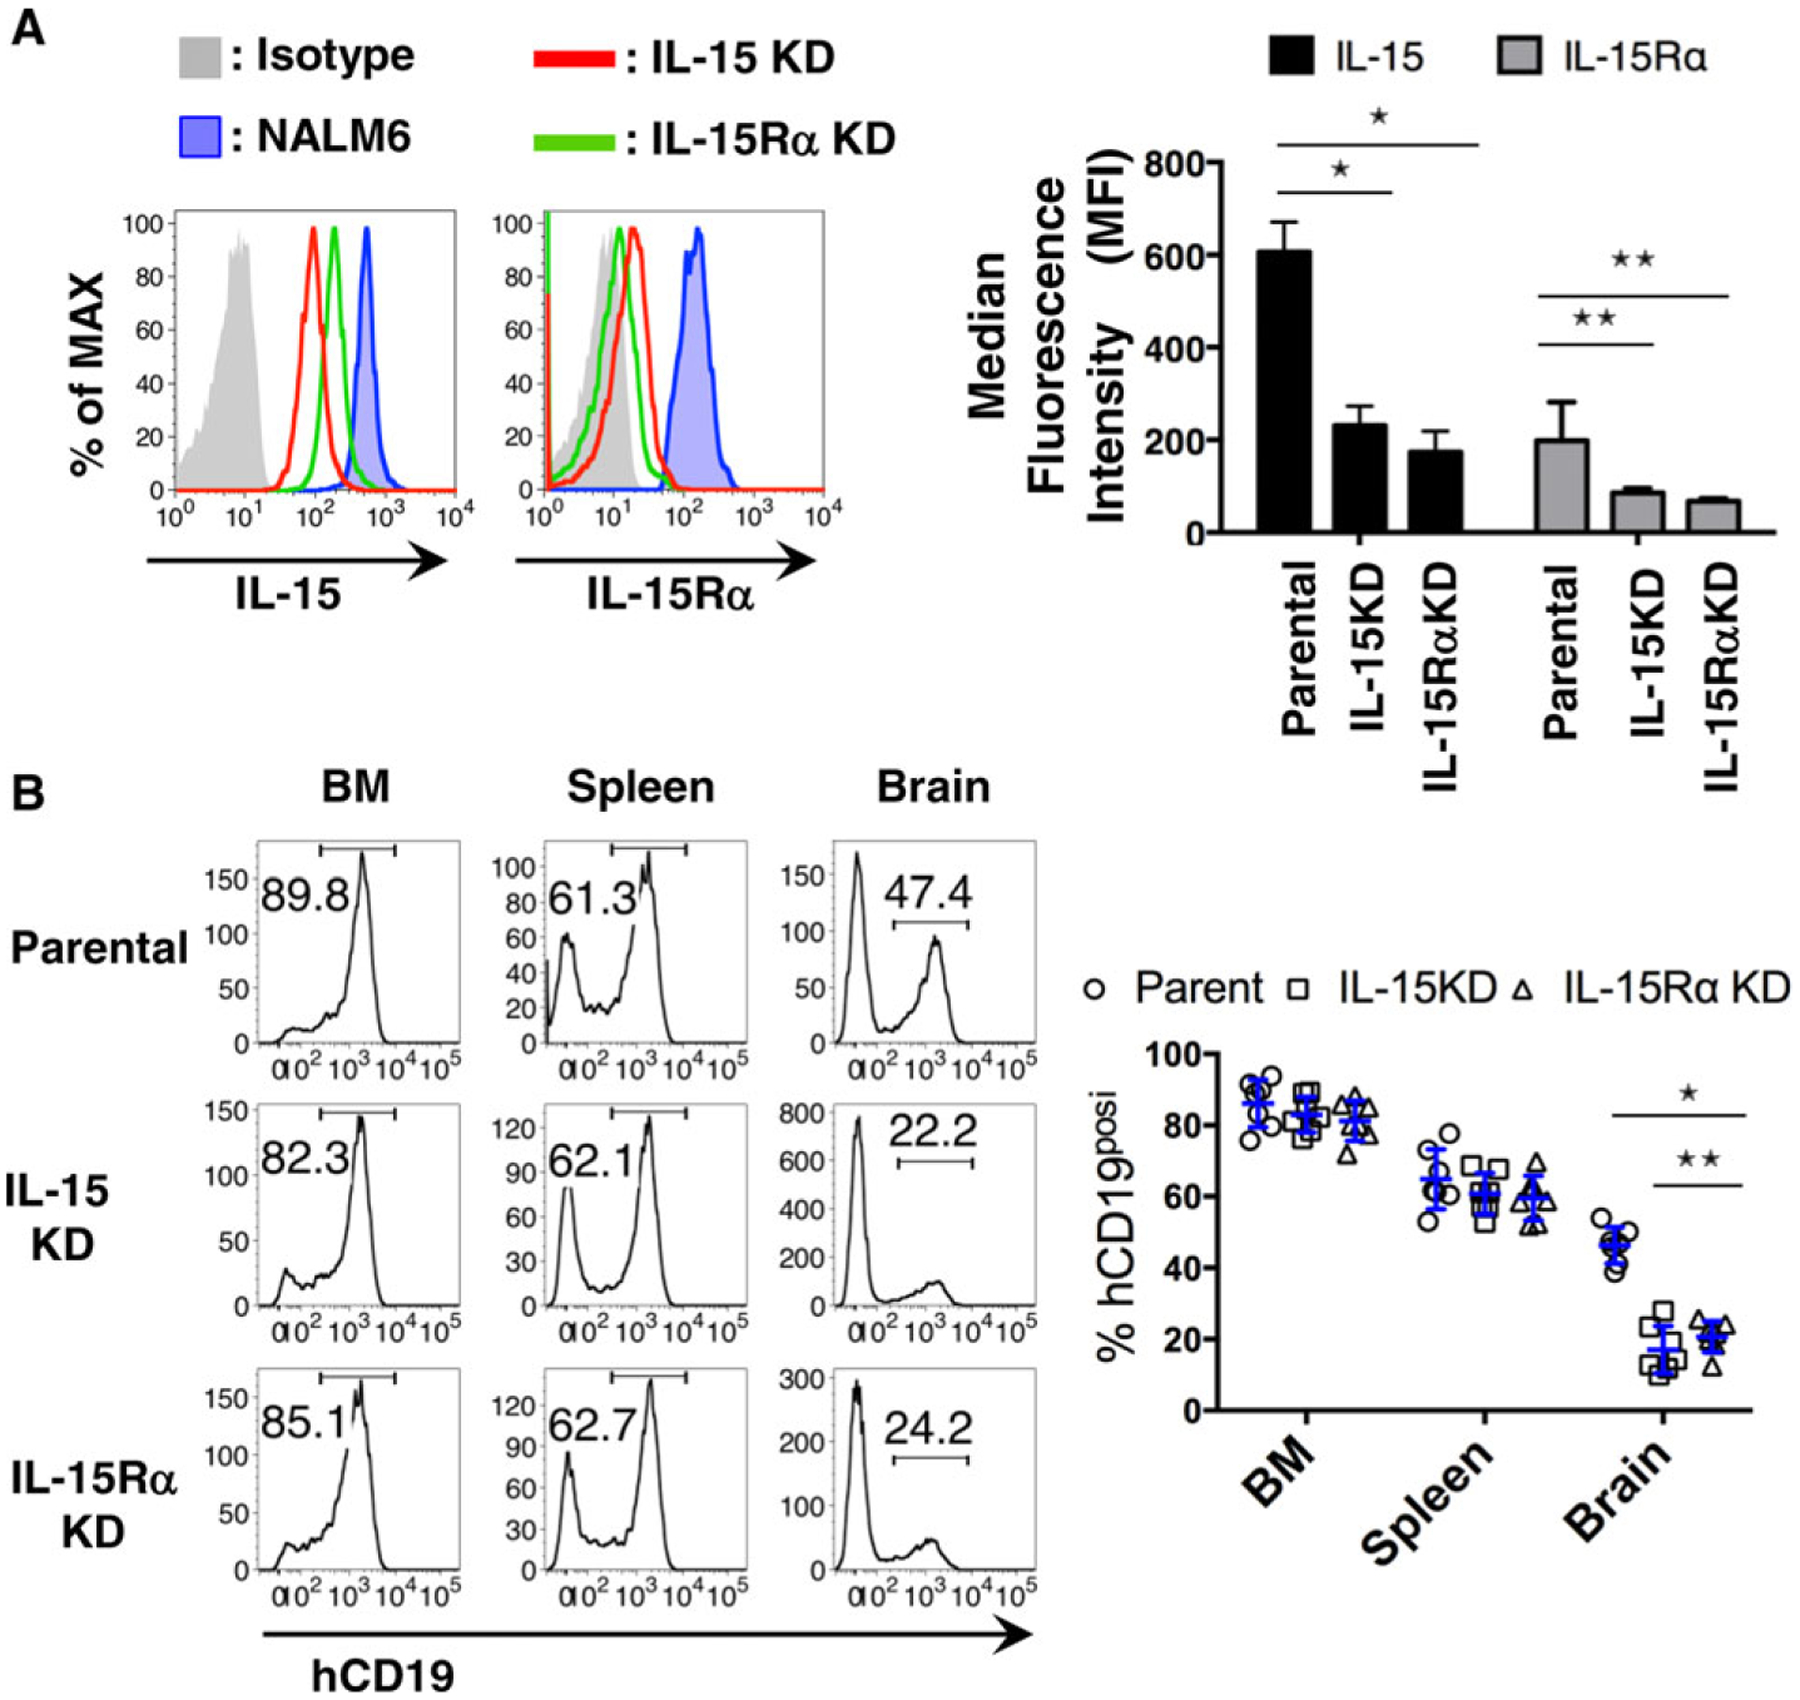
(A) Representative histogram from FACS analysis of hIL-15 and IL-15Rα expression in parental NALM6 cells versus clonal lines after CRISPR-Cas9 gene editing to reduce levels of IL-15 or its receptor. Plot at right reports summary data (n = 4); *P < 0.001, **P < 0.001. (B) Representative histogram from FACS analysis of leukemia burden in each organ sites of day 20 mice after engraftment with parent NALM6 or IL-15 or IL15Rα-knockdown cells (KD cells, as indicated in the legends). Plot at right reports summary data (n = 7); *P < 0.001, **P < 0.05
To test if the reduced expression of IL-15 or its receptor impacts the ability of leukemia cells to disseminate to the brain, we engrafted mice with either IL-15KD or IL-15RαKD NALM6 cells. Mice were sacrificed on day 20 after engraftment with CRISPR-Cas9-edited cell lines or parental cells, followed by evaluation of leukemia burden by flow cytometry. Results in Fig. 5B show ~49% lower tumor burden in the brains of mice engrafted with cells expressing reduced levels of IL-15 or IL-15Rα. It should be noted that, although the mice engrafted with IL-15 or IL-15Rα KD cells showed lower levels of brain infiltration, we failed to observe any survival benefit in these mice compared with mice injected with parental NALM6 cells (Supporting Information Fig. 4C).
Finally, we used in vitro transmigration assay to test for the possibility that IL-15 signaling acts directly on endothelial integrity to promote leukemia invasion. Endothelial monolayers were preincubated with IL-15 or TNF-α overnight, followed by washing and incubation with either control or IL-15 KD cells. Results in Supporting Information Fig. 3B–C show that, compared with TNF-α, IL-15 pretreatment alone had a slight potentiating effect on endothelial monolayer integrity only at a relatively high dose (100 ng/mL). This may be linked to very low levels of IL-15 receptors on bEnd.3 cells, based upon staining with anti-IL-15Rα antibodies (Supporting Information Fig. 3D). The impact of the changing cytokine milieu in vivo is likely more complex, as TNF-α treatment alone induced upregulation of IL-15Rα on bEnd.3 cells (Supporting Information Fig. 3D, red line).
4. DISCUSSION
Metastatic spread of both solid tumors and hematologic malignancies is associated with higher morbidity and higher mortality rates, indicating the need to better understand the factors that alter the BBB and the local microenvironment for successful invasion and survival of neoplastic cells.54,55 Complications of brain metastases include edema, inflammation, neurodysfunction, and high risk for relapse. We show here that BCP-ALL blasts modulate BBB permeability and brain microenvironment by releasing both encapsulated and soluble factors that can induce activation of endothelial cells, astrocytes, and microglial cells (Fig. 4). The involvement of VEGF-A produced by leukemia cells in their CNS infiltration56 has led several groups to propose that inhibition of VEGF production or binding is a viable therapeutic target.24,57 We show here that BCP-ALL cells can produce a number of human cytokines in addition to VEGF-AA, including FGF2, Flt-3L, TNF-α, PDGF-AA, and IL-15 (Fig. 3A). All of these mediators have the potential to modify disease progression. Because we are able to distinguish between the production of human cytokines by leukemia cells, and the mouse cytokines produced by the host organisms in our xenograft model, we show that disease progression was accompanied by increases in circulating mouse IL-1α, IL-4, IL-6, IL-9, and G-CSF (Fig. 3B). These results add to the complexity of understanding roles for inflammatory cytokines in directly or indirectly on resident cells in the brain, expanding the short list that has focused primarily on IL-1β and TNF-α.19
The interplay between infiltrating cells and the brain microenvironment is multifactorial. Prior reports have implicated astrocyte-derived production of VEGF-A and TYMP in BBB disruption associated with autoimmune syndromes such as encephalitis and multiple sclerosis.22,23 We provide evidence that, in addition to soluble cytokines, extracellular vesicles released by infiltrating cells are likely contributors to loss of BBB integrity. Based upon their size and expression of CD81 (Fig. 4A and B), the vesicles released by BCP-ALL cells fit the general criteria assigned to exosomes.28,30 Remarkably, ex vivo binding of purified exosomes to cultured cells resulted in production of VEGF-AA by astrocytes and promoted leukemia cell transmigration across endothelial cell monolayers (Fig. 4G–I). Our observations thus contribute to a growing literature supporting roles for exosomes in regulating the metastatic spread of both solid tumor and hematopoietic malignancies.29–31,58–60 Although the full characterization of the BCP-ALL-derived exosomes remains to be performed, it is interesting to note that the exosome-mediated delivery of both proteins and microRNAs (miRNAs) has been implicated in organ-specific metastatic spread.58,61 We propose that leukemia-derived exosomes could play critical roles by directly modulating the integrity of endothelial cell-cell junction in vivo and promoting blast cell transmigration across the BBB into the brain parenchyma. Any therapeutic strategy that targets only key soluble mediators (such as VEGF), and that fails to intervene in the binding of exosomes, may have only partial success in preserving endothelial stability in the CNS to block leukemia cell invasion.
Finally, our work suggests that a potential autocrine loop involving IL-15 and its receptor may be a central player in the successful establishment of CNS disease in BCP-ALL. We found that even a 50% reduction in expression for either IL-15 or IL-15Rα, achieved by CRISPR-Cas9-mediated gene ablation in NALM6 cells, resulted in markedly lower leukemia burden in the brains of engrafted mice (Fig. 5). IL-15 or IL-15Rα knockdown did not alter the leukemia burden in the bone marrow and spleens of these mice nor change the growth and apoptotic profiles of cultured NALM6 cells (Supporting Information Fig. 4). These findings are consistent with the prior findings that high IL-15 expression is correlated in CNS-positive ALL patients by comparison with CNS-negative patients.13,21 It is possible that assessment of IL-15 expression might help to stratify patients who could benefit from intensified CNS-directed therapies.2,4,55
Future work is expected to shed light on the mechanistic roles for IL-15-mediated signaling in brain metastasis. In addition to the potential for an IL-15/IL-15R auto/paracrine axis, feedback loops may result in upregulation of cytokine and chemokine receptors that mediate lymphoblastic infiltration into meningeal spaces25–27 and/or intracellular players that govern transmigration, such as myosin-IIA.62 The NALM6 model may be particularly useful for understanding processes that lead to leukemia invasion of brain parenchyma, which was associated with only 10% of cases in a 1972 study of 126 autopsies.35 Case reports of intracerebral metastases remain relatively rare32,37,38; because these cases were all associated with relapse, it is possible that occasional intraparenchymal colonies can offer leukemia cells sanctuary from standard treatments. The resolution of current brain imaging capabilities in the clinic is likely to be too low to capture small lesions, providing some explanation for relapse of specific individuals that cannot be predicted from routine CSF sampling with the administration of intrathecal therapy. A full understanding of the complex factors that govern CNS disease will be needed to develop therapeutic combinations that lower risk for relapse in affected individuals.
Supplementary Material
ACKNOWLEDGMENTS
The authors thank members of the Wilson and Lidke labs for helpful discussion and acknowledge the shared resources of the UNM Comprehensive Cancer Center (P30CA118100). This work was funded by pilot funds from the New Mexico Spatiotemporal Modeling Center (P50GM085273) and the UNM Comprehensive Cancer Center. DB was supported by 17.1223.2017.
Abbreviations:
- BBB
blood-brain barrier
- BCP-ALL
B cell precursor acute lymphoblastic leukemia
- BM
bone marrow
- CD
cluster of differentiation
- EV
extracellular vesicle
- GFAP
glial fibrillary acidic protein
- Iba-1
ionized calcium-binding adapter molecule 1
- IF
immunofluorescence
- IHC
immunohistochemistry
- IL-15R
interleukin 15 receptor
- IL-1β, IL-15
interleukins 1β or 15
- NSG
IL-2R common γ-chain deficient NOD/LtSz-scid
- VEGF
vascular endothelial growth factor
Footnotes
CONFLICTS OF INTEREST
The authors have no relevant conflicts of interest to disclose.
SUPPORTING INFORMATION
Additional information may be found online in the Supporting Information section at the end of the article.
REFERENCES
- 1.Matloub Y, Bostrom BC, Hunger SP, et al. Escalating intravenous methotrexate improves event-free survival in children with standard risk acute lymphoblastic leukemia: a report from the Children’s Oncology Group. Blood. 2011;118:243–251. [DOI] [PMC free article] [PubMed] [Google Scholar]
- 2.Rabin KR. Attacking remaining challenges in childhood leukemia. N Engl J Med. 2012;366:1445–1446. [DOI] [PubMed] [Google Scholar]
- 3.Mahmoud HH, Rivera GK, Hancock ML, et al. Low leukocyte counts with blast cells in cerebrospinal fluid of children with newly diagnosed acute lymphoblastic leukemia. N Engl J Med. 1993;329:314–319. [DOI] [PubMed] [Google Scholar]
- 4.Pui CH, Howard SC. Current management and challenges of malignant disease in the CNS in paediatric leukaemia. Lancet Oncol. 2008;9: 257–268. [DOI] [PubMed] [Google Scholar]
- 5.Matloub Y, Lindemulder S, Gaynon PS, et al. Intrathecal triple therapy decreases central nervous system relapse but fails to improve event free survival when compared with intrathecal methotrexate: results of the Children’s Cancer Group (CCG) 1952 study for standard-risk acute lymphoblastic leukemia, reported by the Children’s Oncology Group. Blood. 2006;108:1165–1173. [DOI] [PMC free article] [PubMed] [Google Scholar]
- 6.Vora A, Andreano A, Pui CH, et al. Influence of cranial radiotherapy on outcome in children with acute lymphoblastic leukemia treated with contemporary therapy. J Clin Oncol. 2016;34:919–926. [DOI] [PMC free article] [PubMed] [Google Scholar]
- 7.Clarke M, Gaynon P, Hann I, et al. CNS-directed therapy for child hood acute lymphoblastic leukemia: Childhood ALL Collaborative Group overview of 43 randomized trials. J Clin Oncol. 2003;21: 1798–1809. [DOI] [PubMed] [Google Scholar]
- 8.Cheung YT, Sabin ND, Reddick WE, et al. Leukoencephalopathy and long-term neurobehavioural, neurocognitive, and brain imaging outcomes in survivors of childhood acute lymphoblastic leukaemia treated with chemotherapy: a longitudinal analysis. Lancet Haematol. 2016;3:e456–e466. [DOI] [PMC free article] [PubMed] [Google Scholar]
- 9.Moleski M. Neuropsychological, neuroanatomical, and neurophysiological consequences of CNS chemotherapy for acute lymphoblastic leukemia. Arch Clin Neuropsychol. 2000;15:603–630. [PubMed] [Google Scholar]
- 10.Howard SC, Gajjar AJ, Cheng C, et al. Risk factors for traumatic and bloody lumbar puncture in children with acute lymphoblastic leukemia. JAMA. 2002;288:2001–2007. [DOI] [PubMed] [Google Scholar]
- 11.Hijiya N, Hudson MM, Lensing S, et al. Cumulative incidence of secondary neoplasms as a first event after childhood acute lymphoblastic leukemia. JAMA. 2007;297:1207–1215. [DOI] [PubMed] [Google Scholar]
- 12.Hicks C, Sitthi-Amorn J, Douglas J, et al. Molecular analysis of central nervous system disease spectrum in childhood acute lymphoblastic leukemia. Clin Med Insights Oncol. 2016;10:5–15. [DOI] [PMC free article] [PubMed] [Google Scholar]
- 13.Cario G, Izraeli S, Teichert A, et al. High interleukin-15 expression characterizes childhood acute lymphoblastic leukemia with involvement of the CNS. J Clin Oncol. 2007;25:4813–4820. [DOI] [PubMed] [Google Scholar]
- 14.Holland M, Castro FV, Alexander S, et al. RAC2, AEP, and ICAM1 expression are associated with CNS disease in a mouse model of pre-B childhood acute lymphoblastic leukemia. Blood. 2011;118:638–649. [DOI] [PubMed] [Google Scholar]
- 15.Scrideli CA, Queiroz RP, Takayanagui OM, Bernardes JE, Melo EV, Tone LG. Molecular diagnosis of leukemic cerebrospinal fluid cells in children with newly diagnosed acute lymphoblastic leukemia. Haematologica. 2004;89:1013–1015. [PubMed] [Google Scholar]
- 16.Gossai NP, Gordon PM. The role of the central nervous system microenvironment in pediatric acute lymphoblastic leukemia. Front Pediatr. 2017;5:90. [DOI] [PMC free article] [PubMed] [Google Scholar]
- 17.Serlin Y, Shelef I, Knyazer B, Friedman A. Anatomy and physiology of the blood-brain barrier. Semin Cell Dev Biol. 2015;38:2–6. [DOI] [PMC free article] [PubMed] [Google Scholar]
- 18.Abbott NJ, Ronnback L, Hansson E. Astrocyte-endothelial interactions at the blood-brain barrier. Nat Rev Neurosci. 2006;7:41–53. [DOI] [PubMed] [Google Scholar]
- 19.Argaw AT, Zhang Y, Snyder BJ, et al. IL-1beta regulates blood-brain barrier permeability via reactivation of the hypoxia-angiogenesis program. J Immunol. 2006;177:5574–5584. [DOI] [PubMed] [Google Scholar]
- 20.Connell JJ, Chatain G, Cornelissen B, et al. Selective permeabilization of the blood-brain barrier at sites of metastasis. J Natl Cancer Inst. 2013;105:1634–1643. [DOI] [PMC free article] [PubMed] [Google Scholar]
- 21.Williams MT, Yousafzai Y, Cox C, et al. Interleukin-15 enhances cellular proliferation and upregulates CNS homing molecules in pre-B acute lymphoblastic leukemia. Blood. 2014;123:3116–3127. [DOI] [PubMed] [Google Scholar]
- 22.Argaw AT, Asp L, Zhang J, et al. Astrocyte-derived VEGF-A drives blood-brain barrier disruption in CNS inflammatory disease. J Clin Invest. 2012;122:2454–2468. [DOI] [PMC free article] [PubMed] [Google Scholar]
- 23.Chapouly C, Tadesse Argaw A, Horng S, et al. Astrocytic TYMP and VEGFA drive blood-brain barrier opening in inflammatory central nervous system lesions. Brain. 2015;138:1548–1567. [DOI] [PMC free article] [PubMed] [Google Scholar]
- 24.Kato I, Nishinaka Y, Nakamura M, et al. Hypoxic adaptation of leukemic cells infiltrating the CNS affords a therapeutic strategy targeting VEGFA. Blood. 2017;129:3126–3129. [DOI] [PMC free article] [PubMed] [Google Scholar]
- 25.Jost TR, Borga C, Radaelli E, et al. Role of CXCR4-mediated bone marrow colonization in CNS infiltration by T cell acute lymphoblastic leukemia. J Leukoc Biol. 2016;99:1077–1087. [DOI] [PubMed] [Google Scholar]
- 26.Passaro D, Irigoyen M, Catherinet C, et al. CXCR4 is required for leukemia-initiating cell activity in T cell acute lymphoblastic leukemia. Cancer Cell. 2015;27:769–779. [DOI] [PubMed] [Google Scholar]
- 27.Buonamici S, Trimarchi T, Ruocco MG, et al. CCR7 signalling as an essential regulator of CNS infiltration in T-cell leukaemia. Nature. 2009;459:1000–1004. [DOI] [PMC free article] [PubMed] [Google Scholar]
- 28.Raposo G, Stoorvogel W. Extracellular vesicles: exosomes, microvesicles, and friends. J Cell Biol. 2013;200:373–383. [DOI] [PMC free article] [PubMed] [Google Scholar]
- 29.Steinbichler TB, Dudas J, Riechelmann H, Skvortsova II. The role of exosomes in cancer metastasis. Semin Cancer Biol. 2017;44:170–181. [DOI] [PubMed] [Google Scholar]
- 30.Boyiadzis M, Whiteside TL. The emerging roles of tumor-derived exosomes in hematological malignancies. Leukemia. 2017;31:1259–1268. [DOI] [PubMed] [Google Scholar]
- 31.Kumar B, Garcia M, Murakami JL, Chen CC. Exosome-mediated microenvironment dysregulation in leukemia. Biochim Biophys Acta. 2016;1863:464–470. [DOI] [PubMed] [Google Scholar]
- 32.Gokce M, Aytac S, Altan I, et al. Intracerebral metastasis in pediatric acute lymphoblastic leukemia: a rare presentation. J Pediatr Neurosci. 2012;7:208–210. [DOI] [PMC free article] [PubMed] [Google Scholar]
- 33.Laningham FH, Kun LE, Reddick WE, Ogg RJ, Morris EB, Pui CH. Childhood central nervous system leukemia: historical perspectives, current therapy, and acute neurological sequelae. Neuroradiology. 2007;49:873–888. [DOI] [PMC free article] [PubMed] [Google Scholar]
- 34.Bleggi-Torres LF, de Medeiros BC, Werner B, et al. Neuropathological findings after bone marrow transplantation: an autopsy study of 180 cases. Bone Marrow Transplant. 2000;25:301–307. [DOI] [PubMed] [Google Scholar]
- 35.Price RA, Johnson WW. The central nervous system in childhood leukemia. I. The arachnoid. Cancer. 1973;31:520–533. [DOI] [PubMed] [Google Scholar]
- 36.Ginsberg LE, Leeds NE. Neuroradiology of leukemia. AJR Am J Roentgenol. 1995;165:525–534. [DOI] [PubMed] [Google Scholar]
- 37.Lee SH, Park J, Hwang SK. Isolated recurrence of intracerebral granulocytic sarcoma in acute lymphoblastic leukemia: a case report. J Neurooncol. 2006;80:101–104. [DOI] [PubMed] [Google Scholar]
- 38.Lowichik A, Bernini JC, Tonk V, et al. Relapse of precursor B-cell acute lymphoblastic leukemia as an isolated central nervous system mass lesion 9 years after initial diagnosis. Med Pediatr Oncol. 1996;26: 129–134. [DOI] [PubMed] [Google Scholar]
- 39.Hurwitz R, Hozier J, LeBien T, et al. Characterization of a leukemic cell line of the pre-B phenotype. Int J Cancer. 1979;23:174–180. [DOI] [PubMed] [Google Scholar]
- 40.Lock RB, Liem N, Farnsworth ML, et al. The nonobese diabetic/severe combined immunodeficient (NOD/SCID) mouse model of childhood acute lymphoblastic leukemia reveals intrinsic differences in biologic characteristics at diagnosis and relapse. Blood. 2002;99: 4100–4108. [DOI] [PubMed] [Google Scholar]
- 41.Kinjyo I, Matlawska-Wasowska K, Chen X, et al. Characterization of the anti-CD22 targeted therapy, moxetumomab pasudotox, for B cell precursor acute lymphoblastic leukemia. Pediatr Blood Cancer. 2017;64: 10.1002/pbc.26604. [DOI] [PMC free article] [PubMed] [Google Scholar]
- 42.Matlawska-Wasowska K, Ward E, Stevens S, et al. Macrophage and NK-mediated killing of precursor-B acute lymphoblastic leukemia cells targeted with a-fucosylated anti-CD19 humanized antibodies. Leukemia. 2013;27:1263–1274. [DOI] [PMC free article] [PubMed] [Google Scholar]
- 43.Sipkins DA, Wei X, Wu JW, et al. In vivo imaging of specialized bone marrow endothelial microdomains for tumour engraftment. Nature.2005;435:969–973. [DOI] [PMC free article] [PubMed] [Google Scholar]
- 44.Shen Z, Lu Z, Chhatbar PY, O’Herron P, Kara P. An artery-specific fluorescent dye for studying neurovascular coupling. Nat Methods.2012;9:273–276. [DOI] [PMC free article] [PubMed] [Google Scholar]
- 45.Ladeby R, Wirenfeldt M, Garcia-Ovejero D, et al. Microglial cell population dynamics in the injured adult central nervous system. Brain Res Brain Res Rev. 2005;48:196–206. [DOI] [PubMed] [Google Scholar]
- 46.Wilhelmsson U, Bushong EA, Price DL, et al. Redefining the concept of reactive astrocytes as cells that remain within their unique domains upon reaction to injury. Proc Natl Acad Sci U S A. 2006;103: 17513–17518. [DOI] [PMC free article] [PubMed] [Google Scholar]
- 47.Vollmer J, Weeratna R, Payette P, et al. Characterization of three CpG oligodeoxynucleotide classes with distinct immunostimulatory activities. Eur J Immunol. 2004;34:251–262. [DOI] [PubMed] [Google Scholar]
- 48.Jiang W, Lederman MM, Harding CV, Rodriguez B, Mohner RJ, Sieg SF. TLR9 stimulation drives naive B cells to proliferate and to attain enhanced antigen presenting function. Eur J Immunol. 2007;37: 2205–2213. [DOI] [PubMed] [Google Scholar]
- 49.Thery C, Amigorena S, Raposo G, Clayton A. Isolation and characterization of exosomes from cell culture supernatants and biological fluids. Curr Protoc Cell Biol. 2006. Chapter 3, Unit 3 22. [DOI] [PubMed] [Google Scholar]
- 50.Kowal J, Arras G, Colombo M, et al. Proteomic comparison defines novel markers to characterize heterogeneous populations of extracellular vesicle subtypes. Proc Natl Acad Sci U S A. 2016;113:E968–77. [DOI] [PMC free article] [PubMed] [Google Scholar]
- 51.Oksvold MP, Kullmann A, Forfang L, et al. Expression of B-cell surface antigens in subpopulations of exosomes released from B-cell lymphoma cells. Clin Ther. 2014;36:847–862. e1. [DOI] [PubMed] [Google Scholar]
- 52.Shalem O, Sanjana NE, Hartenian E, et al. Genome-scale CRISPR-Cas9 knockout screening in human cells. Science. 2014;343:84–87. [DOI] [PMC free article] [PubMed] [Google Scholar]
- 53.Doench JG, Fusi N, Sullender M, et al. Optimized sgRNA design to maximize activity and minimize off-target effects of CRISPR-Cas9. Nat Biotechnol. 2016;34:184–191. [DOI] [PMC free article] [PubMed] [Google Scholar]
- 54.Eichler AF, Chung E, Kodack DP, Loeffler JS, Fukumura D, Jain RK. The biology of brain metastases-translation to new therapies. Nat Rev Clin Oncol. 2011;8:344–356. [DOI] [PMC free article] [PubMed] [Google Scholar]
- 55.Pui CH, Thiel E. Central nervous system disease in hematologic malignancies: historical perspective and practical applications. Semin Oncol.2009;36:S2–S16. [DOI] [PMC free article] [PubMed] [Google Scholar]
- 56.Munch V, Trentin L, Herzig J, et al. Central nervous system involvement in acute lymphoblastic leukemia is mediated by vascular endothelial growth factor. Blood. 2017;130:643–654. [DOI] [PubMed] [Google Scholar]
- 57.Izraeli S, Eckert C. Targeted therapy of CNS leukemia?. Blood. 2017;130:562–563. [DOI] [PubMed] [Google Scholar]
- 58.Hoshino A, Costa-Silva B, Shen TL, et al. Tumour exosome integrins determine organotropic metastasis. Nature. 2015;527:329–335. [DOI] [PMC free article] [PubMed] [Google Scholar]
- 59.Kahlert C, Kalluri R. Exosomes in tumor microenvironment influence cancer progression and metastasis. J Mol Med (Berl). 2013;91: 431–437. [DOI] [PMC free article] [PubMed] [Google Scholar]
- 60.Lai FW, Lichty BD, Bowdish DM. Microvesicles: ubiquitous contributors to infection and immunity. J Leukoc Biol. 2015;97:237–245. [DOI] [PubMed] [Google Scholar]
- 61.Tominaga N, Kosaka N, Ono M, et al. Brain metastatic cancer cells release microRNA-181c-containing extracellular vesicles capable of destructing blood-brain barrier. Nat Commun. 2015;6:6716. [DOI] [PMC free article] [PubMed] [Google Scholar]
- 62.Wigton EJ, Thompson SB, Long RA, Jacobelli J. Myosin-IIA regulates leukemia engraftment and brain infiltration in a mouse model of acute lymphoblastic leukemia. J Leukoc Biol. 2016;100:143–153. [DOI] [PMC free article] [PubMed] [Google Scholar]
Associated Data
This section collects any data citations, data availability statements, or supplementary materials included in this article.