Abstract
Emerging evidence of crosstalk between glomerular cells in pathological settings provide opportunities for novel therapeutic discovery. Here we investigated underlying mechanisms of early events leading to filtration barrier defects of podocyte and glomerular endothelial cell crosstalk in the mouse models of primary podocytopathy (podocyte specific transforming growth factor-β receptor 1 signaling activation) or Adriamycin nephropathy. We found that glomerular endothelial surface layer degradation and albuminuria preceded podocyte foot process effacement. These abnormalities were prevented by endothelin receptor-A antagonism and mitochondrial reactive oxygen species scavenging. Additional studies confirmed increased heparanase and hyaluronoglucosaminidase gene expression in glomerular endothelial cells in response to podocyte-released factors and to endothelin-1. Atomic force microscopy measurements showed a significant reduction in the endothelial surface layer by endothelin-1 and podocyte-released factors, which could be prevented by endothelin receptor-A but not endothelin receptor-B antagonism. Thus, our studies provide evidence of early crosstalk between activated podocytes and glomerular endothelial cells resulting in loss of endothelial surface layer, glomerular endothelial cell injury and albuminuria. Hence, activation of endothelin-1-endothelin receptor-A and mitochondrial reactive oxygen species contribute to the pathogenesis of primary podocytopathies in experimental focal segmental glomerulosclerosis.
Keywords: Glomerular endothelial cells, podocytes, crosstalk, glomerular endothelial surface layer, glycocalyx, proteinuria, TGF-βI, endothelin-1
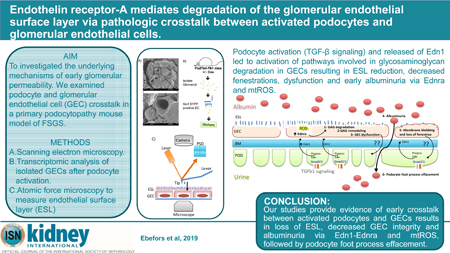
Graphical Abstract
Introduction
Microalbuminuria represents an early biological marker of endothelial dysfunction, and endothelial cell dysfunction can drive progression of kidney disease1, 2. The glomerular endothelium is covered with an endothelial surface layer (ESL) that consists of a membrane bound glycocalyx and a ‘cell coat’. The glycocalyx is composed of a negatively charged network of proteoglycans, glycoproteins, and glycolipids anchored to the endothelium and a more loosely attached ‘cell coat’ which aid in maintaining the charge selective glomerular barrier function and prevent proteinuria3–5. Loss of the ESL may contribute to endothelial dysfunction in renal and cardiovascular disease progression6,7.
Transforming growth factor-β (Tgfb) and its signal transducers play important roles in the development of various kidney diseases and are important mediators of renal injury and fibrosis in progressive chronic kidney disease (CKD)8, 9. Tgfb expression in podocytes is a stress response signal associated with sclerosis lesions10, 11, apoptosis and podocyte depletion12, 13. In a mouse model of focal segmental glomerulosclerosis (FSGS) where podocyte-specific TGF-β receptor 1 (Tgfbr1) activation induces progressive glomerular disease and renal failure, we have earlier demonstrated release of endothelin-1 (Edn1) by podocytes, followed by increased EdnrA-mediated mitochondrial oxidative stress and dysfunction of adjacent glomerular endothelial cells (GEC), which in response, release factor(s) that mediate damage and depletion of adjacent podocytes14. A similar stressed endothelial-to-podocyte crosstalk could also underlie segmental lesions in diabetic kidney disease (DKD)15. Here, we provide evidence of early GEC injury and ESL degradation in response to podocyte Tgfbr1 signaling activation. Podocyte-derived Edn1 interacted with increased GEC EdnrA expression resulting in mitochondrial reactive oxygen species (ROS) and activation of ESL degradation and remodeling pathways. Together, these crosstalking events could underlie increase in glomerular permeability to albumin in kidney disease.
Results
Activation of podocyte-specific Tgfbr1 signaling causes GEC injury concomitant with albuminuria.
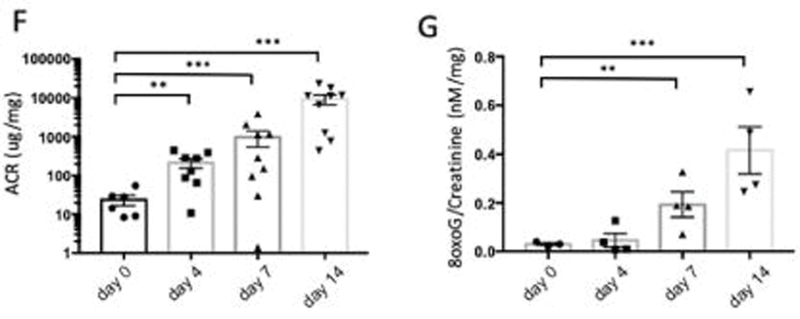
We examined the effects of podocyte specific doxycycline (DOX)-inducible activation of TGF-β receptor 1 (Tgfbr1) signaling in PodTgfbr1 transgenic mice14 using scanning electron microscopy (SEM). In this mouse model, canonical Tgfbr1 signaling was demonstrated to be specific to podocytes14. Glomeruli from DOX treated PodTgfbr1 showed distinct morphological changes in capillary vessels starting at day 4 including cytoplasmic protrusions, ridges (Figure 1a) and overall decreased number of fenestrae compared to controls. Semi-quantitative analysis using the endothelial morphology index (EMI)15 confirmed significantly increased lesions at 4d with prominent lesions at day 7–14 DOX (Figure 1A,C). Widening and effacement of podocyte foot processes (PFP) were evident at days 7–14 DOX (Figure 1B). Compared to controls, there was no change in the PFP numbers at day 4, but significant reductions were detected at days 7–14 of DOX (Figure 1D). Analysis by transmission electron microscopy (TEM) of day 4 DOX treated PodTgfbr1 shows GECs with blebs protruding into capillary lumens (*Figure 1E), while there was normal PFP pattern (arrows) and normal glomerular basement membrane (GBM). As previously reported14, podocyte Tgfbr1 activation resulted in significantly increased albumin:creatinine (ACR) after 4–14 days (Figure 1F), and urine 8-oxo-dG (8Oxo-2’-deoxyguanosine; oxidative stress marker15) after day 7–14 of DOX (Figure 1G). DOX treatment induced segmental glomerulosclerosis by day 7, and global glomerulosclerosis with tubulointerstitial fibrosis by day 14 (Supplementary Figure S1A–D).
Figure 1. Tgfbr1 signaling activation in podocytes induces ultrastructural changes in endocapillaries preceding ultrastructural changes in podocyte.
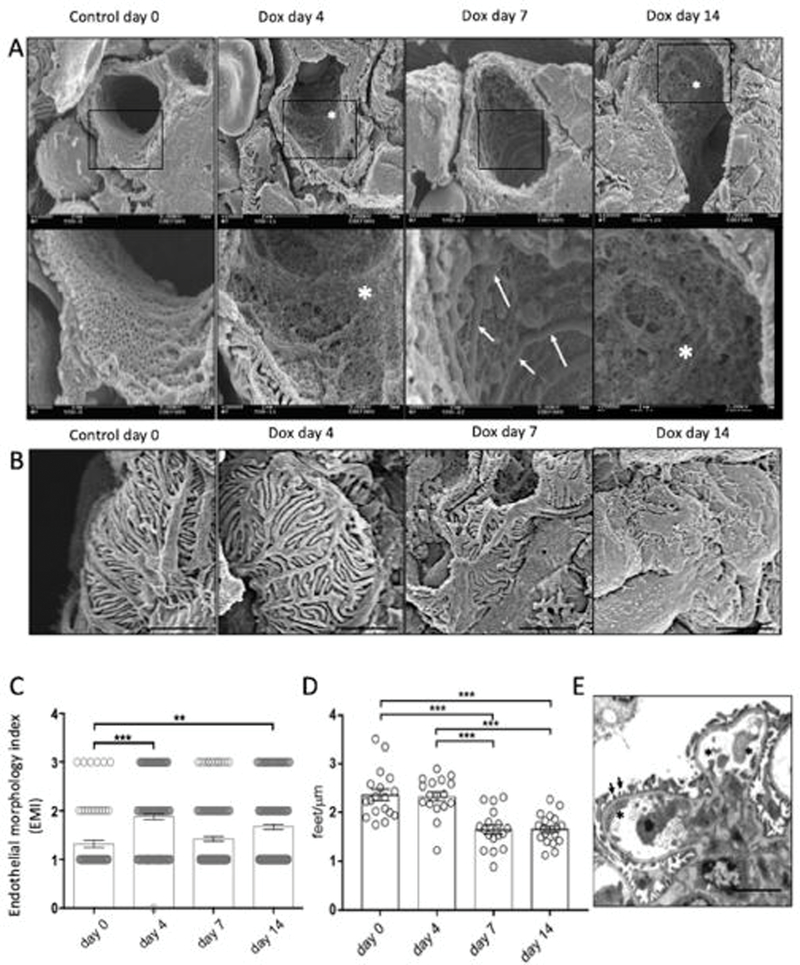
(A) Glomerular capillary structure of PodTgfbr1 mice was examined by scanning electron microscopy (SEM) in untreated controls and after Tgfbr1 signaling activation in podocytes with DOX at day 4, 7, and 14. Representative images of capillary vessels at magnification ×10000 upper panel, ×30000 lower panel (white arrows show endothelial ridges, white asterix depict endothelial with not fenestrations). (B) Representative images of podocytes from glomeruli in (A). (C) A semiquantitative endothelial morphology index (EMI) at ×10000 magnification was applied: 0 = normal fenestrations, no visible irregularities; 1 = partly disrupted endothelial cell pattern and fenestrations 10–30% of area; 2 = endothelial cells containing few visible fenestrations, 30–70% of area; 3 = no fenestrations present and irregular protrusions. Mean ± SEM of at least 125 capillary vessels of glomeruli from 5 mice per group. (D) The number of podocyte foot processes per length (PFP/μm) of PodTgfb1 ±DOX at different times (n = 700 PFP counted per group, 3 mice per group. Mean ± SEM PFP/μm/capillary). (E) TEM of glomeruli at 4d DOX (black arrows show normally arranged PFP, black asterix depict endothelial cell protrusions). Functional data from PodTgfbr1; (F) ACR and (G) Urinary 8-oxoG excretion of day 0 controls, day 4–14 of DOX (+/− SEM n=4–9 mice/time point). Error bars represent SEM and * P<0.05, ** P<0.01, *** P<0.001.
These observations suggest endothelial injury and dysfunction mediated by podocyte activation through Tgfbr1 signaling. Interestingly, significant albuminuria was detected at 4d DOX without any visible podocyte defects. We hypothesize that podocyte-GEC crosstalk results in GEC injury and concomitant albuminuria. To understand the GEC-specific signaling in response to podocyte Tgfbr1 activation in mice, we next performed transcriptomic analysis of isolated GECs.
GEC transcriptome suggests ESL loss after podocyte activation
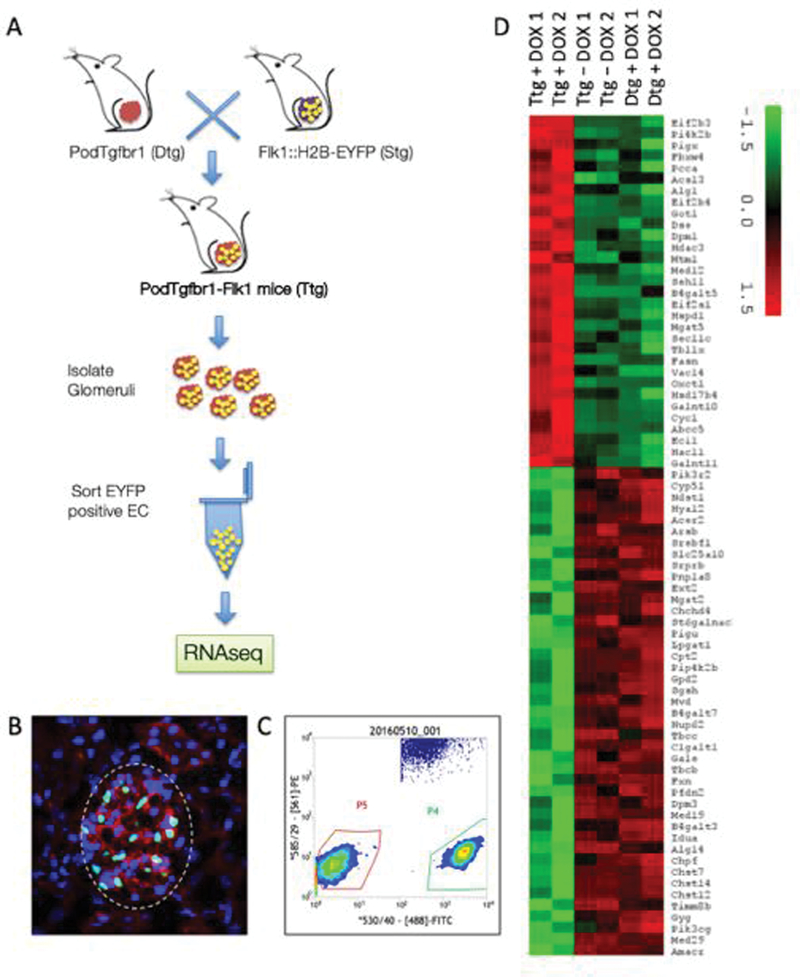
We examined the early transcriptome of GECs by crossing Podtgfbr1 mice with Flk1::H2B-EYFP mice which allow for detection and isolation of GECs through enhanced yellow fluorescent protein (EYFP) expressed under the control of an Flk1 (VEGFR-2) promoter16. We generated PodTgfbr1-Flk1 triple transgenic (Ttg) mice (Figure 2A) on a FVB background. EYFP positive nuclei in glomeruli from PodTgfbr1-Flk1 mice were associated with cytoplasmic CD31 staining (Figure 2B) and not associated with podocytes17. EYFP positive GECs (Gated P4; Figure 2C) were isolated from PodTgfbr1-Flk1 no-DOX controls (triple transgenic; Ttg), Pod-Flk1 +4d DOX (double transgenic; Dtg) controls, to PodTgfbr1-Flk1 +4d DOX treated mice. The GECs were pooled from 3–6 mice per sample run for sequencing (n=2 Ttg-DOX, n=2 Dtg+4dDOX, n=2 Ttg+4dDOX). Among the top differentially expressed genes (DEGs) were pathways involving carbohydrate and glycosaminoglycan (GAG) metabolism, dysregulation of N-glycan/chondroitin/keratan/heparan sulfate biosynthesis and concomitant GAG degradation (Supplemental Figure S2a), suggesting loss and turnover of the endothelial surface layer (ESL) reservoir. The heat-map of DEGs for GAG metabolism and validated expression of selected genes in sorted GECs is shown in Figure 2D and Supplemental Figure S2B.
Figure 2. Tgfbr1 signaling in podocytes of Flk1::H2B-EYFP mice results in activation of endothelial surface layer (ESL) degradation pathways.
(A) Mating strategy of PodTgfbr1 double transgenic (Dtg) (FVB background) crossed with Flk1::H2B-EYFP mice (10 generation backcrossed to FVB) to generate PodTgfbr1-Flk1 mice with GECs expressing enhanced yellow fluorescent protein (EYFP) positive nuclei. Pod-Flk1 (Dtg) and PodTgfbr1-Flk1 (Ttg) mice were fed +/− DOX and glomeruli we isolated after 4d of treatment and followed by FACS sorting of EYFP cells. (B) Representative glomeruli from PodTgfbr1-Flk1 Ttg mice showing DAPI (blue) and EYFP positive GEC nuclei (green) and CD31 cellular staining (red). (C) EYFP positive GECs were sorted and isolated by FACS (Gated P4) from controls and 4 days of DOX treated PodTgfbr1-Flk1 mice as described in 58. The Gated P5 cells were negative EYFP glomerular cells. 10,000–30,000 EYFP positive GECs/mouse were collected and 3–6 mice were pooled to yield sufficient RNA for sequencing per sample run. Transcriptomic assessment of GECs isolated from Flk1::H2B-EYFP mice. (D) Heatmap of genes in glycosaminoglycan related pathways show the differential expression of genes in these pathways between triple transgenic (Ttg) PodTgfbr1-Flk1 mice + day 4 DOX, double transgenic (Dtg) Pod-Flk1 mice + day 4 DOX, Ttg PodTgfbr1-Flk1 mice no -DOX control mice.
Podocyte Tgfbr1 signaling results in ESL loss of GECs via EdnrA and ROS
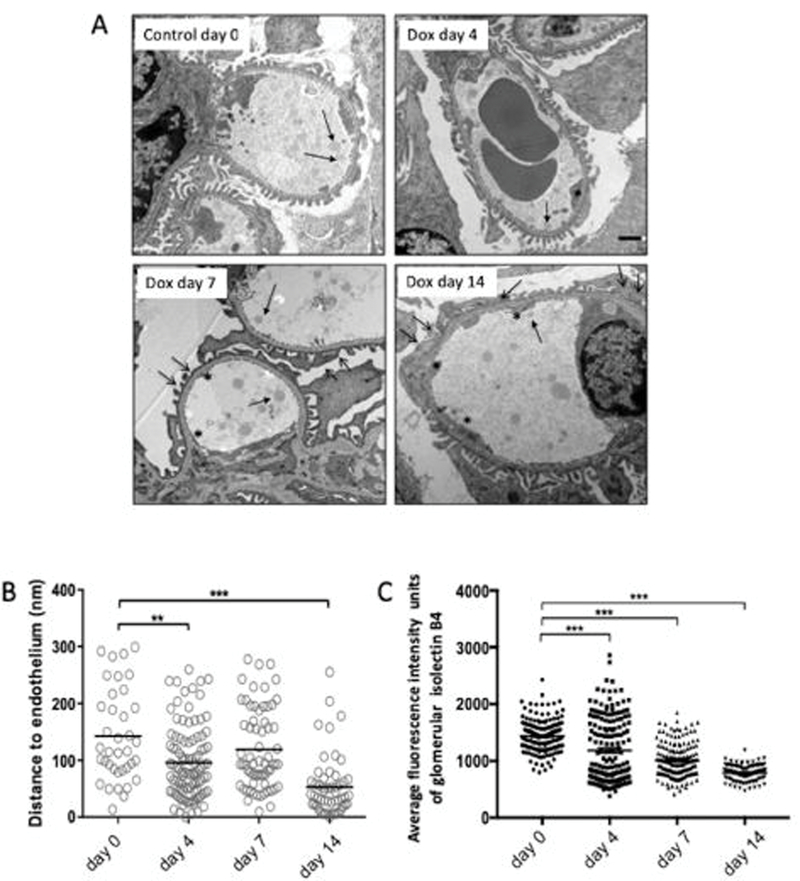
To confirm that there was loss and turnover of ESL in glomerular capillaries upon Tgfbr1 activation in podocytes, we next measured ESL in PodTgfbr1 mice ±DOX by intralipid infusions18. Representative TEM images of capillary vessels showing the intralipids (Figure 3A-arrow) depicting indirectly the thickness of the ESL showed a striking and significant loss of ESL thickness at 4d DOX that declined further with treatment time (Figure 3A, B). We used Isolecting B4 (IB4) to label glycoconjugates, which make up a large portion of the ESL19, Figure 3C, 4C–D show a significant reduction of Isolectin B4 staining intensity per glomerulus at 4d DOX, declining further with time of treatment.
Figure 3. Tgfbr1 signaling in podocytes results in loss of the endothelial surface layer (ESL).
Glomerular ESL of PodTgfbr1 controls and after 4–14 days of DOX was determined by measuring the distance of perfused intralipid droplets and endothelial cells surface by electron microscopy (5–6 mice per time point). (A) Representative TEM images controls and after 4–14 days of DOX. Solid arrows show the lipid droplets, open arrows show podocyte foot process effacement and flattening, and asterix * depict abnormal non-fenestrated GEC area. (B) Quantification of the measured distance between perfused intralipid droplets and endothelial cells surface in nm, at different time points (day 0–14 DOX) (C) Isolectin B4 fluorescent positive glomerular staining intensity of GECs from controls and after 4–14 days of DOX. ** P<0.01, *** P<0.001
Figure 4. Tgfbr1 signaling in podocytes results in loss of the ESL mediated by EdnrA and mitochondrial ROS.
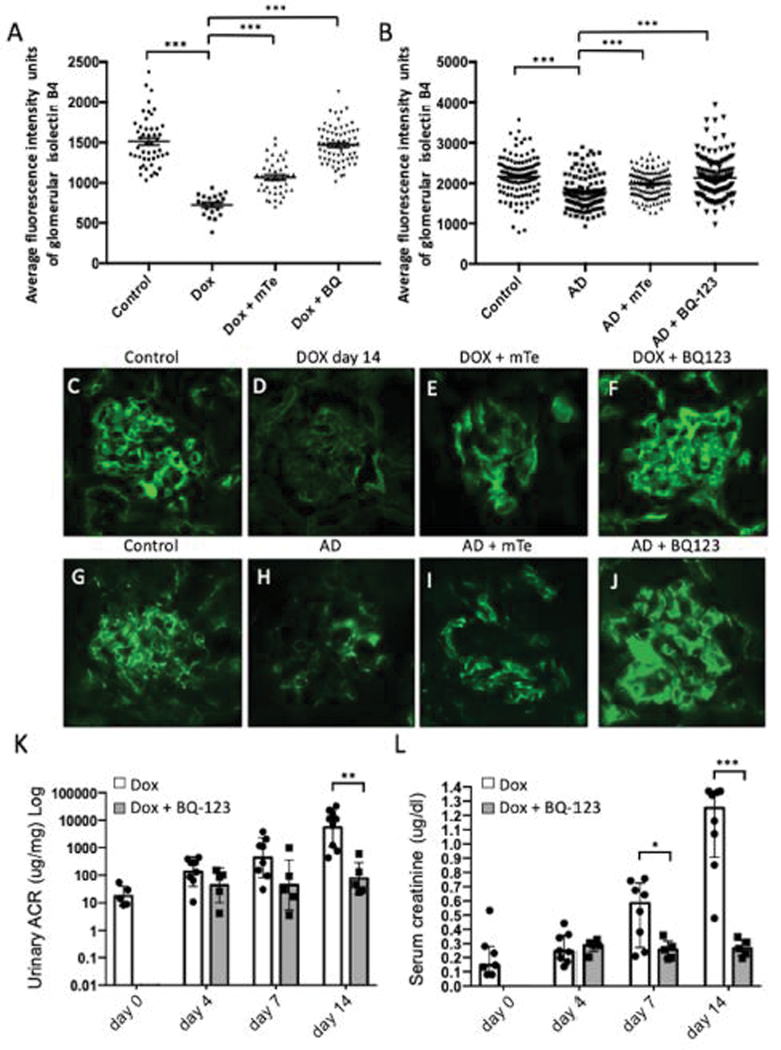
(A) Isolectin B4 positive staining intensity of 0d control mice and mice treated 14 days with DOX ± MitoTEMPO (mTe, mitochondrial ROS scavenger, 1mg/kg/day) or BQ-123 (EdnrA inhibitor; 0.1nM/kg/day), 4–5 mice per group. (B) Balbc control mice and mice + Adriamycin (AD), ± mTe, or ± BQ-123, 5–8 mice per group (C) Isolectin B4 glomerular staining in GECs from control PodTgfbr1 mice and (D) mice treated 14 days with DOX, (E) DOX + mTe (F) DOX + BQ-123. (G) Balbc control, (H) Balbc treated with Adriamycin and (I) Adriamycin + mTe (J) Adriamycin + BQ-123. (K) ACR and (L) serum creatinine of controls, 4–14 days of DOX +/− BQ-123, in 5–8 mice per group. Error bars represent SEM and * P<0.05, ** P<0.01, *** P<0.001.
Endothelin receptor-A (EdnrA) inhibitors have been shown to prevent glycocalyx loss in mice with DKD20, 21. We have reported an increase in EdnrA expression specifically in GECs of experimental FSGS and DKD mice, and EdnrA antagonism prevented GEC mitochondrial oxidative damage, albuminuria and podocyte loss14, 15. We next examined EdnrB expression. In control glomeruli, EdnrB is expressed mainly in podocytes (Supplementary Figure S3a–arrows) and in large vessels (Figure S3a–arrows open arrows), as previously reported22, 23. EdnrB expression in glomeruli decreased with Tgfbr1 signaling activation in PodTgfbrI mice (Supplementary Figure S3A). A temporal loss of synaptopodin staining after DOX 7d–14d as podocyte density decreases, verifying our previous findings14. Gene expression in isolated glomeruli from PodTgfbrI mice demonstrated a transient and significant increase in EdnrA and a decrease of EdnrB expression compared to controls (Supplementary Figure S3B). Next, we examined Edn1 expression in isolated glomerular cells from PodTgfbr1-Flk1 mice. Supplementary Figure S2C shows that EYFP negative cells (non-GEC glomerular cells), had increased Edn1 mRNA expression after 4d DOX, while EdnrA levels were low and unchanged after 4d DOX. As expected, EYFP negative cells had high expression levels of Tgfbr1 transgene, undetectable levels of Ecadherin and higher vimentin expression than EYFP positive GECs (Supplementary Figure S1D). These results confirm that, upon Tgfbr1 activation of podocytes by DOX in vivo, there is a local increase in Edn1 expression by podocytes potentially interacting with the increased EdnrA by GECs, consistent with our previous findings14. Treatment of 14d DOX PodTgfbrI mice treated mice with BQ-123; a specific EdnrA antagonist24, or mitoTEMPO a mitochondrial specific ROS-scavenger, rescued the Isolectin B4 positive glomerular staining (Figure 4A, 4C–F). BQ-123 also reduced DOX induced ACR significantly at days 7–14 and prevented increased serum creatinine detected at days 7–14 (Figure 4K,L). These data suggest that Edn1-EdnrA mediates ESL loss of GECs, possibly through increased mitochondrial ROS14, in turn could result in the early albuminuria observed at day 4 DOX (Figure 1F, 4K). We examined the intensity of glycoconjugates labeling by Isolectin B4 in Adriamycin (AD) treated Balb/c mice, another model of podocyte injury and experimental FSGS25. We confirmed albuminuria and FSGS in these mice 6 days post AD injection reported in 14. Interestingly at 6 days post AD injection there was a significant decrease in glomerular Isolectin B4 staining that was ameliorated by treatment with BQ-123 and mitoTEMPO (Figure 4B, 4G–J). Both mitoTEMPO and BQ-123 treatment also significantly reduced ACR [from 6685nM/mg (+/1401) to 5175nM/mg (+/−853) and 2535nM/mg (+/−789), respectively] and serum creatinine [from 0.87ug/ml (+/−0.074) to 0.56ug/ml (+/−0.111) and 0.65ug/ml (+/−0.075), respectively]14.
Podocyte-derived endothelin-1 mediates mGECs ESL loss via EdnrA
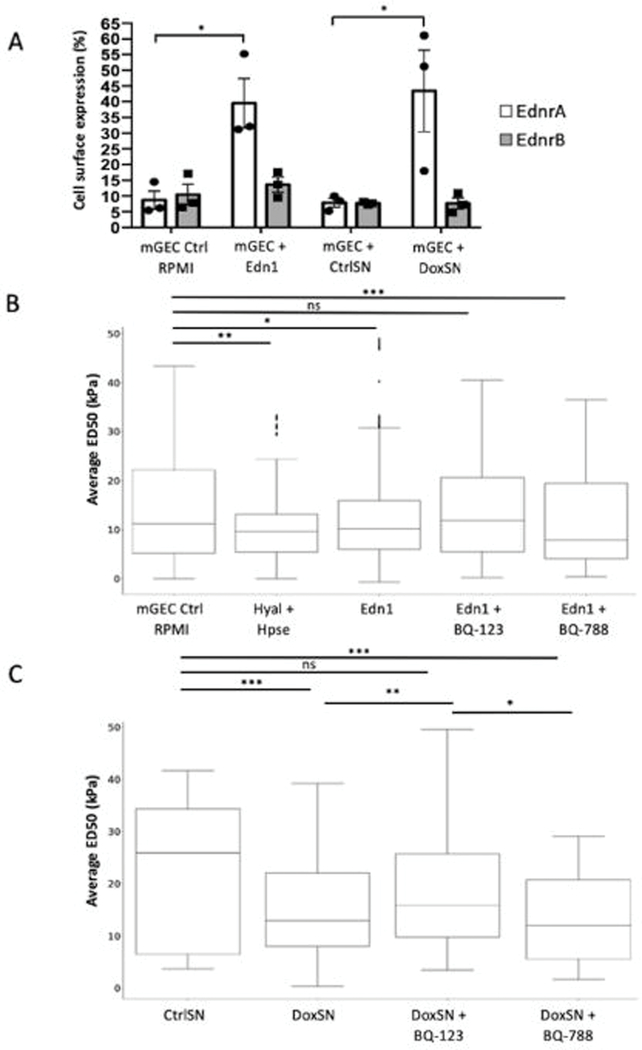
Podocytes produce Edn1 upon Tgfb1 activation in vivo (Supplementary Figure S2C) and in vitro as we have previously shown via canonical SMAD2/3 signaling pathways14. We hypothesize that Edn1 is a key mediator of GEC stress via EdnrA; therefore we next examined the effect of Edn1 on cell surface expression of both Edn1 receptors of conditionally immortalized murine GECs (mGEC)26 using FACS. Exposure to Edn1 for 48hr Edn1 resulted in an increase in EdnrA expression (Figure 5A), as well as further upregulation of Edn1 itself in mGEC, presumably reflecting an autocrine effect of Edn1 (Supplementary Figure S4). In contrast, the levels of EdnrB were unchanged (Figure 5A). To test the effect of crosstalking factors from activated podocytes on receptor expression on mGECs, we co-incubated mGECs with supernatant from PodTgfbr1 podocytes ±DOX for 48hr (CtrlSN, DoxSN). EdnrA and EdnrB mRNA expression in CtrlSN treated mGECs was the same as untreated controls, however only EdnrA was significantly increased in DoxSN co-culture (Figure 5A), we also observed an increase in Edn1 mRNA (Supplementary Figure S4).
Figure 5. Podocyte derived endothelin-1 in DoxSN reduced ESL of mGECs via Ednra.
(A) Percentage (%) of positive cell surface expression of EdnrA and EndrB of mGEC controls in RPMI or treated with Edn1 (200ng), or treated with control supernatant collected from untreated PodTgfbr1 podocytes (CtrlSN) or from DOX treated PodTgfbr1 podocytes (DoxSN) for 48hr of 3 independent experiments. (B) ESL measured by atomic force microscopy (AFM). Pre-contact interaction of the AFM probe with ESL influences shallow post-contact segment of the force-depth response curve as ESL is fully compressed (see Supplementary Figure S5). In short, a denser ESL corresponds to a greater ED50 (see methods for ED50 metric details). The average ED50 values of mGECs in RPMI controls (n=1317), or 2hr treatment with hyaluronidase and Heparinase III (Hyal+Hpse) as positive control (n=550, P=0.0011), or treated 48hr with Edn1 (n=934), Edn1+BQ-123 1ng/ml (n=624), Edn1+BQ-788 (15ng/ml; n=397). (C) Average ED50 of mGECs treated 48hr with PodTgfbr1 podocytes control supernatant (CtrlSN), DOX treated supernatant (DoxSN; n=1088), DoxSN+BQ-123 (n=480) or DoxSN vs. DoxSN+BQ-788 (n=448). n represents number of indentations per group. * P<0.05, ** P<0.01, *** P<0.001.
We used atomic force microscope (AFM) elastography on mGECs to measure the in vitro 3-D biomechanical properties of the ESL through direct contact without exposing cultured cells to fixation or staining procedures that may alter the fragile ESL structure27, 28. Supplementary Figure S5A–C illustrates how the ESL may influence the pre- and post-contact interactions with the AFM probe. We examined the shallow post-contact region within the 50 nm proximity of the cell membrane (i.e., post-contact segment of the force-depth response curves, Supplementary Figure S5D) using the depth-dependent pointwise modulus method27. Figure 5B shows that the ESL stiffness within the first 50nm of contact (ED50) was reduced significantly (14.2±0.3 to 11.4±0.4 kPa) after a 2-hour treatment with hyaluronidase + heparinase-III (Hyal+HepIII), compared to control mGECs (CTRL). Additionally, we examined the effect of Edn1 on mGEC ESL and the effect of specific inhibition of EdnrA or EdnrB with BQ-123 (1ng/ml) or BQ-788 (15ng/ml), respectively. Edn1 reduced ESL stiffness significantly compared to controls (CTRL to Edn1: 14.1±0.3 to 12.4±0.3 kPa), and this reduction was partly prevented by BQ-123 (Edn1 to Edn1+BQ123: 12.4±0.3 to 13.5±0.4 kPa) but not with BQ-788. To determine if Edn1 secreted by podocytes upon activation can impact the ESL of mGECs in culture, we examined the effect of PodTgfbr1 podocyte supernatants without or with Tgfbr1 activation (CtrlSN and DoxSN, respectively), as shown in Figure 5C. Compared to CtrlSN, DoxSN exhibited significantly reduced ESL stiffness (CtrlSN to DoxSN: : 22.4±1.2 to 15.1±0.3 kPa). Here, the DoxSN effect on mGEC ESL was significantly ameliorated by BQ-123 (DoxSN to DoxSN+BQ-123: 15.1±0.3 to 18.6±0.5 kPa) but not by BQ-788. These data suggest that podocyte derived Edn1 reduces mGEC ESL stiffness specifically via EdnrA.
Endothelin-1/EdnrA mediate GAG degradation and remodeling
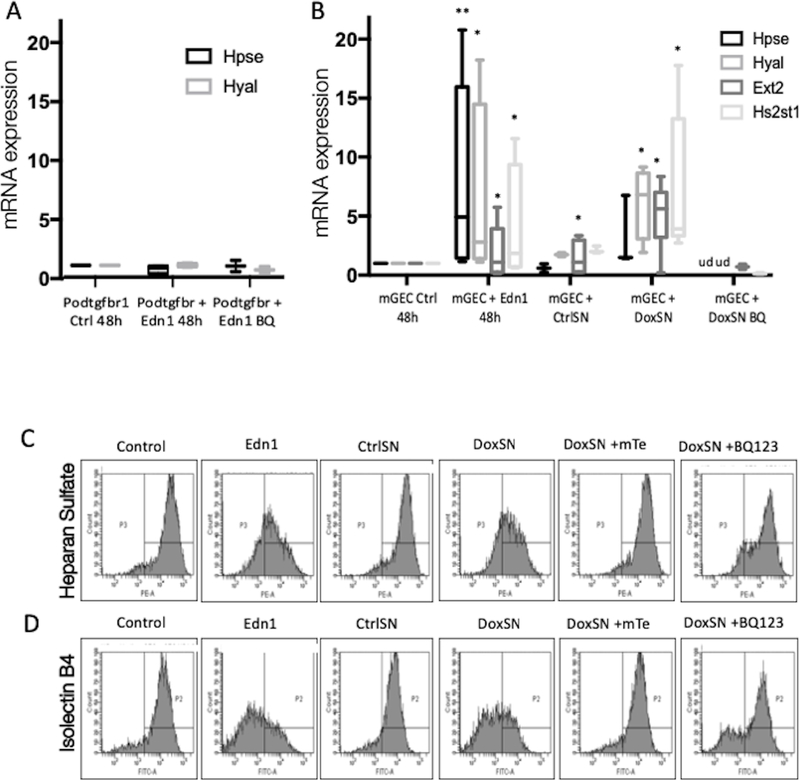
Studies have shown that low expression of heparan sulphate (HS), the main polysaccharide component of the glomerular glycocalyx, is inversely correlated with the degree of proteinuria29. A reduction of the glycocalyx in diabetic apoE knockout mice was mediated by increased glomerular expression of heparanase, which cleaves the glycosidic bonds of HS20. To better understand the mechanism for ESL degradation, we examined the expression of heparanase (Hpse) and hyaluronidase (Hyal) of mGECs and PodTgfbr1 podocytes treated with Edn1. After 48hr incubation with Edn1, there was a significant increase in Hpse and Hyal expression in mGECs but not in podocytes, in contrast to other reports21 (Figure 6A,B). Edn1 influences ESL degradation and remodeling as it also increased exostosin glycosyltransferase-1 (Ext1) and HS 2-O-sulfotransferase-1 (Hs2st1) expression (Figure 5b). mGEC gene expression of Hpse, Hyal, Ext1 and Hs2st1 increased in response to DoxSN but not CtrlSN, and was blocked by BQ-123 treatment. The levels of expression were not changed in Edn1 treated PodTgfbr1 podocytes (Figure 6A,B). These findings correlate with a decrease of HS and Isolectin B4 on mGEC cell surface after Edn1 or DoxSN treatment compared to untreated controls or CtrlSN, respectively (Figure 6C,D). Importantly the loss of HS and Isolectin B4 by DoxSN was prevented by BQ-123 or mitoTEMPO treatment, suggesting that Edn-1 derived from activated podocytes affects ESL via EdnrA and increases mitochondrial ROS.
Figure 6. Podocyte derived endothelin-1 in DoxSN induced degradation and remodeling of ESL via EdnrA and mitochondrial ROS.
(A) mRNA expression for Hpse and Hyal2 of control and Edn1 +/− BQ-123 treated PodTgfbr1 podocytes. (B) mRNA expression of Hpse, Hyal2, Ext1, Hs2st1 of control mGEC, and mGECs treated with Edn1, PodTgfbr1 supernatants (CtrlSN and DoxSN), DoxSN+mTe, DoxSN+BQ-123 for 48hr (+/−SD *P <0.05, **P <0.01, compared to mGEC Ctrl, ud=undetectable). (C) Cell surface heparan sulfate and (D) Isolectin B4 of control mGEC, and mGECs treated Edn1, PodTgfbr1 supernatants (CtrlSN and DoxSN), DoxSN+mTe, DoxSN+BQ-123 for 48hr assessed by FACS.
Discussion
This study provides evidence for important crosstalk between podocytes and GECs, in which sustained activation of Tgfb signaling in podocytes mediated GEC injury and dysfunction via Edn1-EdnrA. We show significant degradation and loss of endothelial surface layer (ESL) and concomitant albuminuria that preceded structural changes in podocytes or in the GBM. Activation of glycosaminoglycan (GAG) degradation pathways in GECs was associated with podocyte derived Edn1. Antagonism of EdnrA or stabilization of mitochondrial ROS in GECs prevented ESL degradation and albuminuria.
The observed GEC dysfunction, with abnormal morphology and decreased fenestrae, after 4 days of Tgfbr1 activation in podocytes is consistent with morphological changes detected in early DKD15 and with a study that used a modified SEM method that allowed visualization of the temporal and intricate changes of glomerular cells in progressive MPGN30. In that study, the authors identified a pathological crosstalk between endothelial cells and podocytes that was correlated with indices of autoimmune disease and renal dysfunction. Although the role of endothelial injury in the pathogenesis of glomerular diseases is not yet fully understood, the findings presented here demonstrate that after podocyte specific activation of Tgfbr1, there are significant structural changes of GECs that affect their function, resulting in loss of glomerular filtration integrity.
GECs have a highly specialized charged luminal glycocalyx layer that contributes to the filtration barrier31, 32, and its damage may be used as a marker of vascular damage linked to microalbuminuria5, 20, 33, 34. Studies in patients have also demonstrated a correlation between serum markers of the ESL with endothelial dysfunction35 and serum markers in CKD36. By isolating GECs before and after activation of podocyte Tgfbr1 signaling in mice, we discovered that degradation and turnover pathways of the ESL components were an early event occurring in GECs. Degradation of the ESL was confirmed by measuring the thickness of the ESL at different time points in vivo, and its stiffness in vitro as measured by AFM. These data are consistent with studies of Tgfb-induced glomerulonephropathy in zebrafish37. Similarly, we detected a significant loss of ESL in Adriamycin treated Balb/c mice.
Restoring the ESL by treatment with Sulodexide, a glycocalyx-mimetic composed of heparan sulphate and dermatan sulphate, has been shown to restore the ESL in a mouse model of sepsis 38 and to reduce microalbuminuria in diabetic patients 39. However, this approach failed to decrease urine albumin excretion in patients with Type 2 DKD in a larger multinational trial40, suggesting that replenishing the ESL alone may not be enough to prevent loss of filtration barrier integrity in kidney disease. Our data demonstrate that ESL degradation and remodeling was linked to endothelial dysfunction, which occurred early in disease development. Hence, strategies to prevent endothelial dysfunction may be more effective, as demonstrated with VEGF-A165b treatment, which was shown to ameliorate diabetic nephropathy by reversing diabetes-induced damage to the GEC glycocalyx through phosphorylation of VEGF receptor 2 in GECs41.
Our study is first to demonstrate that the loss of ESL is associated with podocyte Edn1 mediating GAG degradation and turnover in GECs via EdnrA. MitoTEMPO was also shown to ameliorate loss of ESL in PodTgfbr1 mice and in adriamycin-induced FSGS, suggesting that increased GEC EdnrA signaling in these models is associated with downstream mitochondrial ROS as previously described42, 43. In contrast to our findings, one study suggested that the Edn-1 mediates effects through both EdnrA and EdnrB receptors on podocytes resulting in microalbuminuria in experimental DKD 22. The authors suggested that increased heparanase expression by podocytes is mediated via EdnrA in DKD21. However, we did not detect changes in heparanase expression by podocytes with active Tgfb signaling. Another study using the selective EdnrA receptor antagonist Atrasentan, restored the structural integrity of the ESL in GECs of diabetic ApoE knockout mice, and prevented albuminuria20. The authors proposed that the reduction of the endothelial glycocalyx in diabetic ApoE knockout mice was mediated by increased glomerular expression of heparanase driven by proinflammatory M1 macrophages secreting cathepsin-L20. We previously demonstrated that Edn1 effects though GEC EdnrA in DKD and in experimental FSGS are crucial for GECs dysfunction14, 15. Here we show that podocyte-GEC crosstalk via Edn1-EdnrA drives GEC injury, ESL loss and early albuminuria, possibly through increased mitochondrial ROS. Our studies need to be validated in other models and in human disease, although they may also highlight a potential mechanism for the proven renoprotective activities of EdnrA inhibitors in FSGS44. Also, a better understanding of the context in which alteration of mitochondrial function, ROS overproduction, and its effects on ESL degradation enzyme activity in GECs might lead to greater insights into the mechanisms of the pathogenesis of CKD.
Maintenance of glomerular homeostasis, function and structure involves complex cell-cell interactions within and between glomerular compartments45–47. In response to injury, these interactions can spread deleterious signals across glomerular compartments48–50. Here we demonstrate that pathologic crosstalk between activated podocytes and GECs during early stages of glomerular disease involves Edn1/EdnrA interaction on GECs, increased mitochondrial ROS and activation of ESL degradation/remodeling may underlie early glomerular permeability suggesting an unprecedented opportunity to explore potential actionable targets in GECs for CKD.
Methods
Animals Studies
PodTgfbrI mice14 (FVB background) were fed regular food or Doxycycline chow (2000ppm) in regular AIN-76A pellets (Research Diets, NJ). BALB/c mice were injected with adriamycin (10 mg/kg; Sigma-Aldrich) or saline (controls) in a tail vein, and sacrificed 6 days post injection 14, 25. Mice were given 2 daily 2ml intraperitoneal injections of an isotonic solution (69.4mM glucose, 77mM NaCl) to prevent weight loss. Weight was monitored daily. BQ-123 (0.1nM/kg/day; Sigma-Aldrich), MitoTEMPO (1mg/kg/day; Enzo Life Sciences International), or saline were delivered by subcutaneous Alzet miniosmotic pumps (model-2002; Palo Alto). All animal protocols and procedures were approved by IACUC at The Icahn School of Medicine at Mount Sinai.
Urinary albumin and creatinine were measured using mouse albumin-specific ELISA and creatinine companion kits (Exocell Laboratories, PA).
Serum creatinine and urine 8-oxodG relative to urine creatinine were measured by HPLC as described in51 and52,14 respectively.
Microscopy
Periodic acid-Schiff (PAS):
was performed on PFA perfused paraffin embedded kidney sections using standard protocols.
Immunofluorescence:
was performed on frozen 4um OCT-embedded kidneys. Images were taken with Zeiss Axioplan2 with a Q-imaging MP3.3 RTV camera running QED capture software.
Scanning and transmission electron microscopy:
was performed on kidney cortex fixed in Karnovsky fixate as described in15. Images were examined and scored in a blinded fashion by 2 trained individuals.
Assessment of the ESL
Intralipids:
Intralipid® solution (200 mg/ml; Baxter Healthcare) was prepared by discarding the top lipid layer of the solution after overnight incubation at 4°C. An enriched floating fraction of lipid droplets was obtained after centrifugation at 3000 g for 10 min lipid droplets were administrated as described in4, 53. Lipids were allowed to mix in the circulation for 10 min, the left renal artery and vein were clamped and the kidney was subsequently fixed by subcapsular injection of Karnovsky’s fixative (2.5% paraformaldehyde and 2% glutaraldehyde in 0.05 M sodium-cacadylate buffer, pH 7.2)54. Sections were examined in a Leo 912AB Omega electron microscope (Leo Electron Microscopy, Cambridge, UK). Micrographs of glomerular capillaries at a magnification of 8000 were obtained from controls and treated mice giving a total of 254 glomerular capillaries for measurements. For each micrograph, the distance between the lipid droplet and the endothelial cell membrane surface was measured up to 300 nm from the endothelium using EsiVision Pro (Soft Imagine System, Munster, Germany).
High-resolution elastography via nanoindentation:
Using an Asylum MFP-3D BIO Atomic Force Microscope (AFM) (Asylum Research, CA) at the Icahn School of Medicine at Mount Sinai AFM/Confocal Core, measurements were conducted as described55. Plated mGECs were incubated at 37 °C with 5% CO 2 until they were secured to the vibrationally and temperature controlled (37 °C) AFM stage. AFM m easurements on live mGECs were conducted in situ (i.e., control or treated with crosstalk factors but NOT fixatives or staining molecules which may alter the ESL’s fragile structure56) using a small TR400PB silicon nitride AFM probe (Asylum Research, CA). Measurement parameters for AFM indentations were controlled via Igor Pro 6.3 software (Wavemetric, Inc.). The TR400PB is a gold alloy coated pyramidal cantilever (nominal spring constant = 0.09 N/m) that features a nominal tip half angle of 39.5° (25º – 45º). To a void substrate effects, cell indentations were limited to a maximum indentation depth of 1,500 nm. Indentations occurred at 1 Hz with a probe retraction trigger of 50 nm (i.e., the AFM probe consistently retracted once it deflected 50 nm due to the indentation response from the cell, Supplemental Figure 4). Before each experiment, the cantilever was calibrated using the thermal noise method. To account for ESL heterogeneity across a cell, an array of indentations was performed on each cell with 16 equally-spaced indentations that were performed over a 5μm2 perinuclear area of mGECs. From Igor Pro, raw indentation curve data were exported for each measurement and post-processed using custom MATLAB code. Using the raw mGEC measurement data as input, this MATLAB code returned cell membrane contact-point (using optimal transition method shown in27), classical fitted or “apparent” cell modulus, and a pointwise elastic modulus curve (i.e. stiffness vs indentation depth)56. To insure data integrity, every MATLAB processed curve was inspected by an expert user in case the AFM probe was interrupted by debris during indentation. Although we are indenting deep enough to measure the classical bulk cell stiffness, the subtle nature of the ESL requires a deeper look into the AFM probe interactions throughout the initiation phase of the indentation, thus the pointwise elastic modulus curve is the appropriate medium to quantitively assess these changes. We obtained the peri-contact probe interactions, which require signal deciphering via MATLAB. The metric returned from this analysis, which was used to evaluate ESL, was called ED50. ED50 is taken from the pointwise modulus curve (Supplementary Figure S4D, gray highlight in lower right panel). Using a consistent interval of 0–50 nm into the cell, ED50 represents the initial force response curve that is principally dominated by the surface interactions and not the bulk cellular modulus. The ESL, along with the cortical actin network, compressed during early indentation manifests itself as an immediate increase of the pointwise modulus curve (See Supplementary Figure S4B and S4D). With increasing indentation depth, this initial reactive increase in modulus equilibrates towards the underlying bulk modulus with little crosstalk between the two layers. We have recently shown that pointwise modulus calculation can computationally dissect the influence of individual volumes in a multi-layered structure with distinct mechanical properties57. The rate at which this pointwise modulus curve equilibrates to the bulk cell stiffness is dependent on the amount of initial contact layer (i.e., ESL) interaction for the given indentation.
Podocyte foot process measurements
Micrographs of glomerular capillaries were used for calculations of number of podocyte feet over a measured length of the basement membrane in TEM images in a blinded fashion by two trained individuals. Podocyte feet surrounding capillaries from three mice in each group were counted resulting in at least 700 feet per group. The distance was measured using ImageJ. Average of feet/distance was calculated by dividing the total number of feet for each vessel with the length of the basement membrane.
Glomerular endothelial cell isolation
Enhanced Yellow Fluorescent Protein (EYFP) positive GECs16,27 from controls and 4d Dox treated PodTgfbrI-Flk1 mice were isolated by FACS as described58. 10,000–30,000 EYFP positive GECs/mouse (Gated P4; Figure 2C) were collected and pooled for RNA-sequencing. EYFP negative cells (Gated P5; Figure 2C) were also collected and gene expression was assessed by RT-PCR.
RNASeq experiment and data analysis
Total RNA was isolated using TRIzol reagent (Ambion,Life Technologies). Nucleic acid integrity was measured using a bioanalyzer and sample RIN scores ranged between 9.9–10. After Ribosomal-RNA depletion the libraries were sequenced using Illumina HiSeq-4000, generating 100nt paired-end reads resulting in 50million reads/sample at the Mount Sinai’s Genomics Core facility. The good quality reads were firstly aligned to several human reference databases including mm10 mouse genome, exon, splicing junction segment and contamination database including ribosome and mitochondria sequences using BWA alignment algorithm59. After filtering reads mapped to contamination database, the reads that are uniquely aligned to the exon and splicing-junction segments with a maximal two mis-matches for each transcript were then counted as expression level for corresponding transcript. The read counts were log2 transformed and normalized at an equal global median value to compare transcription level across samples. The differential analysis by LIMMA (www.bioconductor.org) was performed to identify significantly dysregulated at adjusted FDR P value <0.05 which were then subjected to Gene Ontology function and Canonical pathway enrichment analysis by Fisher exact test.
Cell culture studies
The generation of conditionally immortalized PodTgfbr1 podocytes, is described in14. PodTgfbr1 podocytes and conditionally immortalized murine glomerular endothelial cells (mGEC) were maintained in RPMI-1640 containing 10% FCS under either permissive condition (33°C with INF-γ 10 units/ml), or non-permissive condition (37°C without INF-γ). Culture supernatants SN from untreated PodTgfbr1 podocytes (CtrlSN) and SN from DOX treated PodTgfbr1 podocytes (DoxSN) were collected after 48hr for co-culture studies. DOX treatment of PodTgfbr1 podocytes has been shown to activate Smad-signaling associated with increased Edn1 peptide14. Fresh CtrlSN and DoxSN were applied to mGECs for up to 48hr.
FACS
Cell surface Isolectin B4 was detected with GS-IB4 AlexaFluor488 conjugate (Invitrogen). Heparan Sulfate (HS) was detected with anti-Human D-Heparan Sulfate (clone F69–3G10; Amsbio) as described60, and subsequent conjugated anti-goat antibody (Molecular Probes) using a FACSCanto (BD Biosciences) and FlowJo software (Tree Star, Inc.).
RT-PCR
Total RNA was prepared from glomeruli and cell lysates using Qiagen RNeasy mini columns (Qiagen, CA) and then reverse transcribed with Superscript-II reverse transcriptase (Invitrogen, CA). cDNA amplification was performed in an ABI-Prism 7900HYT Sequence Detection System and evaluated using S.D.S 2.0 software (Applied Biosystems, CA). Normalization to beta-actin gene.
Statistics
D’Agostino-Pearsons test was used to test normal distribution of the data. Independent t-test or one-way ANOVA was used for normally distributed data and Kruskal-Wallis one way analysis was used as a nonparametric test for non-normally distributed data. P<0.05 was considered significant. Two-way ANOVA with a post hoc Tukey test was used to examine ACR, serum creatinine and gene expression of different treatments, and their interaction over time (using Prism 7 GraphPad). Samples with multiple non-independent measurements per condition were compared using linear mixed models, where different samples were modeled as fixed effects and repeated measures were modeled as random effects61 (using MATLAB). Differentially expressed genes in the RNAseq experiments were evaluated for significance (FDR adjusted P<0.05) using limma test. ED50 values per cell were pooled together and statistically evaluated based on all values. Before pooling groups across multiple experimental days, a 1-way ANOVA with Tukey-Kramer post hoc correction was applied to confirm same cell conditions did not vary between dishes. ED50 values reported are the mean of all pooled values also using a one-way ANOVA with a Tukey-Kramer post hoc for multiple comparisons between cell treatments. P<0.01 was considered significant.
Supplementary Material
Supplemental Figure S1 Histopathology stain (PAS) of PodTbrI mice
Supplemental Figure S2 Transcriptomic assessment of GECs isolated from PodTgfbr1-Flk1 mice after Tgfbr1 signaling induction in podocytes
Supplemental Figure S3 Glomerular expression of Edn1 receptors
Supplemental Figure S4 mRNA expression for Edn1 in mGECs
Supplemental Figure S5 ESL measured by atomic force microscopy (AFM)
Translational Statement.
Our findings provide compelling evidence that podocyte activation and pathologic crosstalk with endothelial cells via endothelin-1 results in dysfunction and loss of endothelial surface layer (glycocalyx), and this event may underlie early albuminuria early glomerular disease.
Acknowledgements and financial disclosures
This work was supported by National Institutes of Health grant R01DK097253 (to I.D.), The National Kidney Foundation Young Investigator Grant (to I.D.) and Swedish Medical Research Council 9898 (to B.H.). The authors thank Michael M. Espino for assistance with heparan sulfate detection by FACS and Dr. Emilia Bagiella for her guidance with the statistical analysis.
Footnotes
Disclosures
B.H. is at present paid employee of Novartis and holds an unpaid professorship at the University of Gothenburg. The author has declared no other conflict of interest exists. K.E., R.W., E.A., Z.Y., W.Z., F.J., L.Y. C.H. and I.D. have no conflicts of interests.
Supplementary Material
Supplementary information is available at Kidney International’s website’ at the end of the section
Publisher's Disclaimer: This is a PDF file of an unedited manuscript that has been accepted for publication. As a service to our customers we are providing this early version of the manuscript. The manuscript will undergo copyediting, typesetting, and review of the resulting proof before it is published in its final citable form. Please note that during the production process errors may be discovered which could affect the content, and all legal disclaimers that apply to the journal pertain.
REFERENCES
- 1.Stehouwer CD, Smulders YM. Microalbuminuria and risk for cardiovascular disease: Analysis of potential mechanisms. J Am Soc Nephrol 2006; 17: 2106–2111. [DOI] [PubMed] [Google Scholar]
- 2.Fioretto P, Stehouwer CD, Mauer M, et al. Heterogeneous nature of microalbuminuria in NIDDM: studies of endothelial function and renal structure. Diabetologia 1998; 41: 233236. [DOI] [PubMed] [Google Scholar]
- 3.Haraldsson B, Nystrom J. The glomerular endothelium: new insights on function and structure. Curr Opin Nephrol Hypertens 2012; 21: 258–263. [DOI] [PubMed] [Google Scholar]
- 4.Jeansson M, Bjorck K, Tenstad O, et al. Adriamycin alters glomerular endothelium to induce proteinuria. J Am Soc Nephrol 2009; 20: 114–122. [DOI] [PMC free article] [PubMed] [Google Scholar]
- 5.Singh A, Friden V, Dasgupta I, et al. High glucose causes dysfunction of the human glomerular endothelial glycocalyx. Am J Physiol Renal Physiol 2011; 300: F40–48. [DOI] [PMC free article] [PubMed] [Google Scholar]
- 6.Satchell S The role of the glomerular endothelium in albumin handling. Nat Rev Nephrol 2013; 9: 717–725. [DOI] [PubMed] [Google Scholar]
- 7.Rabelink TJ, de Zeeuw D. The glycocalyx--linking albuminuria with renal and cardiovascular disease. Nat Rev Nephrol 2015; 11: 667–676. [DOI] [PubMed] [Google Scholar]
- 8.Okuda S, Languino LR, Ruoslahti E, et al. Elevated expression of transforming growth factor-beta and proteoglycan production in experimental glomerulonephritis. Possible role in expansion of the mesangial extracellular matrix. J Clin Invest 1990; 86: 453–462. [DOI] [PMC free article] [PubMed] [Google Scholar]
- 9.Yamamoto T, Nakamura T, Noble NA, et al. Expression of transforming growth factor beta is elevated in human and experimental diabetic nephropathy. ProcNatlAcadSciUSA 1993; 90: 1814–1818. [DOI] [PMC free article] [PubMed] [Google Scholar]
- 10.Kim JH, Kim BK, Moon KC, et al. Activation of the TGF-beta/Smad signaling pathway in focal segmental glomerulosclerosis. Kidney Int 2003; 64: 1715–1721. [DOI] [PubMed] [Google Scholar]
- 11.Casalena G, Bottinger E, Daehn I. TGFbeta-Induced Actin Cytoskeleton Rearrangement in Podocytes Is Associated with Compensatory Adaptation of Mitochondrial Energy Metabolism. Nephron 2015; 131: 278–284. [DOI] [PMC free article] [PubMed] [Google Scholar]
- 12.Schiffer M, Bitzer M, Roberts IS, et al. Apoptosis in podocytes induced by TGF-beta and Smad7. JClinInvest 2001; 108: 807–816. [DOI] [PMC free article] [PubMed] [Google Scholar]
- 13.Schiffer M, Mundel P, Shaw AS, et al. A novel role for the adaptor molecule CD2associated protein in TGF-beta-induced apoptosis. JBiolChem 2004: 37004–37012. [DOI] [PubMed] [Google Scholar]
- 14.Daehn I, Casalena G, Zhang T, et al. Endothelial mitochondrial oxidative stress determines podocyte depletion in segmental glomerulosclerosis. J Clin Invest 2014; 124: 1608–1621. [DOI] [PMC free article] [PubMed] [Google Scholar]
- 15.Qi H, Casalena G, Shi S, et al. Glomerular Endothelial Mitochondrial Dysfunction Is Essential and Characteristic of Diabetic Kidney Disease Susceptibility. Diabetes 2017; 66: 763–778. [DOI] [PMC free article] [PubMed] [Google Scholar]
- 16.Fraser ST, Hadjantonakis AK, Sahr KE, et al. Using a histone yellow fluorescent protein fusion for tagging and tracking endothelial cells in ES cells and mice. Genesis 2005; 42: 162–171. [DOI] [PMC free article] [PubMed] [Google Scholar]
- 17.Fan Y, Li X, Xiao W, et al. BAMBI elimination enhances alternative TGF-beta signaling and glomerular dysfunction in diabetic mice. Diabetes 2015. [DOI] [PMC free article] [PubMed] [Google Scholar]
- 18.Friden V, Oveland E, Tenstad O, et al. The glomerular endothelial cell coat is essential for glomerular filtration. Kidney Int 2011; 79: 1322–1330. [DOI] [PubMed] [Google Scholar]
- 19.Sieve I, Munster-Kuhnel AK, Hilfiker-Kleiner D. Regulation and function of endothelial glycocalyx layer in vascular diseases. Vascul Pharmacol 2018; 100: 26–33. [DOI] [PubMed] [Google Scholar]
- 20.Boels MG, Avramut MC, Koudijs A, et al. Atrasentan Reduces Albuminuria by Restoring the Glomerular Endothelial Glycocalyx Barrier in Diabetic Nephropathy. Diabetes 2016; 65: 2429–2439. [DOI] [PubMed] [Google Scholar]
- 21.Garsen M, Lenoir O, Rops AL, et al. Endothelin-1 Induces Proteinuria by HeparanaseMediated Disruption of the Glomerular Glycocalyx. J Am Soc Nephrol 2016. [DOI] [PMC free article] [PubMed] [Google Scholar]
- 22.Lenoir O, Milon M, Virsolvy A, et al. Direct action of endothelin-1 on podocytes promotes diabetic glomerulosclerosis. J Am Soc Nephrol 2014; 25: 1050–1062. [DOI] [PMC free article] [PubMed] [Google Scholar]
- 23.Wendel M, Knels L, Kummer W, et al. Distribution of endothelin receptor subtypes ETA and ETB in the rat kidney. J Histochem Cytochem 2006; 54: 1193–1203. [DOI] [PubMed] [Google Scholar]
- 24.Eguchi S, Hirata Y, Ihara M, et al. A novel ETA antagonist (BQ-123) inhibits endothelin-1induced phosphoinositide breakdown and DNA synthesis in rat vascular smooth muscle cells. FEBS Lett 1992; 302: 243–246. [DOI] [PubMed] [Google Scholar]
- 25.Zheng Z, Schmidt-Ott KM, Chua S, et al. A Mendelian locus on chromosome 16 determines susceptibility to doxorubicin nephropathy in the mouse. Proc Natl Acad Sci U S A 2005; 102: 2502–2507. [DOI] [PMC free article] [PubMed] [Google Scholar]
- 26.Akis N, Madaio MP. Isolation, culture, and characterization of endothelial cells from mouse glomeruli. Kidney Int 2004; 65: 2223–2227. [DOI] [PubMed] [Google Scholar]
- 27.Azeloglu EU, Costa KD. Atomic force microscopy in mechanobiology: measuring microelastic heterogeneity of living cells. Methods Mol Biol 2011; 736: 303–329. [DOI] [PubMed] [Google Scholar]
- 28.Wiesinger A, Peters W, Chappell D, et al. Nanomechanics of the endothelial glycocalyx in experimental sepsis. PLoS One 2013; 8: e80905. [DOI] [PMC free article] [PubMed] [Google Scholar]
- 29.Garsen M, Rops AL, Rabelink TJ, et al. The role of heparanase and the endothelial glycocalyx in the development of proteinuria. Nephrol Dial Transplant 2014; 29: 49–55. [DOI] [PubMed] [Google Scholar]
- 30.Masum MA, Ichii O, Elewa YHA, et al. Modified scanning electron microscopy reveals pathological crosstalk between endothelial cells and podocytes in a murine model of membranoproliferative glomerulonephritis. Scientific reports 2018; 8. [DOI] [PMC free article] [PubMed] [Google Scholar]
- 31.Ballermann BJ. Contribution of the endothelium to the glomerular permselectivity barrier in health and disease. Nephron Physiol 2007; 106: p19–25. [DOI] [PubMed] [Google Scholar]
- 32.Fogo AB, Kon V. The glomerulus--a view from the inside--the endothelial cell. The international journal of biochemistry & cell biology 2010; 42: 1388–1397. [DOI] [PubMed] [Google Scholar]
- 33.Nieuwdorp M, van Haeften TW, Gouverneur MC, et al. Loss of endothelial glycocalyx during acute hyperglycemia coincides with endothelial dysfunction and coagulation activation in vivo. Diabetes 2006; 55: 480–486. [DOI] [PubMed] [Google Scholar]
- 34.Salmito FT, de Oliveira Neves FM, Meneses GC, et al. Glycocalyx injury in adults with nephrotic syndrome: Association with endothelial function. Clin Chim Acta 2015; 447: 5558. [DOI] [PubMed] [Google Scholar]
- 35.Padberg JS, Wiesinger A, di Marco GS, et al. Damage of the endothelial glycocalyx in chronic kidney disease. Atherosclerosis 2014; 234: 335–343. [DOI] [PubMed] [Google Scholar]
- 36.Dane M, van den Berg B, Rabelink T. The endothelial glycocalyx: scratching the surface for cardiovascular disease in kidney failure. Atherosclerosis 2014; 235: 56–57. [DOI] [PubMed] [Google Scholar]
- 37.Muller-Deile J, Gellrich F, Schenk H, et al. Overexpression of TGF-beta Inducible microRNA143 in Zebrafish Leads to Impairment of the Glomerular Filtration Barrier by Targeting Proteoglycans. Cellular physiology and biochemistry : international journal of experimental cellular physiology, biochemistry, and pharmacology 2016; 40: 819–830. [DOI] [PubMed] [Google Scholar]
- 38.Song JW, Zullo JA, Liveris D, et al. Therapeutic Restoration of Endothelial Glycocalyx in Sepsis. J Pharmacol Exp Ther 2017; 361: 115–121. [DOI] [PMC free article] [PubMed] [Google Scholar]
- 39.Gambaro G, Kinalska I, Oksa A, et al. Oral sulodexide reduces albuminuria in microalbuminuric and macroalbuminuric type 1 and type 2 diabetic patients: the Di.N.A.S. randomized trial. J Am Soc Nephrol 2002; 13: 1615–1625. [DOI] [PubMed] [Google Scholar]
- 40.Lewis EJ, Lewis JB, Greene T, et al. Sulodexide for kidney protection in type 2 diabetes patients with microalbuminuria: a randomized controlled trial. Am J Kidney Dis 2011; 58: 729–736. [DOI] [PubMed] [Google Scholar]
- 41.Oltean S, Qiu Y, Ferguson JK, et al. Vascular Endothelial Growth Factor-A165b Is Protective and Restores Endothelial Glycocalyx in Diabetic Nephropathy. J Am Soc Nephrol 2015; 26: 1889–1904. [DOI] [PMC free article] [PubMed] [Google Scholar]
- 42.Callera GE, Tostes RC, Yogi A, et al. Endothelin-1-induced oxidative stress in DOCA-salt hypertension involves NADPH-oxidase-independent mechanisms. Clin Sci (Lond) 2006; 110: 243–253. [DOI] [PubMed] [Google Scholar]
- 43.Deng W, Baki L, Baumgarten CM. Endothelin signalling regulates volume-sensitive Cl- current via NADPH oxidase and mitochondrial reactive oxygen species. Cardiovasc Res 2010; 88: 93–100. [DOI] [PMC free article] [PubMed] [Google Scholar]
- 44.Trachtman H, Nelson P, Adler S, et al. DUET: A Phase 2 Study Evaluating the Efficacy and Safety of Sparsentan in Patients with FSGS. J Am Soc Nephrol 2018; 29: 2745–2754. [DOI] [PMC free article] [PubMed] [Google Scholar]
- 45.Sison K, Eremina V, Baelde H, et al. Glomerular structure and function require paracrine, not autocrine, VEGF-VEGFR-2 signaling. J Am Soc Nephrol 2010; 21: 1691–1701. [DOI] [PMC free article] [PubMed] [Google Scholar]
- 46.Jeansson M, Gawlik A, Anderson G, et al. Angiopoietin-1 is essential in mouse vasculature during development and in response to injury. J Clin Invest 2011; 121: 2278–2289. [DOI] [PMC free article] [PubMed] [Google Scholar]
- 47.Schlondorff D, Banas B. The mesangial cell revisited: no cell is an island. J Am Soc Nephrol 2009; 20: 1179–1187. [DOI] [PubMed] [Google Scholar]
- 48.Ebefors K, Nystrom J . New insights into crosstalk in the kidney. Curr Opin Nephrol Hypertens 2017; 26: 143–147. [DOI] [PubMed] [Google Scholar]
- 49.Dimke H, Maezawa Y, Quaggin SE. Crosstalk in glomerular injury and repair. Curr Opin Nephrol Hypertens 2015; 24: 231–238. [DOI] [PMC free article] [PubMed] [Google Scholar]
- 50.Daehn IS. Glomerular Endothelial Cells Stress and Cross-Talk With Podocytes in the Development of Diabetic Kidney Disease. Frontiers in medicine 2018; 5: 76. [DOI] [PMC free article] [PubMed] [Google Scholar]
- 51.Yuen PS, Dunn SR, Miyaji T, et al. A Simplified Method for HPLC Determination of Creatinine in Mouse Serum. AmJPhysiol Renal Physiol 2004. [DOI] [PubMed] [Google Scholar]
- 52.Germadnik D, Pilger A, Rudiger HW. Assay for the determination of urinary 8-hydroxy-2’deoxyguanosine by high-performance liquid chromatography with electrochemical detection. J Chromatogr B Biomed Sci Appl 1997; 689: 399–403. [DOI] [PubMed] [Google Scholar]
- 53.Hjalmarsson C, Johansson BR, Haraldsson B. Electron microscopic evaluation of the endothelial surface layer of glomerular capillaries. Microvasc Res 2004; 67: 9–17. [DOI] [PubMed] [Google Scholar]
- 54.Jeansson M, Haraldsson B. Glomerular size and charge selectivity in the mouse after exposure to glucosaminoglycan-degrading enzymes. J Am Soc Nephrol 2003; 14: 17561765. [DOI] [PubMed] [Google Scholar]
- 55.Azeloglu EU, Costa KD. Cross-bridge cycling gives rise to spatiotemporal heterogeneity of dynamic subcellular mechanics in cardiac myocytes probed with atomic force microscopy. Am J Physiol Heart Circ Physiol 2010; 298: H853–860. [DOI] [PubMed] [Google Scholar]
- 56.Costa KD. Imaging and probing cell mechanical properties with the atomic force microscope. Methods Mol Biol 2006; 319: 331–361. [DOI] [PubMed] [Google Scholar]
- 57.Lee JJ, Rao S, Kaushik G, et al. Dehomogenized Elastic Properties of Heterogeneous Layered Materials in AFM Indentation Experiments. Biophysical journal 2018; 114: 2717–2731. [DOI] [PMC free article] [PubMed] [Google Scholar]
- 58.Fu J, Wei C, Zhang W, et al. Gene expression profiles of glomerular endothelial cells support their role in the glomerulopathy of diabetic mice. Kidney Int 2018; 94: 326–345. [DOI] [PMC free article] [PubMed] [Google Scholar]
- 59.Li H, Durbin R. Fast and accurate short read alignment with Burrows-Wheeler transform. Bioinformatics 2009; 25: 1754–1760. [DOI] [PMC free article] [PubMed] [Google Scholar]
- 60.Osterholm C, Barczyk MM, Busse M, et al. Mutation in the heparan sulfate biosynthesis enzyme EXT1 influences growth factor signaling and fibroblast interactions with the extracellular matrix. J Biol Chem 2009; 284: 34935–34943. [DOI] [PMC free article] [PubMed] [Google Scholar]
- 61.Brown H, Prescott R. Applied Mixed Models in Medicine, 3rd Edition. Stat Pract 2015: 1-+. [Google Scholar]
Associated Data
This section collects any data citations, data availability statements, or supplementary materials included in this article.
Supplementary Materials
Supplemental Figure S1 Histopathology stain (PAS) of PodTbrI mice
Supplemental Figure S2 Transcriptomic assessment of GECs isolated from PodTgfbr1-Flk1 mice after Tgfbr1 signaling induction in podocytes
Supplemental Figure S3 Glomerular expression of Edn1 receptors
Supplemental Figure S4 mRNA expression for Edn1 in mGECs
Supplemental Figure S5 ESL measured by atomic force microscopy (AFM)


